SEMICONDUCTOR INSIGHT
MARKET RESEARCH REPORT

Photoresists Market

2026 to 2034
MARKET INTELLIGENCE
ACROSS KEY REGIONS
2026 EDITION
SEMICONDUCTOR EQUIPMENT & MATERIALS Semiconductor Market Research

Photoresists Market

Technology Adoption, AI Integration and Industry Outlook (2026-2034)

◷
UPDATED 18 September 2026
▤
REPORT LENGTH Detailed Report
▣
REPORT CODE a148e29706af
▯
FORMATS PDF

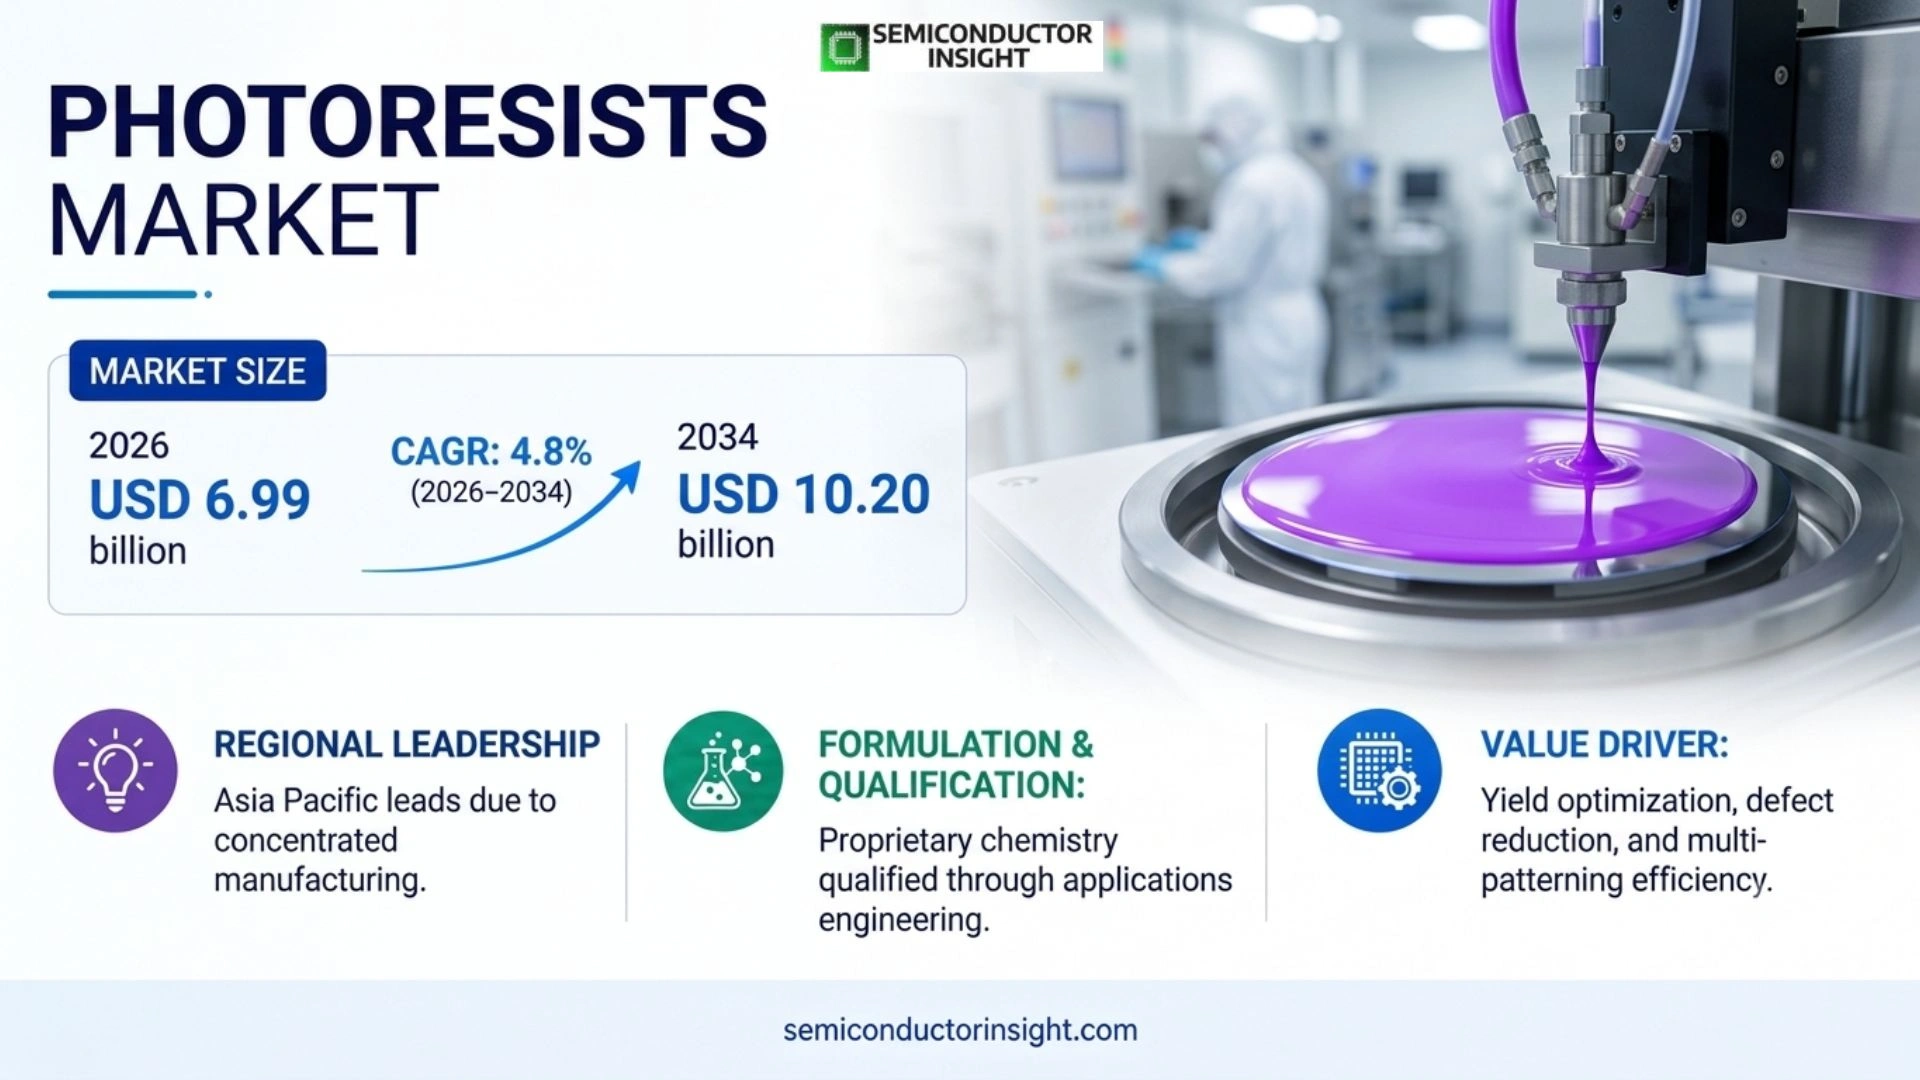
Photoresists Market wa  reaches USD 10.20 billion by 2034, equal to an anchor-implied 4.8% CAGR for 2026–2034. The 2026 series value is USD 6.99 billion. Asia Pacific is the largest market, reflecting the concentration of semiconductor, display and PCB manufacturing.

Get the sample PDF with study scope, segmentation and methodology details.

Key Statistics

2025 Market Size
USD 6.67 billion
2034 Projected Size
USD 10.20 billion
CAGR (2026–2034)
4.8%
Largest Market in 2025
Asia Pacific

Key Takeaways

  • Semiconductor photoresists are the largest application base because lithography is repeated across many wafer-fabrication layers and advanced nodes require tighter materials control.
  • EUV and metal-oxide resist platforms are the fastest-moving technology area as advanced logic and DRAM migrate to higher EUV exposure intensity and High-NA process development.
  • Asia Pacific remains the largest demand center, anchored by wafer-fabrication clusters in China, Taiwan, South Korea and Japan and by Japan’s deep specialty-chemical supplier base.
  • Fab investment is the core demand driver: SEMI expects record 300 mm front-end equipment spending in 2026, increasing the installed process base that consumes lithography materials.
  • Qualification is the central market barrier: resist changes can affect critical dimension, line-edge roughness, defectivity and yield, so material substitution is slow even when nominal chemistry is available.
  • Supply-chain regionalization is creating openings for local KrF and ArF suppliers while the most advanced EUV formulations remain concentrated among a small group of highly qualified vendors.

Photoresists Market Overview

Photoresists Market was valued at USD 6.67 billion in 2025. Using the published 2025 and 2034 size anchors, the market reaches USD 10.20 billion by 2034, equal to an anchor-implied 4.8% CAGR for 2026–2034. The 2026 series value is USD 6.99 billion. Asia Pacific is the largest market, reflecting the concentration of semiconductor, display and PCB manufacturing.

Base year: 2025 · Estimated year: 2026 · Forecast period: 2026–2034 · Values in USD

Photoresists are light-sensitive formulation systems used to create patterned masks on wafers, glass panels, printed circuit boards and related substrates. The commercial market includes positive and negative imaging systems and wavelength-specific products spanning g/i-line, KrF, ArF dry, ArF immersion and EUV exposure. Semiconductor-grade products require extremely low metals and particle contamination, tightly controlled dissolution behavior and stable critical-dimension performance across a process window.

The market is not a commodity chemical category. A resist is qualified together with exposure conditions, track recipes, underlayers, developers and etch integration. That makes performance at the customer line more important than list price alone. In advanced logic and memory, the technical frontier is moving toward lower stochastic defectivity, improved sensitivity-resolution trade-offs, lower line-edge roughness and compatibility with High-NA EUV. In mature nodes, supply reliability, cost and local technical support remain more important purchasing factors.

Demand is tied to wafer starts, lithography layer count, display panel production and high-density PCB fabrication. SEMI’s Q2 2026 300 mm outlook expects front-end equipment spending to reach a record USD 142 billion in 2026 and installed 300 mm capacity to rise 7% in the year, reinforcing the installed manufacturing base that consumes photoresist and related process chemicals.

Segment Analysis: By Type

By type, the market is segmented into EUV photoresist, ArFi photoresist, ArF dry photoresist, KrF photoresist, g/i-line photoresist and other formulations. KrF and ArF products retain broad volume exposure across installed fabs, while EUV is the highest-intensity innovation segment because leading-edge logic and DRAM increasingly depend on shorter-wavelength patterning.

Type Technical role Market position
EUV Photoresist Resist systems for 13.5 nm EUV exposure, including chemically amplified and metal-oxide approaches. The fastest-changing segment. High-NA readiness, stochastic defect control and dose efficiency are key differentiation points. ASML’s 2026 High-NA production milestone and JSR/Inpria collaboration activity show the technology moving from R&D toward manufacturing integration.
ArFi Photoresist 193 nm immersion lithography for advanced and mainstream patterning layers. A major value segment with stringent immersion compatibility and defectivity requirements. Multi-patterning keeps ArFi relevant even as EUV takes more leading-edge layers.
ArF Dry Photoresist 193 nm dry lithography for less demanding dimensions and selected process layers. Mature but durable demand across logic, memory, specialty devices and regional fabs. Competition is broader than in EUV, placing greater weight on cost, local supply and process support.
KrF Photoresist 248 nm lithography used extensively in mature nodes and many non-leading-edge layers. Large installed-base demand supported by power, analog, display-driver, MEMS and mature-node expansion. Localization initiatives in China create new supplier opportunities.
g/i-Line Photoresist 365/436 nm lithography used for mature semiconductor, MEMS, packaging and industrial microfabrication. A stable, application-diverse segment with lower technical barriers but strong requirements in thick-film behavior, adhesion and process robustness.
Others Specialty thick-film, packaging, nanoimprint and novel resist systems. A heterogeneous niche where application-specific performance can support premium pricing, particularly in advanced packaging, sensors and micro-optics.

Imaging mechanism and process-node mix

The report scope also separates positive and negative photoresists by imaging mechanism and groups demand by advanced, mid-range, mature and memory process categories. Positive-tone systems dominate many fine-pattern semiconductor processes because exposed regions become soluble during development, while negative-tone systems remain important where thickness, mechanical robustness or specialized pattern transfer is required. Process-node mix matters commercially because advanced-node material value per wafer is higher, but mature-node wafer volume and geographic expansion sustain large recurring demand for KrF, ArF and i-line products.

Segment Analysis: By Application

By application, the market is segmented into semiconductor photoresists, LCD photoresists and PCB photoresists. Semiconductor manufacturing is the largest application because lithography is repeated through front-end and selected back-end process flows, while PCB photoresists benefit from finer line/space requirements in high-density interconnect and IC-substrate production.

Application Demand characteristics
Semiconductor Photoresists The largest application. Demand follows wafer starts, process-layer count and node migration. Leading-edge logic and DRAM create the highest qualification intensity, while mature-node capacity additions sustain KrF, ArF and i-line consumption.
LCD Photoresists Used in TFT arrays, color-filter patterning and related display processes. Demand is concentrated in Asian panel-manufacturing clusters and is influenced by panel utilization, OLED transition and higher-resolution display architectures.
PCB Photoresists Dry-film and liquid imaging materials support conductor patterning and solder-mask processes. High-density interconnect, IC substrates, automotive electronics and AI-server boards push finer features and higher thermal reliability.

Photoresists Market Size

Regional Analysis

Asia Pacific is the largest photoresists market because the region combines the greatest concentration of wafer fabrication, memory production, display manufacturing and PCB capacity with the world’s deepest specialist photoresist supplier base. North America is expanding advanced-node demand through new logic and memory investments, while Europe is smaller but strategically important in R&D, specialty devices and advanced lithography collaboration.

How does regional demand differ across the photoresists market?

Regional demand is determined by the type of fabrication capacity rather than electronics consumption alone. Japan has a disproportionate role in high-purity materials and resist formulation. Taiwan and South Korea translate large leading-edge foundry and memory capacity into recurring advanced photoresist demand. China combines the largest 300 mm installed-capacity base with aggressive localization of mature-node materials. The United States is adding leading-edge manufacturing and R&D capacity, while Europe’s strength sits in research infrastructure, specialty semiconductor production and precision chemical development.

Region Position Growth outlook Demand profile What decides supplier selection
Asia Pacific Largest Strong High-volume fabs, memory, displays and PCBs Qualification record, local supply, purity, technical support and node coverage
North America Strategic growth market Strong in advanced nodes Leading-edge fab expansion and R&D Advanced-node qualification, secure supply, fab-side applications engineering
Europe Specialty / R&D stronghold Moderate R&D, power, automotive, MEMS and specialty devices Regulatory compliance, process specialization, collaboration with institutes and fabs
South America Small Selective PCB, electronics assembly and niche microfabrication Import economics, distributor support and availability
Middle East & Africa Emerging Project-led New semiconductor and electronics investment from a low base Supply reliability, technical partnerships and project qualification
Asia Pacific LARGEST MARKET

Why does Asia Pacific lead the photoresists market?

Asia Pacific leads because lithography-material consumption is concentrated where wafers, displays and high-density circuit boards are fabricated. SEMI expects China to retain the largest installed 300 mm capacity in 2026, while Taiwan, South Korea and Japan remain major foundry, memory and specialty-material centers. Japan also anchors several of the market’s most established photoresist suppliers.

Market positionLargest region
Growth outlookBroad-based
Demand profileFab and display concentrated
Access gateMulti-year process qualification
Country / market Position What drives demand
China Largest installed-capacity base Mature-node fab expansion, domestic materials localization and large PCB/display ecosystems create broad resist demand.
Japan Technology and supply leader Home to TOK, JSR, Shin-Etsu and other high-purity materials capabilities; advanced formulation and supply-chain depth are key strengths.
Taiwan Leading-edge foundry hub High wafer-start intensity and advanced-node manufacturing support EUV and ArF immersion consumption.
South Korea Memory and display hub DRAM, NAND and display production sustain advanced semiconductor and panel photoresist requirements.
300 mm investment – SEMI’s 2026 outlook tracks more than 400 300 mm fabs and lines and expects record front-end equipment spending, supporting continuing lithography-material consumption.
MOR commercialization – JSR states that metal-oxide resist is being positioned for advanced EUV manufacturing, while 2025–2026 cross-licensing agreements broaden the ecosystem around next-generation patterning.
Supplier localization – Regional supply security programs are increasing qualification activity for mature-node resists while leading-edge products remain concentrated among established suppliers.

Full report coverage includes additional country-level revenue, sales and forecast detail within the defined regional scope.

North America ADVANCED-NODE EXPANSION

What is driving photoresist demand in North America?

North American demand is being reshaped by leading-edge logic, memory and advanced-packaging investment. The commercial opportunity is smaller in installed wafer volume than Asia but materially higher in strategic value because new U.S. fabs require full qualification of advanced lithography materials and secure domestic or allied supply chains.

Market positionStrategic growth market
Growth outlookStrong advanced-node growth
Demand profileNew-fab and R&D led
Access gateFab-specific qualification
Country / market Position What drives demand
United States Primary regional market New logic and memory fabs, advanced packaging and semiconductor R&D expand the addressable material set.
Canada R&D / specialty University, photonics, MEMS and specialty semiconductor activity supports smaller-volume specialty resists.
Mexico Assembly-adjacent Electronics and PCB manufacturing create demand for industrial and board-level photoresist products.
High-NA deployment – ASML reported in July 2026 that High-NA EUV had entered high-volume manufacturing on selected Intel 18A product layers, raising the relevance of next-generation resist and process integration.
AI-driven fab plans – ASML’s 2025 results cited stronger medium-term customer capacity plans linked to AI demand, which supports future advanced lithography materials intensity.
Qualification economics – New fabs create a multi-year window for resist suppliers to win process-of-record positions before production ramps.

Full report coverage includes additional country-level revenue, sales and forecast detail within the defined regional scope.

Europe R&D AND SPECIALTY MATERIALS

What shapes the European photoresists market?

Europe combines advanced lithography R&D with automotive, power, MEMS, photonics and specialty semiconductor production. The region is less volume-driven than Asia; suppliers win through technical specialization, sustainability performance and close collaboration with research institutes and device manufacturers.

Market positionSpecialty / R&D stronghold
Growth outlookModerate
Demand profileR&D and specialty-fab led
Access gatePerformance plus regulatory compliance
Country / market Position What drives demand
Germany Specialty materials and devices Power electronics, MEMS, optics and industrial microfabrication support specialty and thick-film photoresists.
Netherlands Lithography ecosystem ASML and associated R&D activity make the country central to next-generation patterning development.
Belgium Advanced R&D imec’s pilot infrastructure supports sub-2 nm process research across EUV, metrology and materials.
France R&D and specialty fabs Semiconductor research and specialty-device manufacturing create targeted demand.
ASML-imec partnership – A five-year collaboration announced in 2025 incorporates 0.55 NA EUV, 0.33 NA EUV, DUV immersion and metrology into an advanced pilot line for sub-2 nm R&D.
TOK expansion – TOK agreed in 2025 to acquire Berlin-based micro resist technology, extending its specialty photoresist and nanoimprint-material footprint in Europe.
Sustainability pressure – Chemical formulation, solvent handling and emerging substance restrictions increasingly influence product-development decisions and customer qualification.

Full report coverage includes additional country-level revenue, sales and forecast detail within the defined regional scope.

South America SELECTIVE DEMAND

Where is photoresist demand concentrated in South America?

South American demand is concentrated in electronics manufacturing, printed circuit board processing, universities and specialty microfabrication rather than leading-edge wafer fabs. The market therefore favors established mature-process chemistries, distributor availability and technical service over frontier EUV capability.

Market positionSmall
Growth outlookSelective
Demand profilePCB and specialty
Access gateImport availability and support
Country / market Position What drives demand
Brazil Largest regional opportunity Electronics manufacturing, research institutes and PCB activity form the primary demand base.
Argentina Niche market Research and industrial microfabrication create smaller specialty demand.
Other markets Import-led Demand is project-based and commonly served through regional chemical distributors.
PCB exposure – Board fabrication and electronics assembly link regional photoresist demand more closely to industrial production than to advanced semiconductor node transitions.
Import dependence – Long lead times and small batch sizes increase the value of distributor stocking and application support.
Specialty opportunities – MEMS, sensors and university cleanrooms can support high-value niche formulations despite limited overall volume.

Full report coverage includes additional country-level revenue, sales and forecast detail within the defined regional scope.

Middle East & Africa EMERGING

Which Middle East and Africa markets offer the clearest opportunity?

The Middle East and Africa market starts from a small base but is gaining relevance through semiconductor investment plans, research facilities and electronics localization. Near-term demand is strongest for specialty, PCB and mature-process materials; advanced semiconductor photoresists become material only as announced fabrication projects reach process qualification and production.

Market positionEmerging
Growth outlookProject-led
Demand profileR&D and localization
Access gateProject timing and technical partnerships
Country / market Position What drives demand
Israel Established technology base Semiconductor design, R&D and fabrication activity supports the region’s most mature high-specification demand.
Saudi Arabia Investment-led Technology localization programs create longer-term opportunities tied to new electronics and semiconductor projects.
UAE Technology hub Research, data infrastructure and advanced-industry programs support specialty electronics demand.
South Africa Niche industrial base University, photonics, electronics and PCB activity support small-volume applications.
Qualification precedes volume – Photoresist revenue typically follows tool installation and process qualification rather than initial fab announcements.
Partnership model – New markets often require supplier-development partnerships, local chemical handling capabilities and application-engineering support.
Mature-node entry – Initial localization is more likely in established i-line, KrF and PCB chemistries than in EUV formulations.

Full report coverage includes additional country-level revenue, sales and forecast detail within the defined regional scope.

Key Photoresists Manufacturers and Competitive Landscape

Competition is concentrated at the high end because semiconductor photoresists must combine proprietary polymer and photoacid chemistry with ultra-high purity, lot consistency and years of customer qualification. TOKYO OHKA KOGYO, JSR and Shin-Etsu Chemical form the core Japanese technology group, while Fujifilm, Sumitomo Chemical, Dongjin Semichem, Merck and other specialists compete across semiconductor, display and PCB applications.

The market has two different competitive logics. In advanced semiconductor lithography, performance and yield risk dominate commercial decisions, making process-of-record positions sticky and supporting premium pricing. In mature-node and PCB applications, more suppliers can meet baseline specifications, so local availability, cost and service carry greater weight. This creates room for regional entrants without immediately displacing incumbents in the highest-specification layers.

Supplier R&D is increasingly ecosystem-based. JSR/Inpria’s agreements with Lam Research and Entegris center on metal-oxide resist, dry-resist integration and next-generation EUV patterning, while ASML and imec are expanding the High-NA development environment. These collaborations matter because the resist must be optimized together with exposure, underlayer, deposition, etch and metrology steps.

Portfolio breadth also matters. A supplier that supports i-line through EUV, plus packaging and ancillary materials, can participate across a fab’s full technology ladder. Specialist firms can still win where a particular resist thickness, substrate, optical property or nanoimprint requirement is outside the standard semiconductor process window.

Tier structure

Competitive tier Representative companies Strategic position
Tier 1 – advanced global suppliers TOKYO OHKA KOGYO, JSR, Shin-Etsu Chemical, Fujifilm, Sumitomo Chemical Broad wavelength coverage, advanced-node qualification, global fab support and deep chemistry R&D.
Tier 2 – application and regional specialists Dongjin Semichem, Merck KGaA, Asahi Kasei, Eternal Materials, Kolon Industries, Chang Chun Group, Taiyo Ink Strong positions in display, PCB, mature semiconductor, packaging or selected regional customer bases.
Tier 3 – emerging / localized suppliers Reform Technology, Jiangsu Nata Opto-electronic Material, Yoke Technology and other local specialists Focus on domestic qualification, mature-node substitution and localized supply resilience.

Key companies profiled

TOKYO OHKA KOGYO CO., LTD. (TOK); JSR Corporation; Shin-Etsu Chemical; Fujifilm Holdings Corporation; Sumitomo Chemical; Dongjin Semichem; Merck KGaA (AZ Electronics); Asahi Kasei Corporation; Eternal Materials; Kolon Industries; Chang Chun Group; Taiyo Ink Mfg; Reform Technology; Jiangsu Nata Opto-electronic Material; and Yoke Technology.

Photoresists Production Capacity Analysis

Photoresist capacity cannot be assessed only by reactor volume. The effective supply constraint is qualified capacity: purified raw materials, controlled polymer synthesis, filtration, filling, contamination control, analytical metrology and customer-approved production lines. A plant may have chemical throughput available yet still be unable to supply a leading-edge fab until its process and lot history are qualified.

Advanced production is concentrated in Japan, with additional capacity and technical operations in South Korea, Taiwan, China, North America and Europe. This geographic concentration creates two countervailing forces. Customers value established suppliers because consistency reduces yield risk, but governments and chipmakers also want more geographically diverse sources. The result is parallel investment in incumbent expansion and regional qualification of alternative materials.

SEMI’s record 300 mm equipment-spending outlook increases the strategic importance of materials capacity. As new fabs move from construction to tool installation and production, recurring chemical consumption rises. For suppliers, timing capacity additions to customer qualification is critical: capacity added too late misses design-in windows, while capacity added too early can carry low utilization because a qualified resist cannot be switched rapidly between customers.

Photoresists Market Dynamics: Drivers, Restraints and Opportunities

Photoresist demand grows with wafer starts, lithography intensity and tighter patterning requirements, but the market is constrained by long qualification cycles, chemical purity requirements and the cost of developing new formulations. The strongest commercial opportunities sit where a new process architecture changes material requirements: High-NA EUV, advanced packaging, finer PCB features and localized mature-node supply.

MARKET DRIVERS

Drivers Impact Analysis*

Factor Direction Relative impact on market growth
Leading-edge logic and memory lithography intensity Positive High
New 300 mm fab capacity and wafer-start growth Positive High
Advanced packaging and high-density substrates Positive Medium-high
Display and PCB feature scaling Positive Medium

Leading-edge logic and memory increase resist value per wafer

EUV adoption adds new chemistry and process-control requirements rather than simply replacing one resist bottle with another. ASML’s High-NA production milestone in 2026 shows the technology moving into manufacturing on selected layers. As exposure systems improve resolution, resist sensitivity, stochastic defects, line-edge roughness and etch resistance become tighter constraints, increasing the value of high-performance formulations and process support.

Fab construction expands the recurring consumables base

Photoresists are recurring process materials, so a new fab matters long after the initial equipment purchase. SEMI expects 300 mm installed capacity to rise in 2026 and tracks more than 400 fabs and lines in its latest outlook. Once a facility ramps, each wafer-start cycle generates repeat demand across multiple lithography steps, giving materials suppliers a recurring revenue stream tied to utilization.

Advanced packaging creates additional lithography steps

Redistribution layers, bumping, through-silicon-via processes and wafer-level packaging require thick or application-specific photoresists. Heterogeneous integration therefore creates demand outside the front-end transistor patterning cycle. The opportunity benefits suppliers that can handle thicker coatings, plating compatibility, high aspect ratios and non-silicon substrates.

PCB and substrate scaling supports dry-film and liquid resist innovation

AI servers, networking systems and high-end consumer devices require denser interconnect, finer line/space and more complex multilayer boards. That pushes PCB and IC-substrate manufacturers toward imaging materials with better resolution, adhesion and thermal process compatibility, extending photoresist innovation beyond wafer fabrication.

MARKET RESTRAINTS

Restraints Impact Analysis*

Factor Direction Relative impact on market growth
Long customer qualification cycles Negative High
EUV R&D and defect-control cost Negative High
Chemical and environmental compliance burden Negative Medium
Cyclical fab utilization and display demand Negative Medium

Qualification cycles slow supplier switching

A resist change can alter critical dimension, defectivity, overlay interaction and etch performance. Customers therefore validate materials through repeated lots and process conditions before production release. This creates high barriers to entry and can delay revenue for new suppliers even when laboratory performance is competitive.

Next-generation formulations require sustained R&D

The sensitivity-resolution-defectivity trade-off becomes harder as feature sizes shrink. Metal-oxide resists, dry-resist processes and High-NA EUV each require new material, process and metrology work. The cost favors suppliers with large R&D organizations or collaboration networks and limits how quickly smaller firms can enter advanced-node production.

Environmental requirements can force formulation redesign

Photoresist manufacturing and use involve solvents, developers and specialty chemicals that face increasingly stringent environmental and workplace controls. Reformulation is not a simple substitution because purity, coating behavior and lithographic performance must remain stable. Compliance therefore adds development work and can extend requalification timelines.

MARKET OPPORTUNITIES

High-NA EUV and metal-oxide resist

High-NA increases the need for materials with high EUV absorption, low stochastic failure rates and robust pattern transfer. JSR/Inpria’s recent licensing and collaboration agreements demonstrate active commercialization around metal-oxide and next-generation resist technology.

Domestic supply for mature and mid-range nodes

China and other regions are investing in local semiconductor materials. KrF, ArF dry and selected ArF immersion products provide a more accessible qualification path than frontier EUV and can build customer relationships before suppliers move upward in technology.

Advanced packaging and thick-film lithography

Fan-out, 2.5D/3D integration and substrate processing expand the need for thick coatings, plating resists and photo-imageable dielectric systems. Suppliers with packaging-compatible portfolios can capture growth even when front-end wafer starts are cyclical.

Specialty microfabrication

MEMS, microfluidics, photonics, AR/VR optics and nanoimprint processes need application-specific resists. TOK’s acquisition of micro resist technology highlights strategic interest in these smaller but technically differentiated markets.

Photoresists Supply Chain Analysis

Stage 1

High-purity raw materials

Specialty polymers, monomers, photoacid generators, solvents and additives with semiconductor-grade impurity control.
Stage 2

Resist formulation and purification

Polymer synthesis, blending, filtration, analytical control and contamination-managed filling.
Stage 3

Qualification and distribution

Customer-specific process testing, logistics under controlled conditions and local application support.
Stage 4

End-use lithography

Semiconductor fabs, display fabs and PCB/substrate manufacturers consume resist in recurring production cycles.

Raw-material purity is the first bottleneck because trace metals, particles or molecular variability can translate into wafer defects. Formulation houses capture value through proprietary chemistry and process know-how, but their product has little commercial value until it is qualified. This makes customer applications engineering part of the supply chain rather than an after-sales function.

Distribution is also specialized. Leading-edge customers require traceability, controlled storage, batch consistency and contingency planning, which favors suppliers with local warehouses and duplicate production routes. In mature and PCB segments, distributors play a larger role, but technical service remains important because coating, bake and development conditions vary by line.

At the end-use stage, fabs capture the economic value through yield. A resist that costs more per liter can still reduce total process cost if it lowers defects, reduces exposure dose or simplifies multi-patterning. This is why advanced photoresist pricing is governed by process economics rather than raw chemical cost.

Recent Developments in the Photoresists Market

Date Development Market implication
July 2026 ASML reported that Intel Foundry used High-NA EUV on selected Intel 18A production layers. Moves High-NA from development toward manufacturing, raising the strategic importance of resists optimized for 0.55 NA exposure and advanced pattern transfer.
May 2026 JSR/Inpria and Entegris announced a non-exclusive EUV metal-oxide-resist cross-licensing agreement. Reduces IP friction around MOR and broadens the development ecosystem for next-generation EUV materials.
September 2025 JSR/Inpria and Lam Research announced cross-licensing and collaboration on next-generation patterning. Links resist chemistry more closely with dry-resist, deposition and etch process development for AI-era advanced nodes.
February 2025 TOK agreed to acquire micro resist technology GmbH in Germany. Expands TOK’s specialty photoresist, nanoimprint and microfabrication portfolio and strengthens its European R&D footprint.

REPORT SCOPE & SEGMENTATION

Attribute Coverage
Market Photoresists
Base year 2025
Estimated year 2026
Forecast period 2026–2034
By imaging mechanism Positive Photoresists; Negative Photoresists
By type EUV Photoresist; ArFi Photoresist; ArF Dry Photoresist; KrF Photoresist; g/i-Line; Others
By process node High End / Advanced <14nm; Mid End 18/22/28–90nm; Low End >110nm; DRAM and NAND
By application Semiconductor Photoresists; LCD Photoresists; PCB Photoresists
Regions North America; Europe; Asia; South America; Middle East & Africa
Companies profiled TOKYO OHKA KOGYO; JSR; Shin-Etsu Chemical; Fujifilm Holdings; Sumitomo Chemical; Dongjin Semichem; Merck KGaA; Asahi Kasei; Eternal Materials; Kolon Industries; Chang Chun Group; Taiyo Ink Mfg; Reform Technology; Jiangsu Nata Opto-electronic Material; Yoke Technology

Frequently Asked Questions

What is the current size of the photoresists market?

The market was valued at USD 6.67 billion in 2025. The 2026 series value is USD 6.99 billion and the 2034 forecast is USD 10.20 billion.

What CAGR is used for the 2026–2034 photoresists forecast?

The 2025 and 2034 market-size anchors imply a compound annual growth rate of 4.8%, which is used for the 2026–2034 series.

Which application is the largest?

Semiconductor photoresists are the largest application because repeated lithography steps are required throughout wafer fabrication and advanced nodes use higher-value materials.

Which photoresist technology is changing fastest?

EUV photoresists, including metal-oxide resist approaches, are the fastest-moving technology area as leading-edge logic and memory adopt more EUV layers and High-NA process development advances.

Which region leads the photoresists market?

Asia Pacific leads due to the concentration of wafer fabrication, memory, displays, PCBs and major photoresist suppliers across China, Japan, Taiwan and South Korea.

Why are barriers to entry high in semiconductor photoresists?

Ultra-high purity requirements, proprietary chemistry, process integration and long fab qualification cycles make it difficult to replace a production resist quickly.

How does High-NA EUV affect the market?

High-NA EUV tightens resolution and process-control requirements and creates demand for materials optimized for sensitivity, stochastic defects, line-edge roughness and pattern transfer.

What supports mature-node photoresist demand?

Mature-node fab expansion for analog, power, automotive, display-driver, MEMS and industrial semiconductors sustains KrF, ArF and i-line material consumption.

Where are the clearest growth opportunities?

High-NA EUV, metal-oxide resists, advanced packaging, high-density PCB/substrate processing and regional mature-node supply localization are the clearest opportunity areas.

Which companies are profiled in the market?

The profiled list includes TOK, JSR, Shin-Etsu Chemical, Fujifilm, Sumitomo Chemical, Dongjin Semichem, Merck, Asahi Kasei, Eternal Materials, Kolon Industries, Chang Chun Group, Taiyo Ink and selected Chinese suppliers.

Research Sources & Evidence Base

View research sources used for this overview
  1. SEMI: 300mm Fab Outlook, Q2 2026 – Semiconductor fab investment, capacity growth, AI/HPC and regional capacity expansion context.
  2. SEMI: Eighteen New Semiconductor Fabs to Start Construction in 2025 – New fab construction pipeline across the Americas, Japan, China, Europe, Taiwan, Korea and Southeast Asia.
  3. ASML: High NA EUV reaches new readiness milestone with first high-volume Logic product – High-NA EUV use in production and advanced-node patterning requirements.
  4. ASML: ASML and imec sign strategic partnership agreement – Sub-2nm R&D infrastructure using 0.55 NA EUV and 0.33 NA EUV.
  5. SEMI’s record 300 mm equipment-spending outlook increases the strategic importance of materials capacity. As new fabs move from construction to tool installation and production, recurring chemical consumption rises. For suppliers, timing capacity additions to customer qualification is critical: capacity added too late misses design-in windows, while capacity added too early can carry low utilization because a qualified resist cannot be switched rapidly between customers.

    Photoresists Market Dynamics: Drivers, Restraints and Opportunities

    Photoresist demand grows with wafer starts, lithography intensity and tighter patterning requirements, but the market is constrained by long qualification cycles, chemical purity requirements and the cost of developing new formulations. The strongest commercial opportunities sit where a new process architecture changes material requirements: High-NA EUV, advanced packaging, finer PCB features and localized mature-node supply.

    MARKET DRIVERS

    Drivers Impact Analysis*

    Factor Direction Relative impact on market growth
    Leading-edge logic and memory lithography intensity Positive High
    New 300 mm fab capacity and wafer-start growth Positive High
    Advanced packaging and high-density substrates Positive Medium-high
    Display and PCB feature scaling Positive Medium

    Leading-edge logic and memory increase resist value per wafer

    EUV adoption adds new chemistry and process-control requirements rather than simply replacing one resist bottle with another. ASML’s High-NA production milestone in 2026 shows the technology moving into manufacturing on selected layers. As exposure systems improve resolution, resist sensitivity, stochastic defects, line-edge roughness and etch resistance become tighter constraints, increasing the value of high-performance formulations and process support.

    Fab construction expands the recurring consumables base

    Photoresists are recurring process materials, so a new fab matters long after the initial equipment purchase. SEMI expects 300 mm installed capacity to rise in 2026 and tracks more than 400 fabs and lines in its latest outlook. Once a facility ramps, each wafer-start cycle generates repeat demand across multiple lithography steps, giving materials suppliers a recurring revenue stream tied to utilization.

    Advanced packaging creates additional lithography steps

    Redistribution layers, bumping, through-silicon-via processes and wafer-level packaging require thick or application-specific photoresists. Heterogeneous integration therefore creates demand outside the front-end transistor patterning cycle. The opportunity benefits suppliers that can handle thicker coatings, plating compatibility, high aspect ratios and non-silicon substrates.

    PCB and substrate scaling supports dry-film and liquid resist innovation

    AI servers, networking systems and high-end consumer devices require denser interconnect, finer line/space and more complex multilayer boards. That pushes PCB and IC-substrate manufacturers toward imaging materials with better resolution, adhesion and thermal process compatibility, extending photoresist innovation beyond wafer fabrication.

    MARKET RESTRAINTS

    Restraints Impact Analysis*

    Factor Direction Relative impact on market growth
    Long customer qualification cycles Negative High
    EUV R&D and defect-control cost Negative High
    Chemical and environmental compliance burden Negative Medium
    Cyclical fab utilization and display demand Negative Medium

    Qualification cycles slow supplier switching

    A resist change can alter critical dimension, defectivity, overlay interaction and etch performance. Customers therefore validate materials through repeated lots and process conditions before production release. This creates high barriers to entry and can delay revenue for new suppliers even when laboratory performance is competitive.

    Next-generation formulations require sustained R&D

    The sensitivity-resolution-defectivity trade-off becomes harder as feature sizes shrink. Metal-oxide resists, dry-resist processes and High-NA EUV each require new material, process and metrology work. The cost favors suppliers with large R&D organizations or collaboration networks and limits how quickly smaller firms can enter advanced-node production.

    Environmental requirements can force formulation redesign

    Photoresist manufacturing and use involve solvents, developers and specialty chemicals that face increasingly stringent environmental and workplace controls. Reformulation is not a simple substitution because purity, coating behavior and lithographic performance must remain stable. Compliance therefore adds development work and can extend requalification timelines.

    MARKET OPPORTUNITIES

    High-NA EUV and metal-oxide resist

    High-NA increases the need for materials with high EUV absorption, low stochastic failure rates and robust pattern transfer. JSR/Inpria’s recent licensing and collaboration agreements demonstrate active commercialization around metal-oxide and next-generation resist technology.

    Domestic supply for mature and mid-range nodes

    China and other regions are investing in local semiconductor materials. KrF, ArF dry and selected ArF immersion products provide a more accessible qualification path than frontier EUV and can build customer relationships before suppliers move upward in technology.

    Advanced packaging and thick-film lithography

    Fan-out, 2.5D/3D integration and substrate processing expand the need for thick coatings, plating resists and photo-imageable dielectric systems. Suppliers with packaging-compatible portfolios can capture growth even when front-end wafer starts are cyclical.

    Specialty microfabrication

    MEMS, microfluidics, photonics, AR/VR optics and nanoimprint processes need application-specific resists. TOK’s acquisition of micro resist technology highlights strategic interest in these smaller but technically differentiated markets.

    Photoresists Supply Chain Analysis

    Stage 1

    High-purity raw materials

    Specialty polymers, monomers, photoacid generators, solvents and additives with semiconductor-grade impurity control.
    Stage 2

    Resist formulation and purification

    Polymer synthesis, blending, filtration, analytical control and contamination-managed filling.
    Stage 3

    Qualification and distribution

    Customer-specific process testing, logistics under controlled conditions and local application support.
    Stage 4

    End-use lithography

    Semiconductor fabs, display fabs and PCB/substrate manufacturers consume resist in recurring production cycles.

    Raw-material purity is the first bottleneck because trace metals, particles or molecular variability can translate into wafer defects. Formulation houses capture value through proprietary chemistry and process know-how, but their product has little commercial value until it is qualified. This makes customer applications engineering part of the supply chain rather than an after-sales function.

    Distribution is also specialized. Leading-edge customers require traceability, controlled storage, batch consistency and contingency planning, which favors suppliers with local warehouses and duplicate production routes. In mature and PCB segments, distributors play a larger role, but technical service remains important because coating, bake and development conditions vary by line.

    At the end-use stage, fabs capture the economic value through yield. A resist that costs more per liter can still reduce total process cost if it lowers defects, reduces exposure dose or simplifies multi-patterning. This is why advanced photoresist pricing is governed by process economics rather than raw chemical cost.

    Recent Developments in the Photoresists Market

    Date Development Market implication
    July 2026 ASML reported that Intel Foundry used High-NA EUV on selected Intel 18A production layers. Moves High-NA from development toward manufacturing, raising the strategic importance of resists optimized for 0.55 NA exposure and advanced pattern transfer.
    May 2026 JSR/Inpria and Entegris announced a non-exclusive EUV metal-oxide-resist cross-licensing agreement. Reduces IP friction around MOR and broadens the development ecosystem for next-generation EUV materials.
    September 2025 JSR/Inpria and Lam Research announced cross-licensing and collaboration on next-generation patterning. Links resist chemistry more closely with dry-resist, deposition and etch process development for AI-era advanced nodes.
    February 2025 TOK agreed to acquire micro resist technology GmbH in Germany. Expands TOK’s specialty photoresist, nanoimprint and microfabrication portfolio and strengthens its European R&D footprint.

    REPORT SCOPE & SEGMENTATION

    Attribute Coverage
    Market Photoresists
    Base year 2025
    Estimated year 2026
    Forecast period 2026–2034
    By imaging mechanism Positive Photoresists; Negative Photoresists
    By type EUV Photoresist; ArFi Photoresist; ArF Dry Photoresist; KrF Photoresist; g/i-Line; Others
    By process node High End / Advanced <14nm; Mid End 18/22/28–90nm; Low End >110nm; DRAM and NAND
    By application Semiconductor Photoresists; LCD Photoresists; PCB Photoresists
    Regions North America; Europe; Asia; South America; Middle East & Africa
    Companies profiled TOKYO OHKA KOGYO; JSR; Shin-Etsu Chemical; Fujifilm Holdings; Sumitomo Chemical; Dongjin Semichem; Merck KGaA; Asahi Kasei; Eternal Materials; Kolon Industries; Chang Chun Group; Taiyo Ink Mfg; Reform Technology; Jiangsu Nata Opto-electronic Material; Yoke Technology

    Frequently Asked Questions

    What is the current size of the photoresists market?

    The market was valued at USD 6.67 billion in 2025. The 2026 series value is USD 6.99 billion and the 2034 forecast is USD 10.20 billion.

    What CAGR is used for the 2026–2034 photoresists forecast?

    The 2025 and 2034 market-size anchors imply a compound annual growth rate of 4.8%, which is used for the 2026–2034 series.

    Which application is the largest?

    Semiconductor photoresists are the largest application because repeated lithography steps are required throughout wafer fabrication and advanced nodes use higher-value materials.

    Which photoresist technology is changing fastest?

    EUV photoresists, including metal-oxide resist approaches, are the fastest-moving technology area as leading-edge logic and memory adopt more EUV layers and High-NA process development advances.

    Which region leads the photoresists market?

    Asia Pacific leads due to the concentration of wafer fabrication, memory, displays, PCBs and major photoresist suppliers across China, Japan, Taiwan and South Korea.

    Why are barriers to entry high in semiconductor photoresists?

    Ultra-high purity requirements, proprietary chemistry, process integration and long fab qualification cycles make it difficult to replace a production resist quickly.

    How does High-NA EUV affect the market?

    High-NA EUV tightens resolution and process-control requirements and creates demand for materials optimized for sensitivity, stochastic defects, line-edge roughness and pattern transfer.

    What supports mature-node photoresist demand?

    Mature-node fab expansion for analog, power, automotive, display-driver, MEMS and industrial semiconductors sustains KrF, ArF and i-line material consumption.

    Where are the clearest growth opportunities?

    High-NA EUV, metal-oxide resists, advanced packaging, high-density PCB/substrate processing and regional mature-node supply localization are the clearest opportunity areas.

    Which companies are profiled in the market?

    The profiled list includes TOK, JSR, Shin-Etsu Chemical, Fujifilm, Sumitomo Chemical, Dongjin Semichem, Merck, Asahi Kasei, Eternal Materials, Kolon Industries, Chang Chun Group, Taiyo Ink and selected Chinese suppliers.

    Research Sources & Evidence Base

    View research sources used for this overview
    1. SEMI: 300mm Fab Outlook, Q2 2026 – Semiconductor fab investment, capacity growth, AI/HPC and regional capacity expansion context.
    2. SEMI: Eighteen New Semiconductor Fabs to Start Construction in 2025 – New fab construction pipeline across the Americas, Japan, China, Europe, Taiwan, Korea and Southeast Asia.
    3. ASML: High NA EUV reaches new readiness milestone with first high-volume Logic product – High-NA EUV use in production and advanced-node patterning requirements.
    4. ASML: ASML and imec sign strategic partnership agreement – Sub-2nm R&D infrastructure using 0.55 NA EUV and 0.33 NA EUV.
    5. JSR Corporation: JSR/Inpria and Lam Research cross-licensing and collaboration agreement – Metal-oxide resist, dry resist and High-NA EUV patterning collaboration.
    6. JSR Corporation: JSR/Inpria and Entegris cross-licensing for EUV lithography – Metal-oxide resist patent cross-licensing and next-generation photoresist collaboration.
    7. JSR Corporation: Contribution to Quality of Life and Happiness – JSR explanation of metal-oxide resist technology and expected mass-production relevance.
    8. TOKYO OHKA KOGYO: Complete subsidiarization of micro resist technology GmbH – Acquisition expanding photoresist, nanoimprint and specialty resist capabilities in Europe.
    9. ASML: 2025 full-year financial results – EUV order and AI-related capacity context supporting advanced lithography demand.

Photoresists Market Technology Adoption, AI Integration and Industry Outlook (2026-2034)

Get Sample Report PDF for Exclusive Insights

Report Sample Includes

  • Table of Contents
  • List of Tables & Figures
  • Charts, Research Methodology, and more...

PDF Icon Download Sample Report PDF
SKU: a148e29706af
Category:
License Type

Corporate License, Excel License, PDF and Excel Databook License

License

, ,

Table of Content

1 Introduction to Research & Analysis Reports
1.1 Photoresists Market Definition
1.2 Market Segments
1.2.1 Segment by Imaging Mechanism
1.2.2 Segment by Type
1.2.3 Segment by Process Node
1.2.4 Segment by Application
1.3 Global Photoresists Market Overview
1.4 Features & Benefits of This Report
1.5 Methodology & Sources of Information
1.5.1 Research Methodology
1.5.2 Research Process
1.5.3 Base Year
1.5.4 Report Assumptions & Caveats
2 Global Photoresists Overall Market Size
2.1 Global Photoresists Market Size: 2025 VS 2034
2.2 Global Photoresists Market Size, Prospects & Forecasts: 2021-2034
2.3 Global Photoresists Sales: 2021-2034
3 Company Landscape
3.1 Top Photoresists Players in Global Market
3.2 Top Global Photoresists Companies Ranked by Revenue
3.3 Global Photoresists Revenue by Companies
3.4 Global Photoresists Sales by Companies
3.5 Global Photoresists Price by Manufacturer (2021-2026)
3.6 Top 3 and Top 5 Photoresists Companies in Global Market, by Revenue in 2025
3.7 Global Manufacturers Photoresists Product Type
3.8 Tier 1, Tier 2, and Tier 3 Photoresists Players in Global Market
3.8.1 List of Global Tier 1 Photoresists Companies
3.8.2 List of Global Tier 2 and Tier 3 Photoresists Companies
4 Sights by Imaging Mechanism
4.1 Overview
4.1.1 Segment by Imaging Mechanism – Global Photoresists Market Size Markets, 2025 & 2034
4.1.2 Positive Photoresists
4.1.3 Negative Photoresists
4.2 Segment by Imaging Mechanism – Global Photoresists Revenue & Forecasts
4.2.1 Segment by Imaging Mechanism – Global Photoresists Revenue, 2021-2026
4.2.2 Segment by Imaging Mechanism – Global Photoresists Revenue, 2027-2034
4.2.3 Segment by Imaging Mechanism – Global Photoresists Revenue Market Share, 2021-2034
4.3 Segment by Imaging Mechanism – Global Photoresists Sales & Forecasts
4.3.1 Segment by Imaging Mechanism – Global Photoresists Sales, 2021-2026
4.3.2 Segment by Imaging Mechanism – Global Photoresists Sales, 2027-2034
4.3.3 Segment by Imaging Mechanism – Global Photoresists Sales Market Share, 2021-2034
4.4 Segment by Imaging Mechanism – Global Photoresists Price (Manufacturers Selling Prices), 2021-2034
5 Sights by Type
5.1 Overview
5.1.1 Segment by Type – Global Photoresists Market Size Markets, 2025 & 2034
5.1.2 EUV Photoresist
5.1.3 ArFi Photoresist
5.1.4 ArF Dry Photoresist
5.1.5 KrF Photoresist
5.1.6 g/i-Line
5.1.7 Others
5.2 Segment by Type – Global Photoresists Revenue & Forecasts
5.2.1 Segment by Type – Global Photoresists Revenue, 2021-2026
5.2.2 Segment by Type – Global Photoresists Revenue, 2027-2034
5.2.3 Segment by Type – Global Photoresists Revenue Market Share, 2021-2034
5.3 Segment by Type – Global Photoresists Sales & Forecasts
5.3.1 Segment by Type – Global Photoresists Sales, 2021-2026
5.3.2 Segment by Type – Global Photoresists Sales, 2027-2034
5.3.3 Segment by Type – Global Photoresists Sales Market Share, 2021-2034
5.4 Segment by Type – Global Photoresists Price (Manufacturers Selling Prices), 2021-2034
6 Sights by Process Node
6.1 Overview
6.1.1 Segment by Process Node – Global Photoresists Market Size Markets, 2025 & 2034
6.1.2 High End / Advanced <14nm 6.1.3 Mid End 18/22/28-90nm 6.1.4 Low End >110nm
6.1.5 DRAM and NAND
6.2 Segment by Process Node – Global Photoresists Revenue & Forecasts
6.2.1 Segment by Process Node – Global Photoresists Revenue, 2021-2026
6.2.2 Segment by Process Node – Global Photoresists Revenue, 2027-2034
6.2.3 Segment by Process Node – Global Photoresists Revenue Market Share, 2021-2034
6.3 Segment by Process Node – Global Photoresists Sales & Forecasts
6.3.1 Segment by Process Node – Global Photoresists Sales, 2021-2026
6.3.2 Segment by Process Node – Global Photoresists Sales, 2027-2034
6.3.3 Segment by Process Node – Global Photoresists Sales Market Share, 2021-2034
6.4 Segment by Process Node – Global Photoresists Price (Manufacturers Selling Prices), 2021-2034
7 Sights by Application
7.1 Overview
7.1.1 Segment by Application – Global Photoresists Market Size, 2025 & 2034
7.1.2 Semiconductor Photoresists
7.1.3 LCD Photoresists
7.1.4 PCB Photoresists
7.2 Segment by Application – Global Photoresists Revenue & Forecasts
7.2.1 Segment by Application – Global Photoresists Revenue, 2021-2026
7.2.2 Segment by Application – Global Photoresists Revenue, 2027-2034
7.2.3 Segment by Application – Global Photoresists Revenue Market Share, 2021-2034
7.3 Segment by Application – Global Photoresists Sales & Forecasts
7.3.1 Segment by Application – Global Photoresists Sales, 2021-2026
7.3.2 Segment by Application – Global Photoresists Sales, 2027-2034
7.3.3 Segment by Application – Global Photoresists Sales Market Share, 2021-2034
7.4 Segment by Application – Global Photoresists Price (Manufacturers Selling Prices), 2021-2034
8 Sights Region
8.1 By Region – Global Photoresists Market Size, 2025 & 2034
8.2 By Region – Global Photoresists Revenue & Forecasts
8.2.1 By Region – Global Photoresists Revenue, 2021-2026
8.2.2 By Region – Global Photoresists Revenue, 2027-2034
8.2.3 By Region – Global Photoresists Revenue Market Share, 2021-2034
8.3 By Region – Global Photoresists Sales & Forecasts
8.3.1 By Region – Global Photoresists Sales, 2021-2026
8.3.2 By Region – Global Photoresists Sales, 2027-2034
8.3.3 By Region – Global Photoresists Sales Market Share, 2021-2034
8.4 North America
8.4.1 By Country – North America Photoresists Revenue, 2021-2034
8.4.2 By Country – North America Photoresists Sales, 2021-2034
8.4.3 United States Photoresists Market Size, 2021-2034
8.4.4 Canada Photoresists Market Size, 2021-2034
8.4.5 Mexico Photoresists Market Size, 2021-2034
8.5 Europe
8.5.1 By Country – Europe Photoresists Revenue, 2021-2034
8.5.2 By Country – Europe Photoresists Sales, 2021-2034
8.5.3 Germany Photoresists Market Size, 2021-2034
8.5.4 France Photoresists Market Size, 2021-2034
8.5.5 U.K. Photoresists Market Size, 2021-2034
8.5.6 Italy Photoresists Market Size, 2021-2034
8.5.7 Russia Photoresists Market Size, 2021-2034
8.5.8 Nordic Countries Photoresists Market Size, 2021-2034
8.5.9 Benelux Photoresists Market Size, 2021-2034
8.6 Asia
8.6.1 By Region – Asia Photoresists Revenue, 2021-2034
8.6.2 By Region – Asia Photoresists Sales, 2021-2034
8.6.3 China Photoresists Market Size, 2021-2034
8.6.4 Japan Photoresists Market Size, 2021-2034
8.6.5 South Korea Photoresists Market Size, 2021-2034
8.6.6 Southeast Asia Photoresists Market Size, 2021-2034
8.6.7 India Photoresists Market Size, 2021-2034
8.7 South America
8.7.1 By Country – South America Photoresists Revenue, 2021-2034
8.7.2 By Country – South America Photoresists Sales, 2021-2034
8.7.3 Brazil Photoresists Market Size, 2021-2034
8.7.4 Argentina Photoresists Market Size, 2021-2034
8.8 Middle East & Africa
8.8.1 By Country – Middle East & Africa Photoresists Revenue, 2021-2034
8.8.2 By Country – Middle East & Africa Photoresists Sales, 2021-2034
8.8.3 Turkey Photoresists Market Size, 2021-2034
8.8.4 Israel Photoresists Market Size, 2021-2034
8.8.5 Saudi Arabia Photoresists Market Size, 2021-2034
8.8.6 UAE Photoresists Market Size, 2021-2034
9 Manufacturers & Brands Profiles
9.1 TOKYO OHKA KOGYO CO., LTD. (TOK)
9.1.1 TOKYO OHKA KOGYO CO., LTD. (TOK) Company Summary
9.1.2 TOKYO OHKA KOGYO CO., LTD. (TOK) Business Overview
9.1.3 TOKYO OHKA KOGYO CO., LTD. (TOK) Photoresists Major Product Offerings
9.1.4 TOKYO OHKA KOGYO CO., LTD. (TOK) Photoresists Sales and Revenue in Global (2021-2026)
9.1.5 TOKYO OHKA KOGYO CO., LTD. (TOK) Key News & Latest Developments
9.2 JSR
9.2.1 JSR Company Summary
9.2.2 JSR Business Overview
9.2.3 JSR Photoresists Major Product Offerings
9.2.4 JSR Photoresists Sales and Revenue in Global (2021-2026)
9.2.5 JSR Key News & Latest Developments
9.3 Shin-Etsu Chemical
9.3.1 Shin-Etsu Chemical Company Summary
9.3.2 Shin-Etsu Chemical Business Overview
9.3.3 Shin-Etsu Chemical Photoresists Major Product Offerings
9.3.4 Shin-Etsu Chemical Photoresists Sales and Revenue in Global (2021-2026)
9.3.5 Shin-Etsu Chemical Key News & Latest Developments
9.4 Qnity
9.4.1 Qnity Company Summary
9.4.2 Qnity Business Overview
9.4.3 Qnity Photoresists Major Product Offerings
9.4.4 Qnity Photoresists Sales and Revenue in Global (2021-2026)
9.4.5 Qnity Key News & Latest Developments
9.5 Fujifilm
9.5.1 Fujifilm Company Summary
9.5.2 Fujifilm Business Overview
9.5.3 Fujifilm Photoresists Major Product Offerings
9.5.4 Fujifilm Photoresists Sales and Revenue in Global (2021-2026)
9.5.5 Fujifilm Key News & Latest Developments
9.6 Sumitomo Chemical
9.6.1 Sumitomo Chemical Company Summary
9.6.2 Sumitomo Chemical Business Overview
9.6.3 Sumitomo Chemical Photoresists Major Product Offerings
9.6.4 Sumitomo Chemical Photoresists Sales and Revenue in Global (2021-2026)
9.6.5 Sumitomo Chemical Key News & Latest Developments
9.7 Dongjin Semichem
9.7.1 Dongjin Semichem Company Summary
9.7.2 Dongjin Semichem Business Overview
9.7.3 Dongjin Semichem Photoresists Major Product Offerings
9.7.4 Dongjin Semichem Photoresists Sales and Revenue in Global (2021-2026)
9.7.5 Dongjin Semichem Key News & Latest Developments
9.8 Merck KGaA (AZ)
9.8.1 Merck KGaA (AZ) Company Summary
9.8.2 Merck KGaA (AZ) Business Overview
9.8.3 Merck KGaA (AZ) Photoresists Major Product Offerings
9.8.4 Merck KGaA (AZ) Photoresists Sales and Revenue in Global (2021-2026)
9.8.5 Merck KGaA (AZ) Key News & Latest Developments
9.9 Allresist GmbH
9.9.1 Allresist GmbH Company Summary
9.9.2 Allresist GmbH Business Overview
9.9.3 Allresist GmbH Photoresists Major Product Offerings
9.9.4 Allresist GmbH Photoresists Sales and Revenue in Global (2021-2026)
9.9.5 Allresist GmbH Key News & Latest Developments
9.10 Futurrex
9.10.1 Futurrex Company Summary
9.10.2 Futurrex Business Overview
9.10.3 Futurrex Photoresists Major Product Offerings
9.10.4 Futurrex Photoresists Sales and Revenue in Global (2021-2026)
9.10.5 Futurrex Key News & Latest Developments
9.11 KemLab™ Inc
9.11.1 KemLab™ Inc Company Summary
9.11.2 KemLab™ Inc Business Overview
9.11.3 KemLab™ Inc Photoresists Major Product Offerings
9.11.4 KemLab™ Inc Photoresists Sales and Revenue in Global (2021-2026)
9.11.5 KemLab™ Inc Key News & Latest Developments
9.12 YCCHEM Co., Ltd
9.12.1 YCCHEM Co., Ltd Company Summary
9.12.2 YCCHEM Co., Ltd Business Overview
9.12.3 YCCHEM Co., Ltd Photoresists Major Product Offerings
9.12.4 YCCHEM Co., Ltd Photoresists Sales and Revenue in Global (2021-2026)
9.12.5 YCCHEM Co., Ltd Key News & Latest Developments
9.13 SK Materials Performance (SKMP)
9.13.1 SK Materials Performance (SKMP) Company Summary
9.13.2 SK Materials Performance (SKMP) Business Overview
9.13.3 SK Materials Performance (SKMP) Photoresists Major Product Offerings
9.13.4 SK Materials Performance (SKMP) Photoresists Sales and Revenue in Global (2021-2026)
9.13.5 SK Materials Performance (SKMP) Key News & Latest Developments
9.14 Everlight Chemical
9.14.1 Everlight Chemical Company Summary
9.14.2 Everlight Chemical Business Overview
9.14.3 Everlight Chemical Photoresists Major Product Offerings
9.14.4 Everlight Chemical Photoresists Sales and Revenue in Global (2021-2026)
9.14.5 Everlight Chemical Key News & Latest Developments
9.15 Red Avenue
9.15.1 Red Avenue Company Summary
9.15.2 Red Avenue Business Overview
9.15.3 Red Avenue Photoresists Major Product Offerings
9.15.4 Red Avenue Photoresists Sales and Revenue in Global (2021-2026)
9.15.5 Red Avenue Key News & Latest Developments
9.16 Crystal Clear Electronic Material
9.16.1 Crystal Clear Electronic Material Company Summary
9.16.2 Crystal Clear Electronic Material Business Overview
9.16.3 Crystal Clear Electronic Material Photoresists Major Product Offerings
9.16.4 Crystal Clear Electronic Material Photoresists Sales and Revenue in Global (2021-2026)
9.16.5 Crystal Clear Electronic Material Key News & Latest Developments
9.17 Xuzhou B & C Chemical
9.17.1 Xuzhou B & C Chemical Company Summary
9.17.2 Xuzhou B & C Chemical Business Overview
9.17.3 Xuzhou B & C Chemical Photoresists Major Product Offerings
9.17.4 Xuzhou B & C Chemical Photoresists Sales and Revenue in Global (2021-2026)
9.17.5 Xuzhou B & C Chemical Key News & Latest Developments
9.18 Xiamen Hengkun New Material Technology
9.18.1 Xiamen Hengkun New Material Technology Company Summary
9.18.2 Xiamen Hengkun New Material Technology Business Overview
9.18.3 Xiamen Hengkun New Material Technology Photoresists Major Product Offerings
9.18.4 Xiamen Hengkun New Material Technology Photoresists Sales and Revenue in Global (2021-2026)
9.18.5 Xiamen Hengkun New Material Technology Key News & Latest Developments
9.19 Jiangsu Aisen Semiconductor Material
9.19.1 Jiangsu Aisen Semiconductor Material Company Summary
9.19.2 Jiangsu Aisen Semiconductor Material Business Overview
9.19.3 Jiangsu Aisen Semiconductor Material Photoresists Major Product Offerings
9.19.4 Jiangsu Aisen Semiconductor Material Photoresists Sales and Revenue in Global (2021-2026)
9.19.5 Jiangsu Aisen Semiconductor Material Key News & Latest Developments
9.20 Zhuhai Cornerstone Technologies
9.20.1 Zhuhai Cornerstone Technologies Company Summary
9.20.2 Zhuhai Cornerstone Technologies Business Overview
9.20.3 Zhuhai Cornerstone Technologies Photoresists Major Product Offerings
9.20.4 Zhuhai Cornerstone Technologies Photoresists Sales and Revenue in Global (2021-2026)
9.20.5 Zhuhai Cornerstone Technologies Key News & Latest Developments
9.21 Shanghai Sinyang Semiconductor Materials
9.21.1 Shanghai Sinyang Semiconductor Materials Company Summary
9.21.2 Shanghai Sinyang Semiconductor Materials Business Overview
9.21.3 Shanghai Sinyang Semiconductor Materials Photoresists Major Product Offerings
9.21.4 Shanghai Sinyang Semiconductor Materials Photoresists Sales and Revenue in Global (2021-2026)
9.21.5 Shanghai Sinyang Semiconductor Materials Key News & Latest Developments
9.22 ShenZhen RongDa Photosensitive Science & Technology
9.22.1 ShenZhen RongDa Photosensitive Science & Technology Company Summary
9.22.2 ShenZhen RongDa Photosensitive Science & Technology Business Overview
9.22.3 ShenZhen RongDa Photosensitive Science & Technology Photoresists Major Product Offerings
9.22.4 ShenZhen RongDa Photosensitive Science & Technology Photoresists Sales and Revenue in Global (2021-2026)
9.22.5 ShenZhen RongDa Photosensitive Science & Technology Key News & Latest Developments
9.23 SINEVA
9.23.1 SINEVA Company Summary
9.23.2 SINEVA Business Overview
9.23.3 SINEVA Photoresists Major Product Offerings
9.23.4 SINEVA Photoresists Sales and Revenue in Global (2021-2026)
9.23.5 SINEVA Key News & Latest Developments
9.24 Guoke Tianji
9.24.1 Guoke Tianji Company Summary
9.24.2 Guoke Tianji Business Overview
9.24.3 Guoke Tianji Photoresists Major Product Offerings
9.24.4 Guoke Tianji Photoresists Sales and Revenue in Global (2021-2026)
9.24.5 Guoke Tianji Key News & Latest Developments
9.25 Jiangsu Nata Opto-electronic Material
9.25.1 Jiangsu Nata Opto-electronic Material Company Summary
9.25.2 Jiangsu Nata Opto-electronic Material Business Overview
9.25.3 Jiangsu Nata Opto-electronic Material Photoresists Major Product Offerings
9.25.4 Jiangsu Nata Opto-electronic Material Photoresists Sales and Revenue in Global (2021-2026)
9.25.5 Jiangsu Nata Opto-electronic Material Key News & Latest Developments
9.26 PhiChem
9.26.1 PhiChem Company Summary
9.26.2 PhiChem Business Overview
9.26.3 PhiChem Photoresists Major Product Offerings
9.26.4 PhiChem Photoresists Sales and Revenue in Global (2021-2026)
9.26.5 PhiChem Key News & Latest Developments
9.27 NIPPON STEEL Chemical & Material
9.27.1 NIPPON STEEL Chemical & Material Company Summary
9.27.2 NIPPON STEEL Chemical & Material Business Overview
9.27.3 NIPPON STEEL Chemical & Material Photoresists Major Product Offerings
9.27.4 NIPPON STEEL Chemical & Material Photoresists Sales and Revenue in Global (2021-2026)
9.27.5 NIPPON STEEL Chemical & Material Key News & Latest Developments
9.28 Jiangsu Yoke Technology
9.28.1 Jiangsu Yoke Technology Company Summary
9.28.2 Jiangsu Yoke Technology Business Overview
9.28.3 Jiangsu Yoke Technology Photoresists Major Product Offerings
9.28.4 Jiangsu Yoke Technology Photoresists Sales and Revenue in Global (2021-2026)
9.28.5 Jiangsu Yoke Technology Key News & Latest Developments
9.29 DNP Fine Chemicals
9.29.1 DNP Fine Chemicals Company Summary
9.29.2 DNP Fine Chemicals Business Overview
9.29.3 DNP Fine Chemicals Photoresists Major Product Offerings
9.29.4 DNP Fine Chemicals Photoresists Sales and Revenue in Global (2021-2026)
9.29.5 DNP Fine Chemicals Key News & Latest Developments
9.30 Chimei
9.30.1 Chimei Company Summary
9.30.2 Chimei Business Overview
9.30.3 Chimei Photoresists Major Product Offerings
9.30.4 Chimei Photoresists Sales and Revenue in Global (2021-2026)
9.30.5 Chimei Key News & Latest Developments
9.31 Daxin Materials
9.31.1 Daxin Materials Company Summary
9.31.2 Daxin Materials Business Overview
9.31.3 Daxin Materials Photoresists Major Product Offerings
9.31.4 Daxin Materials Photoresists Sales and Revenue in Global (2021-2026)
9.31.5 Daxin Materials Key News & Latest Developments
9.32 Jiangsu Kuangshun
9.32.1 Jiangsu Kuangshun Company Summary
9.32.2 Jiangsu Kuangshun Business Overview
9.32.3 Jiangsu Kuangshun Photoresists Major Product Offerings
9.32.4 Jiangsu Kuangshun Photoresists Sales and Revenue in Global (2021-2026)
9.32.5 Jiangsu Kuangshun Key News & Latest Developments
9.33 Eternal Material Technology
9.33.1 Eternal Material Technology Company Summary
9.33.2 Eternal Material Technology Business Overview
9.33.3 Eternal Material Technology Photoresists Major Product Offerings
9.33.4 Eternal Material Technology Photoresists Sales and Revenue in Global (2021-2026)
9.33.5 Eternal Material Technology Key News & Latest Developments
9.34 Samsung SDI
9.34.1 Samsung SDI Company Summary
9.34.2 Samsung SDI Business Overview
9.34.3 Samsung SDI Photoresists Major Product Offerings
9.34.4 Samsung SDI Photoresists Sales and Revenue in Global (2021-2026)
9.34.5 Samsung SDI Key News & Latest Developments
9.35 Taiyo Ink MFG
9.35.1 Taiyo Ink MFG Company Summary
9.35.2 Taiyo Ink MFG Business Overview
9.35.3 Taiyo Ink MFG Photoresists Major Product Offerings
9.35.4 Taiyo Ink MFG Photoresists Sales and Revenue in Global (2021-2026)
9.35.5 Taiyo Ink MFG Key News & Latest Developments
9.36 Asahi Kasei
9.36.1 Asahi Kasei Company Summary
9.36.2 Asahi Kasei Business Overview
9.36.3 Asahi Kasei Photoresists Major Product Offerings
9.36.4 Asahi Kasei Photoresists Sales and Revenue in Global (2021-2026)
9.36.5 Asahi Kasei Key News & Latest Developments
9.37 Eternal Materials
9.37.1 Eternal Materials Company Summary
9.37.2 Eternal Materials Business Overview
9.37.3 Eternal Materials Photoresists Major Product Offerings
9.37.4 Eternal Materials Photoresists Sales and Revenue in Global (2021-2026)
9.37.5 Eternal Materials Key News & Latest Developments
9.38 Resonac
9.38.1 Resonac Company Summary
9.38.2 Resonac Business Overview
9.38.3 Resonac Photoresists Major Product Offerings
9.38.4 Resonac Photoresists Sales and Revenue in Global (2021-2026)
9.38.5 Resonac Key News & Latest Developments
9.39 Chang Chun Group
9.39.1 Chang Chun Group Company Summary
9.39.2 Chang Chun Group Business Overview
9.39.3 Chang Chun Group Photoresists Major Product Offerings
9.39.4 Chang Chun Group Photoresists Sales and Revenue in Global (2021-2026)
9.39.5 Chang Chun Group Key News & Latest Developments
9.40 Kolon Industries
9.40.1 Kolon Industries Company Summary
9.40.2 Kolon Industries Business Overview
9.40.3 Kolon Industries Photoresists Major Product Offerings
9.40.4 Kolon Industries Photoresists Sales and Revenue in Global (2021-2026)
9.40.5 Kolon Industries Key News & Latest Developments
10 Global Photoresists Production Capacity, Analysis
10.1 Global Photoresists Production Capacity, 2021-2034
10.2 Photoresists Production Capacity of Key Manufacturers in Global Market
10.3 Global Photoresists Production by Region
11 Key Market Trends, Opportunity, Drivers and Restraints
11.1 Market Opportunities & Trends
11.2 Market Drivers
11.3 Market Restraints
12 Photoresists Supply Chain Analysis
12.1 Photoresists Industry Value Chain
12.2 Photoresists Upstream Market
12.3 Photoresists Downstream and Clients
12.4 Marketing Channels Analysis
12.4.1 Marketing Channels
12.4.2 Photoresists Distributors and Sales Agents in Global
13 Conclusion
14 Appendix
14.1 Note
14.2 Examples of Clients
14.3 DisclaimerList of Tables
Table 1. Key Players of Photoresists in Global Market
Table 2. Top Photoresists Players in Global Market, Ranking by Revenue (2025)
Table 3. Global Photoresists Revenue by Companies, (US$, Mn), 2021-2026
Table 4. Global Photoresists Revenue Share by Companies, 2021-2026
Table 5. Global Photoresists Sales by Companies, (Tons), 2021-2026
Table 6. Global Photoresists Sales Share by Companies, 2021-2026
Table 7. Key Manufacturers Photoresists Price (2021-2026) & (US$/Kg)
Table 8. Global Manufacturers Photoresists Product Type
Table 9. List of Global Tier 1 Photoresists Companies, Revenue (US$, Mn) in 2025 and Market Share
Table 10. List of Global Tier 2 and Tier 3 Photoresists Companies, Revenue (US$, Mn) in 2025 and Market Share
Table 11. Segment by Imaging Mechanism – Global Photoresists Revenue, (US$, Mn), 2025 & 2034
Table 12. Segment by Imaging Mechanism – Global Photoresists Revenue (US$, Mn), 2021-2026
Table 13. Segment by Imaging Mechanism – Global Photoresists Revenue (US$, Mn), 2027-2034
Table 14. Segment by Imaging Mechanism – Global Photoresists Sales (Tons), 2021-2026
Table 15. Segment by Imaging Mechanism – Global Photoresists Sales (Tons), 2027-2034
Table 16. Segment by Type – Global Photoresists Revenue, (US$, Mn), 2025 & 2034
Table 17. Segment by Type – Global Photoresists Revenue (US$, Mn), 2021-2026
Table 18. Segment by Type – Global Photoresists Revenue (US$, Mn), 2027-2034
Table 19. Segment by Type – Global Photoresists Sales (Tons), 2021-2026
Table 20. Segment by Type – Global Photoresists Sales (Tons), 2027-2034
Table 21. Segment by Process Node – Global Photoresists Revenue, (US$, Mn), 2025 & 2034
Table 22. Segment by Process Node – Global Photoresists Revenue (US$, Mn), 2021-2026
Table 23. Segment by Process Node – Global Photoresists Revenue (US$, Mn), 2027-2034
Table 24. Segment by Process Node – Global Photoresists Sales (Tons), 2021-2026
Table 25. Segment by Process Node – Global Photoresists Sales (Tons), 2027-2034
Table 26. Segment by Application – Global Photoresists Revenue, (US$, Mn), 2025 & 2034
Table 27. Segment by Application – Global Photoresists Revenue, (US$, Mn), 2021-2026
Table 28. Segment by Application – Global Photoresists Revenue, (US$, Mn), 2027-2034
Table 29. Segment by Application – Global Photoresists Sales, (Tons), 2021-2026
Table 30. Segment by Application – Global Photoresists Sales, (Tons), 2027-2034
Table 31. By Region – Global Photoresists Revenue, (US$, Mn), 2025 & 2034
Table 32. By Region – Global Photoresists Revenue, (US$, Mn), 2021-2026
Table 33. By Region – Global Photoresists Revenue, (US$, Mn), 2027-2034
Table 34. By Region – Global Photoresists Sales, (Tons), 2021-2026
Table 35. By Region – Global Photoresists Sales, (Tons), 2027-2034
Table 36. By Country – North America Photoresists Revenue, (US$, Mn), 2021-2026
Table 37. By Country – North America Photoresists Revenue, (US$, Mn), 2027-2034
Table 38. By Country – North America Photoresists Sales, (Tons), 2021-2026
Table 39. By Country – North America Photoresists Sales, (Tons), 2027-2034
Table 40. By Country – Europe Photoresists Revenue, (US$, Mn), 2021-2026
Table 41. By Country – Europe Photoresists Revenue, (US$, Mn), 2027-2034
Table 42. By Country – Europe Photoresists Sales, (Tons), 2021-2026
Table 43. By Country – Europe Photoresists Sales, (Tons), 2027-2034
Table 44. By Region – Asia Photoresists Revenue, (US$, Mn), 2021-2026
Table 45. By Region – Asia Photoresists Revenue, (US$, Mn), 2027-2034
Table 46. By Region – Asia Photoresists Sales, (Tons), 2021-2026
Table 47. By Region – Asia Photoresists Sales, (Tons), 2027-2034
Table 48. By Country – South America Photoresists Revenue, (US$, Mn), 2021-2026
Table 49. By Country – South America Photoresists Revenue, (US$, Mn), 2027-2034
Table 50. By Country – South America Photoresists Sales, (Tons), 2021-2026
Table 51. By Country – South America Photoresists Sales, (Tons), 2027-2034
Table 52. By Country – Middle East & Africa Photoresists Revenue, (US$, Mn), 2021-2026
Table 53. By Country – Middle East & Africa Photoresists Revenue, (US$, Mn), 2027-2034
Table 54. By Country – Middle East & Africa Photoresists Sales, (Tons), 2021-2026
Table 55. By Country – Middle East & Africa Photoresists Sales, (Tons), 2027-2034
Table 56. TOKYO OHKA KOGYO CO., LTD. (TOK) Company Summary
Table 57. TOKYO OHKA KOGYO CO., LTD. (TOK) Photoresists Product Offerings
Table 58. TOKYO OHKA KOGYO CO., LTD. (TOK) Photoresists Sales (Tons), Revenue (US$, Mn) and Average Price (US$/Kg) & (2021-2026)
Table 59. TOKYO OHKA KOGYO CO., LTD. (TOK) Key News & Latest Developments
Table 60. JSR Company Summary
Table 61. JSR Photoresists Product Offerings
Table 62. JSR Photoresists Sales (Tons), Revenue (US$, Mn) and Average Price (US$/Kg) & (2021-2026)
Table 63. JSR Key News & Latest Developments
Table 64. Shin-Etsu Chemical Company Summary
Table 65. Shin-Etsu Chemical Photoresists Product Offerings
Table 66. Shin-Etsu Chemical Photoresists Sales (Tons), Revenue (US$, Mn) and Average Price (US$/Kg) & (2021-2026)
Table 67. Shin-Etsu Chemical Key News & Latest Developments
Table 68. Qnity Company Summary
Table 69. Qnity Photoresists Product Offerings
Table 70. Qnity Photoresists Sales (Tons), Revenue (US$, Mn) and Average Price (US$/Kg) & (2021-2026)
Table 71. Qnity Key News & Latest Developments
Table 72. Fujifilm Company Summary
Table 73. Fujifilm Photoresists Product Offerings
Table 74. Fujifilm Photoresists Sales (Tons), Revenue (US$, Mn) and Average Price (US$/Kg) & (2021-2026)
Table 75. Fujifilm Key News & Latest Developments
Table 76. Sumitomo Chemical Company Summary
Table 77. Sumitomo Chemical Photoresists Product Offerings
Table 78. Sumitomo Chemical Photoresists Sales (Tons), Revenue (US$, Mn) and Average Price (US$/Kg) & (2021-2026)
Table 79. Sumitomo Chemical Key News & Latest Developments
Table 80. Dongjin Semichem Company Summary
Table 81. Dongjin Semichem Photoresists Product Offerings
Table 82. Dongjin Semichem Photoresists Sales (Tons), Revenue (US$, Mn) and Average Price (US$/Kg) & (2021-2026)
Table 83. Dongjin Semichem Key News & Latest Developments
Table 84. Merck KGaA (AZ) Company Summary
Table 85. Merck KGaA (AZ) Photoresists Product Offerings
Table 86. Merck KGaA (AZ) Photoresists Sales (Tons), Revenue (US$, Mn) and Average Price (US$/Kg) & (2021-2026)
Table 87. Merck KGaA (AZ) Key News & Latest Developments
Table 88. Allresist GmbH Company Summary
Table 89. Allresist GmbH Photoresists Product Offerings
Table 90. Allresist GmbH Photoresists Sales (Tons), Revenue (US$, Mn) and Average Price (US$/Kg) & (2021-2026)
Table 91. Allresist GmbH Key News & Latest Developments
Table 92. Futurrex Company Summary
Table 93. Futurrex Photoresists Product Offerings
Table 94. Futurrex Photoresists Sales (Tons), Revenue (US$, Mn) and Average Price (US$/Kg) & (2021-2026)
Table 95. Futurrex Key News & Latest Developments
Table 96. KemLab™ Inc Company Summary
Table 97. KemLab™ Inc Photoresists Product Offerings
Table 98. KemLab™ Inc Photoresists Sales (Tons), Revenue (US$, Mn) and Average Price (US$/Kg) & (2021-2026)
Table 99. KemLab™ Inc Key News & Latest Developments
Table 100. YCCHEM Co., Ltd Company Summary
Table 101. YCCHEM Co., Ltd Photoresists Product Offerings
Table 102. YCCHEM Co., Ltd Photoresists Sales (Tons), Revenue (US$, Mn) and Average Price (US$/Kg) & (2021-2026)
Table 103. YCCHEM Co., Ltd Key News & Latest Developments
Table 104. SK Materials Performance (SKMP) Company Summary
Table 105. SK Materials Performance (SKMP) Photoresists Product Offerings
Table 106. SK Materials Performance (SKMP) Photoresists Sales (Tons), Revenue (US$, Mn) and Average Price (US$/Kg) & (2021-2026)
Table 107. SK Materials Performance (SKMP) Key News & Latest Developments
Table 108. Everlight Chemical Company Summary
Table 109. Everlight Chemical Photoresists Product Offerings
Table 110. Everlight Chemical Photoresists Sales (Tons), Revenue (US$, Mn) and Average Price (US$/Kg) & (2021-2026)
Table 111. Everlight Chemical Key News & Latest Developments
Table 112. Red Avenue Company Summary
Table 113. Red Avenue Photoresists Product Offerings
Table 114. Red Avenue Photoresists Sales (Tons), Revenue (US$, Mn) and Average Price (US$/Kg) & (2021-2026)
Table 115. Red Avenue Key News & Latest Developments
Table 116. Crystal Clear Electronic Material Company Summary
Table 117. Crystal Clear Electronic Material Photoresists Product Offerings
Table 118. Crystal Clear Electronic Material Photoresists Sales (Tons), Revenue (US$, Mn) and Average Price (US$/Kg) & (2021-2026)
Table 119. Crystal Clear Electronic Material Key News & Latest Developments
Table 120. Xuzhou B & C Chemical Company Summary
Table 121. Xuzhou B & C Chemical Photoresists Product Offerings
Table 122. Xuzhou B & C Chemical Photoresists Sales (Tons), Revenue (US$, Mn) and Average Price (US$/Kg) & (2021-2026)
Table 123. Xuzhou B & C Chemical Key News & Latest Developments
Table 124. Xiamen Hengkun New Material Technology Company Summary
Table 125. Xiamen Hengkun New Material Technology Photoresists Product Offerings
Table 126. Xiamen Hengkun New Material Technology Photoresists Sales (Tons), Revenue (US$, Mn) and Average Price (US$/Kg) & (2021-2026)
Table 127. Xiamen Hengkun New Material Technology Key News & Latest Developments
Table 128. Jiangsu Aisen Semiconductor Material Company Summary
Table 129. Jiangsu Aisen Semiconductor Material Photoresists Product Offerings
Table 130. Jiangsu Aisen Semiconductor Material Photoresists Sales (Tons), Revenue (US$, Mn) and Average Price (US$/Kg) & (2021-2026)
Table 131. Jiangsu Aisen Semiconductor Material Key News & Latest Developments
Table 132. Zhuhai Cornerstone Technologies Company Summary
Table 133. Zhuhai Cornerstone Technologies Photoresists Product Offerings
Table 134. Zhuhai Cornerstone Technologies Photoresists Sales (Tons), Revenue (US$, Mn) and Average Price (US$/Kg) & (2021-2026)
Table 135. Zhuhai Cornerstone Technologies Key News & Latest Developments
Table 136. Shanghai Sinyang Semiconductor Materials Company Summary
Table 137. Shanghai Sinyang Semiconductor Materials Photoresists Product Offerings
Table 138. Shanghai Sinyang Semiconductor Materials Photoresists Sales (Tons), Revenue (US$, Mn) and Average Price (US$/Kg) & (2021-2026)
Table 139. Shanghai Sinyang Semiconductor Materials Key News & Latest Developments
Table 140. ShenZhen RongDa Photosensitive Science & Technology Company Summary
Table 141. ShenZhen RongDa Photosensitive Science & Technology Photoresists Product Offerings
Table 142. ShenZhen RongDa Photosensitive Science & Technology Photoresists Sales (Tons), Revenue (US$, Mn) and Average Price (US$/Kg) & (2021-2026)
Table 143. ShenZhen RongDa Photosensitive Science & Technology Key News & Latest Developments
Table 144. SINEVA Company Summary
Table 145. SINEVA Photoresists Product Offerings
Table 146. SINEVA Photoresists Sales (Tons), Revenue (US$, Mn) and Average Price (US$/Kg) & (2021-2026)
Table 147. SINEVA Key News & Latest Developments
Table 148. Guoke Tianji Company Summary
Table 149. Guoke Tianji Photoresists Product Offerings
Table 150. Guoke Tianji Photoresists Sales (Tons), Revenue (US$, Mn) and Average Price (US$/Kg) & (2021-2026)
Table 151. Guoke Tianji Key News & Latest Developments
Table 152. Jiangsu Nata Opto-electronic Material Company Summary
Table 153. Jiangsu Nata Opto-electronic Material Photoresists Product Offerings
Table 154. Jiangsu Nata Opto-electronic Material Photoresists Sales (Tons), Revenue (US$, Mn) and Average Price (US$/Kg) & (2021-2026)
Table 155. Jiangsu Nata Opto-electronic Material Key News & Latest Developments
Table 156. PhiChem Company Summary
Table 157. PhiChem Photoresists Product Offerings
Table 158. PhiChem Photoresists Sales (Tons), Revenue (US$, Mn) and Average Price (US$/Kg) & (2021-2026)
Table 159. PhiChem Key News & Latest Developments
Table 160. NIPPON STEEL Chemical & Material Company Summary
Table 161. NIPPON STEEL Chemical & Material Photoresists Product Offerings
Table 162. NIPPON STEEL Chemical & Material Photoresists Sales (Tons), Revenue (US$, Mn) and Average Price (US$/Kg) & (2021-2026)
Table 163. NIPPON STEEL Chemical & Material Key News & Latest Developments
Table 164. Jiangsu Yoke Technology Company Summary
Table 165. Jiangsu Yoke Technology Photoresists Product Offerings
Table 166. Jiangsu Yoke Technology Photoresists Sales (Tons), Revenue (US$, Mn) and Average Price (US$/Kg) & (2021-2026)
Table 167. Jiangsu Yoke Technology Key News & Latest Developments
Table 168. DNP Fine Chemicals Company Summary
Table 169. DNP Fine Chemicals Photoresists Product Offerings
Table 170. DNP Fine Chemicals Photoresists Sales (Tons), Revenue (US$, Mn) and Average Price (US$/Kg) & (2021-2026)
Table 171. DNP Fine Chemicals Key News & Latest Developments
Table 172. Chimei Company Summary
Table 173. Chimei Photoresists Product Offerings
Table 174. Chimei Photoresists Sales (Tons), Revenue (US$, Mn) and Average Price (US$/Kg) & (2021-2026)
Table 175. Chimei Key News & Latest Developments
Table 176. Daxin Materials Company Summary
Table 177. Daxin Materials Photoresists Product Offerings
Table 178. Daxin Materials Photoresists Sales (Tons), Revenue (US$, Mn) and Average Price (US$/Kg) & (2021-2026)
Table 179. Daxin Materials Key News & Latest Developments
Table 180. Jiangsu Kuangshun Company Summary
Table 181. Jiangsu Kuangshun Photoresists Product Offerings
Table 182. Jiangsu Kuangshun Photoresists Sales (Tons), Revenue (US$, Mn) and Average Price (US$/Kg) & (2021-2026)
Table 183. Jiangsu Kuangshun Key News & Latest Developments
Table 184. Eternal Material Technology Company Summary
Table 185. Eternal Material Technology Photoresists Product Offerings
Table 186. Eternal Material Technology Photoresists Sales (Tons), Revenue (US$, Mn) and Average Price (US$/Kg) & (2021-2026)
Table 187. Eternal Material Technology Key News & Latest Developments
Table 188. Samsung SDI Company Summary
Table 189. Samsung SDI Photoresists Product Offerings
Table 190. Samsung SDI Photoresists Sales (Tons), Revenue (US$, Mn) and Average Price (US$/Kg) & (2021-2026)
Table 191. Samsung SDI Key News & Latest Developments
Table 192. Taiyo Ink MFG Company Summary
Table 193. Taiyo Ink MFG Photoresists Product Offerings
Table 194. Taiyo Ink MFG Photoresists Sales (Tons), Revenue (US$, Mn) and Average Price (US$/Kg) & (2021-2026)
Table 195. Taiyo Ink MFG Key News & Latest Developments
Table 196. Asahi Kasei Company Summary
Table 197. Asahi Kasei Photoresists Product Offerings
Table 198. Asahi Kasei Photoresists Sales (Tons), Revenue (US$, Mn) and Average Price (US$/Kg) & (2021-2026)
Table 199. Asahi Kasei Key News & Latest Developments
Table 200. Eternal Materials Company Summary
Table 201. Eternal Materials Photoresists Product Offerings
Table 202. Eternal Materials Photoresists Sales (Tons), Revenue (US$, Mn) and Average Price (US$/Kg) & (2021-2026)
Table 203. Eternal Materials Key News & Latest Developments
Table 204. Resonac Company Summary
Table 205. Resonac Photoresists Product Offerings
Table 206. Resonac Photoresists Sales (Tons), Revenue (US$, Mn) and Average Price (US$/Kg) & (2021-2026)
Table 207. Resonac Key News & Latest Developments
Table 208. Chang Chun Group Company Summary
Table 209. Chang Chun Group Photoresists Product Offerings
Table 210. Chang Chun Group Photoresists Sales (Tons), Revenue (US$, Mn) and Average Price (US$/Kg) & (2021-2026)
Table 211. Chang Chun Group Key News & Latest Developments
Table 212. Kolon Industries Company Summary
Table 213. Kolon Industries Photoresists Product Offerings
Table 214. Kolon Industries Photoresists Sales (Tons), Revenue (US$, Mn) and Average Price (US$/Kg) & (2021-2026)
Table 215. Kolon Industries Key News & Latest Developments
Table 216. Photoresists Capacity of Key Manufacturers in Global Market, 2024-2026 (Tons)
Table 217. Global Photoresists Capacity Market Share of Key Manufacturers, 2024-2026
Table 218. Global Photoresists Production by Region, 2021-2026 (Tons)
Table 219. Global Photoresists Production by Region, 2027-2034 (Tons)
Table 220. Photoresists Market Opportunities & Trends in Global Market
Table 221. Photoresists Market Drivers in Global Market
Table 222. Photoresists Market Restraints in Global Market
Table 223. Photoresists Raw Materials
Table 224. Photoresists Raw Materials Suppliers in Global Market
Table 225. Typical Photoresists Downstream
Table 226. Photoresists Downstream Clients in Global Market
Table 227. Photoresists Distributors and Sales Agents in Global Market

List of Figures
Figure 1. Photoresists Product Picture
Figure 2. Photoresists Segment by Imaging Mechanism in 2025
Figure 3. Photoresists Segment by Type in 2025
Figure 4. Photoresists Segment by Process Node in 2025
Figure 5. Photoresists Segment by Application in 2025
Figure 6. Global Photoresists Market Overview: 2025
Figure 7. Key Caveats
Figure 8. Global Photoresists Market Size: 2025 VS 2034 (US$, Mn)
Figure 9. Global Photoresists Revenue: 2021-2034 (US$, Mn)
Figure 10. Photoresists Sales in Global Market: 2021-2034 (Tons)
Figure 11. The Top 3 and 5 Players Market Share by Photoresists Revenue in 2025
Figure 12. Segment by Imaging Mechanism – Global Photoresists Revenue, (US$, Mn), 2025 & 2034
Figure 13. Segment by Imaging Mechanism – Global Photoresists Revenue Market Share, 2021-2034
Figure 14. Segment by Imaging Mechanism – Global Photoresists Sales Market Share, 2021-2034
Figure 15. Segment by Imaging Mechanism – Global Photoresists Price (US$/Kg), 2021-2034
Figure 16. Segment by Type – Global Photoresists Revenue, (US$, Mn), 2025 & 2034
Figure 17. Segment by Type – Global Photoresists Revenue Market Share, 2021-2034
Figure 18. Segment by Type – Global Photoresists Sales Market Share, 2021-2034
Figure 19. Segment by Type – Global Photoresists Price (US$/Kg), 2021-2034
Figure 20. Segment by Process Node – Global Photoresists Revenue, (US$, Mn), 2025 & 2034
Figure 21. Segment by Process Node – Global Photoresists Revenue Market Share, 2021-2034
Figure 22. Segment by Process Node – Global Photoresists Sales Market Share, 2021-2034
Figure 23. Segment by Process Node – Global Photoresists Price (US$/Kg), 2021-2034
Figure 24. Segment by Application – Global Photoresists Revenue, (US$, Mn), 2025 & 2034
Figure 25. Segment by Application – Global Photoresists Revenue Market Share, 2021-2034
Figure 26. Segment by Application – Global Photoresists Sales Market Share, 2021-2034
Figure 27. Segment by Application -Global Photoresists Price (US$/Kg), 2021-2034
Figure 28. By Region – Global Photoresists Revenue, (US$, Mn), 2025 & 2034
Figure 29. By Region – Global Photoresists Revenue Market Share, 2021 VS 2025 VS 2034
Figure 30. By Region – Global Photoresists Revenue Market Share, 2021-2034
Figure 31. By Region – Global Photoresists Sales Market Share, 2021-2034
Figure 32. By Country – North America Photoresists Revenue Market Share, 2021-2034
Figure 33. By Country – North America Photoresists Sales Market Share, 2021-2034
Figure 34. United States Photoresists Revenue, (US$, Mn), 2021-2034
Figure 35. Canada Photoresists Revenue, (US$, Mn), 2021-2034
Figure 36. Mexico Photoresists Revenue, (US$, Mn), 2021-2034
Figure 37. By Country – Europe Photoresists Revenue Market Share, 2021-2034
Figure 38. By Country – Europe Photoresists Sales Market Share, 2021-2034
Figure 39. Germany Photoresists Revenue, (US$, Mn), 2021-2034
Figure 40. France Photoresists Revenue, (US$, Mn), 2021-2034
Figure 41. U.K. Photoresists Revenue, (US$, Mn), 2021-2034
Figure 42. Italy Photoresists Revenue, (US$, Mn), 2021-2034
Figure 43. Russia Photoresists Revenue, (US$, Mn), 2021-2034
Figure 44. Nordic Countries Photoresists Revenue, (US$, Mn), 2021-2034
Figure 45. Benelux Photoresists Revenue, (US$, Mn), 2021-2034
Figure 46. By Region – Asia Photoresists Revenue Market Share, 2021-2034
Figure 47. By Region – Asia Photoresists Sales Market Share, 2021-2034
Figure 48. China Photoresists Revenue, (US$, Mn), 2021-2034
Figure 49. Japan Photoresists Revenue, (US$, Mn), 2021-2034
Figure 50. South Korea Photoresists Revenue, (US$, Mn), 2021-2034
Figure 51. Southeast Asia Photoresists Revenue, (US$, Mn), 2021-2034
Figure 52. India Photoresists Revenue, (US$, Mn), 2021-2034
Figure 53. By Country – South America Photoresists Revenue Market Share, 2021-2034
Figure 54. By Country – South America Photoresists Sales, Market Share, 2021-2034
Figure 55. Brazil Photoresists Revenue, (US$, Mn), 2021-2034
Figure 56. Argentina Photoresists Revenue, (US$, Mn), 2021-2034
Figure 57. By Country – Middle East & Africa Photoresists Revenue, Market Share, 2021-2034
Figure 58. By Country – Middle East & Africa Photoresists Sales, Market Share, 2021-2034
Figure 59. Turkey Photoresists Revenue, (US$, Mn), 2021-2034
Figure 60. Israel Photoresists Revenue, (US$, Mn), 2021-2034
Figure 61. Saudi Arabia Photoresists Revenue, (US$, Mn), 2021-2034
Figure 62. UAE Photoresists Revenue, (US$, Mn), 2021-2034
Figure 63. Global Photoresists Production Capacity (Tons), 2021-2034
Figure 64. The Percentage of Production Photoresists by Region, 2025 VS 2034
Figure 65. Photoresists Industry Value Chain
Figure 66. Marketing Channels