1.6T Optical Modules Market Insights
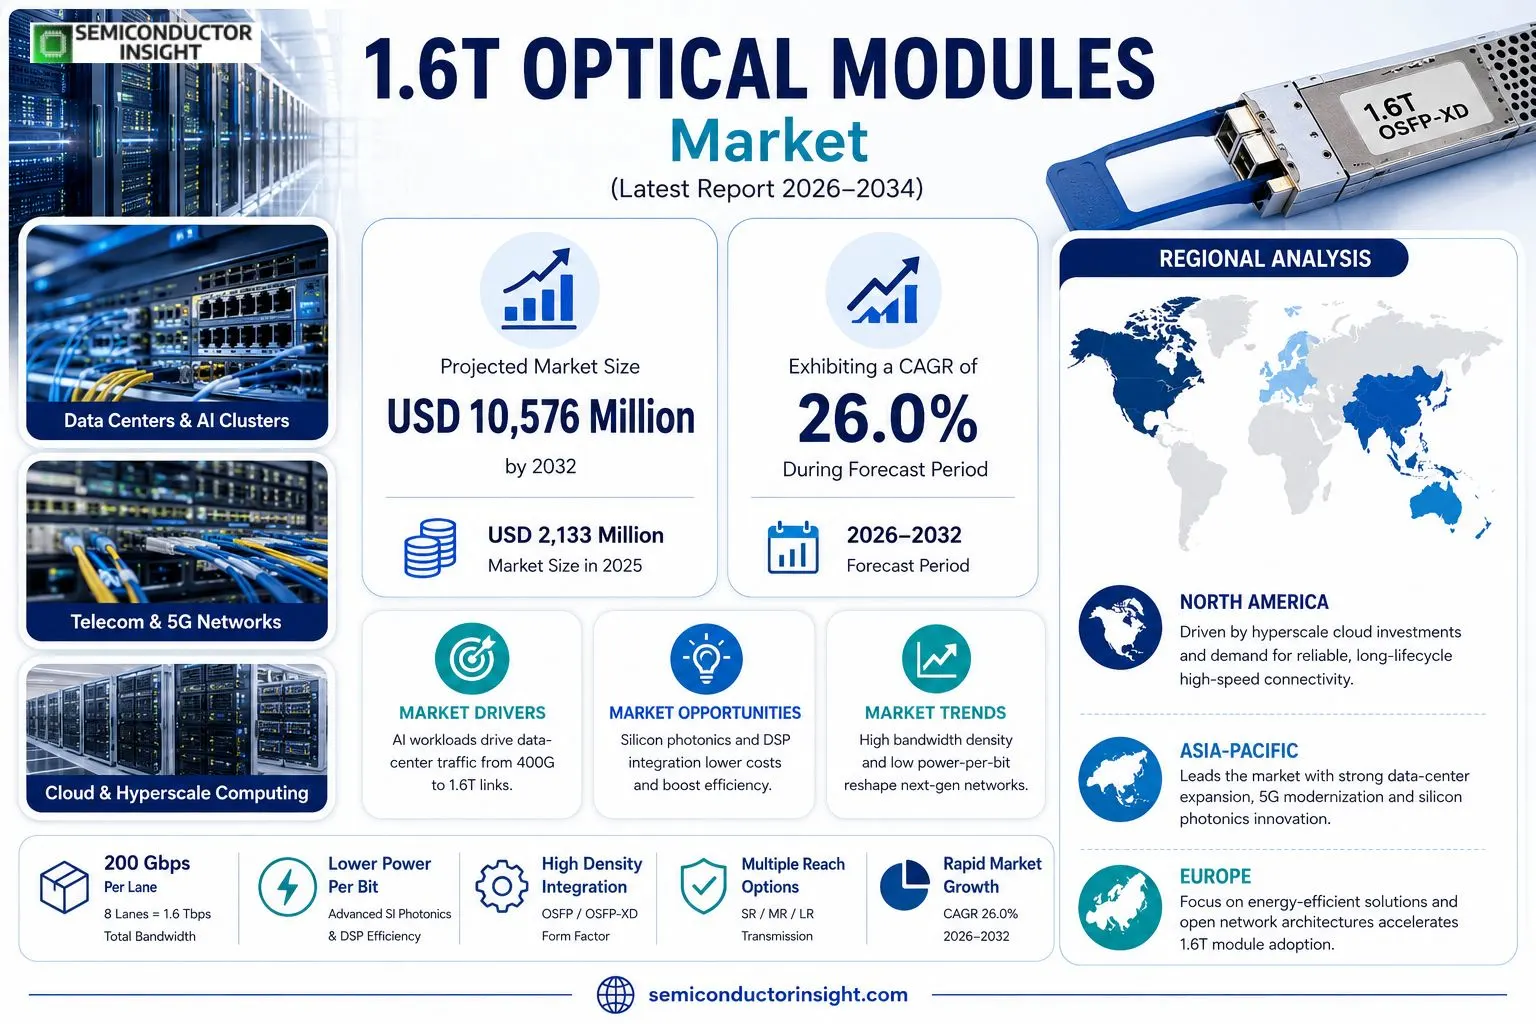
1.6T Optical Modules market size was valued at USD 2,133 million in 2025 and expands to USD 10,576 million by 2032, reflecting a CAGR of 26.0% over the forecast horizon.
1.6T optical modules are high‑speed communication devices designed for data‑center environments where a single channel delivers a total bandwidth of 1,600 Gbps (200 Gbit/s × 8 lanes). They typically employ OSFP or OSFP‑XD packaging and integrate high‑speed DSP chips together with silicon‑photonic or EML lasers and photo‑detectors, enabling short‑, medium‑ and long‑distance transmission for switches, servers and AI compute clusters.The upward trajectory stems from mounting AI model training workloads, which push data‑center traffic from 400G toward 800G and now 1.6T links; manufacturers are responding with tighter power‑per‑bit efficiencies and higher bandwidth density per rack. Concurrently, advances in silicon photonics and DSP integration lower component costs, while cloud providers such as NVIDIA, Google Cloud and AWS accelerate adoption across GPU clusters and supercomputing sites.
MARKET DRIVERS
Rising Bandwidth Requirements in Hyperscale Data Centers
The surge in AI‑enabled workloads and real‑time analytics is compelling hyperscale operators to upgrade to 1.6T optical modules. Capacity‑intensive applications now routinely generate terabytes of traffic per second, and the legacy 100G or 200G transceivers cannot keep pace. By deploying 1.6T modules, data centers achieve a denser lane count, which translates into lower power per bit and a reduced footprintcritical factors when floor space is at a premium.
Co‑Packaging of Optics with ASICs
Silicon‑photonic co‑packaged optics are transitioning from pilot projects to volume production. Integrating the transceiver directly onto the ASIC die shortens the electrical path, cuts latency, and improves signal integrity for 1.6T speeds. This architectural shift is being championed by leading chip vendors, creating a cascade effect that accelerates module adoption across the supply chain.
➤ Manufacturers that secure early‑stage co‑packaged designs are positioning themselves to capture a disproportionate share of the upcoming spend.
Combined, these forces are reshaping the architecture of high‑performance networks. Enterprises that lag in adopting 1.6T optical modules risk higher OPEX as they must provision additional equipment to meet the same throughput, while early adopters can lock in lower total cost of ownership.
MARKET CHALLENGES
Cost Parity with Established 400G Solutions
Although 1.6T Optical Modules offer compelling performance, their bill‑of‑materials remains higher than mature 400G platforms. The premium stems from limited wafer capacity for silicon photonics and the need for custom driver ICs. As a result, price‑sensitive operators hesitate to replace existing inventory, slowing market momentum.
Other Challenges
Supply Chain Complexity
The production flow spans multiple geographiessilicon‑photonic wafers in Taiwan, driver ASICs in the United States, and package assembly in Europe. Any disruption, such as a logistics bottleneck or raw‑material shortage, propagates downstream and can delay large‑scale deployments.
MARKET RESTRAINTS
Limited Legacy Infrastructure Compatibility
Many carrier networks still rely on chassis and backplane designs that cannot accommodate the electrical and thermal profiles of 1.6T modules. Retrofitting these assets demands substantial engineering effort and capital expenditure, a deterrent for operators focused on short‑term budget cycles.Furthermore, the standards ecosystem for 1.6T interfaces is still coalescing. Without a universally accepted specification, OEMs must navigate divergent testing regimes, creating an additional layer of risk that dampens aggressive rollout plans.Lastly, regulatory certifications for high‑power optical devices can prolong time‑to‑market in regions with strict electromagnetic compliance requirements, adding to the overall postponement of widespread adoption.
MARKET OPPORTUNITIES
Emergence of 400G+ Port Density Strategies
Network architects are designing chassis that house multiple 1.6T ports within a single line card, effectively delivering 6.4T of aggregate bandwidth per slot. This high‑density approach opens avenues for telecom operators to double capacity without expanding physical rack count, a compelling proposition for metro and edge deployments.In parallel, software‑defined networking (SDN) platforms are beginning to expose native support for 1.6T optical interfaces. By coupling programmable control planes with ultra‑high‑speed transceivers, service providers can dynamically allocate bandwidth, unlocking new revenue streams from premium, low‑latency services.Finally, the ongoing push for green data center initiatives aligns with the energy‑efficiency gains offered by 1.6T modules. Lower power per bit directly supports sustainability targets, positioning the 1.6T Optical Modules Market as a strategic choice for environmentally conscious enterprises.
1.6T Optical Modules Market Trends
AI‑Centric Data‑Center Upgrade Cycle
The adoption curve for 1.6T optical modules is now intersecting the point where AI training clusters require more than 1 Tbps per rack. In 2025 the sector produced roughly 778 000 units, each priced near US$3 000, while the total manufacturing capacity approached one million units. This surplus of capacity, combined with a 32 % gross‑margin benchmark, gives suppliers the flexibility to pursue aggressive price‑performance improvements without eroding profitability. The technology’s eight‑lane 200 G architecture, packaged mainly in OSFP or OSFP‑XD formats, enables short‑ to medium‑distance links that can replace legacy 400 G and 800 G equipment. Because power per bit drops noticeably when bandwidth density climbs, operators in hyperscale cloud facilities experience lower OPEX on cooling and power distribution. The shift is not merely technical; it reflects a strategic response to the exponential compute demand generated by generative‑AI workloads, where network bottlenecks would otherwise throttle model‑training throughput.
Other Trends
Supply‑Chain Realignment Across the Value Chain
The upstream tier now concentrates on silicon‑photonic driver chips, high‑speed DSPs, and tunable lasers that can sustain 200 G per lane. Midstream integrators are standardising on advanced wafer‑level packaging to squeeze more functionality into the OSFP‑XD footprint, a move that reduces bill‑of‑materials and accelerates time‑to‑market. Downstream, cloud giants such as NVIDIA, Google Cloud and AWS are specifying 1.6T modules for GPU‑cluster interconnects, which in turn pushes module makers to certify products for multi‑kilometer transmission distances (DR4, FR4). This “chip‑dominance, device‑support, module‑integration, cloud‑driven” configuration creates a tightly coupled ecosystem where a delay in any segment reverberates through the whole chain, making supply‑chain resilience a competitive lever.
Competitive Landscape and Differentiation
Among the players, InnoLight, Accelink, Solis Optoelectronics and Lumentum have each secured a double‑digit share of 2025 revenues, chiefly by leveraging proprietary silicon‑photonic platforms that lower insertion loss. Cisco and Nokia differentiate through bundled solutions that pair optical modules with networking ASICs, offering customers a single‑vendor upgrade path. Companies that have invested heavily in OSFP‑XD tooling report faster ramp‑up to volume, allowing them to capture early‑adopter orders from AI‑focused data‑center builders. At the same time, a handful of newcomers are exploring coherent‑optics variants that could bypass the current electrical‑DSP bottleneck, hinting at a possible technology inflection point before 2030. For investors and strategists, the prevailing narrative is that success will hinge on the ability to align silicon‑photonic innovation with the scaling cadence of AI workloads, while maintaining cost‑effective mass production.
COMPETITIVE LANDSCAPEKey Industry Players
Competitive Overview of the 1.6T Optical Modules Industry
The upper tier of the market is concentrated around a handful of firms that command both advanced silicon‑photonic design capabilities and deep integration expertise. InnoLight Technology, Eoptolink Technology and Accelink Technologies together account for a sizeable share of the 2025 revenue pool, leveraging proprietary DSP engines and high‑power‑efficiency laser sources to meet the demanding bandwidth‑per‑rack targets of AI‑centric data centers. Cisco Systems and Lumentum Holdings complement these leaders with extensive sales networks and established relationships in telecommunications backbones, enabling rapid adoption of OSFP‑XD packaging formats. Broadcom and Marvell Technology add to the competitive pressure through aggressive ASIC‑centric roadmaps that embed optical‑module functions directly into compute platforms, a strategy that tightens margins but accelerates time‑to‑market for hyperscale operators.Beyond the dominant quartet, a diverse set of niche players enriches the ecosystem by focusing on specialized architectures or regional demand. OpenLight Photonics and Sumitomo Electric Industries have built credibility around coherent‑light solutions for long‑distance transmission, while Samsung Electronics and Foxconn Interconnect Technology target high‑volume OSFP production for Asian cloud operators. Companies such as Celestica, Coherent Corp and Universal Scientific Industrial (USI) carve out roles in advanced packaging services and custom‑design contracts, allowing end‑users to tailor module form factors to unique rack‑density constraints. The breadth of participants creates a resilient supply chain where upstream silicon‑photonic IP can be matched with mid‑stream manufacturing agility, a combination essential for sustaining the swift scale‑up projected through 2028.
List of Key Optical Modules Companies Profiled
- InnoLight Technology
- Eoptolink Technology
- Accelink Technologies
- Solis Optoelectronics
- Nokia Corporation
- Sont Technologies
- Cisco Systems
- Lumentum Holdings
- Broadcom Inc.
- Marvell Technology
- OpenLight Photonics
- Sumitomo Electric Industries
- Samsung Electronics
- Foxconn Interconnect Technology
- Celestica
- Coherent Corp
- Universal Scientific Industrial (USI)
Segment Analysis:
| Segment Category | Sub-Segments | Key Insights |
| By Type |
|
Silicon Photonics is emerging as the preferred technology because it offers seamless integration with existing silicon manufacturing ecosystems and supports high‑density routing.
|
| By Application |
|
AI Training Clusters represent the most dynamic demand driver, as generative‑AI workloads push bandwidth per rack to unprecedented levels.
|
| By End User |
|
Cloud Service Providers drive the large‑scale rollout because they control the majority of hyperscale infrastructure upgrades.
|
| By Packaging Form |
|
OSFP remains the dominant form factor because it accommodates the eight‑lane architecture while providing thermal management advantage.
|
| By Transmission Distance |
|
DR4 / DR8 segments are gaining traction as data‑center designers prioritize ultra‑short reach interconnects for rack‑level aggregation.
|
Regional Analysis: 1.6T Optical Modules Market
Asia-Pacific
Tier‑1 fabs in Taiwan and Singapore dominate wafer supply, translating into shorter lead times for high‑density assemblies. This concentration drives price competitiveness while reinforcing regional supply‑chain resilience for carriers seeking uninterrupted module availability.
The early embrace of PAM4 and emerging DP‑QPSK signalling formats reflects local operators’ appetite for pushing per‑lane throughput without proliferating fiber count, a tactic that streamlines network upgrades across densely populated metros.
Governmental subsidies for fiber‑to‑the‑home and next‑generation mobile backhaul spur demand for 1.6T modules, compelling vendors to align product roadmaps with national broadband objectives and timeline commitments.
A robust pool of photonic engineers nurtured by regional universities accelerates R&D cycles, giving local firms a creative edge in packaging innovations that improve insertion loss and module density.
North America
North America remains a mature market where enterprise cloud providers anchor demand for 1.6T Optical Modules. The focus here shifts from sheer volume to reliability and lifecycle support, prompting operators to favor long‑term service agreements with established OEMs. Regulatory scrutiny on data‑privacy drives investments in secure, tamper‑evident transceivers, while the gradual rollout of 400G/800G upgrades creates a niche for backward‑compatible modules that safeguard existing infrastructure investment. Strategic partnerships between U.S. hyperscale firms and niche photonic specialists are fostering a hybrid supply model that balances innovation speed with proven performance.
Europe
European telecoms are navigating a transition toward open‑RAN architectures, and the 1.6T Optical Modules Market is adjusting to the resulting diversification of equipment vendors. Operators in Germany and the Nordics prioritize sustainability metrics, integrating modules that deliver lower watts per bit to meet EU energy directives. Cross‑border fiber initiatives, such as the Trans‑Euro‑Fiber consortium, amplify the need for standardized high‑capacity interfaces, nudging regional manufacturers toward collaborative standards‑development efforts. The market’s trajectory is shaped by a cautious capital‑allocation mindset that values incremental upgrades over wholesale network refreshes.
South America
In South America, emerging data‑center projects in Brazil and Chile are the primary catalyst for 1.6T Optical Modules adoption. Limited existing fiber backbone forces providers to adopt high‑capacity modules that maximize throughput per strand, thereby extending network reach without costly trenching. Local carriers are also experimenting with blended procurement strategies, coupling imported high‑performance modules with domestically assembled chassis to lower overall cost of ownership. Market growth is tempered by fiscal constraints, making vendor financing options and flexible payment terms pivotal in securing contract wins.
Middle East & Africa
The Middle East & Africa region exhibits a dichotomy: wealthier Gulf states accelerate digital transformation initiatives, while many African nations prioritize basic broadband expansion. In the Gulf, sovereign wealth funds allocate capital to offshore data‑center hubs that require 1.6T Optical Modules capable of handling trans‑regional traffic spikes. Conversely, African operators focus on modular solutions that can be scaled as fiber networks mature, emphasizing ruggedized designs suited for diverse climatic conditions. The prevailing business implication is a bifurcated supply chain, where premium modules serve high‑value corridors and cost‑optimized variants support nascent deployments.
Report Scope
This market research report provides a comprehensive analysis of the 1.6T Optical Modules Market , covering the forecast period 2026–2034. It offers detailed insights into market dynamics, technological advancements, competitive landscape, and key trends shaping the industry.
Key focus areas of the report include:
- Market Overview: The report begins with an overview outlining its current market scenario, key growth indicators, and industry transformation drivers. It discusses macroeconomic factors, demand–supply balance, regulatory landscape, and the strategic role of semiconductors in powering advancements across industries such as automotive, telecommunications, consumer electronics, and industrial automation.
- Market Size & Forecast: Historical data and future projections for revenue, unit shipments, and market value across major regions and segments.
- Segmentation Analysis: Detailed breakdown by product type, technology, application, and end-user industry to identify high-growth segments and investment opportunities.
- Regional Insights: Insights into market performance across North America, Europe, Asia-Pacific, Latin America, and the Middle East & Africa, including country-level analysis where relevant.
- Competitive Landscape: Profiles of leading market participants, including their product offerings, R&D focus, manufacturing capacity, pricing strategies, and recent developments such as mergers, acquisitions, and partnerships.
- Technology Trends & Innovation: Assessment of emerging technologies, integration of AI/IoT, semiconductor design trends, fabrication techniques, and evolving industry standards.
- Market Drivers & Restraints: Evaluation of factors driving market growth along with challenges, supply chain constraints, regulatory issues, and market-entry barriers.
- Stakeholder Insights: Insights for component suppliers, OEMs, system integrators, investors, and policymakers regarding the evolving ecosystem and strategic opportunities.
Primary and secondary research methods are employed, including interviews with industry experts, data from verified sources, and real-time market intelligence to ensure the accuracy and reliability of the insights presented.
FREQUENTLY ASKED QUESTIONS:
What is the current market size of 1.6T Optical Modules Market?
-> 1.6T Optical Modules Market was valued at USD 2133 million in 2025 and is expected to reach USD 10576 million by 2032 with a CAGR of 26.0% during the forecast period.
Which key companies operate in 1.6T Optical Modules Market?
-> Key players include InnoLight Technology, Eoptolink Technology, Accelink Technologies, Solis Optoelectronics, Nokia Corporation, Sont Technologies, Cisco Systems, Lumentum Holdings, Broadcom Inc., Marvell Technology, among others.
What are the key growth drivers?
-> Key growth drivers include explosive demand for AI model training, data center traffic upgrades from 400G/800G to 1.6T, need for higher bandwidth density per rack, and power‑efficiency improvements.
Which region dominates the market?
-> Asia-Pacific holds the largest share, with China being the primary contributor.
What are the emerging trends?
-> Emerging trends include adoption of silicon photonics, OSFP‑XD packaging, integration of high‑speed DSP chips, and the roadmap toward 3.2T and CPO technologies.

Get Sample Report PDF for Exclusive Insights
Report Sample Includes
- Table of Contents
- List of Tables & Figures
- Charts, Research Methodology, and more...
 Download Sample Report PDF