Key Statistics
Key Takeaways
- IT & Telecommunication is identified by the source page as the largest application waste stream, reflecting India’s expanding installed base of computers, smartphones, networking devices and enterprise electronics, while mobile devices are described as the fastest-growing contributor.
- Formal processing is expanding quickly. Government data show India generated about 1.398 million metric tonnes of e-waste in FY2024–25 and reported 70.71% collected, dismantled and recycled/disposed, up from 61.94% in FY2023–24.
- North India is the largest formal processing region in this analysis because Uttar Pradesh, Haryana and Uttarakhand together processed the majority of registered e-waste volume in FY2024–25; Uttar Pradesh alone processed about 388,160 MT.
- EPR is reshaping market economics. The E-Waste (Management) Rules, 2022 require producers, manufacturers, recyclers and refurbishers to operate through CPCB’s digital system, while EPR certificates create a monetized compliance link between producers and registered recyclers.
- The opportunity extends beyond conventional electronics. NITI Aayog’s January 2026 circular-economy report projects Indian e-waste generation increasing from 6.19 million tonnes in 2024 to 14 million tonnes by 2030, and solar-panel waste is also emerging as a large future stream.
India E-Waste Market Overview
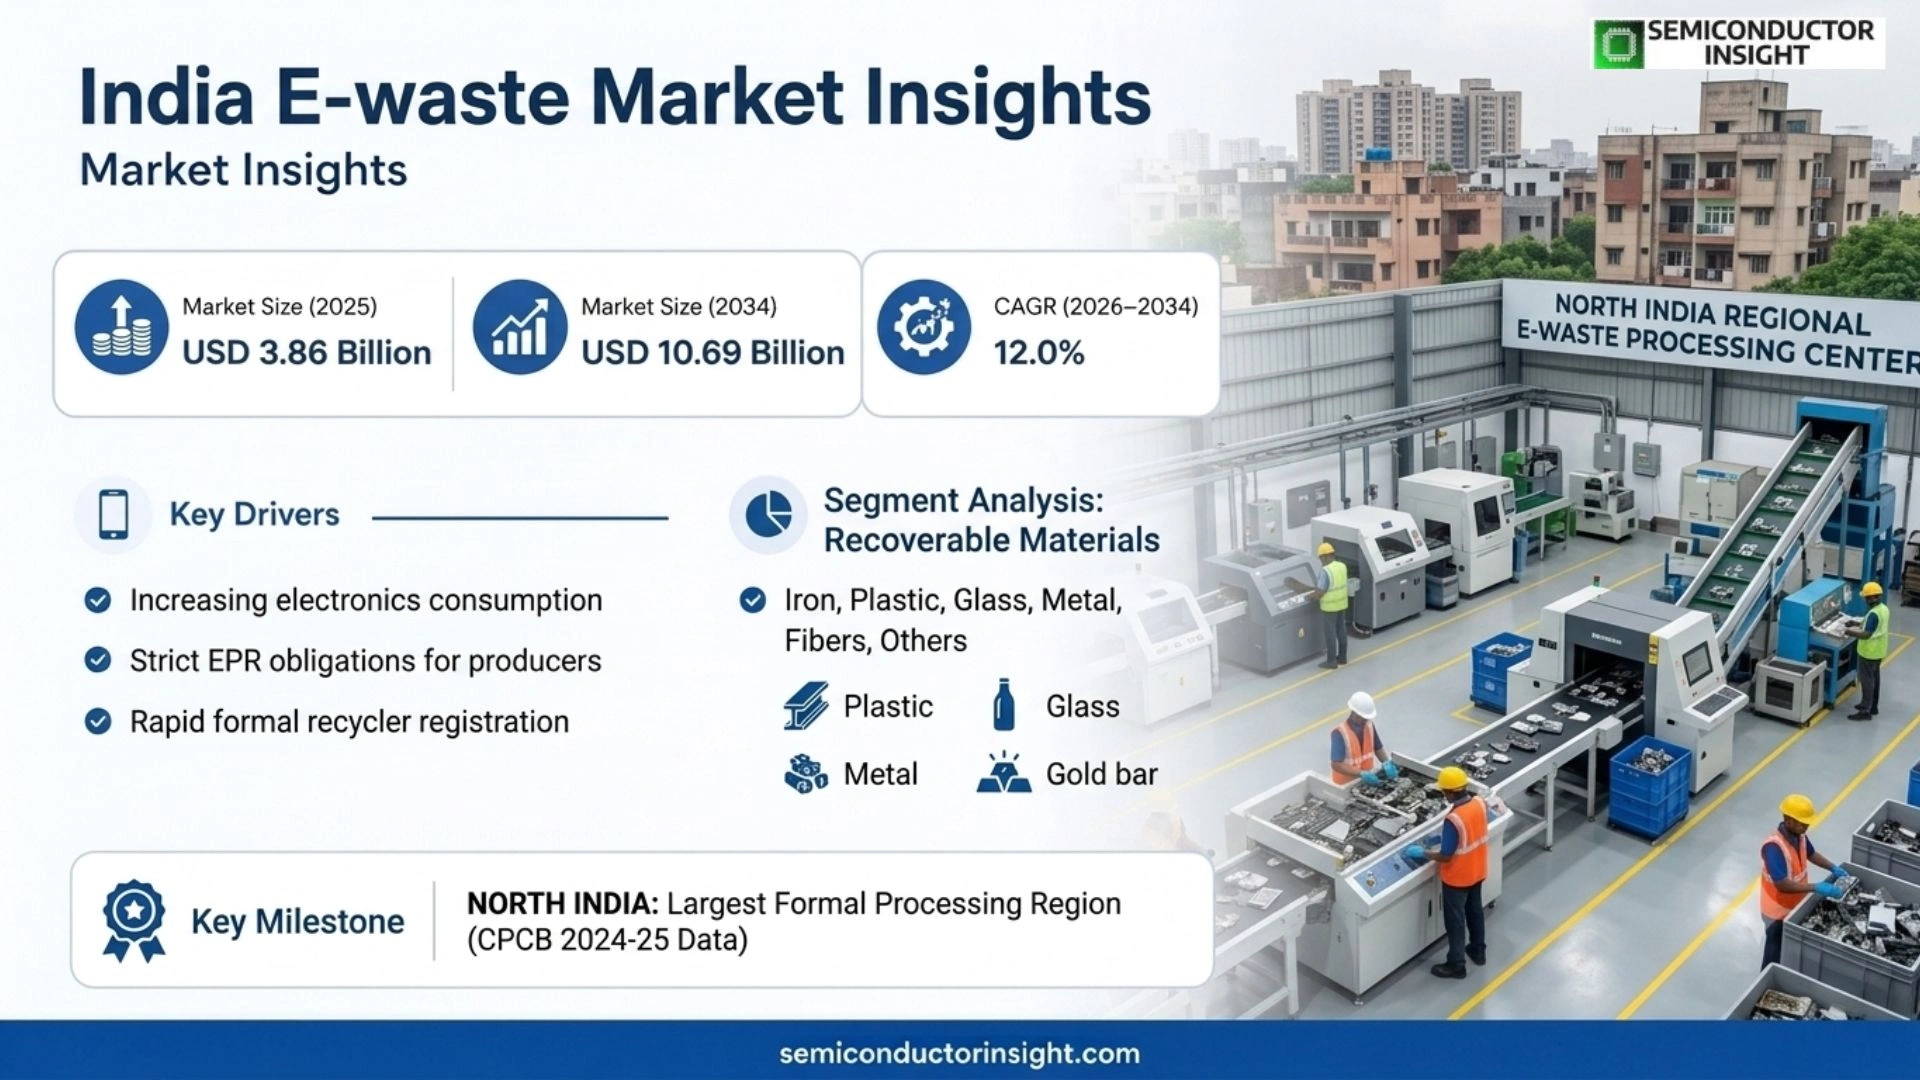
India e-waste market is rebased to USD 3.86 billion in 2025, increases to an estimated USD 4.33 billion in 2026, and is projected to reach USD 10.69 billion by 2034. The selected source-page size anchors imply a 12.0% CAGR during 2026–2034. North India is the largest formal processing region in 2025 based on CPCB FY2024–25 state processing data, while current demand is being reshaped by higher electronics consumption, producer EPR obligations, rapid formal-recycler registration, urban mining of valuable metals, informal-sector formalization and new circular-economy standards for collection, dismantling and recycling.
India’s e-waste market covers organized collection, dismantling, material recovery, recycling, refurbishment support and compliance services associated with discarded electrical and electronic equipment. Revenue is created through a combination of treatment fees, producer-responsibility contracts, EPR certificate economics and recovery of ferrous metals, copper, aluminum, precious metals, plastics, glass and other reusable fractions. The sector therefore behaves differently from a conventional product market because profitability depends on both feedstock access and recoverable material value.
The formal market is being reshaped by the E-Waste (Management) Rules, 2022, which have been in force since April 2023. The rules move producers, manufacturers, recyclers and refurbishers onto a centralized registration and EPR framework. Government data reported in July 2025 show national e-waste generation of 1,397,955.59 MT in FY2024–25 and a 70.71% reported collection/dismantling/recycling-disposal rate, demonstrating that the organized system is absorbing a larger share of the measured waste stream.
Long-term growth is also linked to India’s electronics and circular-economy policy. NITI Aayog’s January 2026 report projects e-waste generation rising from 6.19 million tonnes in 2024 to 14 million tonnes by 2030 and highlights critical-material recovery as an economic opportunity. MeitY’s 2025–26 annual report describes a Centre of Excellence at C-MET Hyderabad, a one-tonne-per-day PCB recycling pilot and more than 3,000 professionals trained in environmentally sound e-waste handling, indicating deeper technology and skills investment.
Segment Analysis: By Type
The source page segments the market by recoverable material into Iron, Plastic, Glass, Metal, Fibers and Others. These labels are preserved exactly even though they represent material output fractions rather than categories of discarded electronic equipment. Commercial value differs sharply by fraction because metals and precious-metal-bearing printed circuit boards can subsidize the cost of safely treating low-value plastics, glass and hazardous residues.
| Type | Technical / commercial role | Market position |
|---|---|---|
| Iron | Ferrous steel is recovered from cabinets, appliance housings, frames, motors and structural components. It is typically separated through manual dismantling followed by magnetic sorting or downstream shredding. Unit value is low relative to copper or precious metals, but high mass volumes make efficient separation important to plant throughput and transport economics. | Stable bulk-recovery segment. Margin depends on scrap-steel pricing and processing efficiency rather than proprietary chemistry. Large household appliances and industrial equipment generate significant ferrous fractions, so recyclers with mechanized dismantling can recover volume efficiently while minimizing contamination of higher-value streams. |
| Plastic | Electronic products contain ABS, HIPS, polycarbonate blends, PVC and other plastics that may include flame retardants, fillers or contamination. Sorting by polymer and hazardous additive is necessary before reuse. Clean engineering plastics can be recycled into secondary material, but mixed or brominated plastics may require more controlled treatment and can carry disposal cost. | Large-volume but margin-sensitive fraction. Economics improve where recyclers can identify polymer type, remove metal inserts and sell clean streams to compounders. Regulatory pressure on hazardous substances and growing circular-economy procurement could increase demand for traceable recycled engineering plastics, but contaminated material remains challenging. |
| Glass | Glass appears in displays, lighting products, screens and other electronics. Older CRT and specialty glass can contain lead or other hazardous constituents, while flat-panel products require separation of coatings and mixed materials. Recovery therefore depends on product type and the availability of downstream applications willing to accept the processed glass. | Lower-value fraction with high handling importance. The market opportunity lies more in safe treatment and compliance than in raw material price. Recyclers that can separate display glass efficiently reduce landfill or hazardous-waste exposure and improve overall recovery rates required by producer responsibility systems. |
| Metal | The source page lists Metal separately from Iron; this analysis interprets it as non-ferrous and higher-value metallic fractions including copper, aluminum, precious metals and mixed metal concentrates. Printed circuit boards and cables can contain gold, silver, palladium and copper, making metallurgical recovery central to the economics of formal recycling. | Highest-value recovery pool. NITI Aayog emphasizes that e-waste contains precious and critical materials, creating an urban-mining opportunity that can reduce import dependence. Process capability-hydrometallurgy, pyrometallurgy, separation and refining-determines how much value remains with the recycler rather than being exported in low-grade concentrates. |
| Fibers | Fiber-containing fractions can include glass-fiber-reinforced circuit-board resin, insulation, composite layers and cable-related materials. These materials are difficult to recover cleanly because they are bonded with resins, copper and additives. Treatment often focuses on safe separation and maximizing recovery of the embedded metal rather than selling the fiber itself. | Small direct value contribution but relevant to residue management. Advanced PCB recycling can reduce the amount of composite material sent to disposal and improve recovery of copper and precious metals. Technology that converts residual composites into usable fillers or energy-recovery feed could improve overall plant economics. |
| Others | Other fractions include batteries separated under separate waste rules, rare-earth-bearing components, magnets, ceramics, refrigerants, hazardous components and specialty materials. The exact composition varies by equipment stream. Recyclers need product-specific dismantling and compliant downstream channels because some fractions create value while others impose treatment cost. | Strategic emerging segment. NITI Aayog and MeitY are focusing on critical minerals, rare-earth magnets and advanced PCB recovery. As India’s electronics and clean-energy sectors expand, recovery of lithium, cobalt, indium, gallium, tantalum, neodymium and other strategic materials can create new revenue pools beyond conventional copper and steel recycling. |
Material recovery economics and urban mining
Material categories on the source page translate into very different commercial outcomes. Formal recyclers therefore optimize a basket of recovered value rather than maximizing one physical fraction. High-value circuit boards and non-ferrous metals can support the cost of safe dismantling, depollution and treatment of lower-value fractions, while EPR payments add a compliance-linked revenue stream.
| Recovery stream | Commercial implication |
|---|---|
| Precious / Critical Metals | Printed circuit boards and specialized components contain gold, silver, palladium and critical materials in concentrations that can make urban mining attractive. The strategic value is particularly high for metals India imports. Advanced hydrometallurgical processes can retain more value domestically than low-grade manual separation or export of mixed concentrates. |
| Copper & Aluminum | Cables, coils, heat sinks, power electronics and printed circuit boards provide relatively liquid scrap-metal revenue. Good dismantling separates these metals before shredding contaminates them with plastics or ferrous material. Price volatility affects margins, but these streams remain a core economic foundation for most organized recyclers. |
| Low-value Residues | Mixed plastics, glass, foams and composite residues can create handling and disposal cost if no clean downstream market exists. The formal sector therefore bears environmental-compliance expenses that informal processors may avoid, making EPR certificate pricing, collection efficiency and technology investment important to commercial viability. |
Segment Analysis: By Application
By application, the source page segments the market into IT & Telecommunication, Consumer Electronics, Household Appliances and Industrial Electronic Products. IT & Telecommunication is described as the largest waste stream because India’s installed base of computers, smartphones and networking equipment is expanding rapidly, while household appliances contribute heavier ferrous and plastic material flows.
| Application | Demand characteristics |
|---|---|
| IT & Telecommunication | This stream includes computers, laptops, servers, networking equipment, printers, telecom devices and mobile phones. It combines relatively short replacement cycles with high-value circuit-board content, making it economically attractive to collectors and recyclers. The source page identifies IT equipment as the largest waste stream and mobile devices as the fastest-growing subcategory. |
| Consumer Electronics | Televisions, audio/video equipment, personal devices, cameras and entertainment electronics create mixed streams of plastics, glass, circuit boards and metals. Product miniaturization can reduce weight per unit while increasing complexity. Formal recyclers need efficient collection because many small devices remain stored in households or leak into informal resale and scrap channels. |
| Household Appliances | Refrigerators, air conditioners, washing machines and other appliances generate high mass volumes of steel, copper, aluminum and plastics. Refrigeration products also require controlled removal of refrigerants and oils. Collection logistics and safe depollution are therefore critical, but recoverable metals can support strong material economics at scale. |
| Industrial Electronic Products | Industrial control systems, UPS units, power electronics, instrumentation and commercial equipment are often generated through organized enterprises with asset registers, making formal collection easier than household waste. Equipment can be high value and may contain reusable components, creating opportunities for refurbishment before final recycling. |
Collection channel and generator profile
Although the source page does not provide a separate channel segmentation, its commercial discussion implies two fundamentally different feedstock systems: organized bulk generators and fragmented consumer households. The distinction affects collection cost, documentation, refurbishment potential and the ability of formal recyclers to compete with informal scrap networks. For India’s formal recyclers, the commercial implication is that collection density, EPR documentation, recycler registration, material recovery yield and downstream compliance determine whether generated waste becomes profitable formal feedstock.
| Generator profile | Market implication |
|---|---|
| Bulk / Institutional Generators | Corporates, telecom operators, government agencies, data centers and manufacturers can aggregate large lots with asset documentation. Formal recyclers can offer data destruction, pickup, chain-of-custody and compliance certificates, lowering collection cost per kilogram and improving predictability of feedstock quality. |
| Households & Small Businesses | Consumer e-waste is fragmented across millions of owners and is often stored, resold, repaired or sold to informal scrap collectors. Formal recyclers must create collection points, producer take-back systems, incentives and awareness campaigns to compete effectively, which raises acquisition cost but also expands the addressable feedstock pool. |
Regional Analysis: India
India’s formal e-waste market is geographically uneven because registered recycler capacity and processed volumes are concentrated in a limited number of states. Based on official FY2024–25 processing data, North India is the largest formal processing region, led by Uttar Pradesh, Haryana and Uttarakhand; South and West India form the next major organized clusters.
How is formal e-waste processing distributed across Indian regions?
CPCB-linked government data show 988,479 MT of e-waste processed by registered recyclers across 19 states in FY2024–25, closely matching the reported 70.71% processing share of national measured generation. North India accounted for roughly 676,000 MT in the state table, South India about 162,000 MT and West India about 129,000 MT. The distribution reflects registered capacity, industrial clusters, interstate feedstock movement and EPR certificate economics rather than waste generation alone.
| Region | Position | Growth outlook | Demand profile | What decides supplier selection |
|---|---|---|---|---|
| North India | Largest formal processing region | High | Uttar Pradesh, Haryana and Uttarakhand-led | Registered capacity, EPR feedstock access and interstate collection |
| South India | Second-largest formal cluster | High | Telangana-led with Karnataka, Tamil Nadu and Kerala | Technology capability, electronics industry and formal collection |
| West India | Major organized cluster | High | Gujarat and Maharashtra-led | Industrial base, large generators and recycler density |
| Central India | Developing | Moderate | Madhya Pradesh and Chhattisgarh-led | Industrial feedstock and capacity utilization |
| East & Northeast India | Early-stage | High from small base | West Bengal and emerging state registration | Collection infrastructure, transport economics and formalization |
Competitive Landscape
India’s formal e-waste market remains fragmented because collection networks, dismantling, material recovery, refurbishment and EPR services can be provided by different firms. The source page profiles ten companies, including Attero Recycling, Ecoreco, E-Waste Recyclers India and several regional operators. Competitive advantage increasingly depends on registered capacity, feedstock access, EPR documentation, technology depth and downstream material recovery.
Attero is one of the best-known technology-oriented recyclers, with advanced metallurgical capability and exposure to electronics and battery recycling. Ecoreco and other established operators compete through corporate collection, data destruction and compliance services, while regional firms can win local feedstock through logistics relationships and lower collection cost. The market is therefore not determined only by installed tonnes-per-year capacity.
The EPR regime changes competition because producers need compliant recycling certificates rather than merely proof that waste was removed. Registered recyclers can monetize EPR certificates while informal processors cannot participate directly in the same compliance system. This creates a financial incentive to formalize feedstock, but it also means certificate prices and verification rules influence recycler margins.
Government data show the registered recycler count increased from 322 in February 2025 to 386 by March 2026. As capacity expands, competition for high-quality feedstock is likely to intensify. Plants with advanced PCB, precious-metal or critical-material recovery can retain more value per tonne than firms that only dismantle and sell low-grade fractions downstream.
| Competitive tier | Companies | Why they matter |
|---|---|---|
| Technology-led national recyclers | Attero Recycling; Ecoreco; Cerebra Integrated Technologies | These companies are positioned around organized collection, processing technology and large enterprise or producer relationships. Their advantage is the ability to offer compliant chain-of-custody and extract higher value from complex electronics rather than depending only on low-value manual dismantling. |
| Regional / collection-focused recyclers | E-Waste Recyclers India; Earth Sense Recycle; GreenTek Reman; Virogreen India; Hulladek Recycling | Regional operators compete through collection reach, institutional relationships, local processing and awareness programs. They can capture fragmented feedstock that national players may find expensive to collect, but profitability depends on maintaining registered compliance and reliable downstream recovery channels. |
| Service and compliance participants | SIMS Recycling Solutions; Bharati Management Consultancy Services | Service-oriented participants can add value through corporate asset disposition, documentation, refurbishment coordination, EPR support and downstream vendor management. The ability to connect large generators with compliant recyclers can be commercially important even where the firm does not own the deepest metallurgical technology. |
Companies profiled in the report
The source page profiles Attero Recycling, E-Waste Recyclers India, Ecoreco, SIMS Recycling Solutions, Cerebra Integrated Technologies, Earth Sense Recycle, GreenTek Reman Private Ltd, Bharati Management Consultancy Services, Virogreen India Pvt Ltd and Hulladek Recycling Pvt. Ltd. The full list is preserved as supplied even though company scale, current ownership and exact service mix vary across participants.
Production Capacity Analysis: Recycling Infrastructure & Processing Capacity
For an e-waste market, conventional production capacity is not applicable; the relevant equivalent is registered recycling and refurbishment capacity. Government data reported in February 2025 showed 322 registered recyclers with approximately 2.209 million MT per year of reported processing capacity and 72 refurbishers with about 92,042 MT per year of capacity. By March 2026 the registered e-waste recycler count had risen to 386.
Capacity utilization is more important than nominal registration. India generated about 1.398 million MT of e-waste in FY2024–25 and government data report approximately 988,000 MT processed by registered facilities, equivalent to 70.71% of measured generation. The February 2025 registered capacity number was already above measured annual generation, indicating that feedstock collection and formalization can constrain plants even when nameplate processing capacity exists.
State-level processing is highly concentrated. Uttar Pradesh processed about 388,160 MT in FY2024–25, followed by Haryana, Telangana and Uttarakhand among the leading states. This concentration reflects where large facilities are registered and where EPR feedstock is commercially routed; it does not mean those states generated all of the material processed within their borders.
Technology depth also determines effective capacity. A dismantling line can process high tonnage but may send printed circuit boards or mixed metal fractions elsewhere, while advanced hydrometallurgical plants recover more copper, precious and critical materials in-house. MeitY’s Hyderabad Centre of Excellence and one-tonne-per-day PCB recycling pilot illustrate efforts to increase domestic value recovery rather than only expand gross dismantling tonnes.
Market Dynamics
The market is driven by rising electronics consumption, EPR compliance, formal recycler growth and critical-material recovery, but is constrained by informal-sector competition, fragmented household collection, uncertain feedstock quality and the cost of environmentally sound treatment. The core commercial challenge is converting generated e-waste into traceable formal feedstock at a cost that preserves recycling margin.
Market Drivers
| Driver | Directional impact* | Commercial mechanism |
|---|---|---|
| EPR enforcement and certificates | High | Producers need documented compliance under the E-Waste Rules, creating direct demand for registered recycling and certificate generation. The system gives formal recyclers revenue beyond scrap value and encourages capacity expansion. |
| Electronics consumption growth | High | Shorter replacement cycles for phones, computers and appliances increase waste generation. The source page identifies IT equipment as the largest stream and mobile devices as the fastest-growing contributor. |
| Formal recycler expansion | Medium to High | Registered recyclers increased to 386 by March 2026, broadening geographic access and competition. More formal capacity can absorb waste that previously flowed only through informal channels. |
| Critical-mineral recovery | Medium to High | NITI Aayog emphasizes urban mining of precious and critical materials. Advanced PCB and component recovery can improve economics and reduce import dependence, supporting technology investment. |
EPR turns recycling into a compliance service
The E-Waste (Management) Rules require registered producers to meet recycling obligations through the formal system. EPR certificates create a tradable compliance value attached to verified recycling, allowing organized recyclers to earn revenue beyond recovered scrap. This mechanism directly rewards formal processing and can support collection where pure material value would not cover logistics.
Electronics adoption expands the waste pool
India’s consumption of smartphones, computers, telecom equipment and household appliances is rising with income, digitalization and device replacement. The source page identifies IT equipment as the largest waste stream and mobile devices as fastest growing. More devices sold today translate into future recycling demand after product lifetimes expire, creating a long-duration pipeline.
Formal processing performance is improving
Government data show the reported share of e-waste collected, dismantled and recycled/disposed rising from 61.94% in FY2023–24 to 70.71% in FY2024–25. The improvement indicates that formal systems are capturing a larger portion of measured waste, supporting recycler throughput and producer compliance even while informal activity remains significant. This distinction matters because e-waste can be generated in one state, collected by another organization and processed in a different state, so formal processing data measure capacity utilization and commercial routing rather than household generation alone.
Urban mining raises value per tonne
Electronic waste contains copper, gold, silver, palladium and critical materials such as indium, gallium and tantalum. NITI Aayog frames recovery as a strategic resource opportunity. Recyclers that move beyond dismantling into advanced separation and refining can retain more value domestically and improve the economics of formal collection. Buyers and producers therefore evaluate not only recycling price but also traceability, data destruction, certificate validity, environmental compliance and the recycler’s ability to recover value without diverting hazardous fractions into informal channels.
Market Restraints
| Restraint | Directional impact* | Commercial mechanism |
|---|---|---|
| Informal-sector competition | High | Informal collectors offer convenient cash pickup and often avoid environmental-compliance costs. Formal recyclers can struggle to secure feedstock even when they have spare capacity, especially for household devices. |
| Fragmented collection | High | Consumer devices are dispersed across millions of households and small businesses. Aggregation cost can exceed material value for low-weight products, creating a major barrier to formalization. |
| Commodity-price volatility | Medium | Recovered copper, aluminum, steel and precious-metal prices influence recycling margins. Falling scrap values can reduce what formal recyclers can pay collectors and producers for feedstock. |
| Complex and hazardous materials | Medium to High | Mixed plastics, refrigerants, lead, mercury and composite PCBs require controlled treatment. Formal compliance raises operating cost relative to unsafe informal methods, while advanced recovery technology requires capital and skilled labor. |
Informal channels remain deeply embedded
India’s informal scrap ecosystem provides doorstep collection, immediate cash and established resale networks. Formal recyclers must bear registration, pollution-control, documentation and worker-safety costs that informal processors may avoid. This creates a structural feedstock disadvantage unless EPR value, enforcement and producer collection systems compensate for the higher compliant cost base. Through 2034, organized operators with stronger collection networks, EPR systems and advanced metal-recovery technology can capture more value per tonne while helping producers meet measurable compliance obligations.
Household collection is expensive and inconsistent
A corporate office can release hundreds of computers in one documented lot, while households may keep old devices for years or sell them individually. Formal collection therefore requires awareness, incentives, drop-off networks and logistics. The cost per kilogram can be much higher for consumer devices, limiting the practical capture rate even when recycling capacity is available.
Not all recovered fractions are profitable
High-value PCBs and copper-rich equipment can be attractive, but mixed plastics, glass and contaminated residues may create disposal cost. Recyclers must process the full equipment stream rather than cherry-pick valuable parts if they want environmentally sound compliance. Profitability therefore depends on balancing material recovery, EPR revenue and treatment cost across the full basket.
Technology and skills gaps limit domestic value capture
Advanced hydrometallurgy, rare-earth recovery and automated separation require capital, chemistry expertise and trained operators. If a recycler sells partially processed concentrates to downstream processors, much of the final metal value is captured elsewhere. MeitY and NITI Aayog initiatives highlight the need for stronger domestic technology and workforce capability. The market outcome depends on converting fragmented electronics into documented formal flows, because unused nameplate capacity does not generate revenue when feedstock remains stored, resold or handled outside the registered system.
Market Opportunities
Formalization of informal workers and collectors
India’s informal sector has strong collection reach even where it lacks safe processing. Integrating collectors into registered supply chains can preserve their aggregation advantage while moving dismantling and recovery into compliant facilities. Digital traceability, training and purchase centers can convert informal competition into a feedstock network. For India’s formal recyclers, the commercial implication is that collection density, EPR documentation, recycler registration, material recovery yield and downstream compliance determine whether generated waste becomes profitable formal feedstock.
Critical minerals and precious-metal recovery
NITI Aayog highlights e-waste as a source of critical and precious materials. Domestic PCB refining, rare-earth magnet recovery and advanced separation can create higher margins and reduce import dependence. MeitY’s C-MET initiatives provide a technology base that private recyclers can commercialize at larger scale. This distinction matters because e-waste can be generated in one state, collected by another organization and processed in a different state, so formal processing data measure capacity utilization and commercial routing rather than household generation alone.
EPR certificate markets and compliance services
The 2024 amendments added provisions for a trading platform for EPR certificates. Recyclers that generate verifiable certificates can create a compliance-linked revenue stream, while software platforms and service companies can help producers manage obligations, trace material and procure certificates efficiently. Buyers and producers therefore evaluate not only recycling price but also traceability, data destruction, certificate validity, environmental compliance and the recycler’s ability to recover value without diverting hazardous fractions into informal channels.
Solar PV and new waste streams
India’s solar buildout will create a large future waste stream. A March 2026 government release cited an estimate of roughly 600 kilotonnes of cumulative solar waste by 2030. Recyclers that develop glass, aluminum, silicon and precious-metal recovery for PV modules can diversify beyond conventional consumer and IT electronics. Through 2034, organized operators with stronger collection networks, EPR systems and advanced metal-recovery technology can capture more value per tonne while helping producers meet measurable compliance obligations.
Supply Chain Analysis
Generation & ownership
Collection, take-back & aggregation
Dismantling & depollution
Material recovery, refining & EPR certification
Generation & ownership
E-waste originates from households, enterprises, telecom operators, government departments, manufacturers and service organizations. The first commercial challenge is identifying when equipment becomes waste rather than remaining stored, refurbished or resold. Bulk generators provide predictable lots, while consumer waste is more fragmented. The market outcome depends on converting fragmented electronics into documented formal flows, because unused nameplate capacity does not generate revenue when feedstock remains stored, resold or handled outside the registered system.
Collection, take-back & aggregation
Producers, PROs, collectors and recyclers organize pickup, drop-off and take-back networks. Material is documented and routed to registered facilities. Efficient aggregation is critical because transport cost can erase the value of low-weight or low-metal-content devices, especially outside major cities. For India’s formal recyclers, the commercial implication is that collection density, EPR documentation, recycler registration, material recovery yield and downstream compliance determine whether generated waste becomes profitable formal feedstock.
Dismantling & depollution
Registered facilities remove batteries, refrigerants, mercury-containing parts, cables, boards, plastics and other components. Safe depollution protects workers and separates high-value material before shredding. Manual skill remains important because product designs vary and reusable components may be identified for refurbishment. This distinction matters because e-waste can be generated in one state, collected by another organization and processed in a different state, so formal processing data measure capacity utilization and commercial routing rather than household generation alone.
Material recovery, refining & EPR certification
Mechanical separation, hydrometallurgy, pyrometallurgy and downstream refining recover metals and reusable materials. Registered recyclers also generate EPR certificates linked to verified recycling. The final economics therefore combine commodity recovery, processing fees and compliance value, while residues must be sent to authorized downstream treatment. Buyers and producers therefore evaluate not only recycling price but also traceability, data destruction, certificate validity, environmental compliance and the recycler’s ability to recover value without diverting hazardous fractions into informal channels.
Recent Developments
Recent developments show India’s e-waste market moving from basic authorization toward a more formal, data-driven circular-economy system. The most relevant changes involve recycler registration, national standards, critical-material recovery and future waste streams rather than isolated corporate announcements. Through 2034, organized operators with stronger collection networks, EPR systems and advanced metal-recovery technology can capture more value per tonne while helping producers meet measurable compliance obligations.
July 30, 2026 – BIS promoted revised e-waste management guidelines
The Bureau of Indian Standards highlighted IS 17862:2026, the first revision of India’s e-waste management guideline, covering storage, collection, refurbishing, dismantling, recycling, advanced recycling and pollution-control processes. The revision supports more standardized formal operations and can raise qualification expectations for producers, PROs, dismantlers and recyclers. The market outcome depends on converting fragmented electronics into documented formal flows, because unused nameplate capacity does not generate revenue when feedstock remains stored, resold or handled outside the registered system.
March 23, 2026 – government reported 386 registered e-waste recyclers
A Parliament response on circular economy reported 386 registered e-waste recyclers, 28.75 lakh MT of waste recycled and 11.86 lakh MT of EPR certificates generated as of March 5, 2026. The figures show the scale of formal-system expansion under EPR and illustrate how compliance certificates are becoming part of recycler economics.
January 27, 2026 – NITI Aayog published circular-economy roadmap
NITI Aayog’s report on e-waste and lithium-ion batteries projects Indian e-waste generation rising from 6.19 million tonnes in 2024 to 14 million tonnes by 2030. The report frames recovery of precious and critical materials as both an environmental and strategic resource opportunity, supporting investment in advanced recycling and informal-sector formalization.
July 24, 2025 – official data showed formal processing improvement
The Ministry of Environment reported national measured e-waste generation of 1,397,955.59 MT in FY2024–25 and a 70.71% collection/dismantling/recycling-disposal rate, up from 61.94% the previous year. It also published state processing and recycler-count data, providing a stronger evidence base for regional capacity and formalization analysis. For India’s formal recyclers, the commercial implication is that collection density, EPR documentation, recycler registration, material recovery yield and downstream compliance determine whether generated waste becomes profitable formal feedstock.
Report Scope & Segmentation
| Attribute | Coverage |
|---|---|
| Market | India E-Waste |
| Base Year | 2025 |
| Estimated Year | 2026 |
| Forecast Period | 2026–2034 |
| 2025 Market Size | USD 3.86 billion |
| 2034 Forecast Size | USD 10.69 billion |
| CAGR | 12.0% (2026–2034) |
| Largest Formal Processing Region in 2025 | North India |
| By Type | Iron; Plastic; Glass; Metal; Fibers; Others |
| By Application | IT & Telecommunication; Consumer Electronics; Household Appliances; Industrial Electronic Products |
| India Regions | North India; South India; West India; Central India; East & Northeast India |
| Companies Profiled | Attero Recycling; E-Waste Recyclers India; Ecoreco; SIMS Recycling Solutions; Cerebra Integrated Technologies; Earth Sense Recycle; GreenTek Reman Private Ltd; Bharati Management Consultancy Services; Virogreen India Pvt Ltd; Hulladek Recycling Pvt. Ltd. |
Frequently Asked Questions
What is the India e-waste market size in 2025?
The source page publishes USD 3.45 billion in 2024 and USD 6.8 billion in 2030. Those anchors imply a 2025 market size of approximately USD 3.86 billion. Applying the same compound growth factor gives an estimated USD 4.33 billion in 2026 and approximately USD 10.69 billion in 2034. This distinction matters because e-waste can be generated in one state, collected by another organization and processed in a different state, so formal processing data measure capacity utilization and commercial routing rather than household generation alone.
What is the projected India e-waste market size by 2034?
The rebased 2034 market size is approximately USD 10.69 billion. The value is calculated by extending the growth factor implied by the source page’s 2024 and 2030 revenue anchors. This produces a 2026–2034 CAGR of approximately 12.0% after rounding. Buyers and producers therefore evaluate not only recycling price but also traceability, data destruction, certificate validity, environmental compliance and the recycler’s ability to recover value without diverting hazardous fractions into informal channels.
Does the source page’s 11.9% CAGR reconcile with its market-size anchors?
Yes, closely. The USD 3.45 billion 2024 value and USD 6.8 billion 2030 value imply approximately 11.97% compound annual growth, which rounds to 12.0% and is broadly consistent with the page’s printed 11.9% CAGR. Through 2034, organized operators with stronger collection networks, EPR systems and advanced metal-recovery technology can capture more value per tonne while helping producers meet measurable compliance obligations.
Which application is the largest e-waste stream?
The source page identifies IT & Telecommunication as the largest waste stream and says mobile devices are among the fastest-growing contributors. Computers, networking equipment, phones and enterprise electronics generate valuable printed circuit boards and metals, making this stream commercially attractive to formal recyclers. The market outcome depends on converting fragmented electronics into documented formal flows, because unused nameplate capacity does not generate revenue when feedstock remains stored, resold or handled outside the registered system.
Which region leads the India market?
The source page does not provide a reliable zone-level revenue ranking. This article therefore uses official FY2024–25 processing data and identifies North India as the largest formal processing region, driven by Uttar Pradesh, Haryana and Uttarakhand. Uttar Pradesh alone processed about 388,160 MT in the government table. For India’s formal recyclers, the commercial implication is that collection density, EPR documentation, recycler registration, material recovery yield and downstream compliance determine whether generated waste becomes profitable formal feedstock.
How much e-waste did India generate in FY2024–25?
Government data reported national e-waste generation of 1,397,955.59 metric tonnes in FY2024–25. The same source reported that 70.71% was collected, dismantled and recycled or disposed through the measured system, up from 61.94% in FY2023–24. This distinction matters because e-waste can be generated in one state, collected by another organization and processed in a different state, so formal processing data measure capacity utilization and commercial routing rather than household generation alone.
How many registered e-waste recyclers are operating in India?
A March 2026 government response reported 386 registered e-waste recyclers under the EPR framework. Earlier February 2025 data reported 322 recyclers with approximately 2.209 million MT per year of processing capacity, showing rapid formal-sector expansion. Buyers and producers therefore evaluate not only recycling price but also traceability, data destruction, certificate validity, environmental compliance and the recycler’s ability to recover value without diverting hazardous fractions into informal channels.
What is the biggest market restraint?
The largest structural restraint is competition from informal collection and processing. Informal networks offer convenient local pickup and often avoid the pollution-control and documentation costs borne by registered recyclers. Formal players therefore need EPR revenue, producer contracts, technology advantages and efficient collection networks to secure feedstock. Through 2034, organized operators with stronger collection networks, EPR systems and advanced metal-recovery technology can capture more value per tonne while helping producers meet measurable compliance obligations.
What creates the strongest opportunity for recyclers?
Critical-material and precious-metal recovery is one of the strongest opportunities. NITI Aayog highlights e-waste as an urban mine containing gold, silver, palladium, lithium, cobalt and other strategic materials. Advanced PCB and component recovery can raise value per tonne and reduce India’s import dependence. The market outcome depends on converting fragmented electronics into documented formal flows, because unused nameplate capacity does not generate revenue when feedstock remains stored, resold or handled outside the registered system.
Who are the companies profiled in the report?
The source page profiles Attero Recycling, E-Waste Recyclers India, Ecoreco, SIMS Recycling Solutions, Cerebra Integrated Technologies, Earth Sense Recycle, GreenTek Reman Private Ltd, Bharati Management Consultancy Services, Virogreen India Pvt Ltd and Hulladek Recycling Pvt. Ltd. For India’s formal recyclers, the commercial implication is that collection density, EPR documentation, recycler registration, material recovery yield and downstream compliance determine whether generated waste becomes profitable formal feedstock.
Get Sample Report PDF for Exclusive Insights
Report Sample Includes
- Table of Contents
- List of Tables & Figures
- Charts, Research Methodology, and more...
 Download Sample Report PDF