
Key Statistics
Key Takeaways
- Small-sized panels remain strategically important because smartwatches, AR/VR and compact premium devices can monetize MicroLED brightness, power efficiency and pixel-level emission at smaller total panel area.
- Wearable and AR/VR applications are major commercialization targets, while large premium displays and transparent installations are broadening the technology beyond laboratory demonstrations.
- Asia Pacific leads with 45% of market value, supported by display manufacturing and technology development in Japan, South Korea, China and Taiwan. Japan alone represents 39% of the market in the current structure.
- Commercialization accelerated in 2025–2026. AUO and Garmin launched the first MicroLED smartwatch, LG expanded MAGNIT products, Samsung demonstrated a 140-inch Micro LED display and AUO continued scaling transparent and interactive MicroLED platforms.
- Manufacturing yield remains the central economic challenge. Mass transfer, pixel repair, epitaxy uniformity, backplane integration and final calibration determine whether MicroLED can move from premium niche products into broader consumer categories.
MicroLED Market Overview
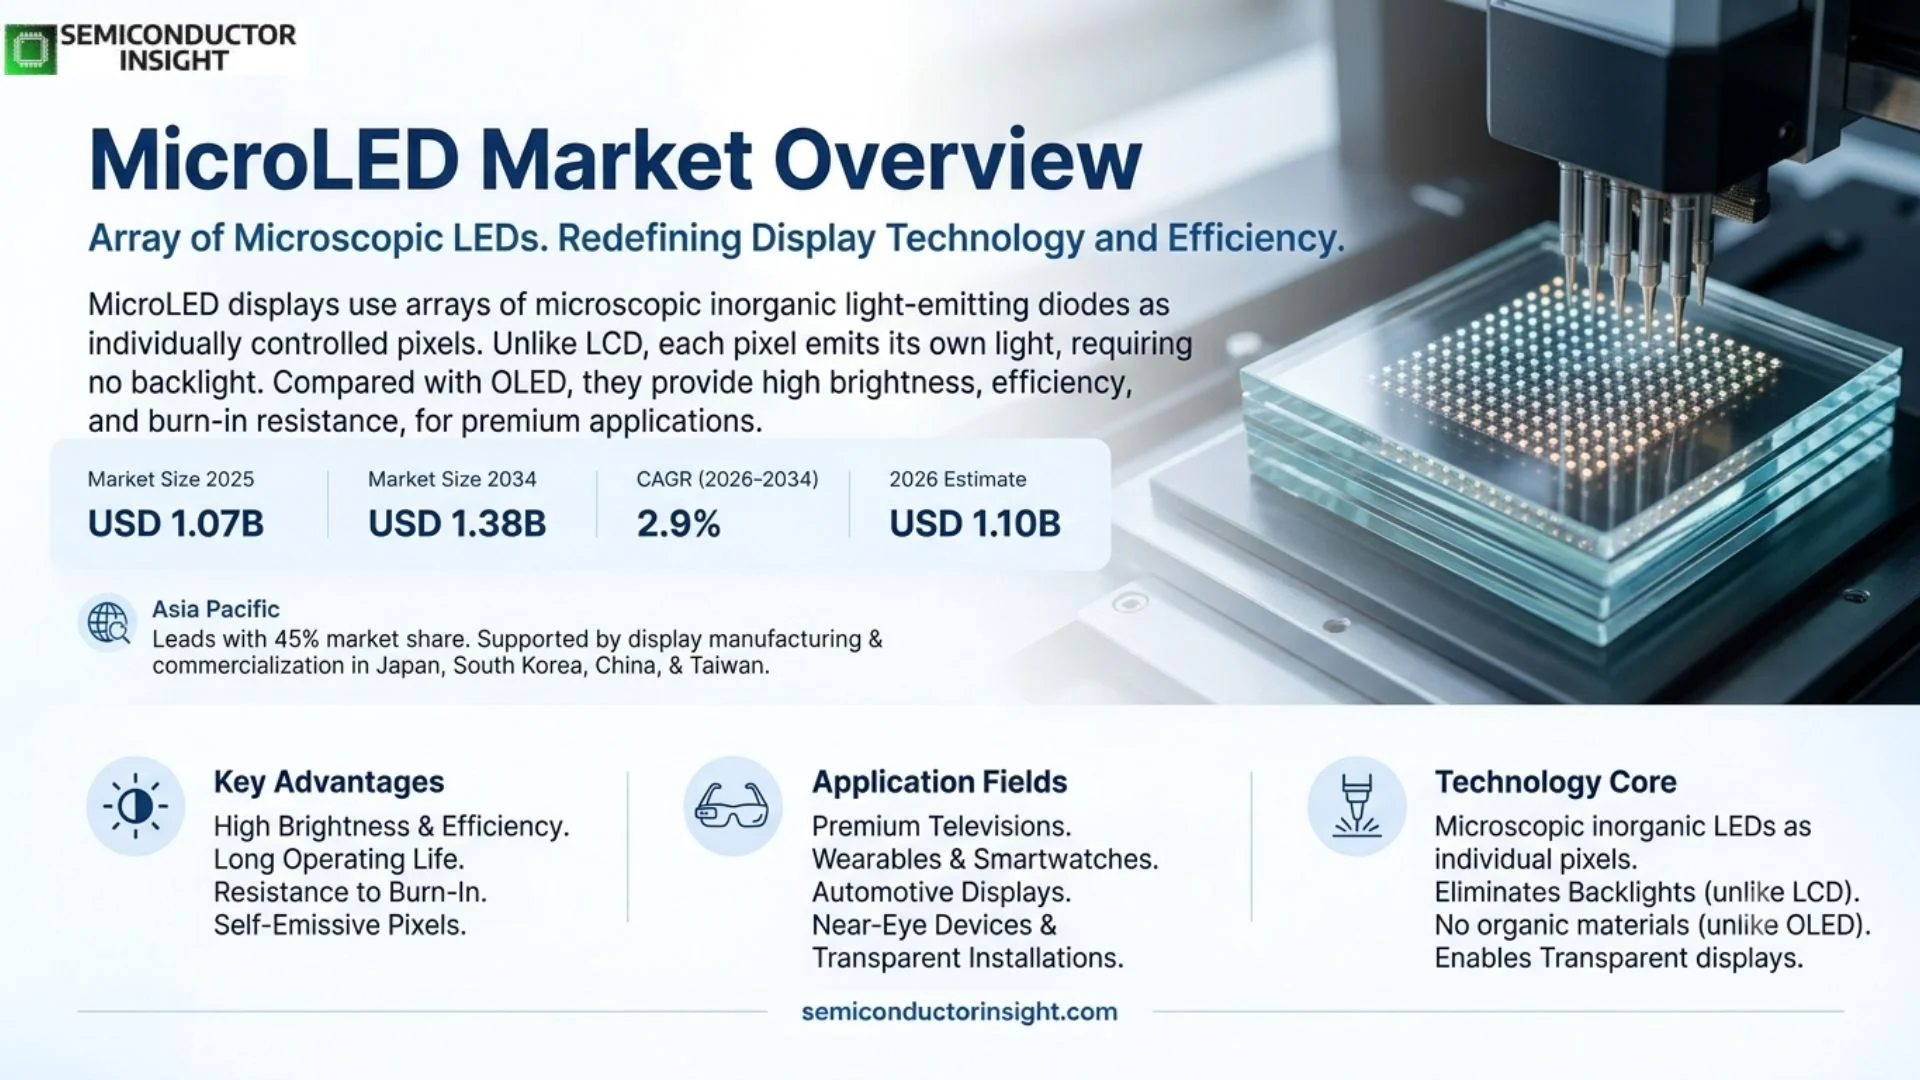
MicroLED market is valued at USD 1.07 billion in 2025 and is projected to reach USD 1.38 billion by 2034, representing a 2.9% CAGR during 2026–2034. The 2026 estimated market size is USD 1.10 billion. Asia Pacific leads with 45% market share, supported by display manufacturing and commercialization activity across Japan, South Korea, China and Taiwan.
MicroLED displays use arrays of microscopic inorganic light-emitting diodes as individually controlled pixels. Unlike LCD, each pixel emits its own light and does not require a backlight. Compared with OLED, inorganic LED materials can provide very high brightness, strong efficiency, long operating life and resistance to burn-in, making the technology attractive for premium televisions, wearables, automotive displays, transparent installations and near-eye devices.
The manufacturing challenge is extreme scale. A high-resolution display can require millions of red, green and blue emitters, each of which must be transferred, bonded, electrically tested and corrected if defective. Yield loss at the chip, transfer, bonding or backplane stage can compound across the panel, which is why mass-transfer throughput and repair remain central to commercial cost.
Market development is diverging by application. Large direct-view MicroLED has reached premium commercial and luxury-residential deployment, while wearables and AR devices seek very high brightness and pixel density at much smaller panel sizes. Transparent MicroLED is creating a third path for retail, automotive and interactive installations where the display must coexist with the physical environment rather than replace it.
Segment Analysis: By Type
By size, the market is segmented into Small Sized Panels, Medium Sized Panels and Large Size Panels. Small panels are strategically important in wearables and AR/VR because they use less display area and can justify higher cost per square centimeter, while large panels support premium TVs, commercial walls and transparent installations where brightness and seamless tiling are key.
| Panel size | Typical applications | Market position |
|---|---|---|
| Small Sized Panels | Smartwatches, near-eye displays, compact wearables and specialized viewfinders. These products need high pixel density, strong outdoor brightness and low power within a small area, making them attractive early commercialization targets. | A high-value segment with strong innovation intensity. AUO and Garmin’s MicroLED smartwatch demonstrates that the technology can move into consumer wearables where premium pricing supports complex manufacturing. |
| Medium Sized Panels | Automotive displays, tablets, monitors, control panels and transparent interfaces. Medium formats need reliable mass transfer over a larger area while maintaining fine pixel pitch and low defect count. | An emerging bridge segment. Automotive and industrial interfaces can justify premium display performance, especially when transparency, brightness or unusual form factor creates clear system value. |
| Large Size Panels | Premium television, home cinema, broadcast, command centers, luxury residential and commercial signage. Large panels often use modular construction so cabinets or tiles can be assembled into customized screen sizes. | A commercial premium segment. LG MAGNIT and Samsung Micro LED products show continued investment in large-format displays where customers prioritize image quality and scale over mass-market price. |
Manufacturing technology and display-resolution segmentation
The market also segments by manufacturing technology and resolution. Inorganic LED-based MicroLED is the core commercial architecture. Quantum-dot color conversion and hybrid structures are being explored to simplify color generation and improve efficiency. Display resolution ranges from HD through 4K and 8K, with the manufacturing challenge rising sharply as total pixel count increases.
| Axis | Segments | Commercial implication |
|---|---|---|
| By Manufacturing Technology | Inorganic LED-Based MicroLED Displays · Organic LED-Based MicroLED Displays · Quantum Dot LED-Based MicroLED Displays | Inorganic LED is the principal MicroLED architecture. Quantum-dot conversion can simplify color formation in selected designs, while hybrid approaches aim to balance efficiency, color gamut and manufacturing complexity. |
| By Display Resolution | HD · 4K UHD · 8K UHD | Higher resolution multiplies emitter count and magnifies transfer and repair requirements. 4K dominates many premium large-display targets, while near-eye products focus more on pixels per inch than total panel resolution. |
Segment Analysis: By Application
By application, the market covers Cellphone, Wearable Watch Device, AR/VR, TV and Others. Wearables and AR/VR have strong strategic momentum because MicroLED’s brightness and efficiency can address sunlight readability and optical-engine losses, while TVs and commercial displays provide the largest visible showcase for premium large-format technology.
| Application | Demand characteristics |
|---|---|
| Wearable Watch Device | Smartwatches benefit from high brightness, low power and long life, especially for outdoor use. AUO and Garmin launched the fēnix 8 Pro MicroLED smartwatch in 2025 with a 1.4-inch, 326 PPI display, marking a major consumer commercialization milestone. |
| AR / VR | Near-eye systems need very high brightness to compensate for optical losses and very high pixel density to avoid visible pixel structure. MicroLED microdisplays are therefore attractive for AR, although mass-transfer, full-color integration and wafer-level yield remain demanding. |
| TV | Large-format MicroLED offers emissive contrast, high brightness and modular screen size. LG MAGNIT and Samsung Micro LED target premium residential and commercial installations where the cost of modular assembly is acceptable. |
| Cellphone | Smartphones could benefit from efficiency and brightness, but the combination of very high pixel count, strict thickness and aggressive cost targets makes large-scale adoption difficult. Near-term commercialization is therefore more selective than in wearables or premium large displays. |
| Others | Transparent retail displays, automotive HMIs, command centers, broadcast studios and optical communication are expanding the addressable market. AUO’s 2026 work demonstrates MicroLED moving beyond display-only use into interactive and optical-system applications. |
Regional Analysis
Asia Pacific leads the MicroLED market with 45% share. Japan represents 39% of market value in the current structure, while South Korea and Taiwan are major centers for display R&D, manufacturing and commercialization. North America remains important in device ecosystems and premium demand, Europe contributes automotive and industrial applications, and emerging regions adopt mainly through premium imported products.
How does MicroLED commercialization differ by region?
Asia Pacific has the deepest manufacturing ecosystem for LED epitaxy, panels, backplanes and mass-transfer technology. North America is important through device companies, AR/VR platforms and premium commercial demand. Europe has strong automotive, industrial and luxury-display opportunities. Other regions are primarily downstream markets until local display-manufacturing capability expands.
| Region | Market position | Growth outlook | Demand profile | What decides supplier selection |
|---|---|---|---|---|
| Asia Pacific | 45% market share | High | Wearables, TV, auto & transparent display | Yield, ecosystem scale and product commercialization |
| North America | Premium demand / device ecosystem | Moderate to high | AR, luxury display & commercial | Application integration and premium pricing |
| Europe | Specialized premium market | Moderate | Automotive, retail & commercial | Reliability, design integration and sustainability |
| South America | Emerging | Selective | Premium commercial display | Price and imported supply |
| Middle East & Africa | Fast-growing from small base | Selective | Luxury, retail & commercial | Premium demand and project economics |
Competitive Landscape
Key participants include Samsung Electronics, Apple, Sony, JBD, Lumens, LG Display, PlayNitride, AU Optronics, Plessey Semiconductors, Rohinni, Epistar and Konka Group. Competition spans LED epitaxy, transfer technology, backplanes, complete displays and device integration rather than one vertically uniform business model.
Samsung and LG compete most visibly in premium large displays. Samsung continues to showcase large Micro LED products, while LG expanded MAGNIT in 2026 with improved grayscale, contrast, refresh rate and serviceability. These products demonstrate that large-format MicroLED is commercially viable at premium price points even before mass-market television economics are reached.
AUO has built a broad MicroLED ecosystem spanning transparent display, automotive, wearable and optical-communication applications. The Garmin smartwatch launch shows successful transfer into a consumer product, while its 2026 transparent displays and optical-communication work demonstrate reuse of MicroLED expertise beyond conventional screens.
PlayNitride, JBD and other specialists focus on microdisplay chips, mass transfer and platform technology. Their role is important because MicroLED cost reduction depends on process innovations that raise transfer throughput and repair yield. Apple and other system companies influence ecosystem direction through product requirements even when manufacturing is carried out by display and semiconductor partners.
Competitive tier structure
| Tier | Companies | Basis of competition |
|---|---|---|
| Large-display platform leaders | Samsung Electronics; LG Display / LG Electronics; Sony | Premium TV, commercial walls, home cinema, modular systems and strong global brands |
| MicroLED ecosystem / panel leaders | AU Optronics; PlayNitride; Epistar / Ennostar; Konka | Mass transfer, transparent display, automotive, wearable and panel commercialization |
| Microdisplay / integration specialists | JBD; Plessey; Rohinni; Lumens; Apple ecosystem | Near-eye displays, micro-emitter arrays, transfer, system integration and product-driven technology development |
Key companies profiled in the report scope
- Samsung Electronics
- Apple
- Sony
- JBD
- Lumens
- LG Display
- PlayNitride
- AU Optronics
- Plessey Semiconductors
- Rohinni LLC
- Epistar Corporation / Ennostar
- Konka Group
MicroLED Production Capacity & Yield Analysis
MicroLED capacity is constrained by more than LED epitaxy. Commercial output depends on microchip fabrication, singulation, mass transfer, backplane preparation, bonding, inspection, repair and calibration. A line with high emitter throughput can still produce few saleable panels if transfer or repair yield is weak. Effective capacity is therefore best measured by finished good panels rather than raw LED wafer starts.
Mass transfer is one of the most difficult steps because millions of emitters must be placed with high positional accuracy. Throughput and defect rate directly determine cost. Larger panels amplify the challenge because the probability of at least one defective pixel rises with total pixel count.
Repair and redundancy are essential to commercial yield. Manufacturers inspect transferred arrays, replace or electrically bypass defective emitters and calibrate brightness and color. New architectures that reduce repair time or improve redundancy can lower cost even without changing LED efficiency.
Market Dynamics
Growth is driven by premium displays, wearables, AR/VR, automotive transparency and high-brightness commercial systems. Restraints include mass-transfer cost, yield, repair complexity and competition from OLED and MiniLED. Opportunities center on wearable commercialization, transparent displays, microdisplays, optical communication and more scalable mass-transfer platforms.
MARKET DRIVERS
Drivers Impact Analysis*
| Factor | Forecast impact* | Geographic relevance | Impact timeline |
|---|---|---|---|
| Premium large displays | Medium to high | Asia, North America, Europe | Persistent |
| Wearable commercialization | High | Asia Pacific, North America | Medium term |
| AR / VR microdisplays | High | Global technology hubs | Medium to long term |
| Transparent automotive / retail displays | Medium to high | Asia Pacific, Europe | Medium term |
*Directional analytical rating; it is not a measured contribution to theheadline CAGR.
MicroLED offers strong emissive-display performance
Each pixel emits its own light, enabling deep black, high brightness and fast response. In premium environments these advantages can justify higher manufacturing cost, especially for large displays and outdoor-readable wearables.
Wearables improve the commercial cost equation
A smartwatch uses far less panel area than a television, allowing manufacturers to capture premium display value without transferring tens of millions of emitters. The Garmin launch demonstrates that MicroLED can reach consumer products when performance is differentiated enough.
Transparent displays create new use cases
MicroLED can achieve high transparency because the emitting elements occupy a small fraction of the surface. This enables automotive windows, retail showcases and architectural installations where information appears without blocking the background.
AR needs exceptional brightness
Optical waveguides and combiners can lose substantial light. MicroLED’s high luminance can compensate for those losses while maintaining small pixel size, making the technology attractive for near-eye displays where OLED brightness can be limiting.
MARKET RESTRAINTS
Restraints Impact Analysis*
| Factor | Forecast impact* | Geographic relevance | Impact timeline |
|---|---|---|---|
| Mass-transfer cost | High | All applications | Persistent |
| Pixel yield and repair | High | Large displays | Persistent |
| OLED / MiniLED competition | High | Consumer electronics | Persistent |
| Color integration complexity | Medium to high | Microdisplays | Persistent |
*Directional analytical rating; it is not a measured contribution to the headline CAGR.
Mass transfer remains expensive
Moving millions of microscopic emitters quickly and accurately is difficult. Slow placement raises capital and cycle cost, while alignment errors create defects that need repair.
Defect tolerance shrinks as panel size grows
A large 4K display contains millions of subpixels. Even very high individual-pixel yield can leave visible defects. Inspection and repair therefore become major contributors to production time and cost.
Competing displays continue to improve
OLED offers excellent contrast and mature smartphone production, while MiniLED LCD provides high brightness at lower cost. MicroLED must deliver a clear performance or form-factor advantage to justify premium pricing.
Full-color microdisplays are difficult
Red, green and blue emitters have different material and efficiency characteristics. Color conversion or multi-material integration can simplify some steps but adds new optical and manufacturing challenges.
MARKET OPPORTUNITIES
Expand MicroLED wearables
The fēnix 8 Pro MicroLED proves that premium wearable commercialization is possible. Suppliers can target sports watches, industrial wearables and specialized outdoor devices where sunlight visibility and battery efficiency have high value.
Scale transparent interactive displays
AUO’s 2026 transparent systems combine MicroLED with AI, sensing and AR overlays. Retail, automotive, museums and smart architecture can adopt displays that become visible only when information is needed.
Grow AR microdisplay production
Near-eye displays can support high prices per unit area and need extreme brightness. Improved mass transfer, monolithic arrays and color-conversion techniques can expand MicroLED’s share in AR glasses.
Use MicroLED for optical communication
AUO’s 2026 CPO work shows MicroLED emitters can transmit data as well as images. Short-reach optical links create a new semiconductor-adjacent opportunity that reuses high-speed emitters, mass transfer and packaging expertise.
MicroLED Value Chain Analysis
Epitaxy quality sets the starting yield
MicroLED requires uniform wavelength and efficiency across very small emitters. Wafer non-uniformity becomes visible after transfer, so epitaxy control and binning are critical to final color consistency.
Transfer throughput determines manufacturing economics
Millions of emitters must move from source wafers to display backplanes. The transfer method must be fast, accurate and gentle enough to avoid damaging the chips or destination circuitry.
Repair converts high technical yield into sellable panels
Inspection identifies dead or off-color pixels, and repair systems replace them or reroute signals. The cost of repair rises sharply on large high-resolution displays, making defect prevention and redundancy essential.
System integration creates application-specific value
A smartwatch needs outdoor visibility and low power, a TV needs perfect uniformity, and a transparent automotive display needs high transmission and sunlight readability. The same MicroLED technology therefore requires different packaging and control strategies by application.
Recent Developments in the MicroLED Market
AUO expands MicroLED into optical communication
AUO announced a MicroLED co-packaged-optics module for short-reach AI data-center interconnect, extending MicroLED technology beyond displays into high-speed optical communication.
AUO presents new MicroLED interaction platforms at SID 2026
AUO showcased transparent MicroLED systems integrating AI, optics and sensing, positioning the technology as an interactive platform for retail and smart mobility.
LG launches 2026 MAGNIT Micro LED in the U.S.
The new MAGNIT platform adds improved contrast, grayscale, 120Hz support, front-access alignment and enhanced installation reliability for commercial and luxury-residential use.
Samsung showcases 140-inch Micro LED at CES 2026
Samsung demonstrated a 140-inch Micro LED display as part of its next-generation visual technology lineup, reinforcing continued investment in large-format premium MicroLED.
AUO and Garmin launch first MicroLED smartwatch
The Garmin fēnix 8 Pro MicroLED uses a 1.4-inch 326 PPI panel and marks a major commercialization step for MicroLED in consumer wearables.
REPORT SCOPE & SEGMENTATION
| Attribute | Details |
|---|---|
| Study Period | 2018–2034 |
| Base Year | 2025 |
| Estimated Year | 2026 |
| Forecast Period | 2026–2034 |
| Historical Period | 2018–2025 |
| Market Size 2025 | USD 1.07 billion |
| Market Size 2034 | USD 1.38 billion |
| Growth Rate | CAGR of 2.9% from 2026–2034 |
| Unit | Value (USD Million/Billion) and display unit shipments |
| Segmentation | By Type, By Application, By Manufacturing Technology, By Display Resolution, By Region |
| By Type | Small Sized Panels · Medium Sized Panels · Large Size Panels |
| By Application | Cellphone · Wearable Watch Device · AR/VR · TV · Others |
| By Manufacturing Technology | Inorganic LED-Based MicroLED Displays · Organic LED-Based MicroLED Displays · Quantum Dot LED-Based MicroLED Displays |
| By Display Resolution | HD · 4K Ultra-High Definition · 8K Ultra-High Definition |
| By Region | Each region analysed by panel size, application, manufacturing technology, display resolution and country marketNorth AmericaUnited States, Canada, MexicoEuropeGermany, France, United Kingdom, Italy, Spain and other European marketsAsia PacificJapan, South Korea, China, Taiwan, India, Australia and other Asian marketsSouth AmericaBrazil, Argentina and other South American marketsMiddle East & AfricaUAE, Saudi Arabia, South Africa and other MEA markets |
| Key Companies Profiled | Samsung Electronics · Apple · Sony · JBD · Lumens · LG Display · PlayNitride · AU Optronics · Plessey Semiconductors · Rohinni LLC · Epistar Corporation / Ennostar · Konka Group |
| Customization Scope | Free report customization equivalent to up to four analyst working days with purchase. Addition or alteration to country, regional and segment scope. |
Frequently Asked Questions
What is the 2025 size of the MicroLED market?
The market is valued at USD 1.07 billion in 2025 and is projected to reach USD 1.38 billion by 2034. The 2026 estimate is USD 1.10 billion and the 2026–2034 CAGR is 2.9%, reflecting gradual commercialization across premium displays, wearables and emerging transparent systems.
Which MicroLED panel size is most important?
Small panels are strategically important because wearables and AR/VR can support high value per display area and benefit strongly from brightness and efficiency. Large panels remain commercially visible in luxury residential and premium commercial installations.
Which applications are driving commercialization?
Wearables, AR/VR, premium TVs, transparent automotive displays and commercial signage are the main commercialization paths. The 2025 Garmin MicroLED smartwatch launch demonstrated that small consumer products can reach market ahead of mass-market smartphone adoption.
Which region leads the market?
Asia Pacific leads with 45% share. Japan represents 39% of market value, while South Korea and Taiwan are major centers for MicroLED display development and commercialization. The region also contains much of the LED, display and manufacturing ecosystem.
What is the estimated market size in 2026?
The 2026 estimated market size is USD 1.10 billion. Growth remains measured because manufacturing cost and yield constrain broad consumer adoption, even as premium products and new use cases expand.
Why is MicroLED manufacturing difficult?
A display can require millions of microscopic emitters. Each emitter must be fabricated, transferred, bonded, tested and repaired if defective. Transfer speed, alignment, pixel yield and color uniformity therefore have a major effect on manufacturing cost.
What are the main market restraints?
The main restraints are mass-transfer cost, pixel repair complexity, color integration and strong competition from OLED and MiniLED. MicroLED needs a clear performance or form-factor advantage to justify higher cost.
Why are wearables attractive for MicroLED?
Wearables value outdoor brightness and low power but use much less panel area than TVs or smartphones. This improves the commercial equation and allows premium devices to absorb higher display cost while manufacturing scale improves.
What is the opportunity in transparent MicroLED?
Transparent displays can overlay information on windows, retail showcases and vehicle surfaces while preserving visibility through the panel. AUO’s recent demonstrations show the technology moving toward interactive retail and mobility systems.
What does the report cover?
The report covers small, medium and large MicroLED panels; cellphone, wearable, AR/VR, TV and other applications; manufacturing technology and display resolution; five global regions; production and yield analysis; and the major companies active in the market.
Research Sources & Evidence Base
View primary and authoritative evidence used in this overview
- AUO. MicroLED Interaction Platform at SID 2026 – May 2026 primary evidence on transparent MicroLED, AI interaction and application expansion.
- AUO. MicroLED Optical Communication at SEMICON Taiwan 2026 – August 2026 primary evidence on MicroLED emitters in co-packaged optical communication.
- AUO. MicroLED Smartwatch with Garmin – September 2025 commercialization milestone for a 1.4-inch 326 PPI consumer wearable.
- LG Electronics. 2026 MAGNIT Micro LED – March 2026 product launch covering large premium commercial and residential displays.
- Samsung Electronics. CES 2026 Micro LED 140-inch – Official evidence on Samsung’s 140-inch Micro LED demonstration.
- PlayNitride. MicroLED Technology – Technical evidence on LED miniaturization, mass transfer and application ranges.
Get Sample Report PDF for Exclusive Insights
Report Sample Includes
- Table of Contents
- List of Tables & Figures
- Charts, Research Methodology, and more...
 Download Sample Report PDF


Be the first to review “MicroLED Market Size, Share, Trends, Market Growth, and Business Strategies 2026-2034”