SEMICONDUCTOR INSIGHT
MARKET RESEARCH REPORT

Global Electric Test Instrument Market

2026 to 2034
MARKET INTELLIGENCE
ACROSS KEY REGIONS
2026 EDITION
ELECTRONIC COMPONENTS Semiconductor Market Research

Global Electric Test Instrument Market

Research Report 2026-2034

◷
UPDATED 16 September 2026
▤
REPORT LENGTH Detailed Report
▣
REPORT CODE f8d4d7edbf09
▯
FORMATS PDF

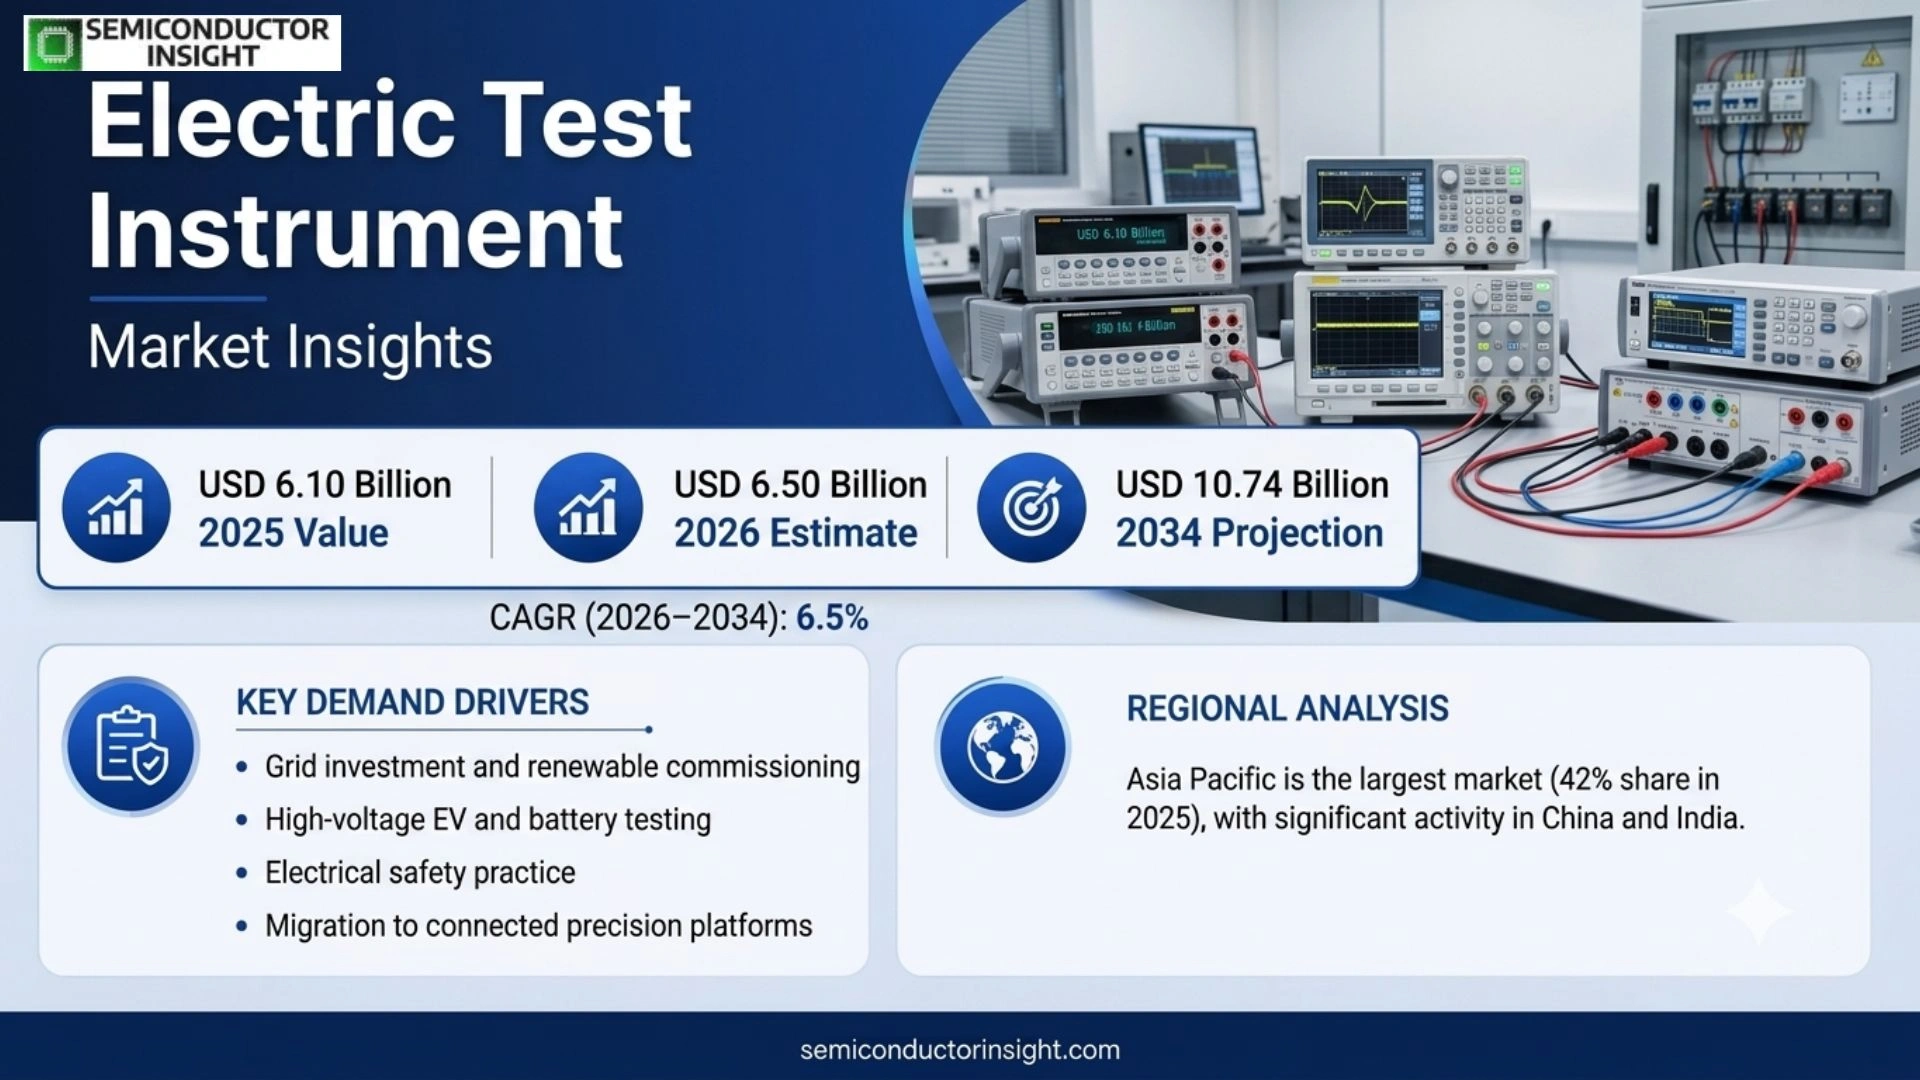
Electric Test Instrument Market is increases to an estimated USD 6.50 billion in 2026, and is projected to reach USD 10.74 billion by 2034, 6.5% CAGR during 2026–2034. Asia Pacific is the largest market in 2025, while current demand is being reshaped by grid investment, renewable-energy commissioning, high-voltage EV and battery testing, electrical-safety practice and the migration from stand-alone meters toward connected high-precision measurement platforms.

Get the sample PDF with study scope, segmentation and methodology details.

Key Statistics

2025 Market Size
USD 6.10 billion
2034 Projected Market Size
USD 10.74 billion
CAGR (2026–2034)
6.5%
Largest Market in 2025
Asia Pacific

Key Takeaways

  • Acceptance Test Instruments are the leading type on the source page because new substations, renewable plants, industrial systems and high-voltage equipment require documented commissioning before energization, creating demand for insulation, voltage, circuit and safety-test equipment.
  • Power Grid is the largest application, supported by a global grid-investment requirement that the IEA says must rise materially from today’s approximately USD 400 billion annual level while more than 2,500 GW of projects wait in interconnection queues.
  • Asia Pacific is the largest market, with the page citing a 42% share and China as a major contributor. IRENA reported that Asia added more than 400 GW of renewable power capacity in 2024, reinforcing commissioning and maintenance demand.
  • Renewables change instrument specifications. IRENA reported 585 GW of global renewable additions in 2024, representing 92.5% of all new power capacity and increasing demand for high-voltage DC meters, insulation testers and power-quality tools.
  • Precision is moving upstream into R&D. Hioki’s 2026 high-frequency calibration work reached extremely low uncertainty at 200 kHz and 1 MHz, reflecting how SiC/GaN inverters and EV systems require tighter power measurement than routine industrial maintenance.

Electric Test Instrument Market Overview

Electric Test Instrument Market is rebased to USD 6.10 billion in 2025, increases to an estimated USD 6.50 billion in 2026, and is projected to reach USD 10.74 billion by 2034, a 6.5% CAGR during 2026–2034. Asia Pacific is the largest market in 2025, while current demand is being reshaped by grid investment, renewable-energy commissioning, high-voltage EV and battery testing, electrical-safety practice and the migration from stand-alone meters toward connected high-precision measurement platforms.

Base year: 2025 · Estimated year: 2026 · Forecast period: 2026–2034 · Values in USD million unless stated otherwise

Electric test instruments measure voltage, current, resistance, insulation, grounding, power quality and other parameters needed to commission, maintain and diagnose electrical systems. The category spans portable field tools and higher-value analyzers used in utilities, factories, rail systems, renewable plants, EV and battery development, and safety-certification environments. The economic value lies in avoided failure, documented compliance, faster commissioning and verified efficiency rather than in the measurement reading alone.

Demand is increasingly split between routine maintenance and precision engineering. A field electrician may need a rugged multimeter, clamp meter or insulation tester, while an EV-inverter engineer may require high-bandwidth power analysis with traceable calibration. Hioki’s 2026 calibration research demonstrated very low uncertainty at hundreds of kilohertz and megahertz frequencies, illustrating how the market is moving toward measuring smaller losses at higher switching frequencies as SiC and GaN power electronics improve.

Energy-system expansion creates a large installed base to test. IRENA reported 585 GW of renewable capacity additions in 2024, bringing global renewable power capacity to 4,448 GW, while the IEA says more than 2,500 GW of generation, storage and large-load projects are stalled in grid queues. Every new substation, inverter, cable, transformer, battery system and industrial load creates acceptance, maintenance and power-quality testing requirements throughout its operating life.

Segment Analysis: By Type

By type, the source page segments the market into Acceptance Test Instruments, Daily Maintenance Test Instruments and Special Maintenance Test Instruments. Acceptance equipment leads because infrastructure commissioning and safety verification are mandatory before new or modified electrical systems are energized, while daily and special maintenance instruments create recurring demand across the installed asset base.

Type Technical / commercial role Market position
Acceptance Test Instruments Acceptance instruments are used during commissioning, certification or return-to-service checks to verify that electrical equipment meets design and safety requirements. The source page cites voltage testers, insulation testers and circuit analyzers as examples. These products are purchased for substations, renewable plants, factories, rail systems and high-voltage equipment where recorded results must support an engineering or regulatory decision. Leading type because infrastructure investment creates a non-discretionary test event before energization. Higher-voltage renewable and EV systems raise measurement ranges, while digital logging reduces commissioning time. Each new transformer, switchgear section, cable or protection circuit must be verified before operation, creating a repeatable demand mechanism tied directly to capital investment.
Daily Maintenance Test Instruments Daily maintenance products include digital multimeters, clamp meters, handheld insulation testers, earth testers and other portable tools used to diagnose routine faults and verify safe operating conditions. The value proposition is uptime: a reliable handheld instrument lets a technician isolate failed circuits quickly, confirm voltage status and document preventive-maintenance measurements before minor problems become outages. Largest unit-volume segment even when acceptance instruments lead market value. Products face heavy price competition because many functions are standardized, but professional users pay premiums for CAT safety ratings, accuracy, drop resistance, wireless logging and calibration support. Connected tools also reduce transcription by moving measurements directly into maintenance records.
Special Maintenance Test Instruments Special maintenance equipment addresses complex or infrequent diagnostics such as thermography, power-quality analysis, partial-discharge detection, high-voltage insulation analysis and transformer or battery testing. The source page explicitly names thermographic cameras and power-quality analyzers. These products require more training and are often shared across maintenance teams or provided by specialized service companies. High-value growth segment. Grid congestion, renewable integration, harmonics from power electronics and aging infrastructure increase the need for condition assessment that a basic meter cannot provide. Purchasing decisions focus on analytical software, sensor accuracy, standards support and application expertise, allowing specialist suppliers to defend higher ASPs and recurring calibration or service revenue.

Subtype examples referenced on the source page

The page provides concrete subtype examples under acceptance and special maintenance categories. These examples clarify report scope without creating an invented segmentation axis: voltage and insulation testing support commissioning and safety, while thermography and power-quality analysis address condition monitoring and system-level disturbances after equipment enters service. Commercially, supplier selection depends on demonstrated measurement accuracy, safe operating ranges, traceable calibration, repair turnaround and application expertise, because utilities and manufacturers cannot treat an unverified reading as acceptable simply because the underlying instrument has a competitive purchase price.

Subtype Role in the market
Voltage & Insulation Testers Voltage testers confirm circuit conditions and safe work states, while insulation testers apply controlled DC voltages to identify leakage or degradation in cables, motors, transformers and other equipment. Higher-voltage EV and solar systems are pushing portable and production testers toward 1,500 V, 2,000 V and multi-kilovolt ranges, creating replacement demand where older instruments cannot safely cover new architectures.
Circuit Analyzers Circuit analyzers evaluate wiring, protection and electrical behavior during commissioning or troubleshooting. As substations and industrial systems become more digital, technicians increasingly value instruments that combine measurement, logging and guided diagnostics. This reduces training burden and standardizes acceptance procedures across sites, supporting multifunction products rather than isolated single-purpose meters.
Thermographic Cameras Thermal imaging identifies hot connections, overloaded components and uneven heating without direct electrical contact. It is especially useful for energized switchgear, busbars, batteries and rotating equipment where failures create visible temperature signatures before catastrophic breakdown. Integration with electrical-maintenance workflows can strengthen the position of broad test-instrument suppliers despite competition from specialist imaging vendors.
Power Quality Analyzers Power-quality analyzers capture harmonics, flicker, voltage events, imbalance and transient behavior that basic meters cannot diagnose. Renewable inverters, data centers, EV chargers and industrial drives create complex loads, making standardized recording more valuable. Software licenses and standards packages increasingly extend the capability of a hardware platform after purchase.

Segment Analysis: By Application

By application, the source page segments the market into Power Grid, Railway, Municipal, Environmental Protection and Communications. Power Grid is the leading application because utilities must test substations, cables, transformers, protection systems and power quality during commissioning and throughout asset life, while renewable and storage integration makes those measurements more complex.

Application Demand characteristics
Power Grid Utilities use insulation, grounding, transformer, breaker, power-quality and protection test instruments across transmission and distribution assets. The IEA says annual grid investment must rise materially from around USD 400 billion and more than 2,500 GW of projects remain in connection queues. This investment creates acceptance demand for new assets and recurring maintenance demand after they enter service.
Railway Rail electrification requires testing of traction power, signaling supplies, substations, grounding, batteries and increasingly high-voltage DC systems. Modern professional meters now target electric railway alongside solar and data-center environments, showing how higher-voltage field tools cross application boundaries. Buyers emphasize safety category, ruggedness and service because instruments are used across geographically distributed infrastructure.
Municipal Municipal applications include water treatment, public buildings, street lighting, transport infrastructure and local power distribution. Maintenance teams operate diverse equipment with limited specialist staff, so multifunction portable instruments and guided diagnostics can reduce training requirements. Demand grows with smart-city electrification but remains budget-sensitive, favoring products that combine several routine tests in one tool.
Environmental Protection Environmental and clean-energy infrastructure includes solar, wind, storage, water treatment and emissions-control systems that depend on reliable electrical conversion and monitoring. Record renewable additions increase the installed base requiring commissioning, insulation, grounding and power-performance verification. Instruments that can test high-voltage DC, inverter efficiency and power quality gain value as power-electronics content increases.
Communications Telecom towers, switching facilities, data centers and backup-power systems require battery, grounding, power-quality and electrical-safety testing. Network uptime makes preventive maintenance economically important, especially where sites are remote. Connected instruments can move measurements into centralized maintenance systems rather than relying on handwritten records from dispersed field visits.

Secondary segmentation: By End User

The source page lists Utility Providers, Industrial Facilities, Service Providers and Government Agencies as end users. Utilities are the largest group because grid assets require recurring electrical testing, while industrial and service organizations purchase a broader mix of maintenance, safety and specialized diagnostic equipment. For instrument buyers, headline growth is secondary to matching voltage category, bandwidth, accuracy, sensor range, applicable standards and calibration support to the actual test procedure, since an otherwise advanced instrument can be unsuitable if it does not fit the measurement environment.

End user Commercial characteristics
Utility Providers Utilities operate high-value transmission and distribution assets whose failures can cause large outages and regulatory penalties. They buy portable field tools as well as specialized transformer, breaker, cable and power-quality systems. Calibration traceability, ruggedness, technical training and local service are central because instruments become part of formal maintenance and commissioning procedures.
Industrial Facilities Factories use electrical test instruments for motors, drives, switchgear, production equipment, EV/battery systems and energy management. Demand ranges from handheld meters to precision power analyzers. Maintenance teams prioritize ease of use and connectivity, while R&D groups emphasize bandwidth and accuracy, creating different purchasing centers inside one industrial customer.
Service Providers Electrical contractors, commissioning specialists and maintenance companies use instruments across many customer sites, making portability, broad measurement range and dependable calibration important. Service providers can also support rental or equipment-as-a-service models because they monetize instrument utilization rather than owning tools solely for internal use, increasing recurring demand for calibration and accessories.
Government Agencies Government buyers include infrastructure departments, public utilities, laboratories and safety organizations. Procurement is specification-driven and often requires documented standards compliance, traceable calibration and long support life. Large grid, rail and public-building programs can create volume tenders, but budgeting, qualification and competitive procurement lengthen sales cycles.

Global Electric Test Instrument Market Share & Analysis

Regional Analysis

Asia Pacific is the largest market, with the source page citing a 42% share and strong activity in China and India. The region also leads global renewable-capacity additions: IRENA reported Asia added more than 400 GW in 2024, creating substantial commissioning and maintenance workloads across grids, solar, storage and industrial electrical systems.

Why do grid investment, standards and industrial structure create different regional test-instrument markets?

Asia Pacific combines the fastest infrastructure expansion with major instrument manufacturers in Japan and China. North America emphasizes workplace electrical safety, grid resilience and high-value industrial tools. Europe adds harmonized IEC standards and renewable integration. South America is driven by utilities, mining and hydroelectric assets, while Middle East & Africa demand splits between high-end Gulf infrastructure and rugged portable tools for wider electrification.

Region Position Growth outlook Demand profile What decides supplier selection
Asia Pacific Largest Highest Grid, renewable and industrial expansion-led Price/performance, calibration, local service and high-voltage capability
North America Major innovation market High Grid resilience, safety and industrial-led CAT ratings, standards support, connectivity and service
Europe Mature Moderate to high Standards, renewables and industrial efficiency-led IEC compliance, traceability and power-quality capability
South America Emerging Moderate Utilities, mining and renewables-led Ruggedness, service network and affordability
Middle East & Africa Emerging Moderate to high Gulf infrastructure and electrification-led High-voltage capability, durability and local support
Asia Pacific LARGEST & FASTEST

Why does Asia Pacific lead the electric test instrument market?

Asia Pacific combines massive grid construction, renewable deployment, rail electrification, manufacturing and electronics production. The source page assigns the region a 42% share, while IRENA reported Asia added more than 400 GW of renewable capacity in 2024. That scale creates continuous acceptance testing for new assets and recurring maintenance demand across the installed base.

Market positionLargest
Growth outlookHighest
Demand profileGrid, renewable and manufacturing-led
Market access gatePrice/performance, calibration and service
Country / subregion Position Demand mechanism
China Largest regional infrastructure market China’s power grid, renewable capacity, EV manufacturing, rail and electronics industries create demand ranging from maintenance meters to precision analyzers. Local manufacturers increase price competition, so global brands defend share through accuracy, calibration, application software and specialized high-voltage or power-quality capability.
Japan Precision instrument technology hub Japan is home to established precision test-instrument suppliers and sophisticated automotive, electronics and power industries. Buyers value traceability and manufacturing integration. High-frequency calibration work and new EV safety testers show how demand is moving toward smaller measurable losses and automated production testing.
India & Southeast Asia High-growth infrastructure markets India’s transmission plans support hundreds of gigawatts of generation additions through 2032, while Southeast Asia continues electrification and renewable buildout. The opportunity favors rugged, affordable instruments with local calibration and training because the technician base is expanding alongside infrastructure.

Market instances

  • IRENA reported that Asia added more than 400 GW of renewable capacity in 2024, far more than any other region. Solar and wind projects require acceptance testing of insulation, grounding, DC strings, inverters and grid interfaces before connection, then periodic maintenance throughout the operating life. For test-instrument suppliers, the development matters because it changes a measurable voltage, frequency, accuracy, safety or compliance requirement, which can trigger instrument replacement, new calibration procedures or additional commissioning work rather than merely signaling broad technology enthusiasm.
  • India’s power-sector planning supports large additions of solar, wind and other generation through 2032. That scale of network expansion requires substation, cable, transformer, protection and power-quality testing, creating a long-duration demand pipeline rather than a single equipment-purchase event. For test-instrument suppliers, the development matters because it changes a measurable voltage, frequency, accuracy, safety or compliance requirement, which can trigger instrument replacement, new calibration procedures or additional commissioning work rather than merely signaling broad technology enthusiasm.
  • Hioki’s 2026 calibration research achieved very low uncertainty at 200 kHz and 1 MHz. This matters to Japan and the broader region because EV and clean-energy power electronics are switching faster and wasting less energy, so manufacturers need more precise instruments to distinguish real efficiency improvements from measurement error. For test-instrument suppliers, the development matters because it changes a measurable voltage, frequency, accuracy, safety or compliance requirement, which can trigger instrument replacement, new calibration procedures or additional commissioning work rather than merely signaling broad technology enthusiasm.

Asia Pacific contains both premium precision markets and price-sensitive infrastructure markets. Global suppliers need high-end measurement platforms for Japan, Korea and advanced Chinese customers while offering rugged instruments and strong training support for rapidly expanding utility and contractor populations across India and Southeast Asia. For electric-test vendors, market economics vary sharply by measurement class: a handheld meter is highly price competitive, whereas a power analyzer, hipot tester or grid diagnostic platform can sustain premium pricing when the measurement directly affects safety, certification, yield or asset uptime.

North America SAFETY & GRID RESILIENCE

What drives test-instrument demand in North America?

North America combines an aging grid, large industrial and data-center loads, renewable buildout and formal electrical-safety practices. U.S. grid-resilience programs authorize billions of dollars of investment, while NFPA 70E remains a core workplace electrical-safety standard, supporting recurring demand for professional-grade test equipment. Through 2034, electric-test suppliers gain the strongest position when metrology performance is backed by traceable calibration, standards documentation, regional laboratories and application support that technicians can use in real commissioning and maintenance work.

Market positionMajor innovation market
Growth outlookHigh
Demand profileGrid resilience and safety-led
Market access gateCAT safety, standards support and service
Country / subregion Position Demand mechanism
United States Primary regional market Utilities, industrial plants, solar developers and contractors buy broad instrument portfolios. Grid-resilience funding and rapid data-center power growth add workloads, while electrical-safety practices make instrument category ratings and correct measurement procedures central to procurement and technician training.
Canada Utility and industrial maintenance market Canada’s large geography, hydroelectric base, mining and industrial facilities create demand for rugged field equipment and high-voltage testing. Remote assets increase the value of reliable portable instruments and data logging because technicians must diagnose issues efficiently during limited site visits.
Mexico Industrial manufacturing opportunity Mexico’s automotive, electronics and industrial manufacturing base creates demand for production-line safety testers, multimeters and power analyzers. Multinational factories often standardize instruments globally, giving established brands an advantage when they can provide local calibration, Spanish-language support and replacement inventory.

Market instances

  • U.S. grid-resilience programs provide multibillion-dollar support for preventing outages and strengthening infrastructure. New or upgraded substations, lines, storage systems and protection equipment create direct commissioning and maintenance work, so test-instrument demand follows capital spending rather than depending only on replacement of existing meters. For test-instrument suppliers, the development matters because it changes a measurable voltage, frequency, accuracy, safety or compliance requirement, which can trigger instrument replacement, new calibration procedures or additional commissioning work rather than merely signaling broad technology enthusiasm.
  • NFPA 70E structures electrical safety-related work practices in the workplace. Instruments used to verify absence of voltage or diagnose energized systems therefore need appropriate ratings and dependable leads, not only nominal accuracy. This supports premium professional tools and recurring replacement when voltage classes or work procedures change. For test-instrument suppliers, the development matters because it changes a measurable voltage, frequency, accuracy, safety or compliance requirement, which can trigger instrument replacement, new calibration procedures or additional commissioning work rather than merely signaling broad technology enthusiasm.
  • Professional 1,500 V-class multimeters are now positioned for solar PV, wind, electric railway and data-center DC environments. These tools illustrate how North American field instrumentation is adapting to higher DC system voltages, allowing one portable platform to cover applications that exceed the safe range of older 1,000 V instruments. For test-instrument suppliers, the development matters because it changes a measurable voltage, frequency, accuracy, safety or compliance requirement, which can trigger instrument replacement, new calibration procedures or additional commissioning work rather than merely signaling broad technology enthusiasm.

North American buyers pay for documented safety, service and productivity. Premium brands can defend price when instruments reduce troubleshooting time or support higher-voltage applications, but contractor and facility markets remain competitive enough that ease of use and channel availability are still critical. The resulting market rewards instrument makers that can prove accuracy over time, keep calibration chains intact and support technicians after deployment, because a meter or analyzer becomes part of a formal maintenance, production or safety procedure rather than a disposable electronics purchase.

Europe STANDARDS & ENERGY TRANSITION

Why does Europe support premium electrical testing demand?

Europe combines harmonized safety standards, mature industrial maintenance and a large energy-transition program. IEC 61010 establishes safety requirements for electrical measurement equipment, while renewable and grid integration increase the need for power-quality, insulation and high-voltage testing. Buyers therefore evaluate both instrument performance and evidence that products fit standardized safety and calibration frameworks.

Market positionMature
Growth outlookModerate to high
Demand profileStandards and energy-transition-led
Market access gateIEC compliance, calibration and interoperability
Country / subregion Position Demand mechanism
Germany Industrial and renewable center Germany’s manufacturing, automotive and renewable sectors require field maintenance and precision power measurement. Buyers emphasize traceable calibration and preventive maintenance because downtime is expensive, while inverter and motor development creates demand for high-bandwidth analyzers beyond routine electrician tools.
United Kingdom Utility and service market The UK’s grid modernization, offshore wind and large electrical-service sector support portable insulation, grounding and power-quality instruments. Strong utility and contractor relationships, documented calibration and standards support influence purchasing alongside basic instrument specifications.
France & Nordics Low-carbon power and industrial demand Nuclear, renewables, electrified transport and data centers create diverse test needs. Nordic grids and industrial users also value power-quality and efficiency analysis as more inverter-based generation and electronically controlled loads connect.

Market instances

  • IEC 61010-1 defines general safety requirements for electrical test and measurement equipment used in professional and non-professional locations. Compliance is commercially important because European buyers often specify standards explicitly in tenders and internal procedures, making safety design a market-access requirement rather than an optional product feature. For test-instrument suppliers, the development matters because it changes a measurable voltage, frequency, accuracy, safety or compliance requirement, which can trigger instrument replacement, new calibration procedures or additional commissioning work rather than merely signaling broad technology enthusiasm.
  • Rapid renewable integration increases power-quality complexity. Inverters, storage and electronically controlled loads can introduce harmonics, flicker and fast switching behavior that simple meters cannot diagnose. Software-defined standards measurement is therefore becoming part of premium analyzer differentiation, allowing the same hardware platform to address evolving compliance requirements. For test-instrument suppliers, the development matters because it changes a measurable voltage, frequency, accuracy, safety or compliance requirement, which can trigger instrument replacement, new calibration procedures or additional commissioning work rather than merely signaling broad technology enthusiasm.
  • Europe represents a mature but still expanding renewable fleet where commissioning demand is complemented by long-term maintenance. Each solar, wind or storage installation creates recurring opportunities for insulation, earth, power-quality and thermographic instruments across utility and industrial service organizations. For test-instrument suppliers, the development matters because it changes a measurable voltage, frequency, accuracy, safety or compliance requirement, which can trigger instrument replacement, new calibration procedures or additional commissioning work rather than merely signaling broad technology enthusiasm.

Europe is a documentation-heavy market. Manufacturers that can provide standards compliance, calibration traceability, data-management software and long lifecycle support are better positioned than suppliers competing only on headline accuracy or low price. Commercially, supplier selection depends on demonstrated measurement accuracy, safe operating ranges, traceable calibration, repair turnaround and application expertise, because utilities and manufacturers cannot treat an unverified reading as acceptable simply because the underlying instrument has a competitive purchase price.

South America UTILITY & MINING

Where does South American demand concentrate?

South American demand is strongest in Brazil and other utility, mining, oil and renewable-energy centers. Assets are often geographically dispersed and exposed to harsh field conditions, so rugged portable instruments, insulation testers and power-quality tools deliver practical value. Economic volatility can delay premium upgrades, making service support and lifecycle cost important purchase considerations.

Market positionEmerging
Growth outlookModerate
Demand profileUtilities, mining and renewables-led
Market access gateRuggedness, service and affordability
Country / subregion Position Demand mechanism
Brazil Largest regional demand Brazil’s hydroelectric grid, renewable expansion, mining and industrial base require routine maintenance and commissioning tools. Technicians often work across dispersed assets, increasing the value of portable equipment and data logging. Local calibration and Portuguese-language support can materially influence vendor selection.
Chile Mining and renewable niche Chile combines mining, long-distance transmission and strong solar resources. Electrical test requirements include high-voltage insulation, grounding, motors, drives and PV diagnostics. Remote desert sites reward instruments that are rugged, transportable and capable of storing data for later engineering review.
Argentina & Rest of Region Selective utility investment Grid and renewable projects create demand, but currency and capital constraints can lengthen replacement cycles. Buyers may keep instruments longer, creating opportunities for calibration and repair services alongside new equipment sales. Distributors with local inventory gain advantage when import lead times are uncertain.

Market instances

  • Global renewable capacity additions are heavily weighted toward solar and wind, and South American countries participate through hydro, solar and wind projects. New installations create commissioning work for insulation, grounding and power-quality instruments, especially at remote projects where portable equipment must document results without permanent laboratory infrastructure. For test-instrument suppliers, the development matters because it changes a measurable voltage, frequency, accuracy, safety or compliance requirement, which can trigger instrument replacement, new calibration procedures or additional commissioning work rather than merely signaling broad technology enthusiasm.
  • Brazil’s large utility and industrial base creates maintenance demand beyond new-project construction. Electrical faults in mines, processing plants or hydro facilities can stop high-value operations, so predictive maintenance and power-quality analysis have direct economic value and can justify specialized analyzers despite cautious capital spending. For test-instrument suppliers, the development matters because it changes a measurable voltage, frequency, accuracy, safety or compliance requirement, which can trigger instrument replacement, new calibration procedures or additional commissioning work rather than merely signaling broad technology enthusiasm.
  • Service networks are a structural competitive factor because advanced instruments require periodic calibration or repair. A manufacturer without regional service can lose to a technically similar product that can be serviced locally, giving distributors and authorized laboratories an important role in the value chain. For test-instrument suppliers, the development matters because it changes a measurable voltage, frequency, accuracy, safety or compliance requirement, which can trigger instrument replacement, new calibration procedures or additional commissioning work rather than merely signaling broad technology enthusiasm.

The region is sensitive to both instrument price and downtime cost. Suppliers should combine durable hardware with local calibration, repair and application support, using service capability to defend premium pricing where customers cannot tolerate long international repair cycles. For instrument buyers, headline growth is secondary to matching voltage category, bandwidth, accuracy, sensor range, applicable standards and calibration support to the actual test procedure, since an otherwise advanced instrument can be unsuitable if it does not fit the measurement environment.

Middle East & Africa INFRASTRUCTURE & ELECTRIFICATION

What creates electric-test demand in the Middle East & Africa?

The Gulf is building power, renewable, industrial and data-center infrastructure that supports high-end test equipment, while many African markets require rugged portable tools for grid expansion, telecom power and off-grid electrification. The region therefore spans premium project-based analyzers and basic maintenance instruments, with local training and service coverage often determining whether advanced features are used effectively.

Market positionEmerging
Growth outlookModerate to high
Demand profileInfrastructure and electrification-led
Market access gateEnvironmental durability and local support
Country / subregion Position Demand mechanism
GCC Premium infrastructure market Large utility, oil and gas, renewable and data-center projects create demand for high-voltage testers, power-quality analyzers and safety instruments. Buyers expect instruments to withstand high temperatures and support formal commissioning records, while multinational engineering contractors often specify globally recognized brands.
South Africa Industrial and utility hub South Africa has the continent’s most mature industrial and utility maintenance base. Grid reliability challenges and mining create demand for insulation, grounding, power-quality and rotating-equipment diagnostics, while local service capability is important because instruments are used intensively in field conditions.
Sub-Saharan Africa Electrification and telecom growth Grid extension, mini-grids, solar, telecom towers and backup-power systems create demand for practical portable instruments. Budgets and training can be constrained, so ruggedness, simple interfaces and distributor support often matter more than advanced connectivity features.

Market instances

  • Gulf countries continue adding solar, storage, data centers and other low-carbon infrastructure. Utility-scale PV and battery systems operate at high DC voltages and connect through sophisticated inverters, creating commissioning and maintenance demand for insulation, current, power and power-quality instruments suited to large project environments. For test-instrument suppliers, the development matters because it changes a measurable voltage, frequency, accuracy, safety or compliance requirement, which can trigger instrument replacement, new calibration procedures or additional commissioning work rather than merely signaling broad technology enthusiasm.
  • Wider African electrification through grid-connected and off-grid projects creates testing requirements for earthing, insulation, voltage and protection. The commercial opportunity favors rugged instruments and technician training because equipment is often used in field environments with limited access to specialist calibration support. For test-instrument suppliers, the development matters because it changes a measurable voltage, frequency, accuracy, safety or compliance requirement, which can trigger instrument replacement, new calibration procedures or additional commissioning work rather than merely signaling broad technology enthusiasm.
  • Gulf oil, gas, industrial and data-center facilities also create demand independent of renewables. High-value continuous operations justify preventive electrical maintenance because an unexpected fault can stop production or computing loads, supporting premium service-oriented instruments when vendors provide local calibration and engineering support. For test-instrument suppliers, the development matters because it changes a measurable voltage, frequency, accuracy, safety or compliance requirement, which can trigger instrument replacement, new calibration procedures or additional commissioning work rather than merely signaling broad technology enthusiasm.

MEA should be split between sophisticated Gulf project demand and broader African electrification. The former supports premium high-voltage and power-quality systems; the latter rewards durable, affordable field tools backed by training and local distribution. For electric-test vendors, market economics vary sharply by measurement class: a handheld meter is highly price competitive, whereas a power analyzer, hipot tester or grid diagnostic platform can sustain premium pricing when the measurement directly affects safety, certification, yield or asset uptime.

Competitive Landscape

Competition spans global professional-instrument leaders, specialist power-system test companies and lower-cost regional manufacturers. The source page’s detailed company-profile section contains a broader list than its summary, including Hioki, Fluke, Megger, Kikusui, AEMC, Reed, DV Power, ITECH and several Chinese suppliers. The full detailed list is preserved, while competitive tiering distinguishes direct manufacturers from distributors or adjacent participants.

Fluke, Hioki and Megger compete through trusted accuracy, broad portfolios, calibration networks and strong application brands. Their advantage is strongest where instrument failure or incorrect measurement creates safety or downtime risk. Kikusui and Hioki also address production and R&D testing with programmable safety testers and precision power analyzers, giving them exposure to EV, battery and power-electronics investment beyond field maintenance.

Specialist suppliers such as DV Power, AEMC and ITECH compete in narrower transformer, electrical, power or programmable test segments where domain knowledge can matter more than a complete catalog. Chinese manufacturers and regional vendors can compete aggressively on cost and domestic relationships, particularly in infrastructure projects where buyers need adequate performance across large fleets of instruments.

The source page’s summary company list and detailed profile table do not fully match. The detailed section is used as the fuller statement of report scope rather than silently choosing one inconsistent list. Some entries, such as distributors or broader infrastructure vendors, are retained in the scope table but are not over-ranked as direct instrument manufacturers in the competitive tier analysis.

Competitive tier Companies Why they matter
Global professional leaders Hioki; FLUKE; Megger; KIKUSUI; Aemc Instruments These companies sell established professional measurement portfolios with strong calibration, service and application support. They are best positioned in utilities, automotive, electronics and safety-critical work where accuracy, CAT ratings, standards support and long-term technical service can justify a premium over lower-cost instruments.
Specialist test & measurement vendors DV Power; ITECH; Reed Instruments; Hoyt Electrical Instrument; Duncan Instruments These firms compete in electrical, power, component or field-measurement niches. Their commercial advantage comes from application depth, flexible product ranges and specialist channel relationships rather than the scale of the largest global portfolios. Niche expertise can protect margin when customers need purpose-built test sequences or uncommon measurement ranges.
Regional / value-oriented suppliers Hopetech; Applent; Aitelong; TES; BLUE-KEY; Nanjing Jindian Electric Regional manufacturers participate strongly in price-sensitive industrial and infrastructure demand, particularly in Asia. They can gain share by offering adequate accuracy and functions at lower cost, but international expansion depends on certification, calibration credibility, documentation and after-sales service strong enough to satisfy professional procurement requirements.

Companies profiled in the report

The detailed source-page table of contents profiles Hioki, FLUKE, Megger, KIKUSUI, Aemc Instruments, Pentair, Amprobe, Reed Instruments, RS Components, Duncan Instruments, Hoyt Electrical Instrument, DV Power, Hopetech, Applent, ITECH, Aitelong, TES, BLUE-KEY and Nanjing Jindian Electric. The list is reproduced in full for report-scope consistency even though several entries are distributors, brands or adjacent suppliers rather than directly comparable manufacturers.

Production Capacity Analysis

Production capacity combines precision analog electronics, current and voltage sensors, high-voltage isolation, mechanical housings, displays, batteries, probes and calibration systems. The limiting resource for premium instruments is often metrology and calibration capability rather than simple PCB assembly: a manufacturer must prove that every measurement range remains within specification across temperature, frequency and safety category before the product can ship.

Professional meters use precision resistors, ADCs, isolation components, current sensors, high-voltage dividers and specialized connectors that must remain stable over time. A supply disruption affecting a calibrated component can require redesign and requalification rather than simple substitution. Instrument manufacturers therefore maintain longer component lifecycles and more conservative design-change processes than consumer-electronics producers.

Calibration capability is a strategic asset. High-frequency power measurement becomes increasingly difficult as converters switch faster and losses shrink. Suppliers able to maintain traceability at hundreds of kilohertz and beyond can differentiate both instruments and service offerings, because customers need confidence that apparent efficiency gains are larger than the uncertainty of the measurement system itself.

Final assembly and test are increasingly software-intensive. Instruments may require firmware, logging applications, wireless connectivity and standards-specific measurement packages. A single hardware platform can gain new harmonics, flicker or reporting functions through software, reducing the need for separate instruments but increasing validation and cybersecurity requirements before commercial release. Through 2034, electric-test suppliers gain the strongest position when metrology performance is backed by traceable calibration, standards documentation, regional laboratories and application support that technicians can use in real commissioning and maintenance work.

Market Dynamics

The market is pulled by grid and renewable investment, higher-voltage electrification, stricter safety practice and more precise power-electronics measurement, but growth is restrained by premium equipment cost, skilled-user requirements, calibration burden and price competition. The highest-value growth occurs where a measurement changes an engineering, compliance or safety decision rather than merely displaying a number.

Market Drivers

Driver Directional impact* Commercial mechanism
Grid investment High The IEA says more than 2,500 GW of projects are waiting in grid connection queues and annual grid investment needs to rise substantially from current levels. New and upgraded assets require commissioning, protection, insulation and maintenance testing.
Renewable expansion High IRENA reported 585 GW of renewable additions in 2024, equal to 92.5% of global power-capacity expansion. Solar, wind and storage create new high-voltage DC, inverter, grounding and power-quality test requirements.
Electrical safety compliance Medium to High IEC 61010 and workplace safety practices shape instrument design and use. Professional buyers need tools with appropriate safety categories and documented performance, supporting premium products and standards-driven replacement.
EV and power electronics R&D Medium to High SiC/GaN inverters and high-voltage batteries require precise high-frequency power, current, resistance and hipot measurement. New analyzers and safety testers demonstrate how electrification creates laboratory and production demand beyond utility maintenance.

Grid expansion creates recurring testing demand

The IEA reports a large backlog of generation, storage and major-load projects waiting for grid connection and calls for much higher network investment. Every new line, substation and transformer creates acceptance tests before energization and maintenance tests afterward. Instrument demand therefore follows the lifecycle of infrastructure rather than only replacement of existing meters.

Record renewable additions change measurement requirements

IRENA reported 585 GW of renewable capacity additions in 2024. Utility-scale PV commonly operates at high DC voltages, while inverters and storage add harmonics and fast switching. Technicians therefore need higher-voltage meters, insulation testers, ground-fault tools and analyzers capable of verifying power quality and conversion efficiency. The resulting market rewards instrument makers that can prove accuracy over time, keep calibration chains intact and support technicians after deployment, because a meter or analyzer becomes part of a formal maintenance, production or safety procedure rather than a disposable electronics purchase.

Safety practice sustains replacement of professional field tools

IEC 61010 and workplace electrical-safety procedures make test instruments part of a safety system rather than a simple measurement purchase. As technicians work on higher-voltage solar, storage and industrial systems, older meters may no longer have an appropriate category or voltage rating, creating standards-driven replacement demand. Commercially, supplier selection depends on demonstrated measurement accuracy, safe operating ranges, traceable calibration, repair turnaround and application expertise, because utilities and manufacturers cannot treat an unverified reading as acceptable simply because the underlying instrument has a competitive purchase price.

EV and clean-energy electronics require tighter metrology

High-frequency SiC and GaN converters reduce power loss but make the remaining losses harder to measure. EV and inverter developers therefore need analyzers whose uncertainty is small relative to the efficiency improvement being verified. This supports premium laboratory and production platforms even when the basic multimeter market is mature. For instrument buyers, headline growth is secondary to matching voltage category, bandwidth, accuracy, sensor range, applicable standards and calibration support to the actual test procedure, since an otherwise advanced instrument can be unsuitable if it does not fit the measurement environment.

Market Restraints

Restraint Directional impact* Commercial mechanism
Premium instrument cost Medium to High High-accuracy analyzers, power-quality systems and safety testers can cost far more than handheld meters. Small contractors and developing-market utilities may extend replacement cycles or choose lower-cost tools unless productivity or safety benefits are clear.
Skilled-user requirement Medium Advanced instruments can record many parameters, but incorrect setup produces unreliable results. Organizations must train technicians to select sensors, ranges and standards correctly, slowing adoption of features beyond routine maintenance needs.
Calibration and service burden Medium Professional instruments require periodic calibration, repair and firmware support. Customers without local service networks can face long downtime and shipping costs, reducing the appeal of premium tools from suppliers with weak regional coverage.
Rapid feature obsolescence Medium Wireless logging, software integration and higher voltage or frequency ranges advance quickly. Manufacturers face R&D and inventory risk, while customers may delay purchases when platform upgrades or new standards are expected.

High-end equipment can be difficult to justify for small teams

A precision analyzer or advanced safety tester can improve confidence and save engineering time, but the upfront cost may exceed the budget of small contractors or municipal maintenance teams. If the instrument is used only a few times per year, renting or outsourcing can be more economical, limiting direct unit penetration despite genuine technical need.

Advanced measurement requires application expertise

Modern instruments can measure harmonics, transient events, insulation trends, phase relationships and high-frequency power with great precision, but the result is only useful if the operator configures the test correctly. Training gaps can cause organizations to underuse purchased equipment or rely on specialist service providers instead of buying premium tools directly.

Calibration infrastructure is uneven by region

A professional test instrument must remain traceable throughout its service life. In markets without authorized calibration centers, customers may need to ship equipment internationally, increasing downtime and cost. This can outweigh a technical performance advantage, giving vendors with local laboratories or strong service partners a durable competitive position. For electric-test vendors, market economics vary sharply by measurement class: a handheld meter is highly price competitive, whereas a power analyzer, hipot tester or grid diagnostic platform can sustain premium pricing when the measurement directly affects safety, certification, yield or asset uptime.

Technology cycles raise manufacturer R&D risk

Higher DC voltage, faster semiconductor switching and connected software platforms force manufacturers to refresh designs before older models fully depreciate. A supplier may invest in a new analyzer only to see customer requirements move to another interface, standard or frequency range, increasing engineering cost and shortening commercial product cycles. Through 2034, electric-test suppliers gain the strongest position when metrology performance is backed by traceable calibration, standards documentation, regional laboratories and application support that technicians can use in real commissioning and maintenance work.

Market Opportunities

High-voltage renewable and storage testing

Professional 1,500 V and 2,000 V-class probes and meters show how field measurement is moving beyond the 1,000 V range common in older tools. Utility-scale solar, batteries and high-voltage DC architectures create a replacement opportunity for meters, clamps, insulation testers and fault-detection tools that can work safely at new system voltages.

Software-defined standards and reporting

Modern analyzers can add harmonics, flicker or reporting functions through optional software licenses. Vendors can monetize standards packages, automated reports and connected data workflows after the hardware purchase, creating recurring revenue while helping customers standardize procedures across many sites and instrument fleets. The resulting market rewards instrument makers that can prove accuracy over time, keep calibration chains intact and support technicians after deployment, because a meter or analyzer becomes part of a formal maintenance, production or safety procedure rather than a disposable electronics purchase.

Equipment-as-a-service and calibration subscriptions

Customers that use expensive instruments intermittently may prefer rental, subscription or managed-service models that include calibration and replacement. Manufacturers and distributors can increase utilization of premium equipment while creating recurring revenue, particularly for power-quality analyzers, thermal cameras and specialized high-voltage systems used during project commissioning. Commercially, supplier selection depends on demonstrated measurement accuracy, safe operating ranges, traceable calibration, repair turnaround and application expertise, because utilities and manufacturers cannot treat an unverified reading as acceptable simply because the underlying instrument has a competitive purchase price.

EV battery and power-electronics production testing

Automated hipot, insulation-resistance, contact and waveform tests are increasingly integrated into EV battery and inverter production. Suppliers that combine fast cycles, global safety certification and data traceability can become embedded in manufacturing lines, creating higher switching costs and service opportunities than portable field instruments. For instrument buyers, headline growth is secondary to matching voltage category, bandwidth, accuracy, sensor range, applicable standards and calibration support to the actual test procedure, since an otherwise advanced instrument can be unsuitable if it does not fit the measurement environment.

Supply Chain Analysis

Stage 1
Precision components & sensors
Stage 2
Instrument design & assembly
Stage 3
Calibration, firmware & standards validation
Stage 4
Distribution, training & lifecycle service

Precision components & sensors

Instrument accuracy begins with stable resistors, ADCs, current sensors, high-voltage dividers, isolation components and probes. Suppliers must control temperature coefficient, bandwidth and long-term drift because the finished meter can only be as accurate as its internal references and sensors. Safety-critical components also need transient and insulation performance appropriate to the stated category rating.

Instrument design & assembly

Manufacturers design analog front ends, isolation, displays, processors, batteries and rugged enclosures around intended voltage, current and frequency ranges. Layouts must minimize leakage, noise and parasitic effects that distort measurements. Higher-voltage and MHz-range instruments therefore require more specialized engineering than commodity electronics assembly. For electric-test vendors, market economics vary sharply by measurement class: a handheld meter is highly price competitive, whereas a power analyzer, hipot tester or grid diagnostic platform can sustain premium pricing when the measurement directly affects safety, certification, yield or asset uptime.

Calibration, firmware & standards validation

Every professional instrument requires calibration against traceable references, while firmware implements calculations, logging and standards-specific functions. High-frequency calibration capability can become a competitive technology in its own right. Safety and application standards also require documentation and validation before customers can trust the instrument in regulated workflows. Through 2034, electric-test suppliers gain the strongest position when metrology performance is backed by traceable calibration, standards documentation, regional laboratories and application support that technicians can use in real commissioning and maintenance work.

Distribution, training & lifecycle service

Distributors, calibration laboratories and field-service partners make instruments usable across geographies. Buyers need product selection help, training, repair, recalibration and replacement accessories throughout the lifecycle. Service depth can determine vendor choice because a sophisticated analyzer that cannot be calibrated locally can create more operational risk than a slightly less advanced product with dependable support.

Recent Developments

Recent developments show the market moving toward higher measurement precision for fast-switching power electronics, higher voltage for EV and renewable systems, and more software-defined standards and data handling. These shifts expand instrument value even when basic handheld meter functionality is mature. The resulting market rewards instrument makers that can prove accuracy over time, keep calibration chains intact and support technicians after deployment, because a meter or analyzer becomes part of a formal maintenance, production or safety procedure rather than a disposable electronics purchase.

July 8, 2026 – Hioki advanced high-frequency power calibration

Hioki announced a calorimeter-based calibration method achieving very low uncertainty at 200 kHz and 1 MHz, materially improving confidence in high-frequency power measurement. The development matters because EV, renewable and data-center power electronics are switching faster and wasting less energy, so instrument uncertainty must shrink before engineers can verify small but commercially important efficiency improvements.

Source

June 2, 2026 – Hioki launched the ST5680A DC Hipot Tester

The ST5680A targets EV battery cells, modules and packs with high-voltage DC hipot capability, integrated contact checking and waveform recording. The product shows how safety testing is becoming more automated and data-rich. A single globally certified platform can reduce separate setup steps and improve production-line traceability, supporting higher-value instrument demand in battery manufacturing.

Source

March 2026 – IRENA published Renewable Capacity Statistics 2026

IRENA’s 2026 statistical release extends the global renewable-capacity series through 2025. Continued record-scale renewable deployment expands the installed base of PV, wind and storage systems requiring insulation, grounding, power-quality and performance testing. The opportunity is recurring because each project needs commissioning and then decades of periodic electrical maintenance. Commercially, supplier selection depends on demonstrated measurement accuracy, safe operating ranges, traceable calibration, repair turnaround and application expertise, because utilities and manufacturers cannot treat an unverified reading as acceptable simply because the underlying instrument has a competitive purchase price.

Source

October 3, 2025 – Hioki introduced the PW4001 portable power analyzer

Hioki launched the PW4001 to combine laboratory-grade power measurement with portability for field and development use. The platform later gained additional standards-related measurement capability, illustrating how suppliers can extend value through software after the initial hardware sale. It addresses EV, inverter and energy applications where both high accuracy and mobility are required.

Source

Report Scope & Segmentation

Attribute Coverage
Market Electric Test Instrument
Base Year 2025
Estimated Year 2026
Forecast Period 2026–2034
2025 Market Size USD 6.10 billion
2034 Forecast Size USD 10.74 billion
CAGR 6.5% (2026–2034)
Largest Market in 2025 Asia Pacific
By Type Acceptance Test Instruments; Daily Maintenance Test Instruments; Special Maintenance Test Instruments
By Application Power Grid; Railway; Municipal; Environmental Protection; Communications
By End User Utility Providers; Industrial Facilities; Service Providers; Government Agencies
Regions North America; Europe; Asia Pacific; South America; Middle East & Africa
Companies Profiled Hioki; FLUKE; Megger; KIKUSUI; Aemc Instruments; Pentair; Amprobe; Reed Instruments; RS Components; Duncan Instruments; Hoyt Electrical Instrument; DV Power; Hopetech; Applent; ITECH; Aitelong; TES; BLUE-KEY; Nanjing Jindian Electric

Frequently Asked Questions

What is the electric test instrument market size in 2025?

The source page publishes USD 5.73 billion in 2024 and USD 9.47 billion in 2032. Those anchors imply a 2025 value of approximately USD 6.10 billion. Applying the same compound growth factor produces an estimated USD 6.50 billion in 2026 and a projected USD 10.74 billion in 2034. For instrument buyers, headline growth is secondary to matching voltage category, bandwidth, accuracy, sensor range, applicable standards and calibration support to the actual test procedure, since an otherwise advanced instrument can be unsuitable if it does not fit the measurement environment.

What is the projected market size by 2034?

The rebased 2034 electric test instrument market is approximately USD 10.74 billion. This is calculated from the page’s 2024 and 2032 market-size anchors using a constant annual growth factor. The same factor yields a 2026–2034 CAGR of 6.5% after rounding, keeping the forecast internally consistent. For electric-test vendors, market economics vary sharply by measurement class: a handheld meter is highly price competitive, whereas a power analyzer, hipot tester or grid diagnostic platform can sustain premium pricing when the measurement directly affects safety, certification, yield or asset uptime.

Why is the CAGR 6.5% instead of the page’s 7.4%?

The page states 7.4%, but its own USD 5.73 billion 2024 value and USD 9.47 billion 2032 value imply approximately 6.48% annual compound growth. Under the required workflow, the two market-size anchors control when the printed CAGR does not reconcile with them, so the article uses 6.5%. Through 2034, electric-test suppliers gain the strongest position when metrology performance is backed by traceable calibration, standards documentation, regional laboratories and application support that technicians can use in real commissioning and maintenance work.

Which type leads the market?

The source page identifies Acceptance Test Instruments as the leading type, with voltage testers, insulation testers and circuit analyzers listed as examples. Infrastructure commissioning creates a mandatory testing event before energization, making acceptance equipment less discretionary than many routine maintenance purchases and supporting higher-value professional instruments. The resulting market rewards instrument makers that can prove accuracy over time, keep calibration chains intact and support technicians after deployment, because a meter or analyzer becomes part of a formal maintenance, production or safety procedure rather than a disposable electronics purchase.

Which application is the largest?

The source page identifies Power Grid as the leading application. Utilities require testing throughout the asset lifecycle, from insulation, grounding and protection checks during commissioning to power-quality, transformer and breaker diagnostics during maintenance. Large global grid-investment requirements support a strong structural demand mechanism. Commercially, supplier selection depends on demonstrated measurement accuracy, safe operating ranges, traceable calibration, repair turnaround and application expertise, because utilities and manufacturers cannot treat an unverified reading as acceptable simply because the underlying instrument has a competitive purchase price.

Which region is the largest market?

Asia Pacific is the largest market. The source page cites a 42% share, with China as a major contributor. The region also leads renewable and grid infrastructure expansion, while Japan hosts major precision-instrument suppliers, creating demand across field tools, utility acceptance equipment and high-precision EV or power-electronics analyzers. For instrument buyers, headline growth is secondary to matching voltage category, bandwidth, accuracy, sensor range, applicable standards and calibration support to the actual test procedure, since an otherwise advanced instrument can be unsuitable if it does not fit the measurement environment.

How do renewable energy projects affect demand?

IRENA reported 585 GW of renewable capacity additions in 2024, equal to 92.5% of total global power-capacity expansion. Solar, wind and storage require insulation, grounding, high-voltage DC, inverter-efficiency and power-quality testing during commissioning and maintenance, expanding both unit demand and the technical range required from professional instruments. For electric-test vendors, market economics vary sharply by measurement class: a handheld meter is highly price competitive, whereas a power analyzer, hipot tester or grid diagnostic platform can sustain premium pricing when the measurement directly affects safety, certification, yield or asset uptime.

What standards matter for electric test instruments?

IEC 61010 is a foundational safety standard for electrical measurement, control and laboratory equipment, while workplace electrical-safety rules guide instrument selection and use in many countries. Application-specific standards also govern harmonics, flicker, PV and production testing, so compliance affects both product design and technician procedures. Through 2034, electric-test suppliers gain the strongest position when metrology performance is backed by traceable calibration, standards documentation, regional laboratories and application support that technicians can use in real commissioning and maintenance work.

Who are the major companies profiled?

The detailed source-page profile list includes Hioki, FLUKE, Megger, KIKUSUI, Aemc Instruments, Pentair, Amprobe, Reed Instruments, RS Components, Duncan Instruments, Hoyt Electrical Instrument, DV Power, Hopetech, Applent, ITECH, Aitelong, TES, BLUE-KEY and Nanjing Jindian Electric. The article retains the full detailed list despite differences from the summary. The resulting market rewards instrument makers that can prove accuracy over time, keep calibration chains intact and support technicians after deployment, because a meter or analyzer becomes part of a formal maintenance, production or safety procedure rather than a disposable electronics purchase.

What is the most important strategic shift through 2034?

The most important shift is from stand-alone measurement toward connected, higher-voltage and higher-precision test platforms. EVs, SiC/GaN power electronics, renewables and digital grids require measurements that older instruments cannot perform safely or accurately. Suppliers combining traceable metrology, standards software, data logging and calibration service can capture more value than basic meter vendors.
Global Electric Test Instrument Market Research Report 2026-2034

Get Sample Report PDF for Exclusive Insights

Report Sample Includes

  • Table of Contents
  • List of Tables & Figures
  • Charts, Research Methodology, and more...

PDF Icon Download Sample Report PDF

Download Sample Report

Table of Content

Table of Contents
1 Research Methodology and Statistical Scope
1.1 Market Definition and Statistical Scope of Electric Test Instrument
1.2 Key Market Segments
1.2.1 Electric Test Instrument Segment by Type
1.2.2 Electric Test Instrument Segment by Application
1.3 Methodology & Sources of Information
1.3.1 Research Methodology
1.3.2 Research Process
1.3.3 Market Breakdown and Data Triangulation
1.3.4 Base Year
1.3.5 Report Assumptions & Caveats
2 Electric Test Instrument Market Overview
2.1 Global Market Overview
2.1.1 Global Electric Test Instrument Market Size (M USD) Estimates and Forecasts (2019-2032)
2.1.2 Global Electric Test Instrument Sales Estimates and Forecasts (2019-2032)
2.2 Market Segment Executive Summary
2.3 Global Market Size by Region
3 Electric Test Instrument Market Competitive Landscape
3.1 Global Electric Test Instrument Sales by Manufacturers (2019-2025)
3.2 Global Electric Test Instrument Revenue Market Share by Manufacturers (2019-2025)
3.3 Electric Test Instrument Market Share by Company Type (Tier 1, Tier 2, and Tier 3)
3.4 Global Electric Test Instrument Average Price by Manufacturers (2019-2025)
3.5 Manufacturers Electric Test Instrument Sales Sites, Area Served, Product Type
3.6 Electric Test Instrument Market Competitive Situation and Trends
3.6.1 Electric Test Instrument Market Concentration Rate
3.6.2 Global 5 and 10 Largest Electric Test Instrument Players Market Share by Revenue
3.6.3 Mergers & Acquisitions, Expansion
4 Electric Test Instrument Industry Chain Analysis
4.1 Electric Test Instrument Industry Chain Analysis
4.2 Market Overview of Key Raw Materials
4.3 Midstream Market Analysis
4.4 Downstream Customer Analysis
5 The Development and Dynamics of Electric Test Instrument Market
5.1 Key Development Trends
5.2 Driving Factors
5.3 Market Challenges
5.4 Market Restraints
5.5 Industry News
5.5.1 New Product Developments
5.5.2 Mergers & Acquisitions
5.5.3 Expansions
5.5.4 Collaboration/Supply Contracts
5.6 Industry Policies
6 Electric Test Instrument Market Segmentation by Type
6.1 Evaluation Matrix of Segment Market Development Potential (Type)
6.2 Global Electric Test Instrument Sales Market Share by Type (2019-2025)
6.3 Global Electric Test Instrument Market Size Market Share by Type (2019-2025)
6.4 Global Electric Test Instrument Price by Type (2019-2025)
7 Electric Test Instrument Market Segmentation by Application
7.1 Evaluation Matrix of Segment Market Development Potential (Application)
7.2 Global Electric Test Instrument Market Sales by Application (2019-2025)
7.3 Global Electric Test Instrument Market Size (M USD) by Application (2019-2025)
7.4 Global Electric Test Instrument Sales Growth Rate by Application (2019-2025)
8 Electric Test Instrument Market Segmentation by Region
8.1 Global Electric Test Instrument Sales by Region
8.1.1 Global Electric Test Instrument Sales by Region
8.1.2 Global Electric Test Instrument Sales Market Share by Region
8.2 North America
8.2.1 North America Electric Test Instrument Sales by Country
8.2.2 U.S.
8.2.3 Canada
8.2.4 Mexico
8.3 Europe
8.3.1 Europe Electric Test Instrument Sales by Country
8.3.2 Germany
8.3.3 France
8.3.4 U.K.
8.3.5 Italy
8.3.6 Russia
8.4 Asia Pacific
8.4.1 Asia Pacific Electric Test Instrument Sales by Region
8.4.2 China
8.4.3 Japan
8.4.4 South Korea
8.4.5 India
8.4.6 Southeast Asia
8.5 South America
8.5.1 South America Electric Test Instrument Sales by Country
8.5.2 Brazil
8.5.3 Argentina
8.5.4 Columbia
8.6 Middle East and Africa
8.6.1 Middle East and Africa Electric Test Instrument Sales by Region
8.6.2 Saudi Arabia
8.6.3 UAE
8.6.4 Egypt
8.6.5 Nigeria
8.6.6 South Africa
9 Key Companies Profile
9.1 Hioki
9.1.1 Hioki Electric Test Instrument Basic Information
9.1.2 Hioki Electric Test Instrument Product Overview
9.1.3 Hioki Electric Test Instrument Product Market Performance
9.1.4 Hioki Business Overview
9.1.5 Hioki Electric Test Instrument SWOT Analysis
9.1.6 Hioki Recent Developments
9.2 FLUKE
9.2.1 FLUKE Electric Test Instrument Basic Information
9.2.2 FLUKE Electric Test Instrument Product Overview
9.2.3 FLUKE Electric Test Instrument Product Market Performance
9.2.4 FLUKE Business Overview
9.2.5 FLUKE Electric Test Instrument SWOT Analysis
9.2.6 FLUKE Recent Developments
9.3 Megger
9.3.1 Megger Electric Test Instrument Basic Information
9.3.2 Megger Electric Test Instrument Product Overview
9.3.3 Megger Electric Test Instrument Product Market Performance
9.3.4 Megger Electric Test Instrument SWOT Analysis
9.3.5 Megger Business Overview
9.3.6 Megger Recent Developments
9.4 KIKUSUI
9.4.1 KIKUSUI Electric Test Instrument Basic Information
9.4.2 KIKUSUI Electric Test Instrument Product Overview
9.4.3 KIKUSUI Electric Test Instrument Product Market Performance
9.4.4 KIKUSUI Business Overview
9.4.5 KIKUSUI Recent Developments
9.5 Aemc Instruments
9.5.1 Aemc Instruments Electric Test Instrument Basic Information
9.5.2 Aemc Instruments Electric Test Instrument Product Overview
9.5.3 Aemc Instruments Electric Test Instrument Product Market Performance
9.5.4 Aemc Instruments Business Overview
9.5.5 Aemc Instruments Recent Developments
9.6 Pentair
9.6.1 Pentair Electric Test Instrument Basic Information
9.6.2 Pentair Electric Test Instrument Product Overview
9.6.3 Pentair Electric Test Instrument Product Market Performance
9.6.4 Pentair Business Overview
9.6.5 Pentair Recent Developments
9.7 Amprobe
9.7.1 Amprobe Electric Test Instrument Basic Information
9.7.2 Amprobe Electric Test Instrument Product Overview
9.7.3 Amprobe Electric Test Instrument Product Market Performance
9.7.4 Amprobe Business Overview
9.7.5 Amprobe Recent Developments
9.8 Reed Instruments
9.8.1 Reed Instruments Electric Test Instrument Basic Information
9.8.2 Reed Instruments Electric Test Instrument Product Overview
9.8.3 Reed Instruments Electric Test Instrument Product Market Performance
9.8.4 Reed Instruments Business Overview
9.8.5 Reed Instruments Recent Developments
9.9 RS Components
9.9.1 RS Components Electric Test Instrument Basic Information
9.9.2 RS Components Electric Test Instrument Product Overview
9.9.3 RS Components Electric Test Instrument Product Market Performance
9.9.4 RS Components Business Overview
9.9.5 RS Components Recent Developments
9.10 Duncan Instruments
9.10.1 Duncan Instruments Electric Test Instrument Basic Information
9.10.2 Duncan Instruments Electric Test Instrument Product Overview
9.10.3 Duncan Instruments Electric Test Instrument Product Market Performance
9.10.4 Duncan Instruments Business Overview
9.10.5 Duncan Instruments Recent Developments
9.11 Hoyt Electrical Instrument
9.11.1 Hoyt Electrical Instrument Electric Test Instrument Basic Information
9.11.2 Hoyt Electrical Instrument Electric Test Instrument Product Overview
9.11.3 Hoyt Electrical Instrument Electric Test Instrument Product Market Performance
9.11.4 Hoyt Electrical Instrument Business Overview
9.11.5 Hoyt Electrical Instrument Recent Developments
9.12 DV Power
9.12.1 DV Power Electric Test Instrument Basic Information
9.12.2 DV Power Electric Test Instrument Product Overview
9.12.3 DV Power Electric Test Instrument Product Market Performance
9.12.4 DV Power Business Overview
9.12.5 DV Power Recent Developments
9.13 Hopetech
9.13.1 Hopetech Electric Test Instrument Basic Information
9.13.2 Hopetech Electric Test Instrument Product Overview
9.13.3 Hopetech Electric Test Instrument Product Market Performance
9.13.4 Hopetech Business Overview
9.13.5 Hopetech Recent Developments
9.14 Applent
9.14.1 Applent Electric Test Instrument Basic Information
9.14.2 Applent Electric Test Instrument Product Overview
9.14.3 Applent Electric Test Instrument Product Market Performance
9.14.4 Applent Business Overview
9.14.5 Applent Recent Developments
9.15 ITECH
9.15.1 ITECH Electric Test Instrument Basic Information
9.15.2 ITECH Electric Test Instrument Product Overview
9.15.3 ITECH Electric Test Instrument Product Market Performance
9.15.4 ITECH Business Overview
9.15.5 ITECH Recent Developments
9.16 Aitelong
9.16.1 Aitelong Electric Test Instrument Basic Information
9.16.2 Aitelong Electric Test Instrument Product Overview
9.16.3 Aitelong Electric Test Instrument Product Market Performance
9.16.4 Aitelong Business Overview
9.16.5 Aitelong Recent Developments
9.17 TES
9.17.1 TES Electric Test Instrument Basic Information
9.17.2 TES Electric Test Instrument Product Overview
9.17.3 TES Electric Test Instrument Product Market Performance
9.17.4 TES Business Overview
9.17.5 TES Recent Developments
9.18 BLUE-KEY
9.18.1 BLUE-KEY Electric Test Instrument Basic Information
9.18.2 BLUE-KEY Electric Test Instrument Product Overview
9.18.3 BLUE-KEY Electric Test Instrument Product Market Performance
9.18.4 BLUE-KEY Business Overview
9.18.5 BLUE-KEY Recent Developments
9.19 Nanjing Jindian Electric
9.19.1 Nanjing Jindian Electric Electric Test Instrument Basic Information
9.19.2 Nanjing Jindian Electric Electric Test Instrument Product Overview
9.19.3 Nanjing Jindian Electric Electric Test Instrument Product Market Performance
9.19.4 Nanjing Jindian Electric Business Overview
9.19.5 Nanjing Jindian Electric Recent Developments
10 Electric Test Instrument Market Forecast by Region
10.1 Global Electric Test Instrument Market Size Forecast
10.2 Global Electric Test Instrument Market Forecast by Region
10.2.1 North America Market Size Forecast by Country
10.2.2 Europe Electric Test Instrument Market Size Forecast by Country
10.2.3 Asia Pacific Electric Test Instrument Market Size Forecast by Region
10.2.4 South America Electric Test Instrument Market Size Forecast by Country
10.2.5 Middle East and Africa Forecasted Consumption of Electric Test Instrument by Country
11 Forecast Market by Type and by Application (2025-2032)
11.1 Global Electric Test Instrument Market Forecast by Type (2025-2032)
11.1.1 Global Forecasted Sales of Electric Test Instrument by Type (2025-2032)
11.1.2 Global Electric Test Instrument Market Size Forecast by Type (2025-2032)
11.1.3 Global Forecasted Price of Electric Test Instrument by Type (2025-2032)
11.2 Global Electric Test Instrument Market Forecast by Application (2025-2032)
11.2.1 Global Electric Test Instrument Sales (K Units) Forecast by Application
11.2.2 Global Electric Test Instrument Market Size (M USD) Forecast by Application (2025-2032)
12 Conclusion and Key FindingsList of Tables
Table 1. Introduction of the Type
Table 2. Introduction of the Application
Table 3. Market Size (M USD) Segment Executive Summary
Table 4. Electric Test Instrument Market Size Comparison by Region (M USD)
Table 5. Global Electric Test Instrument Sales (K Units) by Manufacturers (2019-2025)
Table 6. Global Electric Test Instrument Sales Market Share by Manufacturers (2019-2025)
Table 7. Global Electric Test Instrument Revenue (M USD) by Manufacturers (2019-2025)
Table 8. Global Electric Test Instrument Revenue Share by Manufacturers (2019-2025)
Table 9. Company Type (Tier 1, Tier 2, and Tier 3) & (based on the Revenue in Electric Test Instrument as of 2022)
Table 10. Global Market Electric Test Instrument Average Price (USD/Unit) of Key Manufacturers (2019-2025)
Table 11. Manufacturers Electric Test Instrument Sales Sites and Area Served
Table 12. Manufacturers Electric Test Instrument Product Type
Table 13. Global Electric Test Instrument Manufacturers Market Concentration Ratio (CR5 and HHI)
Table 14. Mergers & Acquisitions, Expansion Plans
Table 15. Industry Chain Map of Electric Test Instrument
Table 16. Market Overview of Key Raw Materials
Table 17. Midstream Market Analysis
Table 18. Downstream Customer Analysis
Table 19. Key Development Trends
Table 20. Driving Factors
Table 21. Electric Test Instrument Market Challenges
Table 22. Global Electric Test Instrument Sales by Type (K Units)
Table 23. Global Electric Test Instrument Market Size by Type (M USD)
Table 24. Global Electric Test Instrument Sales (K Units) by Type (2019-2025)
Table 25. Global Electric Test Instrument Sales Market Share by Type (2019-2025)
Table 26. Global Electric Test Instrument Market Size (M USD) by Type (2019-2025)
Table 27. Global Electric Test Instrument Market Size Share by Type (2019-2025)
Table 28. Global Electric Test Instrument Price (USD/Unit) by Type (2019-2025)
Table 29. Global Electric Test Instrument Sales (K Units) by Application
Table 30. Global Electric Test Instrument Market Size by Application
Table 31. Global Electric Test Instrument Sales by Application (2019-2025) & (K Units)
Table 32. Global Electric Test Instrument Sales Market Share by Application (2019-2025)
Table 33. Global Electric Test Instrument Sales by Application (2019-2025) & (M USD)
Table 34. Global Electric Test Instrument Market Share by Application (2019-2025)
Table 35. Global Electric Test Instrument Sales Growth Rate by Application (2019-2025)
Table 36. Global Electric Test Instrument Sales by Region (2019-2025) & (K Units)
Table 37. Global Electric Test Instrument Sales Market Share by Region (2019-2025)
Table 38. North America Electric Test Instrument Sales by Country (2019-2025) & (K Units)
Table 39. Europe Electric Test Instrument Sales by Country (2019-2025) & (K Units)
Table 40. Asia Pacific Electric Test Instrument Sales by Region (2019-2025) & (K Units)
Table 41. South America Electric Test Instrument Sales by Country (2019-2025) & (K Units)
Table 42. Middle East and Africa Electric Test Instrument Sales by Region (2019-2025) & (K Units)
Table 43. Hioki Electric Test Instrument Basic Information
Table 44. Hioki Electric Test Instrument Product Overview
Table 45. Hioki Electric Test Instrument Sales (K Units), Revenue (M USD), Price (USD/Unit) and Gross Margin (2019-2025)
Table 46. Hioki Business Overview
Table 47. Hioki Electric Test Instrument SWOT Analysis
Table 48. Hioki Recent Developments
Table 49. FLUKE Electric Test Instrument Basic Information
Table 50. FLUKE Electric Test Instrument Product Overview
Table 51. FLUKE Electric Test Instrument Sales (K Units), Revenue (M USD), Price (USD/Unit) and Gross Margin (2019-2025)
Table 52. FLUKE Business Overview
Table 53. FLUKE Electric Test Instrument SWOT Analysis
Table 54. FLUKE Recent Developments
Table 55. Megger Electric Test Instrument Basic Information
Table 56. Megger Electric Test Instrument Product Overview
Table 57. Megger Electric Test Instrument Sales (K Units), Revenue (M USD), Price (USD/Unit) and Gross Margin (2019-2025)
Table 58. Megger Electric Test Instrument SWOT Analysis
Table 59. Megger Business Overview
Table 60. Megger Recent Developments
Table 61. KIKUSUI Electric Test Instrument Basic Information
Table 62. KIKUSUI Electric Test Instrument Product Overview
Table 63. KIKUSUI Electric Test Instrument Sales (K Units), Revenue (M USD), Price (USD/Unit) and Gross Margin (2019-2025)
Table 64. KIKUSUI Business Overview
Table 65. KIKUSUI Recent Developments
Table 66. Aemc Instruments Electric Test Instrument Basic Information
Table 67. Aemc Instruments Electric Test Instrument Product Overview
Table 68. Aemc Instruments Electric Test Instrument Sales (K Units), Revenue (M USD), Price (USD/Unit) and Gross Margin (2019-2025)
Table 69. Aemc Instruments Business Overview
Table 70. Aemc Instruments Recent Developments
Table 71. Pentair Electric Test Instrument Basic Information
Table 72. Pentair Electric Test Instrument Product Overview
Table 73. Pentair Electric Test Instrument Sales (K Units), Revenue (M USD), Price (USD/Unit) and Gross Margin (2019-2025)
Table 74. Pentair Business Overview
Table 75. Pentair Recent Developments
Table 76. Amprobe Electric Test Instrument Basic Information
Table 77. Amprobe Electric Test Instrument Product Overview
Table 78. Amprobe Electric Test Instrument Sales (K Units), Revenue (M USD), Price (USD/Unit) and Gross Margin (2019-2025)
Table 79. Amprobe Business Overview
Table 80. Amprobe Recent Developments
Table 81. Reed Instruments Electric Test Instrument Basic Information
Table 82. Reed Instruments Electric Test Instrument Product Overview
Table 83. Reed Instruments Electric Test Instrument Sales (K Units), Revenue (M USD), Price (USD/Unit) and Gross Margin (2019-2025)
Table 84. Reed Instruments Business Overview
Table 85. Reed Instruments Recent Developments
Table 86. RS Components Electric Test Instrument Basic Information
Table 87. RS Components Electric Test Instrument Product Overview
Table 88. RS Components Electric Test Instrument Sales (K Units), Revenue (M USD), Price (USD/Unit) and Gross Margin (2019-2025)
Table 89. RS Components Business Overview
Table 90. RS Components Recent Developments
Table 91. Duncan Instruments Electric Test Instrument Basic Information
Table 92. Duncan Instruments Electric Test Instrument Product Overview
Table 93. Duncan Instruments Electric Test Instrument Sales (K Units), Revenue (M USD), Price (USD/Unit) and Gross Margin (2019-2025)
Table 94. Duncan Instruments Business Overview
Table 95. Duncan Instruments Recent Developments
Table 96. Hoyt Electrical Instrument Electric Test Instrument Basic Information
Table 97. Hoyt Electrical Instrument Electric Test Instrument Product Overview
Table 98. Hoyt Electrical Instrument Electric Test Instrument Sales (K Units), Revenue (M USD), Price (USD/Unit) and Gross Margin (2019-2025)
Table 99. Hoyt Electrical Instrument Business Overview
Table 100. Hoyt Electrical Instrument Recent Developments
Table 101. DV Power Electric Test Instrument Basic Information
Table 102. DV Power Electric Test Instrument Product Overview
Table 103. DV Power Electric Test Instrument Sales (K Units), Revenue (M USD), Price (USD/Unit) and Gross Margin (2019-2025)
Table 104. DV Power Business Overview
Table 105. DV Power Recent Developments
Table 106. Hopetech Electric Test Instrument Basic Information
Table 107. Hopetech Electric Test Instrument Product Overview
Table 108. Hopetech Electric Test Instrument Sales (K Units), Revenue (M USD), Price (USD/Unit) and Gross Margin (2019-2025)
Table 109. Hopetech Business Overview
Table 110. Hopetech Recent Developments
Table 111. Applent Electric Test Instrument Basic Information
Table 112. Applent Electric Test Instrument Product Overview
Table 113. Applent Electric Test Instrument Sales (K Units), Revenue (M USD), Price (USD/Unit) and Gross Margin (2019-2025)
Table 114. Applent Business Overview
Table 115. Applent Recent Developments
Table 116. ITECH Electric Test Instrument Basic Information
Table 117. ITECH Electric Test Instrument Product Overview
Table 118. ITECH Electric Test Instrument Sales (K Units), Revenue (M USD), Price (USD/Unit) and Gross Margin (2019-2025)
Table 119. ITECH Business Overview
Table 120. ITECH Recent Developments
Table 121. Aitelong Electric Test Instrument Basic Information
Table 122. Aitelong Electric Test Instrument Product Overview
Table 123. Aitelong Electric Test Instrument Sales (K Units), Revenue (M USD), Price (USD/Unit) and Gross Margin (2019-2025)
Table 124. Aitelong Business Overview
Table 125. Aitelong Recent Developments
Table 126. TES Electric Test Instrument Basic Information
Table 127. TES Electric Test Instrument Product Overview
Table 128. TES Electric Test Instrument Sales (K Units), Revenue (M USD), Price (USD/Unit) and Gross Margin (2019-2025)
Table 129. TES Business Overview
Table 130. TES Recent Developments
Table 131. BLUE-KEY Electric Test Instrument Basic Information
Table 132. BLUE-KEY Electric Test Instrument Product Overview
Table 133. BLUE-KEY Electric Test Instrument Sales (K Units), Revenue (M USD), Price (USD/Unit) and Gross Margin (2019-2025)
Table 134. BLUE-KEY Business Overview
Table 135. BLUE-KEY Recent Developments
Table 136. Nanjing Jindian Electric Electric Test Instrument Basic Information
Table 137. Nanjing Jindian Electric Electric Test Instrument Product Overview
Table 138. Nanjing Jindian Electric Electric Test Instrument Sales (K Units), Revenue (M USD), Price (USD/Unit) and Gross Margin (2019-2025)
Table 139. Nanjing Jindian Electric Business Overview
Table 140. Nanjing Jindian Electric Recent Developments
Table 141. Global Electric Test Instrument Sales Forecast by Region (2025-2030) & (K Units)
Table 142. Global Electric Test Instrument Market Size Forecast by Region (2025-2030) & (M USD)
Table 143. North America Electric Test Instrument Sales Forecast by Country (2025-2030) & (K Units)
Table 144. North America Electric Test Instrument Market Size Forecast by Country (2025-2030) & (M USD)
Table 145. Europe Electric Test Instrument Sales Forecast by Country (2025-2030) & (K Units)
Table 146. Europe Electric Test Instrument Market Size Forecast by Country (2025-2030) & (M USD)
Table 147. Asia Pacific Electric Test Instrument Sales Forecast by Region (2025-2030) & (K Units)
Table 148. Asia Pacific Electric Test Instrument Market Size Forecast by Region (2025-2030) & (M USD)
Table 149. South America Electric Test Instrument Sales Forecast by Country (2025-2030) & (K Units)
Table 150. South America Electric Test Instrument Market Size Forecast by Country (2025-2030) & (M USD)
Table 151. Middle East and Africa Electric Test Instrument Consumption Forecast by Country (2025-2030) & (Units)
Table 152. Middle East and Africa Electric Test Instrument Market Size Forecast by Country (2025-2030) & (M USD)
Table 153. Global Electric Test Instrument Sales Forecast by Type (2025-2030) & (K Units)
Table 154. Global Electric Test Instrument Market Size Forecast by Type (2025-2030) & (M USD)
Table 155. Global Electric Test Instrument Price Forecast by Type (2025-2030) & (USD/Unit)
Table 156. Global Electric Test Instrument Sales (K Units) Forecast by Application (2025-2030)
Table 157. Global Electric Test Instrument Market Size Forecast by Application (2025-2030) & (M USD)
List of Figures
Figure 1. Product Picture of Electric Test Instrument
Figure 2. Data Triangulation
Figure 3. Key Caveats
Figure 4. Global Electric Test Instrument Market Size (M USD), 2019-2030
Figure 5. Global Electric Test Instrument Market Size (M USD) (2019-2030)
Figure 6. Global Electric Test Instrument Sales (K Units) & (2019-2030)
Figure 7. Evaluation Matrix of Segment Market Development Potential (Type)
Figure 8. Evaluation Matrix of Segment Market Development Potential (Application)
Figure 9. Evaluation Matrix of Regional Market Development Potential
Figure 10. Electric Test Instrument Market Size by Country (M USD)
Figure 11. Electric Test Instrument Sales Share by Manufacturers in 2023
Figure 12. Global Electric Test Instrument Revenue Share by Manufacturers in 2023
Figure 13. Electric Test Instrument Market Share by Company Type (Tier 1, Tier 2 and Tier 3): 2023
Figure 14. Global Market Electric Test Instrument Average Price (USD/Unit) of Key Manufacturers in 2023
Figure 15. The Global 5 and 10 Largest Players: Market Share by Electric Test Instrument Revenue in 2023
Figure 16. Evaluation Matrix of Segment Market Development Potential (Type)
Figure 17. Global Electric Test Instrument Market Share by Type
Figure 18. Sales Market Share of Electric Test Instrument by Type (2019-2025)
Figure 19. Sales Market Share of Electric Test Instrument by Type in 2023
Figure 20. Market Size Share of Electric Test Instrument by Type (2019-2025)
Figure 21. Market Size Market Share of Electric Test Instrument by Type in 2023
Figure 22. Evaluation Matrix of Segment Market Development Potential (Application)
Figure 23. Global Electric Test Instrument Market Share by Application
Figure 24. Global Electric Test Instrument Sales Market Share by Application (2019-2025)
Figure 25. Global Electric Test Instrument Sales Market Share by Application in 2023
Figure 26. Global Electric Test Instrument Market Share by Application (2019-2025)
Figure 27. Global Electric Test Instrument Market Share by Application in 2023
Figure 28. Global Electric Test Instrument Sales Growth Rate by Application (2019-2025)
Figure 29. Global Electric Test Instrument Sales Market Share by Region (2019-2025)
Figure 30. North America Electric Test Instrument Sales and Growth Rate (2019-2025) & (K Units)
Figure 31. North America Electric Test Instrument Sales Market Share by Country in 2023
Figure 32. U.S. Electric Test Instrument Sales and Growth Rate (2019-2025) & (K Units)
Figure 33. Canada Electric Test Instrument Sales (K Units) and Growth Rate (2019-2025)
Figure 34. Mexico Electric Test Instrument Sales (Units) and Growth Rate (2019-2025)
Figure 35. Europe Electric Test Instrument Sales and Growth Rate (2019-2025) & (K Units)
Figure 36. Europe Electric Test Instrument Sales Market Share by Country in 2023
Figure 37. Germany Electric Test Instrument Sales and Growth Rate (2019-2025) & (K Units)
Figure 38. France Electric Test Instrument Sales and Growth Rate (2019-2025) & (K Units)
Figure 39. U.K. Electric Test Instrument Sales and Growth Rate (2019-2025) & (K Units)
Figure 40. Italy Electric Test Instrument Sales and Growth Rate (2019-2025) & (K Units)
Figure 41. Russia Electric Test Instrument Sales and Growth Rate (2019-2025) & (K Units)
Figure 42. Asia Pacific Electric Test Instrument Sales and Growth Rate (K Units)
Figure 43. Asia Pacific Electric Test Instrument Sales Market Share by Region in 2023
Figure 44. China Electric Test Instrument Sales and Growth Rate (2019-2025) & (K Units)
Figure 45. Japan Electric Test Instrument Sales and Growth Rate (2019-2025) & (K Units)
Figure 46. South Korea Electric Test Instrument Sales and Growth Rate (2019-2025) & (K Units)
Figure 47. India Electric Test Instrument Sales and Growth Rate (2019-2025) & (K Units)
Figure 48. Southeast Asia Electric Test Instrument Sales and Growth Rate (2019-2025) & (K Units)
Figure 49. South America Electric Test Instrument Sales and Growth Rate (K Units)
Figure 50. South America Electric Test Instrument Sales Market Share by Country in 2023
Figure 51. Brazil Electric Test Instrument Sales and Growth Rate (2019-2025) & (K Units)
Figure 52. Argentina Electric Test Instrument Sales and Growth Rate (2019-2025) & (K Units)
Figure 53. Columbia Electric Test Instrument Sales and Growth Rate (2019-2025) & (K Units)
Figure 54. Middle East and Africa Electric Test Instrument Sales and Growth Rate (K Units)
Figure 55. Middle East and Africa Electric Test Instrument Sales Market Share by Region in 2023
Figure 56. Saudi Arabia Electric Test Instrument Sales and Growth Rate (2019-2025) & (K Units)
Figure 57. UAE Electric Test Instrument Sales and Growth Rate (2019-2025) & (K Units)
Figure 58. Egypt Electric Test Instrument Sales and Growth Rate (2019-2025) & (K Units)
Figure 59. Nigeria Electric Test Instrument Sales and Growth Rate (2019-2025) & (K Units)
Figure 60. South Africa Electric Test Instrument Sales and Growth Rate (2019-2025) & (K Units)
Figure 61. Global Electric Test Instrument Sales Forecast by Volume (2019-2030) & (K Units)
Figure 62. Global Electric Test Instrument Market Size Forecast by Value (2019-2030) & (M USD)
Figure 63. Global Electric Test Instrument Sales Market Share Forecast by Type (2025-2030)
Figure 64. Global Electric Test Instrument Market Share Forecast by Type (2025-2030)
Figure 65. Global Electric Test Instrument Sales Forecast by Application (2025-2030)
Figure 66. Global Electric Test Instrument Market Share Forecast by Application (2025-2030)