SEMICONDUCTOR INSIGHT
MARKET RESEARCH REPORT

Gate Drivers Market

2026 to 2034
MARKET INTELLIGENCE
ACROSS KEY REGIONS
2026 EDITION
POWER ELECTRONICS Semiconductor Market Research

Gate Drivers Market

Trends, Business Strategies 2026-2034

◷
UPDATED 22 September 2026
▤
REPORT LENGTH Detailed Report
▣
REPORT CODE 241d9dabafad
▯
FORMATS PDF

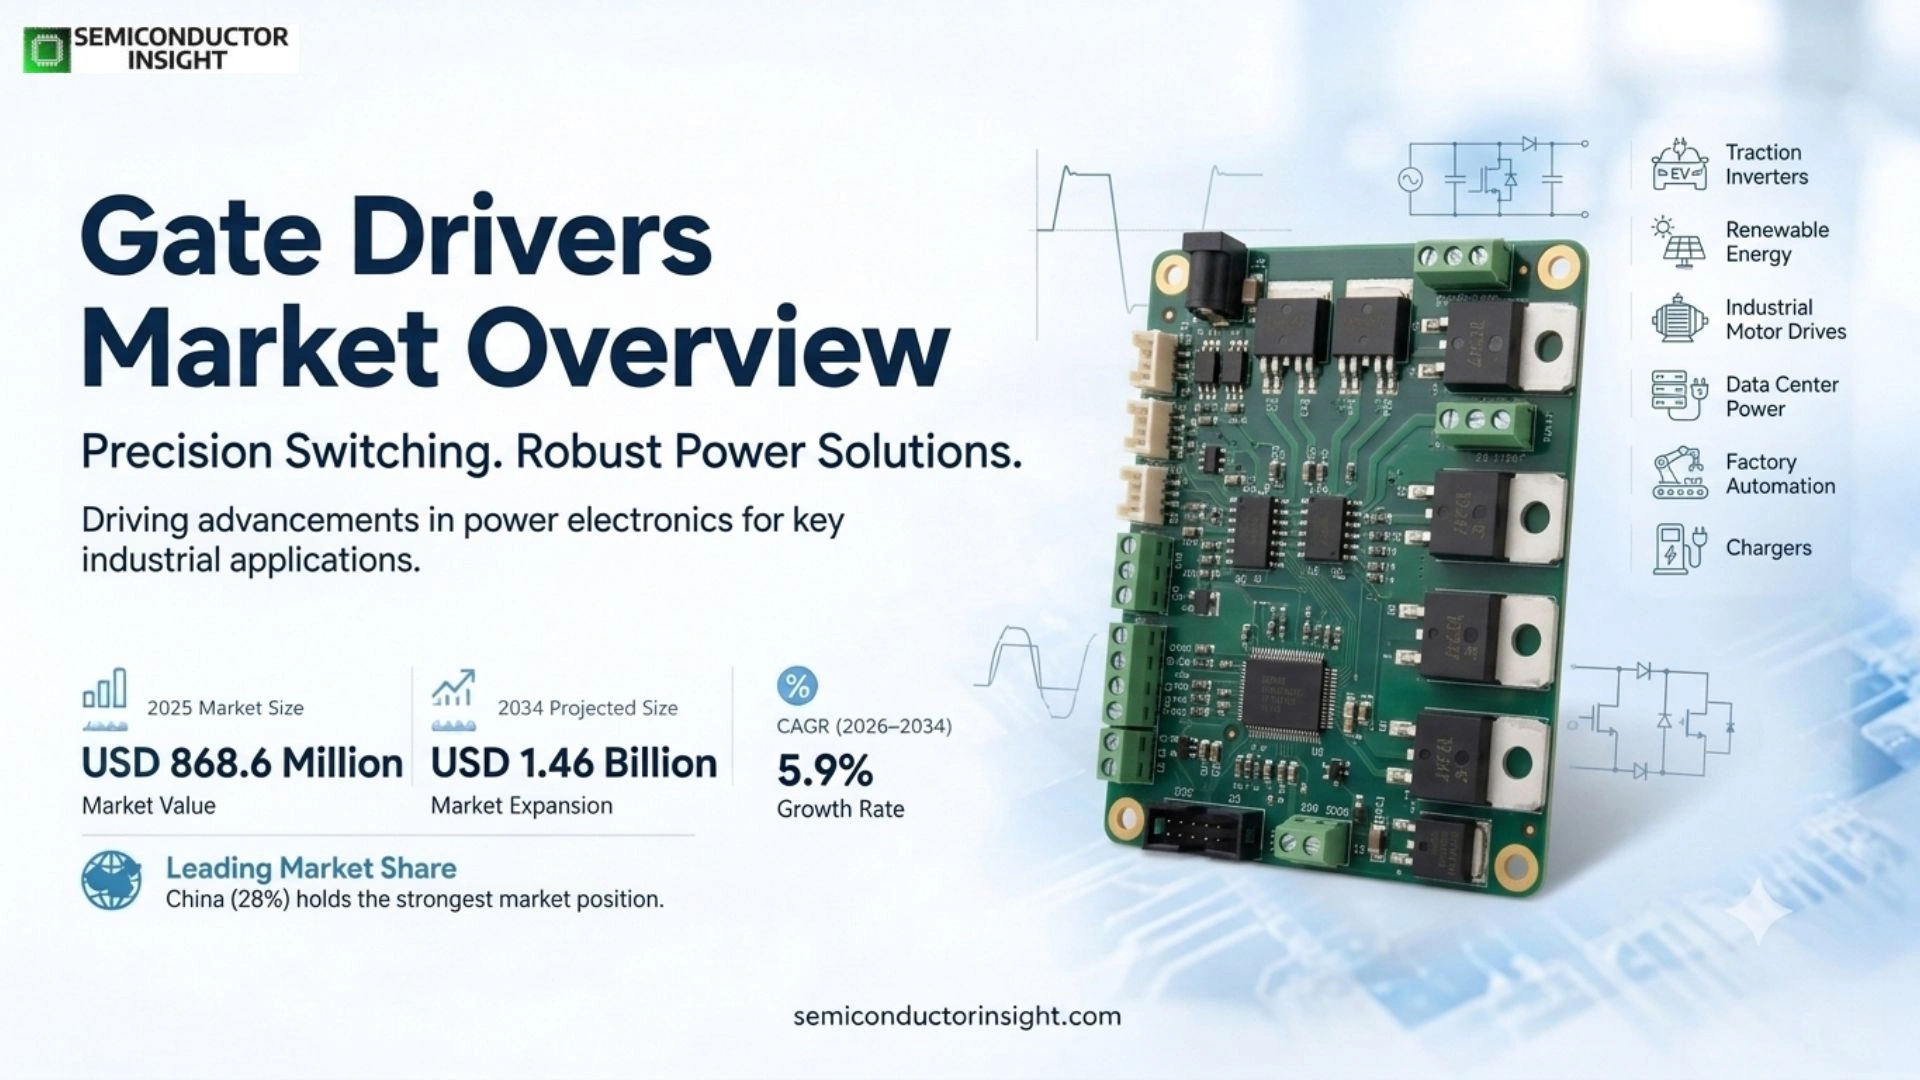
Gate Drivers Market is projected to reach USD 1.46 billion by 2034, representing a CAGR of 5.9% during 2026–2034.

Get the sample PDF with study scope, segmentation and methodology details.

Key Statistics

2025 Market Size
USD 868.6 million
2034 Projected Size
USD 1.46 billion
CAGR (2026–2034)
5.9%
Largest Market in 2025
China (28%)

Key Takeaways

  • Discrete Gate Drivers (59%) is the largest type position in the source-defined scope, while SiC/GaN Gate Drivers carries the strongest structural growth case as product architectures move toward higher integration, efficiency and performance requirements.
  • Industrial (33%) is the leading application position, while Automotive is the most important incremental demand engine because system complexity and electronic content are rising faster than unit volumes alone.
  • Asia Pacific has the strongest market position, supported by manufacturing scale, design activity and downstream demand that create both volume purchasing and faster qualification of new product generations.
  • The 2025–2034 value path rises from USD 868.6 million to USD 1.46 billion, with a rebased CAGR of 5.9% for 2026–2034. This series uses the two published market-size anchors as the controlling values.
  • Supplier differentiation increasingly depends on system-level performance, qualification, software or application support, and lifecycle reliability rather than on component price alone, which favors vendors able to solve integration problems for OEM customers.

Gate Drivers Market Overview

Gate Drivers Market was valued at USD 868.6 million in 2025 and is projected to reach USD 1.46 billion by 2034, representing a CAGR of 5.9% during 2026–2034. China (28%) holds the strongest market position in the source-defined scope.

Base year: 2025 · Estimated year: 2026 · Forecast period: 2026–2034 · Historical data: 2021–2025 · Values in USD

Gate drivers are interface circuits that deliver the voltage and peak current needed to switch power MOSFETs, IGBTs, silicon-carbide MOSFETs and gallium-nitride devices while protecting the low-voltage control domain. The category spans discrete driver ICs and integrated driver functions used in motor drives, traction inverters, renewable-energy inverters, data-center power supplies, chargers and industrial power-conversion systems.

The commercial value of a gate driver is set by switching speed, isolation strength, common-mode transient immunity, protection functions, thermal robustness and the ability to match the characteristics of the selected power transistor. As power systems migrate toward silicon carbide and gallium nitride, driver design becomes more tightly coupled to the power stage because faster edge rates amplify parasitic effects, electromagnetic interference and fault-energy risk.

Demand growth is therefore not simply a function of more electronic systems being built. It reflects the rising semiconductor content of electrified vehicles, higher renewable-power conversion capacity, denser data-center power architecture and broader industrial automation. The IEA reports that electric-car sales exceeded 20 million units in 2025, while IRENA documents another record year of renewable capacity additions, both expanding the installed base of inverter and converter stages that require precision gate control.

Segment Analysis: By Type

By type, the report segments the market into Discrete Gate Drivers, On-chip Gate Drivers. Discrete Gate Drivers (59%) holds the leading position, while SiC/GaN Gate Drivers offers the strongest structural growth path as buyers prioritize newer performance and integration requirements.

Type Demand characteristics Market position
Discrete Gate Drivers Discrete Gate Drivers serves a distinct portion of the gate drivers market. Its purchasing logic depends on the balance between performance, integration, cost, lifecycle support and downstream design requirements. The segment’s commercial position is best understood through design-win persistence: once an OEM validates a component or product architecture, qualification cost and software or mechanical integration can keep that choice in production for multiple product generations. Largest / established segment describes its current strategic role. Largest / established segment. Supplier competition centers on specifications that reduce customer design risk while preserving cost, availability and qualification continuity.
On-chip Gate Drivers On-chip Gate Drivers serves a distinct portion of the gate drivers market. Its purchasing logic depends on the balance between performance, integration, cost, lifecycle support and downstream design requirements. The segment’s commercial position is best understood through design-win persistence: once an OEM validates a component or product architecture, qualification cost and software or mechanical integration can keep that choice in production for multiple product generations. Application-dependent demand describes its current strategic role. Application-dependent demand. Supplier competition centers on specifications that reduce customer design risk while preserving cost, availability and qualification continuity.

Secondary segmentation

By End User: Original Equipment Manufacturers (OEMs) · Component Distributors · Aftermarket & Repair Services. These sub-segments refine the purchasing logic by separating the electrical, architectural or customer requirements that determine specification, qualification effort and supplier choice within the same headline market.

By Isolation Technology: Magnetic Isolation · Optical Isolation · Capacitive Isolation. These sub-segments refine the purchasing logic by separating the electrical, architectural or customer requirements that determine specification, qualification effort and supplier choice within the same headline market.

By Power Device: MOSFET Gate Drivers · IGBT Gate Drivers · SiC/GaN Gate Drivers. These sub-segments refine the purchasing logic by separating the electrical, architectural or customer requirements that determine specification, qualification effort and supplier choice within the same headline market.

Segment Analysis: By Application

The application scope includes Industrial, Automotive, Consumer Electronics, Communications, Others. Industrial (33%) carries the largest current position, while Automotive is the most important incremental growth channel because it combines new unit demand with rising content or feature value per system.

Application Demand characteristics
Industrial
Leading application
Industrial demand is created when end users need the core function of the gate drivers category inside a finished system. Purchasing is triggered by product refresh cycles, performance targets, compliance requirements and the economics of integrating a validated solution. OEMs tend to favor suppliers that can document reliability, maintain availability and support engineering teams through design and qualification. This makes application expertise a commercial advantage rather than a marketing label.
Automotive
High-growth application
Automotive demand is created when end users need the core function of the gate drivers category inside a finished system. Purchasing is triggered by product refresh cycles, performance targets, compliance requirements and the economics of integrating a validated solution. OEMs tend to favor suppliers that can document reliability, maintain availability and support engineering teams through design and qualification. This makes application expertise a commercial advantage rather than a marketing label.
Consumer Electronics
Established application
Consumer Electronics demand is created when end users need the core function of the gate drivers category inside a finished system. Purchasing is triggered by product refresh cycles, performance targets, compliance requirements and the economics of integrating a validated solution. OEMs tend to favor suppliers that can document reliability, maintain availability and support engineering teams through design and qualification. This makes application expertise a commercial advantage rather than a marketing label.
Communications
Established application
Communications demand is created when end users need the core function of the gate drivers category inside a finished system. Purchasing is triggered by product refresh cycles, performance targets, compliance requirements and the economics of integrating a validated solution. OEMs tend to favor suppliers that can document reliability, maintain availability and support engineering teams through design and qualification. This makes application expertise a commercial advantage rather than a marketing label.
Others
Established application
Others demand is created when end users need the core function of the gate drivers category inside a finished system. Purchasing is triggered by product refresh cycles, performance targets, compliance requirements and the economics of integrating a validated solution. OEMs tend to favor suppliers that can document reliability, maintain availability and support engineering teams through design and qualification. This makes application expertise a commercial advantage rather than a marketing label.

Gate Drivers Market Size & Share

Regional Analysis

Asia Pacific holds the strongest regional position, while the market’s regional structure reflects different combinations of manufacturing, downstream adoption, regulation, channel depth and design activity. These differences affect not only growth rates but also which product specifications and supplier capabilities convert into revenue.

How does regional demand differ across the Gate Drivers market?

Region Position Commercial logic
Asia Pacific Largest High-volume electronics, EV, industrial-drive and renewable-energy manufacturing create the deepest demand pool. China is the single largest national market at 28% on the report page, while Japan and South Korea contribute advanced automotive and power-semiconductor design activity.
North America Established / emerging Demand is concentrated in EV platforms, data centers, industrial automation and wide-bandgap power conversion. Supplier selection places heavy weight on reliability, functional safety and design support rather than unit price alone.
Europe Established / emerging Automotive electrification, industrial drives and wind-power conversion sustain demand. European semiconductor vendors also hold strong positions in isolated gate drivers and automotive-qualified power solutions.
South America Established / emerging Brazilian industrial automation, mining and renewable-energy projects create the main demand pockets. Purchasing is more sensitive to distributor availability and landed cost than in the three largest regions.
Middle East & Africa Established / emerging Solar, data-center and infrastructure projects are the main growth channels. Demand remains project-driven and favors suppliers able to provide certified solutions, long lifecycle support and regional distribution.
Asia Pacific LARGEST & FASTEST-GROWING

What shapes Asia Pacific demand in the Gate Drivers market?

High-volume electronics, EV, industrial-drive and renewable-energy manufacturing create the deepest demand pool. China is the single largest national market at 28% on the report page, while Japan and South Korea contribute advanced automotive and power-semiconductor design activity.

Market positionLargest
Demand profileLargest & Fastest-Growing
Forecast window2026–2034
Supplier priorityQualification + channel support
Country What drives demand
China Largest national market at 28%; EV manufacturing, consumer electronics, industrial drives and solar inverters create high-volume demand. The commercial implication is that winning suppliers need a combination of local channel coverage, qualification support and product availability matched to the application mix rather than a uniform regional sales model.
Japan Automotive power electronics and industrial automation support high-specification gate-driver demand. The commercial implication is that winning suppliers need a combination of local channel coverage, qualification support and product availability matched to the application mix rather than a uniform regional sales model.
South Korea EV, battery, semiconductor and data-center investments increase demand for efficient power conversion. The commercial implication is that winning suppliers need a combination of local channel coverage, qualification support and product availability matched to the application mix rather than a uniform regional sales model.
India EV adoption, solar deployment and industrial electrification broaden the addressable base. The commercial implication is that winning suppliers need a combination of local channel coverage, qualification support and product availability matched to the application mix rather than a uniform regional sales model.

Market instances

  • The region’s strongest demand pockets are those where downstream production, infrastructure investment or consumer adoption is expanding faster than the installed base. That creates fresh design decisions rather than replacement-only purchasing and gives suppliers an opportunity to win multi-year platform positions.
  • Channel structure matters because qualification and availability often determine supplier selection before headline price. Vendors with local technical support, stocked inventory and application-specific reference designs can convert a global portfolio into regional share more effectively than remote catalog-only competitors.
  • Product mix also differs by country. Mature markets pay for efficiency, reliability, software and advanced features, while faster-growing value markets require cost discipline and simpler integration. A supplier that uses one undifferentiated configuration across all countries risks losing both ends of the market.
In the full report: country-level market size, volume, average selling price, supplier share and CAGR across the study period, with segment cross-tabulation by the source-defined type and application axes.
North America HIGH-VALUE APPLICATIONS

What shapes North America demand in the Gate Drivers market?

Demand is concentrated in EV platforms, data centers, industrial automation and wide-bandgap power conversion. Supplier selection places heavy weight on reliability, functional safety and design support rather than unit price alone.

Market positionEstablished / emerging
Demand profileHigh-Value Applications
Forecast window2026–2034
Supplier priorityQualification + channel support
Country What drives demand
United States EV traction inverters, data-center power supplies and industrial motor drives lead high-value demand. The commercial implication is that winning suppliers need a combination of local channel coverage, qualification support and product availability matched to the application mix rather than a uniform regional sales model.
Canada Industrial electrification, energy infrastructure and automation support steady project demand. The commercial implication is that winning suppliers need a combination of local channel coverage, qualification support and product availability matched to the application mix rather than a uniform regional sales model.
Mexico Automotive near-shoring expands locally assembled power-electronics content. The commercial implication is that winning suppliers need a combination of local channel coverage, qualification support and product availability matched to the application mix rather than a uniform regional sales model.

Market instances

  • The region’s strongest demand pockets are those where downstream production, infrastructure investment or consumer adoption is expanding faster than the installed base. That creates fresh design decisions rather than replacement-only purchasing and gives suppliers an opportunity to win multi-year platform positions.
  • Channel structure matters because qualification and availability often determine supplier selection before headline price. Vendors with local technical support, stocked inventory and application-specific reference designs can convert a global portfolio into regional share more effectively than remote catalog-only competitors.
  • Product mix also differs by country. Mature markets pay for efficiency, reliability, software and advanced features, while faster-growing value markets require cost discipline and simpler integration. A supplier that uses one undifferentiated configuration across all countries risks losing both ends of the market.
In the full report: country-level market size, volume, average selling price, supplier share and CAGR across the study period, with segment cross-tabulation by the source-defined type and application axes.
Europe AUTOMOTIVE & INDUSTRIAL

What shapes Europe demand in the Gate Drivers market?

Automotive electrification, industrial drives and wind-power conversion sustain demand. European semiconductor vendors also hold strong positions in isolated gate drivers and automotive-qualified power solutions.

Market positionEstablished / emerging
Demand profileAutomotive & Industrial
Forecast window2026–2034
Supplier priorityQualification + channel support
Country What drives demand
Germany Automotive electrification and industrial motor control anchor demand. The commercial implication is that winning suppliers need a combination of local channel coverage, qualification support and product availability matched to the application mix rather than a uniform regional sales model.
France Industrial power systems, rail and energy infrastructure sustain qualified-component demand. The commercial implication is that winning suppliers need a combination of local channel coverage, qualification support and product availability matched to the application mix rather than a uniform regional sales model.
Italy Industrial machinery and motor-drive production create a broad OEM customer base. The commercial implication is that winning suppliers need a combination of local channel coverage, qualification support and product availability matched to the application mix rather than a uniform regional sales model.

Market instances

  • The region’s strongest demand pockets are those where downstream production, infrastructure investment or consumer adoption is expanding faster than the installed base. That creates fresh design decisions rather than replacement-only purchasing and gives suppliers an opportunity to win multi-year platform positions.
  • Channel structure matters because qualification and availability often determine supplier selection before headline price. Vendors with local technical support, stocked inventory and application-specific reference designs can convert a global portfolio into regional share more effectively than remote catalog-only competitors.
  • Product mix also differs by country. Mature markets pay for efficiency, reliability, software and advanced features, while faster-growing value markets require cost discipline and simpler integration. A supplier that uses one undifferentiated configuration across all countries risks losing both ends of the market.
In the full report: country-level market size, volume, average selling price, supplier share and CAGR across the study period, with segment cross-tabulation by the source-defined type and application axes.
South America PROJECT-LED

What shapes South America demand in the Gate Drivers market?

Brazilian industrial automation, mining and renewable-energy projects create the main demand pockets. Purchasing is more sensitive to distributor availability and landed cost than in the three largest regions.

Market positionEstablished / emerging
Demand profileProject-Led
Forecast window2026–2034
Supplier priorityQualification + channel support
Country What drives demand
Brazil Industrial drives, renewable inverters and automotive production are the principal demand channels. The commercial implication is that winning suppliers need a combination of local channel coverage, qualification support and product availability matched to the application mix rather than a uniform regional sales model.
Chile Mining electrification and solar projects create project-based opportunities. The commercial implication is that winning suppliers need a combination of local channel coverage, qualification support and product availability matched to the application mix rather than a uniform regional sales model.

Market instances

  • The region’s strongest demand pockets are those where downstream production, infrastructure investment or consumer adoption is expanding faster than the installed base. That creates fresh design decisions rather than replacement-only purchasing and gives suppliers an opportunity to win multi-year platform positions.
  • Channel structure matters because qualification and availability often determine supplier selection before headline price. Vendors with local technical support, stocked inventory and application-specific reference designs can convert a global portfolio into regional share more effectively than remote catalog-only competitors.
  • Product mix also differs by country. Mature markets pay for efficiency, reliability, software and advanced features, while faster-growing value markets require cost discipline and simpler integration. A supplier that uses one undifferentiated configuration across all countries risks losing both ends of the market.
In the full report: country-level market size, volume, average selling price, supplier share and CAGR across the study period, with segment cross-tabulation by the source-defined type and application axes.
Middle East & Africa EMERGING POWER-CONVERSION

What shapes Middle East & Africa demand in the Gate Drivers market?

Solar, data-center and infrastructure projects are the main growth channels. Demand remains project-driven and favors suppliers able to provide certified solutions, long lifecycle support and regional distribution.

Market positionEstablished / emerging
Demand profileEmerging Power-Conversion
Forecast window2026–2034
Supplier priorityQualification + channel support
Country What drives demand
Saudi Arabia Solar, data-center and industrial diversification projects support power-electronics investment. The commercial implication is that winning suppliers need a combination of local channel coverage, qualification support and product availability matched to the application mix rather than a uniform regional sales model.
UAE Data centers, solar and automation create high-specification demand. The commercial implication is that winning suppliers need a combination of local channel coverage, qualification support and product availability matched to the application mix rather than a uniform regional sales model.
South Africa Mining, renewables and industrial motor control form the largest African demand base. The commercial implication is that winning suppliers need a combination of local channel coverage, qualification support and product availability matched to the application mix rather than a uniform regional sales model.

Market instances

  • The region’s strongest demand pockets are those where downstream production, infrastructure investment or consumer adoption is expanding faster than the installed base. That creates fresh design decisions rather than replacement-only purchasing and gives suppliers an opportunity to win multi-year platform positions.
  • Channel structure matters because qualification and availability often determine supplier selection before headline price. Vendors with local technical support, stocked inventory and application-specific reference designs can convert a global portfolio into regional share more effectively than remote catalog-only competitors.
  • Product mix also differs by country. Mature markets pay for efficiency, reliability, software and advanced features, while faster-growing value markets require cost discipline and simpler integration. A supplier that uses one undifferentiated configuration across all countries risks losing both ends of the market.
In the full report: country-level market size, volume, average selling price, supplier share and CAGR across the study period, with segment cross-tabulation by the source-defined type and application axes.

Competitive Landscape

The competitive landscape includes global platform suppliers, application specialists and regional value players. Key profiled companies include Infineon Technologies AG, STMicroelectronics N.V., ON Semiconductor, Rohm Semiconductor, Renesas Electronics Corporation, Texas Instruments Incorporated, Microchip Technology Inc., NXP Semiconductors N.V., with competition increasingly decided by design support, product breadth, qualification history, software or ecosystem compatibility and the ability to maintain supply through long customer lifecycles.

Large suppliers benefit from portfolio breadth and cross-selling because customers can qualify several adjacent functions through one vendor relationship. Specialists can still win where they provide superior performance, domain-specific engineering or faster product innovation. The result is a market in which share is often determined during the design phase and then protected by switching costs once the customer enters production.

Pricing power is strongest where a product solves a system-level constraint, such as energy efficiency, functional safety, acoustic performance, low power, security, thermal limits or time to market. Commodity positions are more exposed to price erosion and distributor substitution, while differentiated positions can preserve margin through software, reference designs, certification packages and application engineering.

Tier Companies Basis of competition
Tier 1 Infineon Technologies AG, STMicroelectronics N.V., ON Semiconductor, Rohm Semiconductor, Renesas Electronics Corporation Global design-in reach, broad portfolio, strong channel access and sustained R&D investment.
Tier 2 Texas Instruments Incorporated, Microchip Technology Inc., NXP Semiconductors N.V., Analog Devices, Inc., Power Integrations, Inc., Allegro MicroSystems, Inc. Application specialization, regional strength and targeted technology differentiation.
Tier 3 / Other profiled Broadcom Inc., Diodes Incorporated, Toshiba Electronic Devices & Storage Corporation, Semtech Corporation Value positioning, local distribution and focused product niches.

Key companies profiled in the report scope

  • Infineon Technologies AG
  • STMicroelectronics N.V.
  • ON Semiconductor
  • Rohm Semiconductor
  • Renesas Electronics Corporation
  • Texas Instruments Incorporated
  • Microchip Technology Inc.
  • NXP Semiconductors N.V.
  • Analog Devices, Inc.
  • Power Integrations, Inc.
  • Allegro MicroSystems, Inc.
  • Broadcom Inc.
  • Diodes Incorporated
  • Toshiba Electronic Devices & Storage Corporation
  • Semtech Corporation

Gate Drivers Production Capacity Analysis

Production capacity for the gate drivers market depends on semiconductor wafer fabrication, assembly, test and the availability of qualified process technologies. Large suppliers use a mix of internal fabs and foundry capacity, while back-end packaging and test remain essential for automotive, industrial and consumer-grade product differentiation.

The critical constraint is not simply wafer starts. Product qualification, process migration, packaging, test coverage, long-term reliability and customer-specific validation determine how quickly nominal capacity can become revenue-producing supply. Automotive and industrial products often remain on mature nodes for long periods because predictable analog behavior, embedded nonvolatile memory and proven reliability can matter more than transistor density.

Market Dynamics

Market growth is supported by technology upgrade cycles, broader downstream adoption and rising system-level performance requirements. The principal counterweights are qualification cost, price competition, integration complexity and supply-chain risk. The balance of these forces supports the rebased 5.9% CAGR for 2026–2034.

MARKET DRIVERS

Drivers Impact Analysis*

Factor Directional impact Geographic relevance Impact timeline
Electric-vehicle inverter demand
Country What drives demand
United States EV traction inverters, data-center power supplies and industrial motor drives lead high-value demand. The commercial implication is that winning suppliers need a combination of local channel coverage, qualification support and product availability matched to the application mix rather than a uniform regional sales model.
Canada Industrial electrification, energy infrastructure and automation support steady project demand. The commercial implication is that winning suppliers need a combination of local channel coverage, qualification support and product availability matched to the application mix rather than a uniform regional sales model.
Mexico Automotive near-shoring expands locally assembled power-electronics content. The commercial implication is that winning suppliers need a combination of local channel coverage, qualification support and product availability matched to the application mix rather than a uniform regional sales model.

Market instances

  • The region’s strongest demand pockets are those where downstream production, infrastructure investment or consumer adoption is expanding faster than the installed base. That creates fresh design decisions rather than replacement-only purchasing and gives suppliers an opportunity to win multi-year platform positions.
  • Channel structure matters because qualification and availability often determine supplier selection before headline price. Vendors with local technical support, stocked inventory and application-specific reference designs can convert a global portfolio into regional share more effectively than remote catalog-only competitors.
  • Product mix also differs by country. Mature markets pay for efficiency, reliability, software and advanced features, while faster-growing value markets require cost discipline and simpler integration. A supplier that uses one undifferentiated configuration across all countries risks losing both ends of the market.
In the full report: country-level market size, volume, average selling price, supplier share and CAGR across the study period, with segment cross-tabulation by the source-defined type and application axes.
Europe AUTOMOTIVE & INDUSTRIAL

What shapes Europe demand in the Gate Drivers market?

Automotive electrification, industrial drives and wind-power conversion sustain demand. European semiconductor vendors also hold strong positions in isolated gate drivers and automotive-qualified power solutions.

Market positionEstablished / emerging
Demand profileAutomotive & Industrial
Forecast window2026–2034
Supplier priorityQualification + channel support
Country What drives demand
Germany Automotive electrification and industrial motor control anchor demand. The commercial implication is that winning suppliers need a combination of local channel coverage, qualification support and product availability matched to the application mix rather than a uniform regional sales model.
France Industrial power systems, rail and energy infrastructure sustain qualified-component demand. The commercial implication is that winning suppliers need a combination of local channel coverage, qualification support and product availability matched to the application mix rather than a uniform regional sales model.
Italy Industrial machinery and motor-drive production create a broad OEM customer base. The commercial implication is that winning suppliers need a combination of local channel coverage, qualification support and product availability matched to the application mix rather than a uniform regional sales model.

Market instances

  • The region’s strongest demand pockets are those where downstream production, infrastructure investment or consumer adoption is expanding faster than the installed base. That creates fresh design decisions rather than replacement-only purchasing and gives suppliers an opportunity to win multi-year platform positions.
  • Channel structure matters because qualification and availability often determine supplier selection before headline price. Vendors with local technical support, stocked inventory and application-specific reference designs can convert a global portfolio into regional share more effectively than remote catalog-only competitors.
  • Product mix also differs by country. Mature markets pay for efficiency, reliability, software and advanced features, while faster-growing value markets require cost discipline and simpler integration. A supplier that uses one undifferentiated configuration across all countries risks losing both ends of the market.
In the full report: country-level market size, volume, average selling price, supplier share and CAGR across the study period, with segment cross-tabulation by the source-defined type and application axes.
South America PROJECT-LED

What shapes South America demand in the Gate Drivers market?

Brazilian industrial automation, mining and renewable-energy projects create the main demand pockets. Purchasing is more sensitive to distributor availability and landed cost than in the three largest regions.

Market positionEstablished / emerging
Demand profileProject-Led
Forecast window2026–2034
Supplier priorityQualification + channel support
Country What drives demand
Brazil Industrial drives, renewable inverters and automotive production are the principal demand channels. The commercial implication is that winning suppliers need a combination of local channel coverage, qualification support and product availability matched to the application mix rather than a uniform regional sales model.
Chile Mining electrification and solar projects create project-based opportunities. The commercial implication is that winning suppliers need a combination of local channel coverage, qualification support and product availability matched to the application mix rather than a uniform regional sales model.

Market instances

  • The region’s strongest demand pockets are those where downstream production, infrastructure investment or consumer adoption is expanding faster than the installed base. That creates fresh design decisions rather than replacement-only purchasing and gives suppliers an opportunity to win multi-year platform positions.
  • Channel structure matters because qualification and availability often determine supplier selection before headline price. Vendors with local technical support, stocked inventory and application-specific reference designs can convert a global portfolio into regional share more effectively than remote catalog-only competitors.
  • Product mix also differs by country. Mature markets pay for efficiency, reliability, software and advanced features, while faster-growing value markets require cost discipline and simpler integration. A supplier that uses one undifferentiated configuration across all countries risks losing both ends of the market.
In the full report: country-level market size, volume, average selling price, supplier share and CAGR across the study period, with segment cross-tabulation by the source-defined type and application axes.
Middle East & Africa EMERGING POWER-CONVERSION

What shapes Middle East & Africa demand in the Gate Drivers market?

Solar, data-center and infrastructure projects are the main growth channels. Demand remains project-driven and favors suppliers able to provide certified solutions, long lifecycle support and regional distribution.

Market positionEstablished / emerging
Demand profileEmerging Power-Conversion
Forecast window2026–2034
Supplier priorityQualification + channel support
Country What drives demand
Saudi Arabia Solar, data-center and industrial diversification projects support power-electronics investment. The commercial implication is that winning suppliers need a combination of local channel coverage, qualification support and product availability matched to the application mix rather than a uniform regional sales model.
UAE Data centers, solar and automation create high-specification demand. The commercial implication is that winning suppliers need a combination of local channel coverage, qualification support and product availability matched to the application mix rather than a uniform regional sales model.
South Africa Mining, renewables and industrial motor control form the largest African demand base. The commercial implication is that winning suppliers need a combination of local channel coverage, qualification support and product availability matched to the application mix rather than a uniform regional sales model.

Market instances

  • The region’s strongest demand pockets are those where downstream production, infrastructure investment or consumer adoption is expanding faster than the installed base. That creates fresh design decisions rather than replacement-only purchasing and gives suppliers an opportunity to win multi-year platform positions.
  • Channel structure matters because qualification and availability often determine supplier selection before headline price. Vendors with local technical support, stocked inventory and application-specific reference designs can convert a global portfolio into regional share more effectively than remote catalog-only competitors.
  • Product mix also differs by country. Mature markets pay for efficiency, reliability, software and advanced features, while faster-growing value markets require cost discipline and simpler integration. A supplier that uses one undifferentiated configuration across all countries risks losing both ends of the market.
In the full report: country-level market size, volume, average selling price, supplier share and CAGR across the study period, with segment cross-tabulation by the source-defined type and application axes.

Competitive Landscape

The competitive landscape includes global platform suppliers, application specialists and regional value players. Key profiled companies include Infineon Technologies AG, STMicroelectronics N.V., ON Semiconductor, Rohm Semiconductor, Renesas Electronics Corporation, Texas Instruments Incorporated, Microchip Technology Inc., NXP Semiconductors N.V., with competition increasingly decided by design support, product breadth, qualification history, software or ecosystem compatibility and the ability to maintain supply through long customer lifecycles.

Large suppliers benefit from portfolio breadth and cross-selling because customers can qualify several adjacent functions through one vendor relationship. Specialists can still win where they provide superior performance, domain-specific engineering or faster product innovation. The result is a market in which share is often determined during the design phase and then protected by switching costs once the customer enters production.

Pricing power is strongest where a product solves a system-level constraint, such as energy efficiency, functional safety, acoustic performance, low power, security, thermal limits or time to market. Commodity positions are more exposed to price erosion and distributor substitution, while differentiated positions can preserve margin through software, reference designs, certification packages and application engineering.

Tier Companies Basis of competition
Tier 1 Infineon Technologies AG, STMicroelectronics N.V., ON Semiconductor, Rohm Semiconductor, Renesas Electronics Corporation Global design-in reach, broad portfolio, strong channel access and sustained R&D investment.
Tier 2 Texas Instruments Incorporated, Microchip Technology Inc., NXP Semiconductors N.V., Analog Devices, Inc., Power Integrations, Inc., Allegro MicroSystems, Inc. Application specialization, regional strength and targeted technology differentiation.
Tier 3 / Other profiled Broadcom Inc., Diodes Incorporated, Toshiba Electronic Devices & Storage Corporation, Semtech Corporation Value positioning, local distribution and focused product niches.

Key companies profiled in the report scope

  • Infineon Technologies AG
  • STMicroelectronics N.V.
  • ON Semiconductor
  • Rohm Semiconductor
  • Renesas Electronics Corporation
  • Texas Instruments Incorporated
  • Microchip Technology Inc.
  • NXP Semiconductors N.V.
  • Analog Devices, Inc.
  • Power Integrations, Inc.
  • Allegro MicroSystems, Inc.
  • Broadcom Inc.
  • Diodes Incorporated
  • Toshiba Electronic Devices & Storage Corporation
  • Semtech Corporation

Gate Drivers Production Capacity Analysis

Production capacity for the gate drivers market depends on semiconductor wafer fabrication, assembly, test and the availability of qualified process technologies. Large suppliers use a mix of internal fabs and foundry capacity, while back-end packaging and test remain essential for automotive, industrial and consumer-grade product differentiation.

The critical constraint is not simply wafer starts. Product qualification, process migration, packaging, test coverage, long-term reliability and customer-specific validation determine how quickly nominal capacity can become revenue-producing supply. Automotive and industrial products often remain on mature nodes for long periods because predictable analog behavior, embedded nonvolatile memory and proven reliability can matter more than transistor density.

Market Dynamics

Market growth is supported by technology upgrade cycles, broader downstream adoption and rising system-level performance requirements. The principal counterweights are qualification cost, price competition, integration complexity and supply-chain risk. The balance of these forces supports the rebased 5.9% CAGR for 2026–2034.

MARKET DRIVERS

Drivers Impact Analysis*

Factor Directional impact Geographic relevance Impact timeline
Electric-vehicle inverter demand High Global with strongest relevance in Asia Pacific 2026–2034
Wide-bandgap power adoption High Global with strongest relevance in Asia Pacific 2026–2034
Renewable-energy power conversion Medium Global with strongest relevance in Asia Pacific 2026–2034
Industrial automation and motor control Medium Global with strongest relevance in Asia Pacific 2026–2034

Electric-vehicle inverter demand

IEA recorded more than 20 million electric-car sales in 2025, increasing the production base for traction inverters, onboard chargers and DC-DC converters that use isolated gate drivers. The commercial response is therefore visible in product road maps, qualification strategy and channel positioning, which determines whether the factor expands total addressable demand or simply redistributes share among existing suppliers.

Wide-bandgap power adoption

SiC and GaN switches enable higher switching frequency and efficiency but require drivers with tighter control of dv/dt, protection, isolation and fault response, raising gate-driver value per design. The commercial response is therefore visible in product road maps, qualification strategy and channel positioning, which determines whether the factor expands total addressable demand or simply redistributes share among existing suppliers.

Renewable-energy power conversion

IRENA’s 2026 capacity statistics confirm continued global renewable build-out, expanding demand for PV and wind inverters and the gate-control electronics inside them. The commercial response is therefore visible in product road maps, qualification strategy and channel positioning, which determines whether the factor expands total addressable demand or simply redistributes share among existing suppliers.

Industrial automation and motor control

Factory automation, robotics and variable-speed drives require precise switching of MOSFET and IGBT power stages, preserving a large recurring industrial demand base. The commercial response is therefore visible in product road maps, qualification strategy and channel positioning, which determines whether the factor expands total addressable demand or simply redistributes share among existing suppliers.

MARKET RESTRAINTS

Restraints Impact Analysis*

Factor Directional impact Geographic relevance Impact timeline
Qualification cost and long design cycles High Global with strongest relevance in Asia Pacific 2026–2034
High-frequency design complexity High Global with strongest relevance in Asia Pacific 2026–2034
Price pressure in mature silicon drivers Medium Global with strongest relevance in Asia Pacific 2026–2034
Supply-chain concentration Medium Global with strongest relevance in Asia Pacific 2026–2034

Qualification cost and long design cycles

Automotive and industrial platforms require extensive validation, functional-safety documentation and temperature qualification. This protects incumbents but slows supplier substitution and delays monetization of new devices. The commercial response is therefore visible in product road maps, qualification strategy and channel positioning, which determines whether the factor expands total addressable demand or simply redistributes share among existing suppliers.

High-frequency design complexity

Fast SiC and GaN switching raises EMI, parasitic-inductance and false-turn-on risks, increasing engineering effort and making reference designs, layout support and application expertise critical. The commercial response is therefore visible in product road maps, qualification strategy and channel positioning, which determines whether the factor expands total addressable demand or simply redistributes share among existing suppliers.

Price pressure in mature silicon drivers

Standard MOSFET and IGBT driver functions face strong catalog competition, so suppliers must differentiate through integration, isolation, diagnostics and system-level support. The commercial response is therefore visible in product road maps, qualification strategy and channel positioning, which determines whether the factor expands total addressable demand or simply redistributes share among existing suppliers.

Supply-chain concentration

Gate drivers depend on semiconductor fabrication, packaging and test capacity; geopolitical or fab disruptions can create lead-time volatility even when end-market demand remains healthy. The commercial response is therefore visible in product road maps, qualification strategy and channel positioning, which determines whether the factor expands total addressable demand or simply redistributes share among existing suppliers.

MARKET OPPORTUNITIES

Automotive SiC platforms

Infineon’s 2025 EiceDRIVER launch for IGBT and SiC traction inverters shows how automotive-qualified isolated drivers are becoming a dedicated growth layer around 800 V EV platforms. The commercial response is therefore visible in product road maps, qualification strategy and channel positioning, which determines whether the factor expands total addressable demand or simply redistributes share among existing suppliers.

Integrated protection and diagnostics

Desaturation detection, active Miller clamp, soft turn-off and fault telemetry can move value from discrete external components into the driver IC and strengthen supplier lock-in. The commercial response is therefore visible in product road maps, qualification strategy and channel positioning, which determines whether the factor expands total addressable demand or simply redistributes share among existing suppliers.

GaN fast-charging and data-center power

Higher-frequency power stages in adapters, server PSUs and intermediate bus converters create demand for compact drivers optimized for low propagation delay and high common-mode immunity. The commercial response is therefore visible in product road maps, qualification strategy and channel positioning, which determines whether the factor expands total addressable demand or simply redistributes share among existing suppliers.

Reference-platform selling

Suppliers that pair drivers with their own SiC or IGBT modules, controllers and sensing products can capture a larger bill of materials and reduce customer validation time. The commercial response is therefore visible in product road maps, qualification strategy and channel positioning, which determines whether the factor expands total addressable demand or simply redistributes share among existing suppliers.

Gate Drivers Supply Chain Analysis

Wafer & Materials

Silicon wafers, process materials and specialty substrates feed semiconductor fabrication.

Fabrication

IDMs and foundries create die using process nodes chosen for analog, power, embedded-memory and reliability needs.

Packaging & Test

Assembly, qualification and test convert wafer output into application-ready components with required thermal and reliability characteristics.

OEM & Distribution

OEM design-ins, authorized distribution and application support determine how semiconductor supply becomes end-market revenue.

Wafer & Materials: Silicon wafers, process materials and specialty substrates feed semiconductor fabrication. Value capture at this stage depends on the ability to solve a bottleneck that downstream customers cannot easily substitute, so qualification, yield, intellectual property, logistics and support all influence bargaining power.

Fabrication: IDMs and foundries create die using process nodes chosen for analog, power, embedded-memory and reliability needs. Value capture at this stage depends on the ability to solve a bottleneck that downstream customers cannot easily substitute, so qualification, yield, intellectual property, logistics and support all influence bargaining power.

Packaging & Test: Assembly, qualification and test convert wafer output into application-ready components with required thermal and reliability characteristics. Value capture at this stage depends on the ability to solve a bottleneck that downstream customers cannot easily substitute, so qualification, yield, intellectual property, logistics and support all influence bargaining power.

OEM & Distribution: OEM design-ins, authorized distribution and application support determine how semiconductor supply becomes end-market revenue. Value capture at this stage depends on the ability to solve a bottleneck that downstream customers cannot easily substitute, so qualification, yield, intellectual property, logistics and support all influence bargaining power.

Recent Developments in the Gate Drivers Market

2025-09 – Texas Instruments published an application brief for the UCC5880-Q1 and UCC5881-Q1 isolated gate drivers, describing their role in EV traction inverters using IGBT or SiC power switches and emphasizing reliable switching in high dv/dt environments. Source
2025-02 – Infineon expanded its EiceDRIVER portfolio with automotive isolated gate-driver ICs designed for IGBT and SiC traction-inverter platforms, including devices supporting high current output and ISO 26262 requirements. Source
2026-05 – The IEA reported electric-car sales above 20 million units in 2025 and projected continued expansion in 2026, reinforcing the volume outlook for traction-inverter power electronics. Source

REPORT SCOPE & SEGMENTATION

Attribute Details
Study Period 2021–2034
Base Year 2025
Estimated Year 2026
Forecast Period 2026–2034
Historical Period 2021–2025
Market Size 2025 USD 868.6 million
Market Size 2034 USD 1.46 billion
Growth Rate CAGR of 5.9% from 2026–2034
Unit Value (USD Million/Billion) and Volume (Units/Thousand Units where applicable)
Segmentation By Type, By Application, By Region, By End User, By Isolation Technology, By Power Device
By Type Discrete Gate Drivers · On-chip Gate Drivers
By Application Industrial · Automotive · Consumer Electronics · Communications · Others
By End User Original Equipment Manufacturers (OEMs) · Component Distributors · Aftermarket & Repair Services
By Isolation Technology Magnetic Isolation · Optical Isolation · Capacitive Isolation
By Power Device MOSFET Gate Drivers · IGBT Gate Drivers · SiC/GaN Gate Drivers
By Region Each region analysed by Type, Application and Country
North AmericaUnited States, Canada, Mexico
EuropeGermany, France, U.K., Italy, Russia, Rest of Europe
Asia PacificChina, Japan, South Korea, India, Southeast Asia, Rest of Asia Pacific
South AmericaBrazil, Argentina, Colombia, Rest of South America
Middle East & AfricaSaudi Arabia, UAE, Egypt, Nigeria, South Africa, Rest of MEA
Key Companies Profiled Infineon Technologies AG · STMicroelectronics N.V. · ON Semiconductor · Rohm Semiconductor · Renesas Electronics Corporation · Texas Instruments Incorporated · Microchip Technology Inc. · NXP Semiconductors N.V. · Analog Devices, Inc. · Power Integrations, Inc. · Allegro MicroSystems, Inc. · Broadcom Inc. · Diodes Incorporated · Toshiba Electronic Devices & Storage Corporation · Semtech Corporation
Customization Scope Free report customization equivalent to up to four analyst working days with purchase. Addition or alteration to country, regional and segment scope.

Frequently Asked Questions

What is the current size of the market?

The Gate Drivers market is valued at USD 868.6 million in 2025 and is projected to reach USD 1.46 billion by 2034. The rebased series implies a 5.9% CAGR during 2026–2034. The forecast is anchored to the two published market-size values on the source report page and then normalized to the requested 2025 base and 2034 endpoint.

Which product type leads the market?

Discrete Gate Drivers (59%) holds the leading type position in the source-defined segmentation. Its advantage reflects the balance of installed-base demand, performance requirements, design familiarity and supplier availability. SiC/GaN Gate Drivers has the strongest structural growth case because newer systems place greater emphasis on integration, efficiency, advanced features or performance that expands value per unit.

Which application is most important?

Industrial (33%) is the largest current application position, while Automotive is the most important incremental growth channel. Application growth is not only about shipment volume: it also reflects rising content, more demanding technical specifications, stronger qualification requirements and a greater need for system-level support from component or product suppliers.

Which market or region leads in 2025?

China (28%) holds the strongest market position in 2025 within the available source evidence, while Asia Pacific has the most important regional role in the broader competitive structure. Leadership is supported by a combination of downstream demand, manufacturing capacity, design activity, channel depth and faster adoption of newer product generations.

What is the estimated market size in 2026?

The normalized 2026 estimate is USD 920.1 million. This value sits between the 2025 base of USD 868.6 million and the 2034 forecast of USD 1.46 billion, using the same constant annual growth factor implied by the report page’s published market-size anchors. That keeps the series internally consistent across all headline figures.

Gate Drivers Market, Trends, Business Strategies 2026-2034

Get Sample Report PDF for Exclusive Insights

Report Sample Includes

  • Table of Contents
  • List of Tables & Figures
  • Charts, Research Methodology, and more...
Download Sample Report PDF

Download Sample Report

Table of Content

1 Introduction to Research & Analysis Reports
1.1 Gate Drivers Market Definition
1.2 Market Segments
1.2.1 Segment by Type
1.2.2 Segment by Application
1.3 Global Gate Drivers Market Overview
1.4 Features & Benefits of This Report
1.5 Methodology & Sources of Information
1.5.1 Research Methodology
1.5.2 Research Process
1.5.3 Base Year
1.5.4 Report Assumptions & Caveats
2 Global Gate Drivers Overall Market Size
2.1 Global Gate Drivers Market Size: 2024 VS 2032
2.2 Global Gate Drivers Market Size, Prospects & Forecasts: 2020-2032
2.3 Global Gate Drivers Sales: 2020-2032
3 Company Landscape
3.1 Top Gate Drivers Players in Global Market
3.2 Top Global Gate Drivers Companies Ranked by Revenue
3.3 Global Gate Drivers Revenue by Companies
3.4 Global Gate Drivers Sales by Companies
3.5 Global Gate Drivers Price by Manufacturer (2020-2025)
3.6 Top 3 and Top 5 Gate Drivers Companies in Global Market, by Revenue in 2024
3.7 Global Manufacturers Gate Drivers Product Type
3.8 Tier 1, Tier 2, and Tier 3 Gate Drivers Players in Global Market
3.8.1 List of Global Tier 1 Gate Drivers Companies
3.8.2 List of Global Tier 2 and Tier 3 Gate Drivers Companies
4 Sights by Product
4.1 Overview
4.1.1 Segment by Type – Global Gate Drivers Market Size Markets, 2024 & 2032
4.1.2 Discrete Gate Drivers
4.1.3 On-chip Gate Drivers
4.2 Segment by Type – Global Gate Drivers Revenue & Forecasts
4.2.1 Segment by Type – Global Gate Drivers Revenue, 2020-2025
4.2.2 Segment by Type – Global Gate Drivers Revenue, 2026-2032
4.2.3 Segment by Type – Global Gate Drivers Revenue Market Share, 2020-2032
4.3 Segment by Type – Global Gate Drivers Sales & Forecasts
4.3.1 Segment by Type – Global Gate Drivers Sales, 2020-2025
4.3.2 Segment by Type – Global Gate Drivers Sales, 2026-2032
4.3.3 Segment by Type – Global Gate Drivers Sales Market Share, 2020-2032
4.4 Segment by Type – Global Gate Drivers Price (Manufacturers Selling Prices), 2020-2032
5 Sights by Application
5.1 Overview
5.1.1 Segment by Application – Global Gate Drivers Market Size, 2024 & 2032
5.1.2 Automotive
5.1.3 Industrial
5.1.4 Consumer Electronics
5.1.5 Communications
5.1.6 Others
5.2 Segment by Application – Global Gate Drivers Revenue & Forecasts
5.2.1 Segment by Application – Global Gate Drivers Revenue, 2020-2025
5.2.2 Segment by Application – Global Gate Drivers Revenue, 2026-2032
5.2.3 Segment by Application – Global Gate Drivers Revenue Market Share, 2020-2032
5.3 Segment by Application – Global Gate Drivers Sales & Forecasts
5.3.1 Segment by Application – Global Gate Drivers Sales, 2020-2025
5.3.2 Segment by Application – Global Gate Drivers Sales, 2026-2032
5.3.3 Segment by Application – Global Gate Drivers Sales Market Share, 2020-2032
5.4 Segment by Application – Global Gate Drivers Price (Manufacturers Selling Prices), 2020-2032
6 Sights by Region
6.1 By Region – Global Gate Drivers Market Size, 2024 & 2032
6.2 By Region – Global Gate Drivers Revenue & Forecasts
6.2.1 By Region – Global Gate Drivers Revenue, 2020-2025
6.2.2 By Region – Global Gate Drivers Revenue, 2026-2032
6.2.3 By Region – Global Gate Drivers Revenue Market Share, 2020-2032
6.3 By Region – Global Gate Drivers Sales & Forecasts
6.3.1 By Region – Global Gate Drivers Sales, 2020-2025
6.3.2 By Region – Global Gate Drivers Sales, 2026-2032
6.3.3 By Region – Global Gate Drivers Sales Market Share, 2020-2032
6.4 North America
6.4.1 By Country – North America Gate Drivers Revenue, 2020-2032
6.4.2 By Country – North America Gate Drivers Sales, 2020-2032
6.4.3 United States Gate Drivers Market Size, 2020-2032
6.4.4 Canada Gate Drivers Market Size, 2020-2032
6.4.5 Mexico Gate Drivers Market Size, 2020-2032
6.5 Europe
6.5.1 By Country – Europe Gate Drivers Revenue, 2020-2032
6.5.2 By Country – Europe Gate Drivers Sales, 2020-2032
6.5.3 Germany Gate Drivers Market Size, 2020-2032
6.5.4 France Gate Drivers Market Size, 2020-2032
6.5.5 U.K. Gate Drivers Market Size, 2020-2032
6.5.6 Italy Gate Drivers Market Size, 2020-2032
6.5.7 Russia Gate Drivers Market Size, 2020-2032
6.5.8 Nordic Countries Gate Drivers Market Size, 2020-2032
6.5.9 Benelux Gate Drivers Market Size, 2020-2032
6.6 Asia
6.6.1 By Region – Asia Gate Drivers Revenue, 2020-2032
6.6.2 By Region – Asia Gate Drivers Sales, 2020-2032
6.6.3 China Gate Drivers Market Size, 2020-2032
6.6.4 Japan Gate Drivers Market Size, 2020-2032
6.6.5 South Korea Gate Drivers Market Size, 2020-2032
6.6.6 Southeast Asia Gate Drivers Market Size, 2020-2032
6.6.7 India Gate Drivers Market Size, 2020-2032
6.7 South America
6.7.1 By Country – South America Gate Drivers Revenue, 2020-2032
6.7.2 By Country – South America Gate Drivers Sales, 2020-2032
6.7.3 Brazil Gate Drivers Market Size, 2020-2032
6.7.4 Argentina Gate Drivers Market Size, 2020-2032
6.8 Middle East & Africa
6.8.1 By Country – Middle East & Africa Gate Drivers Revenue, 2020-2032
6.8.2 By Country – Middle East & Africa Gate Drivers Sales, 2020-2032
6.8.3 Turkey Gate Drivers Market Size, 2020-2032
6.8.4 Israel Gate Drivers Market Size, 2020-2032
6.8.5 Saudi Arabia Gate Drivers Market Size, 2020-2032
6.8.6 UAE Gate Drivers Market Size, 2020-2032
7 Manufacturers & Brands Profiles
7.1 STMicroelectronics
7.1.1 STMicroelectronics Company Summary
7.1.2 STMicroelectronics Business Overview
7.1.3 STMicroelectronics Gate Drivers Major Product Offerings
7.1.4 STMicroelectronics Gate Drivers Sales and Revenue in Global (2020-2025)
7.1.5 STMicroelectronics Key News & Latest Developments
7.2 Infineon
7.2.1 Infineon Company Summary
7.2.2 Infineon Business Overview
7.2.3 Infineon Gate Drivers Major Product Offerings
7.2.4 Infineon Gate Drivers Sales and Revenue in Global (2020-2025)
7.2.5 Infineon Key News & Latest Developments
7.3 Rohm Semiconductor
7.3.1 Rohm Semiconductor Company Summary
7.3.2 Rohm Semiconductor Business Overview
7.3.3 Rohm Semiconductor Gate Drivers Major Product Offerings
7.3.4 Rohm Semiconductor Gate Drivers Sales and Revenue in Global (2020-2025)
7.3.5 Rohm Semiconductor Key News & Latest Developments
7.4 ON Semiconductor
7.4.1 ON Semiconductor Company Summary
7.4.2 ON Semiconductor Business Overview
7.4.3 ON Semiconductor Gate Drivers Major Product Offerings
7.4.4 ON Semiconductor Gate Drivers Sales and Revenue in Global (2020-2025)
7.4.5 ON Semiconductor Key News & Latest Developments
7.5 Microchip Technology
7.5.1 Microchip Technology Company Summary
7.5.2 Microchip Technology Business Overview
7.5.3 Microchip Technology Gate Drivers Major Product Offerings
7.5.4 Microchip Technology Gate Drivers Sales and Revenue in Global (2020-2025)
7.5.5 Microchip Technology Key News & Latest Developments
7.6 Renesas Electronics
7.6.1 Renesas Electronics Company Summary
7.6.2 Renesas Electronics Business Overview
7.6.3 Renesas Electronics Gate Drivers Major Product Offerings
7.6.4 Renesas Electronics Gate Drivers Sales and Revenue in Global (2020-2025)
7.6.5 Renesas Electronics Key News & Latest Developments
7.7 NXP Semiconductors
7.7.1 NXP Semiconductors Company Summary
7.7.2 NXP Semiconductors Business Overview
7.7.3 NXP Semiconductors Gate Drivers Major Product Offerings
7.7.4 NXP Semiconductors Gate Drivers Sales and Revenue in Global (2020-2025)
7.7.5 NXP Semiconductors Key News & Latest Developments
7.8 Power Integrations
7.8.1 Power Integrations Company Summary
7.8.2 Power Integrations Business Overview
7.8.3 Power Integrations Gate Drivers Major Product Offerings
7.8.4 Power Integrations Gate Drivers Sales and Revenue in Global (2020-2025)
7.8.5 Power Integrations Key News & Latest Developments
7.9 Texas Instruments
7.9.1 Texas Instruments Company Summary
7.9.2 Texas Instruments Business Overview
7.9.3 Texas Instruments Gate Drivers Major Product Offerings
7.9.4 Texas Instruments Gate Drivers Sales and Revenue in Global (2020-2025)
7.9.5 Texas Instruments Key News & Latest Developments
7.10 Allegro MicroSystems
7.10.1 Allegro MicroSystems Company Summary
7.10.2 Allegro MicroSystems Business Overview
7.10.3 Allegro MicroSystems Gate Drivers Major Product Offerings
7.10.4 Allegro MicroSystems Gate Drivers Sales and Revenue in Global (2020-2025)
7.10.5 Allegro MicroSystems Key News & Latest Developments
7.11 Analog Devices
7.11.1 Analog Devices Company Summary
7.11.2 Analog Devices Business Overview
7.11.3 Analog Devices Gate Drivers Major Product Offerings
7.11.4 Analog Devices Gate Drivers Sales and Revenue in Global (2020-2025)
7.11.5 Analog Devices Key News & Latest Developments
7.12 Broadcom
7.12.1 Broadcom Company Summary
7.12.2 Broadcom Business Overview
7.12.3 Broadcom Gate Drivers Major Product Offerings
7.12.4 Broadcom Gate Drivers Sales and Revenue in Global (2020-2025)
7.12.5 Broadcom Key News & Latest Developments
7.13 Diodes
7.13.1 Diodes Company Summary
7.13.2 Diodes Business Overview
7.13.3 Diodes Gate Drivers Major Product Offerings
7.13.4 Diodes Gate Drivers Sales and Revenue in Global (2020-2025)
7.13.5 Diodes Key News & Latest Developments
7.14 Toshiba Electronic
7.14.1 Toshiba Electronic Company Summary
7.14.2 Toshiba Electronic Business Overview
7.14.3 Toshiba Electronic Gate Drivers Major Product Offerings
7.14.4 Toshiba Electronic Gate Drivers Sales and Revenue in Global (2020-2025)
7.14.5 Toshiba Electronic Key News & Latest Developments
7.15 Semtech
7.15.1 Semtech Company Summary
7.15.2 Semtech Business Overview
7.15.3 Semtech Gate Drivers Major Product Offerings
7.15.4 Semtech Gate Drivers Sales and Revenue in Global (2020-2025)
7.15.5 Semtech Key News & Latest Developments
7.16 Littelfuse
7.16.1 Littelfuse Company Summary
7.16.2 Littelfuse Business Overview
7.16.3 Littelfuse Gate Drivers Major Product Offerings
7.16.4 Littelfuse Gate Drivers Sales and Revenue in Global (2020-2025)
7.16.5 Littelfuse Key News & Latest Developments
7.17 Richtek
7.17.1 Richtek Company Summary
7.17.2 Richtek Business Overview
7.17.3 Richtek Gate Drivers Major Product Offerings
7.17.4 Richtek Gate Drivers Sales and Revenue in Global (2020-2025)
7.17.5 Richtek Key News & Latest Developments
8 Global Gate Drivers Production Capacity, Analysis
8.1 Global Gate Drivers Production Capacity, 2020-2032
8.2 Gate Drivers Production Capacity of Key Manufacturers in Global Market
8.3 Global Gate Drivers Production by Region
9 Key Market Trends, Opportunity, Drivers and Restraints
9.1 Market Opportunities & Trends
9.2 Market Drivers
9.3 Market Restraints
10 Gate Drivers Supply Chain Analysis
10.1 Gate Drivers Industry Value Chain
10.2 Gate Drivers Upstream Market
10.3 Gate Drivers Downstream and Clients
10.4 Marketing Channels Analysis
10.4.1 Marketing Channels
10.4.2 Gate Drivers Distributors and Sales Agents in Global
11 Conclusion
12 Appendix
12.1 Note
12.2 Examples of Clients
12.3 DisclaimerList of Tables
Table 1. Key Players of Gate Drivers in Global Market
Table 2. Top Gate Drivers Players in Global Market, Ranking by Revenue (2024)
Table 3. Global Gate Drivers Revenue by Companies, (US$, Mn), 2020-2025
Table 4. Global Gate Drivers Revenue Share by Companies, 2020-2025
Table 5. Global Gate Drivers Sales by Companies, (M Units), 2020-2025
Table 6. Global Gate Drivers Sales Share by Companies, 2020-2025
Table 7. Key Manufacturers Gate Drivers Price (2020-2025) & (US$/Unit)
Table 8. Global Manufacturers Gate Drivers Product Type
Table 9. List of Global Tier 1 Gate Drivers Companies, Revenue (US$, Mn) in 2024 and Market Share
Table 10. List of Global Tier 2 and Tier 3 Gate Drivers Companies, Revenue (US$, Mn) in 2024 and Market Share
Table 11. Segment by Type – Global Gate Drivers Revenue, (US$, Mn), 2024 & 2032
Table 12. Segment by Type – Global Gate Drivers Revenue (US$, Mn), 2020-2025
Table 13. Segment by Type – Global Gate Drivers Revenue (US$, Mn), 2026-2032
Table 14. Segment by Type – Global Gate Drivers Sales (M Units), 2020-2025
Table 15. Segment by Type – Global Gate Drivers Sales (M Units), 2026-2032
Table 16. Segment by Application – Global Gate Drivers Revenue, (US$, Mn), 2024 & 2032
Table 17. Segment by Application – Global Gate Drivers Revenue, (US$, Mn), 2020-2025
Table 18. Segment by Application – Global Gate Drivers Revenue, (US$, Mn), 2026-2032
Table 19. Segment by Application – Global Gate Drivers Sales, (M Units), 2020-2025
Table 20. Segment by Application – Global Gate Drivers Sales, (M Units), 2026-2032
Table 21. By Region – Global Gate Drivers Revenue, (US$, Mn), 2025-2032
Table 22. By Region – Global Gate Drivers Revenue, (US$, Mn), 2020-2025
Table 23. By Region – Global Gate Drivers Revenue, (US$, Mn), 2026-2032
Table 24. By Region – Global Gate Drivers Sales, (M Units), 2020-2025
Table 25. By Region – Global Gate Drivers Sales, (M Units), 2026-2032
Table 26. By Country – North America Gate Drivers Revenue, (US$, Mn), 2020-2025
Table 27. By Country – North America Gate Drivers Revenue, (US$, Mn), 2026-2032
Table 28. By Country – North America Gate Drivers Sales, (M Units), 2020-2025
Table 29. By Country – North America Gate Drivers Sales, (M Units), 2026-2032
Table 30. By Country – Europe Gate Drivers Revenue, (US$, Mn), 2020-2025
Table 31. By Country – Europe Gate Drivers Revenue, (US$, Mn), 2026-2032
Table 32. By Country – Europe Gate Drivers Sales, (M Units), 2020-2025
Table 33. By Country – Europe Gate Drivers Sales, (M Units), 2026-2032
Table 34. By Region – Asia Gate Drivers Revenue, (US$, Mn), 2020-2025
Table 35. By Region – Asia Gate Drivers Revenue, (US$, Mn), 2026-2032
Table 36. By Region – Asia Gate Drivers Sales, (M Units), 2020-2025
Table 37. By Region – Asia Gate Drivers Sales, (M Units), 2026-2032
Table 38. By Country – South America Gate Drivers Revenue, (US$, Mn), 2020-2025
Table 39. By Country – South America Gate Drivers Revenue, (US$, Mn), 2026-2032
Table 40. By Country – South America Gate Drivers Sales, (M Units), 2020-2025
Table 41. By Country – South America Gate Drivers Sales, (M Units), 2026-2032
Table 42. By Country – Middle East & Africa Gate Drivers Revenue, (US$, Mn), 2020-2025
Table 43. By Country – Middle East & Africa Gate Drivers Revenue, (US$, Mn), 2026-2032
Table 44. By Country – Middle East & Africa Gate Drivers Sales, (M Units), 2020-2025
Table 45. By Country – Middle East & Africa Gate Drivers Sales, (M Units), 2026-2032
Table 46. STMicroelectronics Company Summary
Table 47. STMicroelectronics Gate Drivers Product Offerings
Table 48. STMicroelectronics Gate Drivers Sales (M Units), Revenue (US$, Mn) and Average Price (US$/Unit) & (2020-2025)
Table 49. STMicroelectronics Key News & Latest Developments
Table 50. Infineon Company Summary
Table 51. Infineon Gate Drivers Product Offerings
Table 52. Infineon Gate Drivers Sales (M Units), Revenue (US$, Mn) and Average Price (US$/Unit) & (2020-2025)
Table 53. Infineon Key News & Latest Developments
Table 54. Rohm Semiconductor Company Summary
Table 55. Rohm Semiconductor Gate Drivers Product Offerings
Table 56. Rohm Semiconductor Gate Drivers Sales (M Units), Revenue (US$, Mn) and Average Price (US$/Unit) & (2020-2025)
Table 57. Rohm Semiconductor Key News & Latest Developments
Table 58. ON Semiconductor Company Summary
Table 59. ON Semiconductor Gate Drivers Product Offerings
Table 60. ON Semiconductor Gate Drivers Sales (M Units), Revenue (US$, Mn) and Average Price (US$/Unit) & (2020-2025)
Table 61. ON Semiconductor Key News & Latest Developments
Table 62. Microchip Technology Company Summary
Table 63. Microchip Technology Gate Drivers Product Offerings
Table 64. Microchip Technology Gate Drivers Sales (M Units), Revenue (US$, Mn) and Average Price (US$/Unit) & (2020-2025)
Table 65. Microchip Technology Key News & Latest Developments
Table 66. Renesas Electronics Company Summary
Table 67. Renesas Electronics Gate Drivers Product Offerings
Table 68. Renesas Electronics Gate Drivers Sales (M Units), Revenue (US$, Mn) and Average Price (US$/Unit) & (2020-2025)
Table 69. Renesas Electronics Key News & Latest Developments
Table 70. NXP Semiconductors Company Summary
Table 71. NXP Semiconductors Gate Drivers Product Offerings
Table 72. NXP Semiconductors Gate Drivers Sales (M Units), Revenue (US$, Mn) and Average Price (US$/Unit) & (2020-2025)
Table 73. NXP Semiconductors Key News & Latest Developments
Table 74. Power Integrations Company Summary
Table 75. Power Integrations Gate Drivers Product Offerings
Table 76. Power Integrations Gate Drivers Sales (M Units), Revenue (US$, Mn) and Average Price (US$/Unit) & (2020-2025)
Table 77. Power Integrations Key News & Latest Developments
Table 78. Texas Instruments Company Summary
Table 79. Texas Instruments Gate Drivers Product Offerings
Table 80. Texas Instruments Gate Drivers Sales (M Units), Revenue (US$, Mn) and Average Price (US$/Unit) & (2020-2025)
Table 81. Texas Instruments Key News & Latest Developments
Table 82. Allegro MicroSystems Company Summary
Table 83. Allegro MicroSystems Gate Drivers Product Offerings
Table 84. Allegro MicroSystems Gate Drivers Sales (M Units), Revenue (US$, Mn) and Average Price (US$/Unit) & (2020-2025)
Table 85. Allegro MicroSystems Key News & Latest Developments
Table 86. Analog Devices Company Summary
Table 87. Analog Devices Gate Drivers Product Offerings
Table 88. Analog Devices Gate Drivers Sales (M Units), Revenue (US$, Mn) and Average Price (US$/Unit) & (2020-2025)
Table 89. Analog Devices Key News & Latest Developments
Table 90. Broadcom Company Summary
Table 91. Broadcom Gate Drivers Product Offerings
Table 92. Broadcom Gate Drivers Sales (M Units), Revenue (US$, Mn) and Average Price (US$/Unit) & (2020-2025)
Table 93. Broadcom Key News & Latest Developments
Table 94. Diodes Company Summary
Table 95. Diodes Gate Drivers Product Offerings
Table 96. Diodes Gate Drivers Sales (M Units), Revenue (US$, Mn) and Average Price (US$/Unit) & (2020-2025)
Table 97. Diodes Key News & Latest Developments
Table 98. Toshiba Electronic Company Summary
Table 99. Toshiba Electronic Gate Drivers Product Offerings
Table 100. Toshiba Electronic Gate Drivers Sales (M Units), Revenue (US$, Mn) and Average Price (US$/Unit) & (2020-2025)
Table 101. Toshiba Electronic Key News & Latest Developments
Table 102. Semtech Company Summary
Table 103. Semtech Gate Drivers Product Offerings
Table 104. Semtech Gate Drivers Sales (M Units), Revenue (US$, Mn) and Average Price (US$/Unit) & (2020-2025)
Table 105. Semtech Key News & Latest Developments
Table 106. Littelfuse Company Summary
Table 107. Littelfuse Gate Drivers Product Offerings
Table 108. Littelfuse Gate Drivers Sales (M Units), Revenue (US$, Mn) and Average Price (US$/Unit) & (2020-2025)
Table 109. Littelfuse Key News & Latest Developments
Table 110. Richtek Company Summary
Table 111. Richtek Gate Drivers Product Offerings
Table 112. Richtek Gate Drivers Sales (M Units), Revenue (US$, Mn) and Average Price (US$/Unit) & (2020-2025)
Table 113. Richtek Key News & Latest Developments
Table 114. Gate Drivers Capacity of Key Manufacturers in Global Market, 2023-2025 (M Units)
Table 115. Global Gate Drivers Capacity Market Share of Key Manufacturers, 2023-2025
Table 116. Global Gate Drivers Production by Region, 2020-2025 (M Units)
Table 117. Global Gate Drivers Production by Region, 2026-2032 (M Units)
Table 118. Gate Drivers Market Opportunities & Trends in Global Market
Table 119. Gate Drivers Market Drivers in Global Market
Table 120. Gate Drivers Market Restraints in Global Market
Table 121. Gate Drivers Raw Materials
Table 122. Gate Drivers Raw Materials Suppliers in Global Market
Table 123. Typical Gate Drivers Downstream
Table 124. Gate Drivers Downstream Clients in Global Market
Table 125. Gate Drivers Distributors and Sales Agents in Global Market

List of Figures
Figure 1. Gate Drivers Product Picture
Figure 2. Gate Drivers Segment by Type in 2024
Figure 3. Gate Drivers Segment by Application in 2024
Figure 4. Global Gate Drivers Market Overview: 2024
Figure 5. Key Caveats
Figure 6. Global Gate Drivers Market Size: 2024 VS 2032 (US$, Mn)
Figure 7. Global Gate Drivers Revenue: 2020-2032 (US$, Mn)
Figure 8. Gate Drivers Sales in Global Market: 2020-2032 (M Units)
Figure 9. The Top 3 and 5 Players Market Share by Gate Drivers Revenue in 2024
Figure 10. Segment by Type – Global Gate Drivers Revenue, (US$, Mn), 2024 & 2032
Figure 11. Segment by Type – Global Gate Drivers Revenue Market Share, 2020-2032
Figure 12. Segment by Type – Global Gate Drivers Sales Market Share, 2020-2032
Figure 13. Segment by Type – Global Gate Drivers Price (US$/Unit), 2020-2032
Figure 14. Segment by Application – Global Gate Drivers Revenue, (US$, Mn), 2024 & 2032
Figure 15. Segment by Application – Global Gate Drivers Revenue Market Share, 2020-2032
Figure 16. Segment by Application – Global Gate Drivers Sales Market Share, 2020-2032
Figure 17. Segment by Application -Global Gate Drivers Price (US$/Unit), 2020-2032
Figure 18. By Region – Global Gate Drivers Revenue, (US$, Mn), 2025 & 2032
Figure 19. By Region – Global Gate Drivers Revenue Market Share, 2020 VS 2024 VS 2032
Figure 20. By Region – Global Gate Drivers Revenue Market Share, 2020-2032
Figure 21. By Region – Global Gate Drivers Sales Market Share, 2020-2032
Figure 22. By Country – North America Gate Drivers Revenue Market Share, 2020-2032
Figure 23. By Country – North America Gate Drivers Sales Market Share, 2020-2032
Figure 24. United States Gate Drivers Revenue, (US$, Mn), 2020-2032
Figure 25. Canada Gate Drivers Revenue, (US$, Mn), 2020-2032
Figure 26. Mexico Gate Drivers Revenue, (US$, Mn), 2020-2032
Figure 27. By Country – Europe Gate Drivers Revenue Market Share, 2020-2032
Figure 28. By Country – Europe Gate Drivers Sales Market Share, 2020-2032
Figure 29. Germany Gate Drivers Revenue, (US$, Mn), 2020-2032
Figure 30. France Gate Drivers Revenue, (US$, Mn), 2020-2032
Figure 31. U.K. Gate Drivers Revenue, (US$, Mn), 2020-2032
Figure 32. Italy Gate Drivers Revenue, (US$, Mn), 2020-2032
Figure 33. Russia Gate Drivers Revenue, (US$, Mn), 2020-2032
Figure 34. Nordic Countries Gate Drivers Revenue, (US$, Mn), 2020-2032
Figure 35. Benelux Gate Drivers Revenue, (US$, Mn), 2020-2032
Figure 36. By Region – Asia Gate Drivers Revenue Market Share, 2020-2032
Figure 37. By Region – Asia Gate Drivers Sales Market Share, 2020-2032
Figure 38. China Gate Drivers Revenue, (US$, Mn), 2020-2032
Figure 39. Japan Gate Drivers Revenue, (US$, Mn), 2020-2032
Figure 40. South Korea Gate Drivers Revenue, (US$, Mn), 2020-2032
Figure 41. Southeast Asia Gate Drivers Revenue, (US$, Mn), 2020-2032
Figure 42. India Gate Drivers Revenue, (US$, Mn), 2020-2032
Figure 43. By Country – South America Gate Drivers Revenue Market Share, 2020-2032
Figure 44. By Country – South America Gate Drivers Sales, Market Share, 2020-2032
Figure 45. Brazil Gate Drivers Revenue, (US$, Mn), 2020-2032
Figure 46. Argentina Gate Drivers Revenue, (US$, Mn), 2020-2032
Figure 47. By Country – Middle East & Africa Gate Drivers Revenue, Market Share, 2020-2032
Figure 48. By Country – Middle East & Africa Gate Drivers Sales, Market Share, 2020-2032
Figure 49. Turkey Gate Drivers Revenue, (US$, Mn), 2020-2032
Figure 50. Israel Gate Drivers Revenue, (US$, Mn), 2020-2032
Figure 51. Saudi Arabia Gate Drivers Revenue, (US$, Mn), 2020-2032
Figure 52. UAE Gate Drivers Revenue, (US$, Mn), 2020-2032
Figure 53. Global Gate Drivers Production Capacity (M Units), 2020-2032
Figure 54. The Percentage of Production Gate Drivers by Region, 2024 VS 2032
Figure 55. Gate Drivers Industry Value Chain
Figure 56. Marketing Channels