SEMICONDUCTOR INSIGHT
MARKET RESEARCH REPORT

Wide Bandgap Semiconductor Market

2026 to 2034
MARKET INTELLIGENCE
ACROSS KEY REGIONS
2026 EDITION
POWER ELECTRONICS Semiconductor Market Research

Wide Bandgap Semiconductor Market

Size, Share & Industry Analysis, By Type (Silicon Carbide (SiC) Substrate, Gallium Nitride (GaN) Substrate, Aluminum Nitride (AlN) Substrate, Others), By Application (Power Discrete Devices, RF Devices, Optoelectronic Devices), By Diameter (100 mm and below, 150 mm, 200 mm, Above 200 mm), By Buyer Type (Integrated Device Manufacturers, Specialist Device Foundries, Research and Specialty Fabs), By Wafer Format (Polished Bare Substrates, Epitaxial Wafers, AlN Templates and Specialty Wafers), and Regional Forecast, 2026-2036

◷
UPDATED 26 October 2026
▤
REPORT LENGTH Detailed Report
▣
REPORT CODE 66398fbf1a31
▯
FORMATS PDF

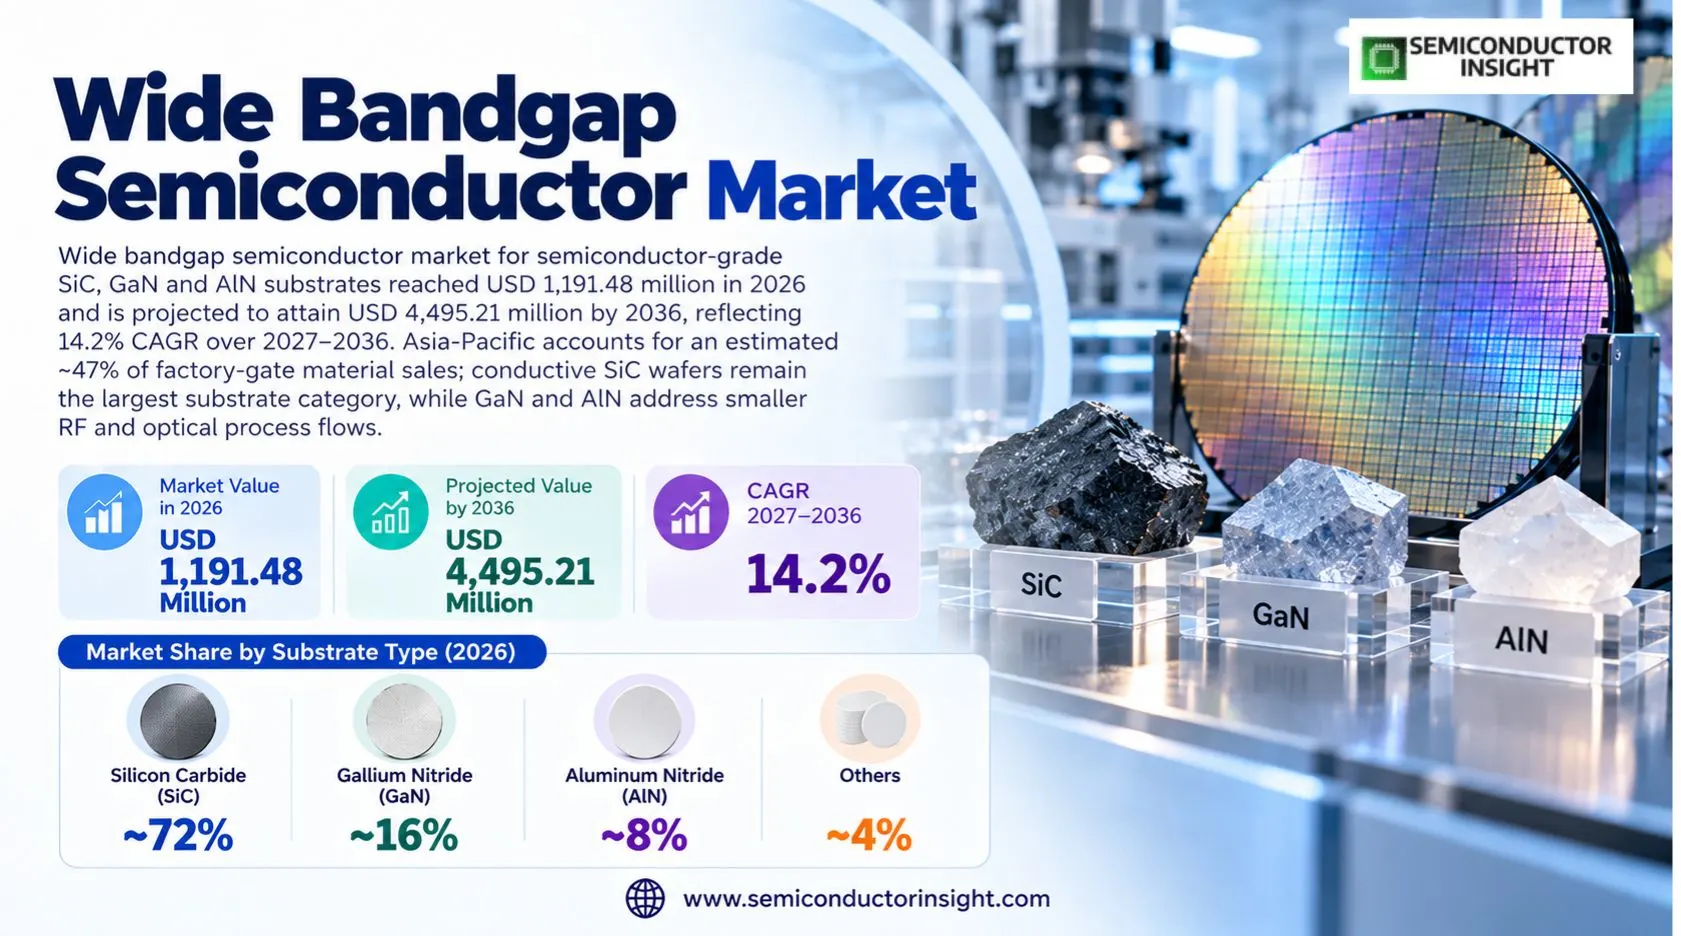
Wide bandgap semiconductor market for semiconductor-grade SiC, GaN and AlN substrates reached USD 1,191.48 million in 2026 and is projected to attain USD 4,495.21 million by 2036, reflecting 14.2% CAGR over 2027–2036. Asia-Pacific accounts for an estimated ~47% of factory-gate material sales; conductive SiC wafers remain the largest substrate category, while GaN and AlN address smaller RF and optical process flows.

Get the sample PDF with study scope, segmentation and methodology details.

Key Statistics

2026 Market Size
USD 1,191.48 million
2036 Projected Size
USD 4,495.21 million
CAGR (2027–2036)
14.2%
Largest Market in 2026
Asia-Pacific (~47%)

Key Takeaways

  • Market size: the upstream wide-bandgap semiconductor substrate business stands at USD 1,191.48 million in 2026 and is projected to reach USD 4,495.21 million in 2036, advancing at a 14.2% compound rate on the publisher-endpoint trajectory; this definition counts wafer and epitaxy material rather than completed transistors.
  • Silicon carbide: SiC substrates account for an estimated ~72% of 2026 value because conductive 4H-SiC supports high-voltage power fabrication, while semi-insulating grades feed RF epitaxy; GaN substrates hold an estimated ~16% and AlN substrates and templates ~8%.
  • Applications: power discrete device fabrication accounts for an estimated ~61% of 2026 substrate revenue; RF fabrication represents ~25%, driven by semi-insulating wafers and GaN epitaxy, while optoelectronic device manufacturing uses a smaller ~14% of substrate demand.
  • Regional leadership: Asia-Pacific represents an estimated ~47% of 2026 substrate value, ahead of North America at ~23% and Europe at ~20%; the model reflects downstream wafer processing in East Asia and qualified materials supply in the United States and Europe.
  • Technology transition: the 150 mm diameter class retains an estimated ~43% of 2026 revenue while 200 mm wafers represent ~38%; premium 200 mm launches and longer-term contracts make material quality and customer acceptance more decisive than headline wafer diameter alone.
  • Competitive structure: Wolfspeed, Coherent, SiCrystal, SK Siltron CSS, TanKeBlue, SICC, Resonac, Soitec, SCIOCS and Kyma compete in distinct SiC or nitride wafer niches; product-grade evidence matters more than finished-device company size.

Wide Bandgap Semiconductor Market Overview

Wide bandgap semiconductor market for semiconductor-grade SiC, GaN and AlN substrates reached USD 1,191.48 million in 2026 and is projected to attain USD 4,495.21 million by 2036, reflecting 14.2% CAGR over 2027–2036. Asia-Pacific accounts for an estimated ~47% of factory-gate material sales; conductive SiC wafers remain the largest substrate category, while GaN and AlN address smaller RF and optical process flows.

Base year: 2026 · Estimated year: 2027 · Forecast period: 2027–2036 · Historical reference: 2023 · Values in USD million

Wide-bandgap substrates are single-crystal or epitaxial semiconductor wafers purchased before device fabrication. Conductive 4H silicon carbide enables high-voltage switching die, semi-insulating silicon carbide underpins GaN radio-frequency epitaxy, native gallium nitride supports selected power and optoelectronic structures, and aluminum nitride templates serve ultraviolet emitters. The revenue boundary is the factory-gate material wafer or qualifying epitaxial wafer sold to a semiconductor customer. The price of a finished MOSFET, packaged RF amplifier, inverter or vehicle is excluded because each adds downstream processing value to the original wafer.

Silicon carbide crystal quality drives customer economics through threading screw dislocations, basal-plane dislocations, micropipes, thickness variation, bow and surface finishing. Wolfspeed introduced orderable Premium 200 mm n-type material in September 2026 and disclosed fewer than 0.01 micropipes per square centimetre for that grade. Its 150 mm and 200 mm catalog entries differentiate bare polished wafers from epitaxial structures, which have different processing and price characteristics. The estimated ~72% SiC material share reflects the larger qualified high-voltage wafer base, not a manufacturer-reported global market percentage.

The manufacturing transition from 150 mm to 200 mm SiC changes usable area, boule utilization, metrology requirements and device fab tool sets. Coherent reported 200 mm epitaxial shipments in September 2024 and highlighted a 1.8-fold usable-area improvement relative to 150 mm wafers. The 200 mm class represents an estimated ~38% of 2026 substrate revenue in the modeled diameter split; however, large diameter does not guarantee lower cost per qualified die when crystal defects, wafer warp or epitaxial rework increase. Customer qualification can stretch across multiple process generations.

Native GaN and GaN-on-SiC are separate product routes. Sumitomo Chemical SCIOCS lists 2-inch and 4-inch n-type GaN substrates, 2-inch semi-insulating GaN and epitaxial wafers for RF and power applications. The company also describes 6-inch GaN substrates as development-stage rather than a broad commercial equivalent to established 200 mm SiC. GaN substrate revenue is modeled at ~16% of 2026 value; the materials address high-efficiency power, laser and RF device development, but silicon or SiC-based GaN epitaxy can compete with bulk GaN in many process flows.

Aluminum nitride is strategically relevant but has a narrower merchant substrate base. SCIOCS lists 2-inch AlN templates for ultraviolet LEDs and indicates sample availability, which is not the same as large-scale commercial substrate shipments. This distinction limits the confidence with which template demonstrations can be translated into revenue. The modeled ~8% AlN share is an analyst allocation and not an audited shipment statistic; qualification hinges on crystal dislocations, transparency, surface roughness and repeatability through subsequent epitaxy.

The geographic supply chain spans American crystal growth, European epitaxy operations and Asian device manufacturing clusters. Coherent has discussed Pennsylvania substrate expansion and Swedish epitaxy investment, while a May 2023 agreement with Mitsubishi Electric addressed 200 mm SiC substrate sourcing for future power-device fabrication. These announcements establish real supply relationships but do not reveal a consolidated global wafer revenue series. The 2036 forecast therefore remains an extension of the published 2023–2030 endpoint path, sensitive to pricing, yields and materials substitution.

Segment Analysis: By Type

By substrate type, the market includes Silicon Carbide, Gallium Nitride, Aluminum Nitride and Others. SiC accounts for an estimated ~72% of 2026 factory-gate material value, GaN ~16%, AlN ~8% and specialty others ~4%; the separation follows the wafer material purchased by the device fabricator, rather than the composition of finished electronics.

Substrate type Device-manufacturing role Competitive and growth position
Silicon Carbide (SiC) Substrate Conductive n-type 4H-SiC wafers support power switching; high-purity semi-insulating material supports GaN-on-SiC RF epi. Wolfspeed lists 150 mm and 200 mm conductive grades and 100 mm and 150 mm RF grades, with wafer quality, resistance, crystal orientation and epi readiness determining commercial selection. The modeled type allocation assigns ~72% of 2026 wafer revenue to Silicon Carbide (SiC) Substrate, with a segment growth path near ~13.6% CAGR and indicative 2030 and 2036 factory-gate values of USD 1,427.9 million and USD 3,066.6 million respectively. Qualified supply at 200 mm and defect reduction underpin the value premium, but price declines per usable area can temper revenue even when device output rises. Wolfspeed and Coherent disclose commercial materials programs and customer qualification, making SiC the strongest directly documented substrate category. The estimated type allocation assigns ~72% of 2026 wafer revenue to Silicon Carbide (SiC) Substrate, with a segment growth path near ~13.6% CAGR and indicative 2030 and 2036 factory-gate values of USD 1,427.9 million and USD 3,066.6 million respectively.
Gallium Nitride (GaN) Substrate Freestanding native GaN wafers are purchased for laser diodes, selected power switching experiments and GaN-on-GaN epitaxial device structures. SCIOCS markets 2-inch and 4-inch n-type GaN and 2-inch semi-insulating GaN; higher-diameter developments require separate qualification before being treated as mass production. The modeled type allocation assigns ~16% of 2026 wafer revenue to Gallium Nitride (GaN) Substrate, with a segment growth path near ~16.8% CAGR and indicative 2030 and 2036 factory-gate values of USD 354.4 million and USD 898.4 million respectively. Native GaN may reduce defect density for some vertical device concepts, while competing GaN-on-silicon and GaN-on-SiC processes can constrain the merchant bulk-wafer addressable pool. The model gives GaN faster growth than SiC from a smaller 2026 revenue base. The estimated type allocation assigns ~16% of 2026 wafer revenue to Gallium Nitride (GaN) Substrate, with a segment growth path near ~16.8% CAGR and indicative 2030 and 2036 factory-gate values of USD 354.4 million and USD 898.4 million respectively.
Aluminum Nitride (AlN) Substrate AlN templates and crystalline materials are relevant to deep-ultraviolet optoelectronics and specialty nitride epitaxy. SCIOCS offers 2-inch AlN templates on foreign substrates for ultraviolet LED structures, indicating sampling rather than blanket qualification across high-volume device fabs. The modeled type allocation assigns ~8% of 2026 wafer revenue to Aluminum Nitride (AlN) Substrate, with a segment growth path near ~15.7% CAGR and indicative 2030 and 2036 factory-gate values of USD 170.7 million and USD 408.8 million respectively. Optical absorption, lattice matching and defect density govern the economic viability of AlN-based material purchases. The distinction between semiconductor epitaxial templates and thermal ceramic substrates is critical because unrelated packaging ceramic sales do not belong in this market. The estimated type allocation assigns ~8% of 2026 wafer revenue to Aluminum Nitride (AlN) Substrate, with a segment growth path near ~15.7% CAGR and indicative 2030 and 2036 factory-gate values of USD 170.7 million and USD 408.8 million respectively.
Others Other wide-bandgap substrate materials include specialty engineered wafer compositions used in research or niche electronic and optical structures. Commercial use depends on a device process requiring a true semiconductor substrate rather than a generic thermal spreader or mechanical carrier. The modeled type allocation assigns ~4% of 2026 wafer revenue to Others, with a segment growth path near ~9.8% CAGR and indicative 2030 and 2036 factory-gate values of USD 69.3 million and USD 121.5 million respectively. This residual category excludes standalone packaging ceramics, diamond heat spreaders and silicon wafers that do not function as the wide-bandgap semiconductor growth substrate. Its modeled small share avoids inflating the denominator with adjacent materials businesses. The estimated type allocation assigns ~4% of 2026 wafer revenue to Others, with a segment growth path near ~9.8% CAGR and indicative 2030 and 2036 factory-gate values of USD 69.3 million and USD 121.5 million respectively.

Diameter, buyer and wafer-format segmentation

Wafer diameter separates established 100 mm and 150 mm production from 200 mm qualification and emerging larger material experiments. The modeled diameter allocation is ~18% for 100 mm and below, ~43% for 150 mm, ~38% for 200 mm and ~1% for larger experimental formats. The 200 mm value class grows fastest as fabs migrate equipment and as suppliers lower defect densities.

Customer class distinguishes integrated device manufacturers from specialist foundries and research-oriented fabs. Integrated manufacturers account for an estimated ~57% of 2026 substrate purchasing, specialist foundries ~27%, and research and specialty fabrication ~16%. Qualified vendor lists, engineering-change control and multi-year wafer supply contracts create switching costs that differ markedly from commodity ceramics purchasing. The modeled buyer type allocation assigns ~57% of 2026 wafer revenue to Integrated Device Manufacturers, with a segment growth path near ~13.9% CAGR and indicative 2030 and 2036 factory-gate values of USD 1,142.9 million and USD 2,495.3 million respectively.

Wafer format distinguishes polished bare substrates, processed epitaxial wafers and nitride templates. Bare wafers account for an estimated ~64% of value, epitaxial wafers ~30% and AlN templates or specialty wafer formats ~6%. An epi-ready surface does not automatically include the device epitaxial layer; pricing must track the actual manufacturing stage transferred to the buyer.

Segment Analysis: By Application

By end-device application, Power Discrete Devices lead at an estimated ~61% of 2026 wafer revenue, followed by RF Devices at ~25% and Optoelectronic Devices at ~14%. These are uses of purchased substrate material; the revenue of a fabricated device is not included. Power and RF buyers specify distinct electrical grades, and optoelectronics customers prioritize crystal quality and epitaxial compatibility.

Application Demand characteristics
Power Discrete Devices Power-device wafer demand comes from SiC MOSFET and diode manufacturing for traction inverters, charging, renewable conversion and industrial high-voltage switching. The purchasing object is a conductive crystal wafer or epitaxial wafer, not the transistor package. Coherent’s 10 kV-class thick epitaxy capability and Wolfspeed’s 200 mm conductive grades illustrate the material qualification requirements that differentiate this application.
RF Devices Radio-frequency material demand is centered on semi-insulating SiC and GaN-on-SiC epitaxial wafers for high-power radio transistors. Wolfspeed lists 100 mm and 150 mm high-purity semi-insulating SiC, while SCIOCS specifies AlGaN/GaN HEMT epitaxy on semi-insulating SiC and GaN. Wafer resistivity, trap behavior and microwave dispersion matter more here than the low-resistance properties sought by conductive power grades.
Optoelectronic Devices Optoelectronic applications consume native GaN and AlN templates for lasers, LEDs and ultraviolet emitters. SCIOCS documents 2-inch and 4-inch native GaN wafer products and 2-inch AlN template sampling. This channel is smaller than power switching by estimated value but can command specialist premiums for crystalline perfection, transparency and compatible nitride epitaxial growth processes. The modeled application allocation assigns ~14% of 2026 wafer revenue to Optoelectronic Devices, with a segment growth path near ~12.4% CAGR and indicative 2030 and 2036 factory-gate values of USD 266.4 million and USD 537.6 million respectively.

Power and RF purchasing share common crystal suppliers but demand different electrical grades. A conductive SiC wafer may be ideal for a 1,200 V power MOSFET yet unsuitable for a low-loss microwave GaN HEMT, which needs semi-insulating behavior. This split explains why a manufacturer can expand wafer output without proportional growth across every application. The modeled ~61% power share and ~25% RF share should be read as distinct 2026 material end uses, not a breakdown of finished transistor sales.

Optoelectronic buyers emphasize surface morphology and optical quality rather than inverter switching loss. Native GaN and AlN templates may be priced on diameter, crystalline defect profile and epitaxial readiness, with 2-inch and 4-inch classes still relevant for specialized device processes. The estimated ~14% optoelectronics allocation captures these specialty materials but excludes packaged UV LEDs, laser modules and optical systems whose commercial prices include fabrication and assembly beyond the wafer.
Regional Analysis

Asia-Pacific leads upstream substrate purchases with an estimated ~47% of 2026 value, followed by North America at ~23%, Europe at ~20%, South America at ~5% and Middle East & Africa at ~5%. Regional allocations follow the destination of qualifying semiconductor material purchases, not the geographic value of finished SiC or GaN devices.

How do semiconductor substrate demand and wafer qualifications vary by region?

Regional competition is shaped by where crystals are grown, where epitaxy is deposited and where finished semiconductor die are fabricated. A wafer shipped from a U.S. boule-growth facility to an Asian device fab may appear in manufacturing statistics for multiple stages, but the market measures a single factory-gate substrate sale. The estimated ~47% Asia-Pacific share reflects the density of downstream fab qualifications, while ~23% North America reflects strong materials supplier participation and cross-border contracts. Europe at ~20% combines device demand with epitaxial processing capacity.

Region Position Growth outlook Demand profile What decides supplier selection
Asia-Pacific Estimated ~47% share ~15.9% CAGR East Asian crystal growth and device-fab qualifications concentrate purchasing for power and RF wafers. Japan combines Mitsubishi Electric power fabrication with Sumitomo Chemical SCIOCS native GaN capability, while Chinese material suppliers expand domestic SiC capacity. Taiwan and South Korea contribute specialty device and electronics manufacturing customers. This mix makes the region the leading 2026 material market. Qualification requirements include wafer diameter, defect maps, dopant control, customer lot traceability and supplier continuity; the material price paid by a device fab is counted once at the wafer stage. East Asian crystal growth and device-fab qualifications concentrate purchasing f The modeled region allocation assigns ~47% of 2026 wafer revenue to Asia-Pacific, with a segment growth path near ~15.9% CAGR and indicative 2030 and 2036 factory-gate values of USD 1,011.8 million and USD 2,457.0 million respectively.
North America Estimated ~23% share ~12.2% CAGR The United States hosts Wolfspeed and Coherent silicon carbide materials operations and technology programs that anchor merchant substrate supply. Coherent has outlined Pennsylvania crystal growth capacity and 200 mm epi capability; Wolfspeed markets conductive and semi-insulating SiC grades. Canadian and Mexican downstream industrial electronics ecosystems influence demand, although direct substrate manufacturing evidence is concentrated in the United States. Customer acceptance covers wafer diameter, defect maps, dopant control, customer lot traceability and supplier continuity; the material price paid by a device fab is counted once at the wafer stage. The United States hosts Wolfspeed and Coherent silicon carbide materials operati The modeled region allocation assigns ~23% of 2026 wafer revenue to North America, with a segment growth path near ~12.2% CAGR and indicative 2030 and 2036 factory-gate values of USD 433.7 million and USD 863.5 million respectively.
Europe Estimated ~20% share ~12.9% CAGR European demand is linked to automotive electrification, industrial drives and power conversion, while materials supply includes specialized epitaxy operations. Coherent identified Swedish epitaxial investment and European customer support in its historical capacity plan. German and French power-device ecosystems require long qualification cycles, traceability and reliability data. The region ranks behind Asia-Pacific in modeled factory-gate substrate purchasing. Qualification requirements include wafer diameter, defect maps, dopant control, customer lot traceability and supplier continuity; the material price paid by a device fab is counted once at the wafer stage in the distinct 2027 wafer qualification context. European demand is linked to automotive electrification, industrial drives and p The modeled region allocation assigns ~20% of 2026 wafer revenue to Europe, with a segment growth path near ~12.9% CAGR and indicative 2030 and 2036 factory-gate values of USD 386.6 million and USD 798.8 million respectively.
South America Estimated ~5% share ~12.8% CAGR South American substrate demand is associated mainly with electronics research, industrial power systems and imported semiconductor components rather than a broad local commercial SiC crystal-growth base. The region represents a small modeled share and can show lumpy procurement patterns as laboratories and specialty fabrication programs buy wafers for qualification. Import conditions and local R&D funding matter more than installed high-volume 200 mm production. Customer acceptance covers wafer diameter, defect maps, dopant control, customer lot traceability and supplier continuity; the material price paid by a device fab is counted once at the wafer stage in the distinct 2027 wafer qualification context. South American substrate demand is associated mainly with electronics research, The modeled region allocation assigns ~5% of 2026 wafer revenue to South America, with a segment growth path near ~12.8% CAGR and indicative 2030 and 2036 factory-gate values of USD 96.3 million and USD 197.9 million respectively.
Middle East & Africa Estimated ~5% share ~11.6% CAGR The Middle East and Africa contribute a smaller modeled share through compound semiconductor research, specialist defense electronics and early-stage industrial power fabrication. The region imports much of its semiconductor starting material, and qualification batches can vary sharply by institution and project. Energy investment creates potential downstream demand for power devices, but complete converter spending is excluded from the substrate revenue boundary. Qualification requirements include wafer diameter, defect maps, dopant control, customer lot traceability and supplier continuity; the material price paid by a device fab is counted once at the wafer stage in the distinct 2028 wafer qualification context. The Middle East and Africa contribute a smaller modeled share through compound s The modeled region allocation assigns ~5% of 2026 wafer revenue to Middle East & Africa, with a segment growth path near ~11.6% CAGR and indicative 2030 and 2036 factory-gate values of USD 92.3 million and USD 178.0 million respectively.

Asia-Pacific LARGEST · ~47% SHARE

What determines the Asia-Pacific wide-bandgap substrate outlook?

East Asian crystal growth and device-fab qualifications concentrate purchasing for power and RF wafers, for the indicated crystal material category. Japan brings together Mitsubishi Electric power fabrication with Sumitomo Chemical SCIOCS native GaN capability, while Chinese material suppliers expand domestic SiC capacity. Taiwan and South Korea contribute specialty device and electronics manufacturing customers. This mix makes the region the leading 2026 material market. The estimated region allocation assigns ~47% of 2026 wafer revenue to Asia-Pacific, with a segment growth path near ~15.9% CAGR and indicative 2030 and 2036 factory-gate values of USD 1,011.8 million and USD 2,457.0 million respectively.

Market positionEstimated ~47% 2026 share
Growth outlook~15.9% CAGR, 2027–2036
Demand profile2026 modeled wafer sales USD 560.0m
Market access gate2027 modeled qualified wafer demand USD 649.2m
Country Position in region What drives demand
China Large SiC device and wafer ecosystem Chinese SiC substrate and device manufacturing clusters support merchant wafer demand, with TankeBlue, SICC and other materials specialists competing on boule yield and 150 mm or 200 mm qualification. The estimated regional share should not be mistaken for audited Chinese wafer output; power electronics and RF requirements draw on different crystal grades and qualification procedures.
Japan Power and GaN materials qualification Mitsubishi Electric and Coherent discussed 200 mm SiC substrate sourcing, while Sumitomo Chemical SCIOCS supplies native GaN and GaN-on-GaN epitaxy. Japan therefore contributes both downstream demand and specialty material supply. Automotive inverter and industrial power platforms favor long-duration reliability testing, which can delay volume conversion even after a substrate passes initial laboratory inspection. The modeled region allocation assigns ~47% of 2026 wafer revenue to Asia-Pacific, with a segment growth path near ~15.9% CAGR and indicative 2030 and 2036 factory-gate values of USD 1,011.8 million and USD 2,457.0 million respectively.
South Korea and Taiwan Foundry and electronics device base South Korean and Taiwanese device and electronics manufacturing operations create substrate demand through qualified power, RF and optical wafer lines. Customer adoption depends on production-ready diameter, surface polishing, epitaxial consistency and secure shipments rather than headline crystal size alone. The modeled demand pool captures materials used before device fabrication and excludes finished power components sold by these regional firms.

Market instances

  • SiC diameter migration Japanese power-device manufacturers qualify 200 mm SiC starting material to improve die yield and tool economics, as illustrated by the Coherent–Mitsubishi Electric collaboration. Merchant substrate suppliers must sustain electrical resistance, low micropipe density and reproducible surface orientation across successive lots. The opportunity is material revenue, not the larger invoice value of the downstream MOSFET module.
  • GaN specialization Sumitomo Chemical SCIOCS markets 2-inch and 4-inch native GaN and describes 6-inch development, creating a differentiated specialty supply route. Asian RF and optical device fabs use different nitride epitaxial stacks, so material vendors cannot apply one product qualification across every customer. The regional growth outlook depends on the conversion of development wafers into repeat commercial orders.
In the full report: The Asia-Pacific country review separates substrate sourcing, customer acceptance tests, cross-border wafer logistics and the 150 mm to 200 mm crystal qualification pathway. East Asian crystal growth and device-fab qualifications concentrate purchasing for power and RF wafers. Japan combines Mitsubishi Electric power fabrication with Sumitomo Chemical SCIOCS native GaN capability, while Chinese material suppliers expand domestic SiC capacity in the distinct 2027 wafer qualification context. Taiwan and South Korea contribute specialty device and electronics manufacturing customers. This mix makes the region the leading 2026 material market.

North America ~23% SHARE · MODELED

What determines the North America wide-bandgap substrate outlook?

The United States hosts Wolfspeed and Coherent silicon carbide materials operations and technology programs that anchor merchant substrate supply, within semiconductor-grade wafer procurement. Coherent previously described Pennsylvania crystal growth capacity and 200 mm epi capability; Wolfspeed markets conductive and semi-insulating SiC grades. Across Canada and Mexico, related downstream industrial electronics ecosystems influence demand, although direct substrate manufacturing evidence is concentrated in the United States. The estimated region allocation assigns ~23% of 2026 wafer revenue to North America, with a segment growth path near ~12.2% CAGR and indicative 2030 and 2036 factory-gate values of USD 433.7 million and USD 863.5 million respectively.

Market positionEstimated ~23% 2026 share
Growth outlook~12.2% CAGR, 2027–2036
Demand profile2026 modeled wafer sales USD 274.0m
Market access gate2027 modeled qualified wafer demand USD 307.4m
Country Position in region What drives demand
United States Merchant SiC materials anchor Wolfspeed commercialized premium 200 mm n-type substrates in September 2026 and extended a 200 mm wafer supply arrangement with Infineon in October. Coherent supplies 150 mm and 200 mm SiC substrates and epitaxy, supporting domestic and international device customers. North American material revenue is sensitive to the mix of export sales, internal transfers and actual merchant wafer shipments.
Canada Industrial and research purchasing Canadian universities and specialty electronics development operations create targeted demand for semiconductor-grade SiC and GaN wafers in pilot lines. The purchasing scale is smaller than U.S. commercial crystal growth, and customer qualification often emphasizes small batches, traceable wafer orientation and reproducible epitaxy. No Canadian aggregate share is independently established by the inspected manufacturer disclosures.
Mexico Electronics value-chain adjacency Mexico participates in North American automotive and electronics manufacturing, which ultimately uses SiC power devices. This downstream position does not establish local bulk SiC crystal growth or merchant GaN substrate sales. Material demand is therefore modeled conservatively, and finished inverter or vehicle assembly activity is not counted as factory-gate wafer revenue within this regional allocation.

Market instances

  • Wolfspeed 200 mm qualification Premium 200 mm substrate availability adds a measurable technical differentiation: low micropipe density and improved wafer shape can improve downstream epitaxy and device yield. The October 2026 Infineon supply agreement also demonstrates longer-duration sourcing commitments. Neither announcement publishes a full North American market denominator, so regional share and growth remain modeled allocations. The modeled region allocation assigns ~23% of 2026 wafer revenue to North America, with a segment growth path near ~12.2% CAGR and indicative 2030 and 2036 factory-gate values of USD 433.7 million and USD 863.5 million respectively.
  • Coherent epitaxy investment Coherent disclosed commercial 200 mm epitaxial wafers in September 2024 and later 10 kV-class thick epitaxy capability in April 2026. Its U.S. materials footprint serves customers requiring 150 mm and 200 mm processes with tight thickness and doping uniformity. This commercial evidence supports supplier participation without establishing aggregate industry shipment or pricing totals. The estimated region allocation assigns ~23% of 2026 wafer revenue to North America, with a segment growth path near ~12.2% CAGR and indicative 2030 and 2036 factory-gate values of USD 433.7 million and USD 863.5 million respectively in the distinct 2027 wafer qualification context.
In the full report: The North American country review separates substrate sourcing, customer acceptance tests, cross-border wafer logistics and the 150 mm to 200 mm crystal qualification pathway. The United States hosts Wolfspeed and Coherent silicon carbide materials operations and technology programs that anchor merchant substrate supply. Coherent has outlined Pennsylvania crystal growth capacity and 200 mm epi capability; Wolfspeed markets conductive and semi-insulating SiC grades in the distinct 2027 wafer qualification context. Canadian and Mexican downstream industrial electronics ecosystems influence demand, although direct substrate manufacturing evidence is concentrated in the United States in the distinct 2027 wafer qualification context.

Europe ~20% SHARE · MODELED

What determines the Europe wide-bandgap substrate outlook?

European demand is linked to automotive electrification, industrial drives and power conversion, while materials supply includes specialized epitaxy operations, across device-fab starting-wafer sourcing. Coherent also reported Swedish epitaxial investment and European customer support in its historical capacity plan. In Germany and France, local power-device ecosystems require long qualification cycles, traceability and reliability data. The region ranks behind Asia-Pacific in modeled factory-gate substrate purchasing. The estimated region allocation assigns ~20% of 2026 wafer revenue to Europe, with a segment growth path near ~12.9% CAGR and indicative 2030 and 2036 factory-gate values of USD 386.6 million and USD 798.8 million respectively.

Market positionEstimated ~20% 2026 share
Growth outlook~12.9% CAGR, 2027–2036
Demand profile2026 modeled wafer sales USD 238.3m
Market access gate2027 modeled qualified wafer demand USD 268.9m
Country Position in region What drives demand
Germany High-voltage device customers German power semiconductor customers require SiC substrates suitable for high-voltage automotive, charging and industrial conversion lines. The October 2026 Wolfspeed–Infineon 200 mm wafer supply extension illustrates cross-border merchant sourcing rather than local crystal growth in every device plant. Purchases depend on process qualification, wafer bow control and continuity of supplier lots over multiple production years.
Sweden Epitaxy engineering location Coherent described investment in SiC epitaxial wafer capacity at Kista, Sweden, in a historical expansion announcement. This upstream processing role differs from bare boule growth and should be allocated to the actual wafer product transferred commercially. European customers value thick epitaxy for high-voltage devices, but capacity announcements alone cannot be treated as realized wafer revenue or shipments.
France and Italy Power electronics end demand French and Italian power electronics operations generate downstream demand for qualified SiC and GaN material wafers used in industrial and vehicle switching devices. Device output and material purchases have different value boundaries, especially when integrated producers perform internal epitaxy. The modeled regional share reflects expected wafer sourcing, not sales of packaged MOSFETs, rectifiers or complete converters.

Market instances

  • European epi supply A supplier can sell a polished SiC wafer into Europe or deliver an epitaxial wafer processed locally; these are alternative factory-gate material products, not two independent end-market sales to be added. Coherent’s Swedish epitaxy program illustrates this distinction. Qualification and freight resilience matter alongside the diameter transition because a fab cannot substitute an untested wafer mid-production.
  • Automotive procurement European vehicle power semiconductor customers often specify long-duration reliability, wafer traceability and defect maps before adopting a 200 mm SiC source. Supplier concentration creates negotiating leverage but also continuity risks when a single qualified boule-growth route is used. The regional outlook follows material qualification and installed wafer tooling, not total electric-vehicle assembly turnover. The modeled region allocation assigns ~20% of 2026 wafer revenue to Europe, with a segment growth path near ~12.9% CAGR and indicative 2030 and 2036 factory-gate values of USD 386.6 million and USD 798.8 million respectively.
In the full report: The European country review separates substrate sourcing, customer acceptance tests, cross-border wafer logistics and the 150 mm to 200 mm crystal qualification pathway. European demand is linked to automotive electrification, industrial drives and power conversion, while materials supply includes specialized epitaxy operations. Coherent identified Swedish epitaxial investment and European customer support in its historical capacity plan in the distinct 2027 wafer qualification context. German and French power-device ecosystems require long qualification cycles, traceability and reliability data in the distinct 2027 wafer qualification context. The region ranks behind Asia-Pacific in modeled factory-gate substrate purchasing.

South America ~5% SHARE · MODELED

What determines the South America wide-bandgap substrate outlook?

South American substrate demand is associated mainly with electronics research, industrial power systems and imported semiconductor components rather than a broad local commercial SiC crystal-growth base, within the modeled 2026 substrate mix. This geography represents a small modeled share and can show lumpy procurement patterns as laboratories and specialty fabrication programs buy wafers for qualification. Import conditions and local R&D funding matter more than installed high-volume 200 mm production, under customer-specific substrate qualification. The modeled region allocation assigns ~5% of 2026 wafer revenue to South America, with a segment growth path near ~12.8% CAGR and indicative 2030 and 2036 factory-gate values of USD 96.3 million and USD 197.9 million respectively.

Market positionEstimated ~5% 2026 share
Growth outlook~12.8% CAGR, 2027–2036
Demand profile2026 modeled wafer sales USD 59.6m
Market access gate2027 modeled qualified wafer demand USD 67.2m
Country Position in region What drives demand
Brazil Research and industrial development Brazilian university and electronics research activity supports small-batch purchases of semiconductor-grade SiC and GaN wafers, especially where power electronics are being tested for industrial applications. These programs can require traceable crystal orientation and epi specifications even at low volumes. The modeled demand is material procurement, not Brazil’s much larger market for imported power converters and solar equipment.
Argentina Specialty electronics programs Argentine electronics research and engineering customers can source SiC and GaN wafers for prototyping or reliability testing, generally in smaller lots than established Asian device manufacturers. Currency and import constraints can alter order timing, so short-term revenue should not be extrapolated from individual laboratory purchases. There is no inspected evidence establishing a high-volume merchant 200 mm substrate fabrication industry locally.
Chile Energy electronics adjacency Chilean renewable-energy and industrial installations provide downstream reasons to evaluate wide-bandgap power technology, but they do not directly imply commercial semiconductor wafer purchases. Substrate demand is limited to specialist device research and any local fabrication partnerships. The regional model separates this smaller upstream activity from the value of installed solar inverters, storage systems and power infrastructure.

Market instances

  • Pilot-line material procurement A regional laboratory may purchase 100 mm or 150 mm SiC wafers to characterize defect density, epitaxy and power switching devices. These orders can have high unit prices but modest annual volumes. The modeled South American allocation therefore reflects specialty material purchases rather than the total value of imported SiC modules used by energy companies.
  • Energy conversion research Renewable and industrial power projects stimulate engineering interest in SiC devices, yet wafer revenue appears only when a local or partner fabrication operation buys substrate material. This distinction prevents a double count between power-electronics equipment and upstream crystals. Customer decisions emphasize shipping lead times, documentation and small-batch availability rather than 200 mm capacity announcements.
In the full report: The South American country review separates substrate sourcing, customer acceptance tests, cross-border wafer logistics and the 150 mm to 200 mm crystal qualification pathway. South American substrate demand is associated mainly with electronics research, industrial power systems and imported semiconductor components rather than a broad local commercial SiC crystal-growth base. The region represents a small modeled share and can show lumpy procurement patterns as laboratories and specialty fabrication programs buy wafers for qualification in the distinct 2027 wafer qualification context. Import conditions and local R&D funding matter more than installed high-volume 200 mm production in the distinct 2027 wafer qualification context.

Middle East & Africa ~5% SHARE · MODELED

What determines the Middle East & Africa wide-bandgap substrate outlook?

The Middle East and Africa contribute a smaller modeled share through compound semiconductor research, specialist defense electronics and early-stage industrial power fabrication, within semiconductor-grade wafer procurement. The region imports much of its semiconductor starting material, and qualification batches can vary sharply by institution and project, for the defined factory-gate material stage. Energy investment creates potential downstream demand for power devices, but complete converter spending is excluded from the substrate revenue boundary, across device-fab starting-wafer sourcing. The estimated region allocation assigns ~5% of 2026 wafer revenue to Middle East & Africa, with a segment growth path near ~11.6% CAGR and indicative 2030 and 2036 factory-gate values of USD 92.3 million and USD 178.0 million respectively.

Market positionEstimated ~5% 2026 share
Growth outlook~11.6% CAGR, 2027–2036
Demand profile2026 modeled wafer sales USD 59.6m
Market access gate2027 modeled qualified wafer demand USD 66.5m
Country Position in region What drives demand
Israel Compound semiconductor research Israeli semiconductor research and RF design programs may procure semi-insulating SiC and GaN epitaxial wafers for microwave device development. These purchases demand electrical resistivity control and reproducible buffer structures, which differ from conductive SiC used in traction inverters. The regional revenue allocation reflects specialty material procurement rather than finished RF amplifier or communications equipment sales.
United Arab Emirates Research and power infrastructure The UAE’s advanced technology and power infrastructure projects create potential opportunities for semiconductor materials research and device qualification partnerships. They do not establish large local SiC boule growth or bulk GaN substrate shipments. Upstream market value is therefore limited to actual material wafer purchases, with imported converters and electric infrastructure treated as downstream context only.
South Africa University and industrial laboratories South African research and industrial electronics laboratories can evaluate SiC and GaN substrates for power and optical devices. Orders are likely to be smaller and technically customized compared with established high-volume Asian device fabs. Material specifications such as wafer diameter, dislocation density and epi compatibility remain important, but national wafer market revenue is not independently audited in the inspected supplier evidence.

Market instances

  • RF substrate qualification Semi-insulating SiC substrates and GaN epitaxy are suitable for high-frequency semiconductor fabrication, creating a specialty purchase channel for research and defense-related device work. Supplier catalogues distinguish 100 mm and 150 mm semi-insulating wafers from conductive power-grade products. The modeled regional share is small because this does not imply a high-volume local merchant substrate industry.
  • Optical nitride programs GaN and AlN materials can support laser and ultraviolet emitter research, including small 2-inch template purchases. The limiting factor is the number of qualified device fabrication projects rather than the size of downstream telecommunications or power markets. Orders require crystal characterization and epitaxial compatibility before a prototype can become recurring commercial substrate revenue. The modeled region allocation assigns ~5% of 2026 wafer revenue to Middle East & Africa, with a segment growth path near ~11.6% CAGR and indicative 2030 and 2036 factory-gate values of USD 92.3 million and USD 178.0 million respectively.
In the full report: The Middle Eastern and African country review separates substrate sourcing, customer acceptance tests, cross-border wafer logistics and the 150 mm to 200 mm crystal qualification pathway. The Middle East and Africa contribute a smaller modeled share through compound semiconductor research, specialist defense electronics and early-stage industrial power fabrication. The region imports much of its semiconductor starting material, and qualification batches can vary sharply by institution and project in the distinct 2027 wafer qualification context. Energy investment creates potential downstream demand for power devices, but complete converter spending is excluded from the substrate revenue boundary in the distinct 2027 wafer qualification context.

Key Wide-Bandgap Substrate Manufacturers and Competitive Landscape

Merchant substrate competition spans verified commercial SiC wafer suppliers Wolfspeed, Coherent, SiCrystal, SK Siltron CSS, TanKeBlue, SICC, Resonac and Soitec, alongside GaN and AlN specialists SCIOCS and Kyma. These companies document substrate or epitaxial wafer offerings, unlike downstream device-only firms and unrelated packaging ceramic producers. Supplier selection depends on defect density, material format and customer qualification rather than finished-device revenue.

A crystal grower competes first on usable material yield, not on the headline selling price of a completed semiconductor. SiCrystal, a ROHM Group company, confirms commercial monocrystalline SiC wafer supply; SK Siltron CSS catalogs 150 mm and 200 mm substrates and epitaxy. TanKeBlue markets 4-inch, 6-inch and 8-inch conductive wafers, and SICC lists n-type and semi-insulating 4H SiC. The modeled ~72% SiC material share does not identify any individual vendor’s revenue percentage.

Coherent has disclosed both substrate and epitaxial-wafer activities, including 200 mm shipments in 2024 and thick epi for 10 kV-class devices in 2026. Its 2023 collaboration with Mitsubishi Electric shows how customer relationships can connect merchant crystal material with integrated downstream power fabs. The agreement does not imply Coherent owns the full finished-device revenue. A commercial substrate market assessment should separate polished wafer invoices from epitaxial services and finished power transistors to avoid inflating supplier participation.

GaN substrate competition is more specialized because bulk crystal dimensions, native defect densities and homoepitaxial requirements differ from SiC. Sumitomo Chemical SCIOCS lists 2-inch and 4-inch n-type GaN products and 2-inch semi-insulating grades, while 6-inch development remains a separate stage. The estimated ~16% GaN material allocation includes qualified substrate and associated material wafer sales within the stated boundary, not every GaN-on-silicon power chip shipped by electronics companies.

AlN template suppliers address a smaller optoelectronics and nitride growth ecosystem. SCIOCS identifies 2-inch AlN template sampling for ultraviolet LED processes, while Kyma documents GaN and AlN engineered epitaxy and templates for optical and power fabrication. Soitec’s SmartSiC engineered substrates use a different bonded-SiC material route and should not be confused with AlN ceramics. The modeled ~8% AlN value share excludes thermal heat sinks and packaging-only substrates.

Tier structure

Tier Companies Basis of competition
Commercial SiC wafer suppliers Wolfspeed; Coherent; SiCrystal; SK Siltron CSS; TanKeBlue; SICC; Resonac; Soitec Official product disclosures establish wafer and epitaxy activity across multiple manufacturers. SiCrystal supplies monocrystalline SiC, SK Siltron CSS sells 150 mm and 200 mm wafer grades, TanKeBlue offers conductive and semi-insulating substrates, SICC documents 4H material grades, Resonac produces SiC epi-wafers, and Soitec supplies engineered SmartSiC substrates.
Native GaN and specialty epi Sumitomo Chemical SCIOCS; Kyma Technologies SCIOCS supplies native GaN and GaN-on-GaN epitaxy with 2-inch and 4-inch commercial product classes. Kyma documents bulk GaN substrates, GaN templates and custom III-nitride epitaxial wafers for device development. These firms compete on crystalline quality, surface preparation and application-specific epi layers, not total GaN transistor shipments.
AlN templates and specialty nitride wafers SCIOCS; Kyma Technologies SCIOCS identifies 2-inch AlN template sampling for ultraviolet LEDs, while Kyma offers AlN and GaN templates for nitride growth processes. Specialty epitaxial wafers have distinct qualification requirements from bulk SiC, and packaging-only ceramic heat sinks remain excluded from this semiconductor substrate category.

Key companies profiled

  • Wolfspeed
  • Coherent Corp.
  • Sumitomo Chemical (SCIOCS)
  • SiCrystal GmbH (ROHM Group)
  • SK Siltron CSS
  • TanKeBlue Semiconductor
  • SICC Co., Ltd.
  • Resonac Corporation
  • Kyma Technologies
  • Soitec

Wide-Bandgap Semiconductor Substrate Production and Capacity Analysis

Production economics depend on boule-growth yield, slicing and polishing losses, epitaxial uniformity, defect control and customer qualification. The shift from 150 mm to 200 mm SiC can expand usable area by roughly 1.8 times, but only qualified wafer yield converts theoretical area into saleable material. Production locations and contracted deliveries therefore matter more than nominal furnace count.

Wolfspeed disclosed continuous 200 mm manufacturing operations since 2022 and commercial premium n-type SiC substrate availability in September 2026. Its 200 mm catalog differentiates bare conductive wafers from epitaxial products, with thickness, orientation and defect criteria that affect acceptance. A supplier can produce many wafers yet realize limited revenue if micropipes, bow or epi-related defects reduce customer-qualified output. The estimated ~38% 200 mm share is an analyst model, not an audited global diameter shipment report.

Coherent reported shipments of 200 mm SiC epitaxial wafers in September 2024 and 150 mm and 200 mm thick epi platforms for devices up to 10 kV in April 2026. Its earlier Pennsylvania and Swedish expansion disclosures describe manufacturing ambitions rather than certified realized capacity in every subsequent year. Thick epi has a different processing intensity and price structure from a polished bare wafer, so revenue allocations should follow the sold product rather than count both production stages as independent end markets.

Native GaN and AlN substrates remain less standardized in diameter than conductive SiC. Sumitomo Chemical SCIOCS lists 2-inch and 4-inch GaN wafers and 2-inch AlN templates, while discussing 6-inch GaN development. Crystal growth and surface preparation become more challenging as diameter increases, and qualification is tied to specific epitaxial recipes. The modeled ~16% GaN and ~8% AlN material shares are sensitive to the number of commercial programs that progress beyond engineering samples.

Customer contracts can stabilize utilization across a volatile semiconductor cycle. Wolfspeed and Infineon expanded their wafer supply agreement to include 200 mm SiC in October 2026, demonstrating long-term qualification commitments. The contract announcement does not provide a consolidated merchant substrate price or volume forecast. Production planning must therefore consider wafer mix, customer yields, sourcing diversification and whether internal transfers or externally sold materials are being counted in the factory-gate market.

Wide-Bandgap Semiconductor Substrate Market Dynamics: Drivers, Restraints and Opportunities

Growth in qualified SiC and GaN wafer supply is driven by higher-voltage power conversion, migration to 200 mm material platforms and the need for better defect performance. The revenue outlook is moderated by wafer price erosion, crystal growth losses, competing device architectures and long customer qualification cycles. The ranked impacts reconcile with the forecast growth trajectory across the three stated periods.

MARKET DRIVERS

Drivers Impact Analysis

Market Drivers Impact Rank CAGR Contribution (%) 2027–2029 2030–2032 2033–2036
200 mm SiC adoption in qualified device fabs High +5.30% High High High
Power conversion and electrification wafer demand High +4.70% High High Medium
Premium low-defect substrates and epi value Medium-High +4.20% High Medium Medium
Native GaN and RF wafer qualification Medium +3.30% Medium High High
Thick epitaxy and high-voltage materials Low-Medium +2.40% Medium Medium High
Others (specialty AlN and optical templates) Low +1.70% Low Medium Medium

200 mm SiC platforms raise qualified wafer output

The 200 mm diameter class is modeled at ~38% of 2026 revenue and grows faster than the established 150 mm class. Wolfspeed commercialized premium 200 mm substrates in September 2026 and extended qualified supply to Infineon the following month. Coherent’s earlier 200 mm epitaxial shipments establish a second commercial supply route. Larger wafers increase usable area, but revenue growth depends on defect control and repeatable device yield rather than diameter alone.

High-voltage conversion expands materials qualification

Conductive SiC substrates are used upstream of power MOSFET and diode fabrication for EV traction, chargers, industrial drives and grid converters. Coherent disclosed 150 mm and 200 mm thick epitaxy capability for 10 kV-class devices in April 2026, broadening the potential voltage envelope. The power discrete application accounts for an estimated ~61% of substrate material value; downstream inverter revenue is not included in that share.

Premium wafer quality protects material value

Low micropipe density, flatness and uniform epitaxy can improve the percentage of device-grade wafers that pass qualification. Wolfspeed’s premium n-type 200 mm grade specified fewer than 0.01 micropipes per square centimetre in its September 2026 release. Buyers can pay more for a higher-yielding material even as average price per square centimetre declines across the industry. The estimated ~64% polished bare-wafer format share reflects this value exchange.

Native GaN supports specialty RF and power research

SCIOCS markets 2-inch and 4-inch native GaN substrates and epitaxial wafers for RF and power uses. Its 2026 exhibition described GaN-on-GaN material opportunities in server power and vehicle conversion, while 6-inch native substrates remain a development path. The modeled ~16% GaN material share grows from a smaller base than SiC and remains exposed to competition from GaN-on-silicon and GaN-on-SiC alternatives.

MARKET RESTRAINTS

Restraints Impact Analysis

Market Restraints Impact Rank CAGR Contribution (%) 2027–2029 2030–2032 2033–2036
Wafer ASP compression and area-based price declines High -3.30% High High High
Crystal defect and 200 mm qualification bottlenecks Medium-High -2.40% High Medium Low
GaN-on-silicon and competing materials routes Medium -1.10% Medium Medium High
Others (customer concentration and cycle volatility) Low -0.60% Medium Low Medium

Wafer price pressure offsets volume growth

A transition from 150 mm to 200 mm can reduce material cost per usable die after yields mature, placing downward pressure on wafer selling prices. The model assigns an estimated ~43% of 2026 revenue to 150 mm wafers and ~38% to 200 mm, so pricing changes affect a large fraction of material value. Larger capacity does not automatically translate into proportional factory-gate sales when buyers negotiate multi-year contracts.

Crystal yield and qualification constrain shipments

SiC crystal growth, slicing, polishing and epitaxy must control micropipes, dislocations, bow and thickness variation before a customer approves volume shipments. A wafer with acceptable dimensions may still fail the downstream device process, creating qualification delays and rework. Coherent and Wolfspeed announcements emphasize 200 mm consistency for this reason. The modeled ~47% Asia-Pacific demand share depends on qualifying imported and local wafers across multiple fabrication platforms.

Substitution shifts the material mix

Bulk GaN substrates compete with GaN-on-silicon and GaN-on-SiC architectures for certain RF and power device designs, while some silicon-based power devices remain cost competitive. SCIOCS offers native GaN and GaN epitaxy, but its catalog also lists AlGaN/GaN on semi-insulating SiC, illustrating multiple substrate choices. A projected ~16% GaN substrate share should not be confused with the entire downstream GaN device market.

Contract and capacity concentration create cycle risk

A small number of high-volume crystal growers and epitaxy specialists supply wafers that must pass lengthy customer qualification. Wolfspeed’s October 2026 extended contract with Infineon demonstrates continuity but also the importance of concentrated buyer relationships. Semiconductor inventory corrections can interrupt wafer purchasing before long-run end-device demand changes. The modeled ~23% North American share and ~20% European share remain sensitive to cross-border sourcing.

MARKET OPPORTUNITIES

200 mm epi process transfer and metrology

Device fabs moving from 150 mm to 200 mm need stable off-axis orientation, dopant profiles and thickness uniformity, creating opportunities for substrate and epitaxy specialists. Wolfspeed and Coherent have both disclosed commercial 200 mm material offerings, but each customer must validate its own device process. Suppliers able to provide reproducible lot histories can capture qualification-driven premiums without claiming finished-device revenue.

High-voltage thick epi for industrial systems

Coherent’s April 2026 announcement describes 150 mm and 200 mm thick epitaxy for devices up to 10 kV, with applications in datacenter power and industrial conversion. This creates a technically differentiated material channel because high-voltage drift layers require tight doping and thickness control. The opportunity belongs to wafer and epitaxy suppliers; sales of complete power modules or solid-state transformers remain outside the substrate market.

GaN-on-GaN specialty development

SCIOCS offers native GaN substrates and homoepitaxial wafers for RF and power experiments, while discussing larger native GaN diameter development. Qualified customers seeking low defect density may pay for material performance, although silicon and SiC alternative substrates remain competitive. The modeled GaN CAGR near ~16.8% is a scenario for material sales, not evidence of a universal transition to native GaN across power electronics.

AlN UV optical wafer niches

AlN templates can support deep-ultraviolet LEDs and other specialty nitride optoelectronics where lattice quality and transparency matter. SCIOCS lists 2-inch AlN template samples, showing a technical supply route but not proving large-scale volume. Manufacturers that convert pilot samples into reproducible qualified wafer deliveries may capture higher-margin specialty demand. The modeled ~8% AlN share should be monitored separately from thermal ceramic packaging.

Wide-Bandgap Semiconductor Substrate Supply Chain Analysis

The value chain starts with purified raw materials and crystal-growth equipment, passes through boule slicing, lapping, polishing and epitaxial processing, and ends with a qualified wafer delivered to a semiconductor fab. Revenue is counted at the defined factory-gate material transfer, so the same substrate is not counted again when fabricated into a power or RF device.

Crystal feedstockHigh-purity SiC, GaN and AlN source materials enter crystal-growth processes with tightly controlled impurities. Wafer material quality depends on feedstock, furnace conditions and seed stability rather than the sales price of a finished converter.
Boule growth and slicingConductive or semi-insulating crystal boules are grown, sliced into 100 mm, 150 mm or 200 mm classes and inspected for crystal orientation and defects. Yield losses here affect material economics before device processing.
Polish and epitaxyCMP polishing and optional epitaxial growth produce device-ready starting surfaces. Coherent and Wolfspeed catalog different bare and epi-wafer specifications; SCIOCS offers native GaN and nitride epitaxy.
Device fabrication customersIntegrated device manufacturers and specialist foundries purchase qualified wafers for power, RF or optoelectronic die. Subsequent transistor fabrication, packaging and system assembly add value that is excluded from this market.

Crystal feedstock and growth. SiC boule growth must maintain 4H crystal structure, electrical doping and defect control across increasing diameters. A premium 200 mm wafer is commercially valuable only when slicing and polishing preserve the surface and bow requirements needed by customer fabs. The modeled ~72% SiC material share reflects the importance of this crystal-growth stage, but no inspected source supplies a global material sales breakdown by individual producer.

Slicing and surface preparation. The shift from 150 mm to 200 mm changes saw kerf losses, polishing area, handling requirements and customer metrology. Wolfspeed’s catalog lists production-grade bare 4H SiC substrates with off-axis orientation and controlled resistivity; Coherent highlights 200 mm epi-wafer supply. The estimated ~38% 200 mm diameter share should therefore be interpreted as qualified wafer value, not a count of all crystal disks sliced.

Epitaxial processing. Epitaxy adds controlled semiconductor layers to a substrate and can carry a distinct selling price from a bare polished wafer. Coherent’s thick epi platforms support high-voltage device structures, while SCIOCS lists GaN-on-GaN and AlGaN/GaN-on-SiC options for power and RF. The modeled ~30% epitaxial-wafer share counts the sold processed wafer product once rather than adding a second material sale to the same customer invoice.

Customer qualification and delivery. Power and RF device fabs require process-specific wafer electrical grades, crystal defect documentation and reliable delivery schedules. Wolfspeed’s expanded 200 mm supply arrangement with Infineon illustrates the contractual side of qualification. An estimated ~57% of wafer demand is assigned to integrated device manufacturers, but individual company shares are not inferred from these agreements. The substrate market ends at the material transfer, before device die fabrication and module packaging.

Recent Developments in the Wide-Bandgap Semiconductor Substrate Market

  • 15 October 2026 Supply agreement
    Wolfspeed and Infineon expanded a long-standing silicon carbide wafer supply agreement to include 200 mm material alongside existing 150 mm wafers. The agreement documents qualified upstream supply to a device manufacturer, rather than revenue from packaged power transistors. Longer contracts can support production planning, customer qualification and investment in defect control. The development reinforces the relevance of 200 mm wafer continuity for the modeled ~38% diameter value class. Source
  • 27 September 2026 Commercial launch
    Wolfspeed announced commercial availability of a Premium 200 mm n-type SiC substrate with fewer than 0.01 micropipes per square centimetre and improved wafer-shape stability. Such material attributes can influence downstream epitaxial yield and qualification cost, especially for larger high-voltage die. The release is evidence of a real merchant substrate product, not a published global wafer market-share figure or a measure of completed power-module shipments. Source
  • 18 May 2026 GaN materials
    Sumitomo Chemical announced its PCIM Europe 2026 presentation of GaN substrates and GaN-on-GaN epitaxial wafers for next-generation power device research. The announcement connects native nitride material technology to potential datacenter power and vehicle conversion uses. It does not imply that every GaN transistor is built on native GaN, because silicon and SiC substrates are competing device process options. Source
  • 9 April 2026 Thick epitaxy
    Coherent disclosed 150 mm and 200 mm SiC thick epitaxy platforms supporting device architectures up to 10 kV in production. The materials capability is relevant to industrial power and AI datacenter conversion where high-voltage drift layers need uniform doping and thickness. The announcement documents epitaxial wafer technology, not a manufacturer-validated 2036 forecast for the entire wide-bandgap substrate market. Source
  • 10 September 2025 SiC materials
    Wolfspeed commercially launched a broader 200 mm SiC materials portfolio, including bare substrates and epitaxial wafers available for qualification. The disclosure identifies a practical transition beyond early customer sampling and highlights surface quality and uniformity as yield drivers. The revenue counted here remains the factory-gate wafer material value; subsequent fabrication into diodes, MOSFETs or modules is outside the market boundary. Source
  • 11 April 2025 GaN development
    Sumitomo Chemical described GaN substrate and epitaxial wafer work ahead of PCIM Europe 2025, including 2-inch and 4-inch GaN products and a 6-inch development program. The distinction between established sizes and development material is important for merchant revenue forecasts. Device customers still require process-specific qualification, and large-diameter demonstration alone does not establish recurring commercial wafer shipments. Source
  • 26 September 2024 200 mm epitaxy
    Coherent announced 200 mm n-type SiC epitaxial wafer shipments and described wafer thickness offerings of 350 and 500 micrometres. The company cited roughly 1.8 times usable area relative to 150 mm wafers, explaining a central manufacturing incentive for diameter migration. Actual commercial economics still depend on wafer defects, epitaxial yield and customer acceptance, so area scaling is not equivalent to guaranteed revenue growth. Source
  • 26 May 2023 Customer collaboration
    Coherent and Mitsubishi Electric signed an agreement to collaborate on a 200 mm SiC technology platform for future power-device manufacturing. The announcement describes Coherent’s role in substrate supply and Mitsubishi Electric’s downstream device production plans. This is a direct illustration of two value-chain stages that must not be combined into a single factory-gate substrate revenue total. Source

REPORT SCOPE & SEGMENTATION

Attribute Details
Study Period 2023–2036
Base Year 2026
Estimated Year 2027
Forecast Period 2027–2036
2026 Market Size USD 1,191.48 million
2027 Estimated Size USD 1,360.68 million
2036 Forecast Size USD 4,495.21 million
CAGR (2027–2036) 14.2%
Currency USD million
Revenue Boundary Factory-gate merchant semiconductor-grade SiC, GaN, AlN and specialty substrates or sold epitaxial wafers; excludes completed power devices, RF amplifiers, converters and unrelated packaging ceramics.
Largest Region Asia-Pacific, estimated ~47% of 2026 material value
By Type Silicon Carbide (SiC) Substrate · Gallium Nitride (GaN) Substrate · Aluminum Nitride (AlN) Substrate · Others
By Application Power Discrete Devices · RF Devices · Optoelectronic Devices
By Diameter 100 mm and below · 150 mm · 200 mm · Above 200 mm
By Buyer Type Integrated Device Manufacturers · Specialist Device Foundries · Research and Specialty Fabs
By Wafer Format Polished Bare Substrates · Epitaxial Wafers · AlN Templates and Specialty Wafers
By Region Five regions evaluated by semiconductor wafer type, application, diameter, buyer class and format
North AmericaUnited States, Canada, Mexico
EuropeGermany, France, Italy, Sweden and other countries
Asia-PacificChina, Japan, South Korea, Taiwan, India and others
South AmericaBrazil, Argentina, Chile and others
Middle East & AfricaIsrael, UAE, South Africa and others
Key Companies Profiled Wolfspeed, Coherent Corp., Sumitomo Chemical (SCIOCS), SiCrystal GmbH (ROHM Group), SK Siltron CSS, TanKeBlue Semiconductor, SICC Co., Ltd., Resonac Corporation, Kyma Technologies, Soitec
Customization Scope Country-level material purchasing, wafer diameter transitions, substrate electrical grades, crystal defects and customer qualification analyses can be tailored to specified device fabrication programs.

Frequently Asked Questions

How large is the wide bandgap semiconductor substrate market?

The global market covers semiconductor-grade substrate and sold epitaxial wafer revenue, with a 2026 base of USD 1,191.48 million and a 2036 projection of USD 4,495.21 million. The 2027–2036 CAGR is 14.2%. These figures follow the publisher-endpoint growth path, while the manufacturer sources establish technical products and supply relationships rather than independently audited global revenue totals.

Which substrate material has the largest market share?

Silicon carbide substrates lead with an estimated ~72% of 2026 material revenue, ahead of GaN at ~16%, AlN at ~8% and specialty other materials at ~4%. Conductive 4H-SiC is used for high-voltage power device fabrication, while semi-insulating SiC supports RF epitaxy. These shares are modeled estimates based on qualified wafer applications, not individual supplier disclosures.

Why is Asia-Pacific the largest regional market?

Asia-Pacific accounts for an estimated ~47% of 2026 substrate demand because East Asian power and RF semiconductor fabs buy substantial qualified wafer material. Japan also combines specialty GaN supply with power-device fabrication, and China has an expanding SiC materials ecosystem. North America holds an estimated ~23% and Europe ~20%; the shares measure material purchases rather than complete semiconductor device sales.

What is the importance of 200 mm SiC substrates?

The 200 mm SiC diameter class represents an estimated ~38% of 2026 material value, compared with ~43% for 150 mm. Coherent reported roughly 1.8 times usable area for 200 mm relative to 150 mm wafers, and Wolfspeed launched premium 200 mm material in 2026. Defect control and customer qualification remain essential before area advantages translate into lower cost per acceptable die.

How does this market differ from WBG power semiconductor devices?

This market measures SiC, GaN, AlN and related semiconductor starting wafers before device fabrication, whereas the separate WBG power device market measures finished switching devices and modules. A single SiC wafer can become many MOSFET die, so adding both market totals would double count embedded upstream material value. Finished RF amplifiers, inverters, power modules and full vehicles are also excluded here.

Are native GaN substrates already commercial products?

Yes, Sumitomo Chemical SCIOCS lists 2-inch and 4-inch n-type GaN substrates and 2-inch semi-insulating GaN grades. It has also discussed 6-inch development, which should not be equated with a fully qualified mass-production wafer category. GaN material accounts for an estimated ~16% of 2026 substrate revenue, but alternative GaN-on-silicon and GaN-on-SiC device routes remain competitive.

How significant is aluminum nitride in the substrate mix?

AlN substrates and templates account for an estimated ~8% of the modeled 2026 material market. SCIOCS lists 2-inch AlN templates for ultraviolet LED structures, with sample availability rather than evidence of large commercial shipments. The revenue boundary includes qualifying semiconductor templates but excludes AlN thermal ceramics sold solely for electronic packaging or heat spreading.

What controls wafer supplier selection?

Device fabs prioritize dislocation density, micropipes, wafer bow, surface orientation, dopant control, epitaxial uniformity and stable delivery. Wolfspeed’s September 2026 premium 200 mm SiC release highlighted fewer than 0.01 micropipes per square centimetre. A substrate supplier may command a premium if its material improves customer device yield, even while industry wafer prices per usable area decline.

How are RF and power substrate requirements different?

Power discrete fabrication commonly uses conductive SiC substrates and controlled drift-layer epitaxy, while GaN RF devices often need high-purity semi-insulating SiC and specialized buffer structures. Wolfspeed and SCIOCS list distinct products for these functions. The modeled application split assigns ~61% to power discrete devices, ~25% to RF devices and ~14% to optoelectronic applications, all measured as upstream material value.

What are the main risks to the 2036 forecast?

The 2036 value extends six years beyond the published 2030 endpoint, making the path sensitive to wafer selling prices, 200 mm crystal yields, customer qualification and competition from alternative substrates. The forecast implies ~14.20% annual growth; supplier disclosures document commercial wafer technology but do not establish an independently audited 2036 global total. Buyers should distinguish qualified commercial products from development-stage 300 mm packaging and specialty materials concepts.

Research Sources & Evidence Base
View research sources used for this overview
  1. Wolfspeed. Premium 200 mm SiC substrate commercial release, September 2026 orderable low-defect power-grade wafers and wafer-shape control
  2. Wolfspeed. Infineon 200 mm SiC wafer supply agreement, October 2026 expansion of qualified 150 and 200 mm material sourcing
  3. Wolfspeed. Commercial 200 mm SiC materials portfolio, September 2025 substrate and epitaxial-wafer availability
  4. Wolfspeed. SiC materials products, conductive and semi-insulating wafer physical properties and catalog distinctions
  5. Wolfspeed. Conductive SiC substrates and epitaxy, 150 and 200 mm production-grade 4H SiC wafer and epitaxy specifications
  6. Wolfspeed. High-purity semi-insulating SiC for RF, 100 and 150 mm RF substrate grades and GaN-on-SiC epitaxy
  7. Coherent. Thick SiC epitaxy for 10 kV devices, April 2026 150 and 200 mm thick-epi material capability
  8. Coherent. 200 mm SiC epitaxial wafer production, September 2024 commercial epi-wafer shipments and 1.8-fold wafer area
  9. Coherent. Mitsubishi Electric 200 mm SiC collaboration, May 2023 supplier qualification and planned power-device platform
  10. Coherent. Pennsylvania and Sweden SiC capacity plan, historical planned substrate and epitaxy expansion, not realized-output verification
  11. Coherent. SiC substrate and epitaxy catalog, 200 mm material supply for high-performance power devices
  12. Sumitomo Chemical. PCIM Europe 2026 GaN materials display, May 2026 GaN substrates and high-purity GaN-on-GaN epi-wafer applications
  13. Sumitomo Chemical. PCIM Europe 2025 GaN wafer development, April 2025 2- and 4-inch products and 6-inch GaN development
  14. Sumitomo Chemical SCIOCS. GaN substrate catalog, 2- and 4-inch n-type and 2-inch semi-insulating GaN wafers
  15. Sumitomo Chemical SCIOCS. GaN homoepitaxial and RF epitaxial wafers, power and RF GaN epi on native GaN and semi-insulating SiC
  16. Sumitomo Chemical SCIOCS. AlN template product specification, 2-inch AlN template sampling for UV light-emitting structures
  17. Wolfspeed. 300 mm SiC advanced packaging concept, March 2026 downstream packaging R&D context explicitly excluded from substrate market revenue
  18. SiCrystal. Monocrystalline SiC wafer supply, Current ROHM Group SiCrystal commercial semiconductor wafer supply; verified supplier identity
  19. SK Siltron CSS. 150 and 200 mm SiC substrate and epitaxy products, Commercial silicon carbide substrate, wafer and epitaxial materials catalog
  20. TanKeBlue Semiconductor. SiC substrates and epi-wafer products, 4-, 6- and 8-inch conductive and semi-insulating wafer supply
  21. SICC. 4H SiC n-type and semi-insulating substrate catalog, Verified SiC wafer product lines; company ranking claims not independently audited
  22. Resonac. SiC bonded-substrate development with Soitec, September 2024 200 mm SiC material development; development distinct from commercial shipments
  23. Kyma Technologies. GaN and AlN substrate and template product families, Current manufacturer III-nitride substrates, epi-wafers and specialty nitride templates
  24. Soitec. SmartSiC engineered semiconductor substrates, Current engineered SiC substrate product platform and device-fab qualification
Wide Bandgap Semiconductor Market Size, Share & Industry Analysis, By Type (Silicon Carbide (SiC) Substrate, Gallium Nitride (GaN) Substrate, Aluminum Nitride (AlN) Substrate, Others), By Application (Power Discrete Devices, RF Devices, Optoelectronic Devices), By Diameter (100 mm and below, 150 mm, 200 mm, Above 200 mm), By Buyer Type (Integrated Device Manufacturers, Specialist Device Foundries, Research and Specialty Fabs), By Wafer Format (Polished Bare Substrates, Epitaxial Wafers, AlN Templates and Specialty Wafers), and Regional Forecast, 2026-2036

Get Sample Report PDF for Exclusive Insights

Report Sample Includes

  • Table of Contents
  • List of Tables & Figures
  • Charts, Research Methodology, and more...

PDF Icon Download Sample Report PDF

Download Sample Report

Table of Content

Table of Contents
1 Research Methodology and Statistical Scope
1.1 Market Definition and Statistical Scope of Wide Bandgap Semiconductor
1.2 Key Market Segments
1.2.1 Wide Bandgap Semiconductor Segment by Type
1.2.2 Wide Bandgap Semiconductor Segment by Application
1.3 Methodology & Sources of Information
1.3.1 Research Methodology
1.3.2 Research Process
1.3.3 Market Breakdown and Data Triangulation
1.3.4 Base Year
1.3.5 Report Assumptions & Caveats
2 Wide Bandgap Semiconductor Market Overview
2.1 Global Market Overview
2.1.1 Global Wide Bandgap Semiconductor Market Size (M USD) Estimates and Forecasts (2026-2034)
2.1.2 Global Wide Bandgap Semiconductor Sales Estimates and Forecasts (2026-2034)
2.2 Market Segment Executive Summary
2.3 Global Market Size by Region
3 Wide Bandgap Semiconductor Market Competitive Landscape
3.1 Global Wide Bandgap Semiconductor Sales by Manufacturers (2019-2025)
3.2 Global Wide Bandgap Semiconductor Revenue Market Share by Manufacturers (2019-2025)
3.3 Wide Bandgap Semiconductor Market Share by Company Type (Tier 1, Tier 2, and Tier 3)
3.4 Global Wide Bandgap Semiconductor Average Price by Manufacturers (2019-2025)
3.5 Manufacturers Wide Bandgap Semiconductor Sales Sites, Area Served, Product Type
3.6 Wide Bandgap Semiconductor Market Competitive Situation and Trends
3.6.1 Wide Bandgap Semiconductor Market Concentration Rate
3.6.2 Global 5 and 10 Largest Wide Bandgap Semiconductor Players Market Share by Revenue
3.6.3 Mergers & Acquisitions, Expansion
4 Wide Bandgap Semiconductor Industry Chain Analysis
4.1 Wide Bandgap Semiconductor Industry Chain Analysis
4.2 Market Overview of Key Raw Materials
4.3 Midstream Market Analysis
4.4 Downstream Customer Analysis
5 The Development and Dynamics of Wide Bandgap Semiconductor Market
5.1 Key Development Trends
5.2 Driving Factors
5.3 Market Challenges
5.4 Market Restraints
5.5 Industry News
5.5.1 New Product Developments
5.5.2 Mergers & Acquisitions
5.5.3 Expansions
5.5.4 Collaboration/Supply Contracts
5.6 Industry Policies
6 Wide Bandgap Semiconductor Market Segmentation by Type
6.1 Evaluation Matrix of Segment Market Development Potential (Type)
6.2 Global Wide Bandgap Semiconductor Sales Market Share by Type (2019-2025)
6.3 Global Wide Bandgap Semiconductor Market Size Market Share by Type (2019-2025)
6.4 Global Wide Bandgap Semiconductor Price by Type (2019-2025)
7 Wide Bandgap Semiconductor Market Segmentation by Application
7.1 Evaluation Matrix of Segment Market Development Potential (Application)
7.2 Global Wide Bandgap Semiconductor Market Sales by Application (2019-2025)
7.3 Global Wide Bandgap Semiconductor Market Size (M USD) by Application (2019-2025)
7.4 Global Wide Bandgap Semiconductor Sales Growth Rate by Application (2019-2025)
8 Wide Bandgap Semiconductor Market Segmentation by Region
8.1 Global Wide Bandgap Semiconductor Sales by Region
8.1.1 Global Wide Bandgap Semiconductor Sales by Region
8.1.2 Global Wide Bandgap Semiconductor Sales Market Share by Region
8.2 North America
8.2.1 North America Wide Bandgap Semiconductor Sales by Country
8.2.2 U.S.
8.2.3 Canada
8.2.4 Mexico
8.3 Europe
8.3.1 Europe Wide Bandgap Semiconductor Sales by Country
8.3.2 Germany
8.3.3 France
8.3.4 U.K.
8.3.5 Italy
8.3.6 Russia
8.4 Asia Pacific
8.4.1 Asia Pacific Wide Bandgap Semiconductor Sales by Region
8.4.2 China
8.4.3 Japan
8.4.4 South Korea
8.4.5 India
8.4.6 Southeast Asia
8.5 South America
8.5.1 South America Wide Bandgap Semiconductor Sales by Country
8.5.2 Brazil
8.5.3 Argentina
8.5.4 Columbia
8.6 Middle East and Africa
8.6.1 Middle East and Africa Wide Bandgap Semiconductor Sales by Region
8.6.2 Saudi Arabia
8.6.3 UAE
8.6.4 Egypt
8.6.5 Nigeria
8.6.6 South Africa
9 Key Companies Profile
9.1 Wolfspeed
9.1.1 Wolfspeed Wide Bandgap Semiconductor Basic Information
9.1.2 Wolfspeed Wide Bandgap Semiconductor Product Overview
9.1.3 Wolfspeed Wide Bandgap Semiconductor Product Market Performance
9.1.4 Wolfspeed Business Overview
9.1.5 Wolfspeed Wide Bandgap Semiconductor SWOT Analysis
9.1.6 Wolfspeed Recent Developments
9.2 Coherent
9.2.1 Coherent Wide Bandgap Semiconductor Basic Information
9.2.2 Coherent Wide Bandgap Semiconductor Product Overview
9.2.3 Coherent Wide Bandgap Semiconductor Product Market Performance
9.2.4 Coherent Business Overview
9.2.5 Coherent Wide Bandgap Semiconductor SWOT Analysis
9.2.6 Coherent Recent Developments
9.3 TankeBlue Semiconductor
9.3.1 TankeBlue Semiconductor Wide Bandgap Semiconductor Basic Information
9.3.2 TankeBlue Semiconductor Wide Bandgap Semiconductor Product Overview
9.3.3 TankeBlue Semiconductor Wide Bandgap Semiconductor Product Market Performance
9.3.4 TankeBlue Semiconductor Wide Bandgap Semiconductor SWOT Analysis
9.3.5 TankeBlue Semiconductor Business Overview
9.3.6 TankeBlue Semiconductor Recent Developments
9.4 SICC Materials
9.4.1 SICC Materials Wide Bandgap Semiconductor Basic Information
9.4.2 SICC Materials Wide Bandgap Semiconductor Product Overview
9.4.3 SICC Materials Wide Bandgap Semiconductor Product Market Performance
9.4.4 SICC Materials Business Overview
9.4.5 SICC Materials Recent Developments
9.5 Beijing Cengol Semiconductor
9.5.1 Beijing Cengol Semiconductor Wide Bandgap Semiconductor Basic Information
9.5.2 Beijing Cengol Semiconductor Wide Bandgap Semiconductor Product Overview
9.5.3 Beijing Cengol Semiconductor Wide Bandgap Semiconductor Product Market Performance
9.5.4 Beijing Cengol Semiconductor Business Overview
9.5.5 Beijing Cengol Semiconductor Recent Developments
9.6 Resonac
9.6.1 Resonac Wide Bandgap Semiconductor Basic Information
9.6.2 Resonac Wide Bandgap Semiconductor Product Overview
9.6.3 Resonac Wide Bandgap Semiconductor Product Market Performance
9.6.4 Resonac Business Overview
9.6.5 Resonac Recent Developments
9.7 Hebei Synlight Crystal
9.7.1 Hebei Synlight Crystal Wide Bandgap Semiconductor Basic Information
9.7.2 Hebei Synlight Crystal Wide Bandgap Semiconductor Product Overview
9.7.3 Hebei Synlight Crystal Wide Bandgap Semiconductor Product Market Performance
9.7.4 Hebei Synlight Crystal Business Overview
9.7.5 Hebei Synlight Crystal Recent Developments
9.8 Norstel
9.8.1 Norstel Wide Bandgap Semiconductor Basic Information
9.8.2 Norstel Wide Bandgap Semiconductor Product Overview
9.8.3 Norstel Wide Bandgap Semiconductor Product Market Performance
9.8.4 Norstel Business Overview
9.8.5 Norstel Recent Developments
9.9 ROHM Group (SiCrystal)
9.9.1 ROHM Group (SiCrystal) Wide Bandgap Semiconductor Basic Information
9.9.2 ROHM Group (SiCrystal) Wide Bandgap Semiconductor Product Overview
9.9.3 ROHM Group (SiCrystal) Wide Bandgap Semiconductor Product Market Performance
9.9.4 ROHM Group (SiCrystal) Business Overview
9.9.5 ROHM Group (SiCrystal) Recent Developments
9.10 SK Siltron
9.10.1 SK Siltron Wide Bandgap Semiconductor Basic Information
9.10.2 SK Siltron Wide Bandgap Semiconductor Product Overview
9.10.3 SK Siltron Wide Bandgap Semiconductor Product Market Performance
9.10.4 SK Siltron Business Overview
9.10.5 SK Siltron Recent Developments
9.11 San’an Optoelectronics
9.11.1 San’an Optoelectronics Wide Bandgap Semiconductor Basic Information
9.11.2 San’an Optoelectronics Wide Bandgap Semiconductor Product Overview
9.11.3 San’an Optoelectronics Wide Bandgap Semiconductor Product Market Performance
9.11.4 San’an Optoelectronics Business Overview
9.11.5 San’an Optoelectronics Recent Developments
9.12 CETC
9.12.1 CETC Wide Bandgap Semiconductor Basic Information
9.12.2 CETC Wide Bandgap Semiconductor Product Overview
9.12.3 CETC Wide Bandgap Semiconductor Product Market Performance
9.12.4 CETC Business Overview
9.12.5 CETC Recent Developments
9.13 Mitsubishi Chemical
9.13.1 Mitsubishi Chemical Wide Bandgap Semiconductor Basic Information
9.13.2 Mitsubishi Chemical Wide Bandgap Semiconductor Product Overview
9.13.3 Mitsubishi Chemical Wide Bandgap Semiconductor Product Market Performance
9.13.4 Mitsubishi Chemical Business Overview
9.13.5 Mitsubishi Chemical Recent Developments
9.14 SUMITOMO ELECTRIC
9.14.1 SUMITOMO ELECTRIC Wide Bandgap Semiconductor Basic Information
9.14.2 SUMITOMO ELECTRIC Wide Bandgap Semiconductor Product Overview
9.14.3 SUMITOMO ELECTRIC Wide Bandgap Semiconductor Product Market Performance
9.14.4 SUMITOMO ELECTRIC Business Overview
9.14.5 SUMITOMO ELECTRIC Recent Developments
9.15 Kyma Technologies
9.15.1 Kyma Technologies Wide Bandgap Semiconductor Basic Information
9.15.2 Kyma Technologies Wide Bandgap Semiconductor Product Overview
9.15.3 Kyma Technologies Wide Bandgap Semiconductor Product Market Performance
9.15.4 Kyma Technologies Business Overview
9.15.5 Kyma Technologies Recent Developments
9.16 Element Six
9.16.1 Element Six Wide Bandgap Semiconductor Basic Information
9.16.2 Element Six Wide Bandgap Semiconductor Product Overview
9.16.3 Element Six Wide Bandgap Semiconductor Product Market Performance
9.16.4 Element Six Business Overview
9.16.5 Element Six Recent Developments
9.17 Akash Systems
9.17.1 Akash Systems Wide Bandgap Semiconductor Basic Information
9.17.2 Akash Systems Wide Bandgap Semiconductor Product Overview
9.17.3 Akash Systems Wide Bandgap Semiconductor Product Market Performance
9.17.4 Akash Systems Business Overview
9.17.5 Akash Systems Recent Developments
9.18 Qorvo
9.18.1 Qorvo Wide Bandgap Semiconductor Basic Information
9.18.2 Qorvo Wide Bandgap Semiconductor Product Overview
9.18.3 Qorvo Wide Bandgap Semiconductor Product Market Performance
9.18.4 Qorvo Business Overview
9.18.5 Qorvo Recent Developments
9.19 RFHIC Corporation
9.19.1 RFHIC Corporation Wide Bandgap Semiconductor Basic Information
9.19.2 RFHIC Corporation Wide Bandgap Semiconductor Product Overview
9.19.3 RFHIC Corporation Wide Bandgap Semiconductor Product Market Performance
9.19.4 RFHIC Corporation Business Overview
9.19.5 RFHIC Corporation Recent Developments
9.20 Maruwa
9.20.1 Maruwa Wide Bandgap Semiconductor Basic Information
9.20.2 Maruwa Wide Bandgap Semiconductor Product Overview
9.20.3 Maruwa Wide Bandgap Semiconductor Product Market Performance
9.20.4 Maruwa Business Overview
9.20.5 Maruwa Recent Developments
9.21 Toshiba Materials
9.21.1 Toshiba Materials Wide Bandgap Semiconductor Basic Information
9.21.2 Toshiba Materials Wide Bandgap Semiconductor Product Overview
9.21.3 Toshiba Materials Wide Bandgap Semiconductor Product Market Performance
9.21.4 Toshiba Materials Business Overview
9.21.5 Toshiba Materials Recent Developments
9.22 CeramTec
9.22.1 CeramTec Wide Bandgap Semiconductor Basic Information
9.22.2 CeramTec Wide Bandgap Semiconductor Product Overview
9.22.3 CeramTec Wide Bandgap Semiconductor Product Market Performance
9.22.4 CeramTec Business Overview
9.22.5 CeramTec Recent Developments
9.23 Denka
9.23.1 Denka Wide Bandgap Semiconductor Basic Information
9.23.2 Denka Wide Bandgap Semiconductor Product Overview
9.23.3 Denka Wide Bandgap Semiconductor Product Market Performance
9.23.4 Denka Business Overview
9.23.5 Denka Recent Developments
9.24 TD Power Materials
9.24.1 TD Power Materials Wide Bandgap Semiconductor Basic Information
9.24.2 TD Power Materials Wide Bandgap Semiconductor Product Overview
9.24.3 TD Power Materials Wide Bandgap Semiconductor Product Market Performance
9.24.4 TD Power Materials Business Overview
9.24.5 TD Power Materials Recent Developments
9.25 Kyocera
9.25.1 Kyocera Wide Bandgap Semiconductor Basic Information
9.25.2 Kyocera Wide Bandgap Semiconductor Product Overview
9.25.3 Kyocera Wide Bandgap Semiconductor Product Market Performance
9.25.4 Kyocera Business Overview
9.25.5 Kyocera Recent Developments
9.26 CoorsTek
9.26.1 CoorsTek Wide Bandgap Semiconductor Basic Information
9.26.2 CoorsTek Wide Bandgap Semiconductor Product Overview
9.26.3 CoorsTek Wide Bandgap Semiconductor Product Market Performance
9.26.4 CoorsTek Business Overview
9.26.5 CoorsTek Recent Developments
9.27 LEATEC Fine Ceramics
9.27.1 LEATEC Fine Ceramics Wide Bandgap Semiconductor Basic Information
9.27.2 LEATEC Fine Ceramics Wide Bandgap Semiconductor Product Overview
9.27.3 LEATEC Fine Ceramics Wide Bandgap Semiconductor Product Market Performance
9.27.4 LEATEC Fine Ceramics Business Overview
9.27.5 LEATEC Fine Ceramics Recent Developments
9.28 Fujian Huaqing Electronic Material Technology
9.28.1 Fujian Huaqing Electronic Material Technology Wide Bandgap Semiconductor Basic Information
9.28.2 Fujian Huaqing Electronic Material Technology Wide Bandgap Semiconductor Product Overview
9.28.3 Fujian Huaqing Electronic Material Technology Wide Bandgap Semiconductor Product Market Performance
9.28.4 Fujian Huaqing Electronic Material Technology Business Overview
9.28.5 Fujian Huaqing Electronic Material Technology Recent Developments
9.29 Wuxi Hygood New Technology
9.29.1 Wuxi Hygood New Technology Wide Bandgap Semiconductor Basic Information
9.29.2 Wuxi Hygood New Technology Wide Bandgap Semiconductor Product Overview
9.29.3 Wuxi Hygood New Technology Wide Bandgap Semiconductor Product Market Performance
9.29.4 Wuxi Hygood New Technology Business Overview
9.29.5 Wuxi Hygood New Technology Recent Developments
9.30 Zhuzhou Ascendus New Material Technology
9.30.1 Zhuzhou Ascendus New Material Technology Wide Bandgap Semiconductor Basic Information
9.30.2 Zhuzhou Ascendus New Material Technology Wide Bandgap Semiconductor Product Overview
9.30.3 Zhuzhou Ascendus New Material Technology Wide Bandgap Semiconductor Product Market Performance
9.30.4 Zhuzhou Ascendus New Material Technology Business Overview
9.30.5 Zhuzhou Ascendus New Material Technology Recent Developments
10 Wide Bandgap Semiconductor Market Forecast by Region
10.1 Global Wide Bandgap Semiconductor Market Size Forecast
10.2 Global Wide Bandgap Semiconductor Market Forecast by Region
10.2.1 North America Market Size Forecast by Country
10.2.2 Europe Wide Bandgap Semiconductor Market Size Forecast by Country
10.2.3 Asia Pacific Wide Bandgap Semiconductor Market Size Forecast by Region
10.2.4 South America Wide Bandgap Semiconductor Market Size Forecast by Country
10.2.5 Middle East and Africa Forecasted Consumption of Wide Bandgap Semiconductor by Country
11 Forecast Market by Type and by Application (2025-2030)
11.1 Global Wide Bandgap Semiconductor Market Forecast by Type (2025-2030)
11.1.1 Global Forecasted Sales of Wide Bandgap Semiconductor by Type (2025-2030)
11.1.2 Global Wide Bandgap Semiconductor Market Size Forecast by Type (2025-2030)
11.1.3 Global Forecasted Price of Wide Bandgap Semiconductor by Type (2025-2030)
11.2 Global Wide Bandgap Semiconductor Market Forecast by Application (2025-2030)
11.2.1 Global Wide Bandgap Semiconductor Sales (K Units) Forecast by Application
11.2.2 Global Wide Bandgap Semiconductor Market Size (M USD) Forecast by Application (2025-2030)
12 Conclusion and Key FindingsList of Tables
Table 1. Introduction of the Type
Table 2. Introduction of the Application
Table 3. Market Size (M USD) Segment Executive Summary
Table 4. Wide Bandgap Semiconductor Market Size Comparison by Region (M USD)
Table 5. Global Wide Bandgap Semiconductor Sales (K Units) by Manufacturers (2019-2025)
Table 6. Global Wide Bandgap Semiconductor Sales Market Share by Manufacturers (2019-2025)
Table 7. Global Wide Bandgap Semiconductor Revenue (M USD) by Manufacturers (2019-2025)
Table 8. Global Wide Bandgap Semiconductor Revenue Share by Manufacturers (2019-2025)
Table 9. Company Type (Tier 1, Tier 2, and Tier 3) & (based on the Revenue in Wide Bandgap Semiconductor as of 2022)
Table 10. Global Market Wide Bandgap Semiconductor Average Price (USD/Unit) of Key Manufacturers (2019-2025)
Table 11. Manufacturers Wide Bandgap Semiconductor Sales Sites and Area Served
Table 12. Manufacturers Wide Bandgap Semiconductor Product Type
Table 13. Global Wide Bandgap Semiconductor Manufacturers Market Concentration Ratio (CR5 and HHI)
Table 14. Mergers & Acquisitions, Expansion Plans
Table 15. Industry Chain Map of Wide Bandgap Semiconductor
Table 16. Market Overview of Key Raw Materials
Table 17. Midstream Market Analysis
Table 18. Downstream Customer Analysis
Table 19. Key Development Trends
Table 20. Driving Factors
Table 21. Wide Bandgap Semiconductor Market Challenges
Table 22. Global Wide Bandgap Semiconductor Sales by Type (K Units)
Table 23. Global Wide Bandgap Semiconductor Market Size by Type (M USD)
Table 24. Global Wide Bandgap Semiconductor Sales (K Units) by Type (2019-2025)
Table 25. Global Wide Bandgap Semiconductor Sales Market Share by Type (2019-2025)
Table 26. Global Wide Bandgap Semiconductor Market Size (M USD) by Type (2019-2025)
Table 27. Global Wide Bandgap Semiconductor Market Size Share by Type (2019-2025)
Table 28. Global Wide Bandgap Semiconductor Price (USD/Unit) by Type (2019-2025)
Table 29. Global Wide Bandgap Semiconductor Sales (K Units) by Application
Table 30. Global Wide Bandgap Semiconductor Market Size by Application
Table 31. Global Wide Bandgap Semiconductor Sales by Application (2019-2025) & (K Units)
Table 32. Global Wide Bandgap Semiconductor Sales Market Share by Application (2019-2025)
Table 33. Global Wide Bandgap Semiconductor Sales by Application (2019-2025) & (M USD)
Table 34. Global Wide Bandgap Semiconductor Market Share by Application (2019-2025)
Table 35. Global Wide Bandgap Semiconductor Sales Growth Rate by Application (2019-2025)
Table 36. Global Wide Bandgap Semiconductor Sales by Region (2019-2025) & (K Units)
Table 37. Global Wide Bandgap Semiconductor Sales Market Share by Region (2019-2025)
Table 38. North America Wide Bandgap Semiconductor Sales by Country (2019-2025) & (K Units)
Table 39. Europe Wide Bandgap Semiconductor Sales by Country (2019-2025) & (K Units)
Table 40. Asia Pacific Wide Bandgap Semiconductor Sales by Region (2019-2025) & (K Units)
Table 41. South America Wide Bandgap Semiconductor Sales by Country (2019-2025) & (K Units)
Table 42. Middle East and Africa Wide Bandgap Semiconductor Sales by Region (2019-2025) & (K Units)
Table 43. Wolfspeed Wide Bandgap Semiconductor Basic Information
Table 44. Wolfspeed Wide Bandgap Semiconductor Product Overview
Table 45. Wolfspeed Wide Bandgap Semiconductor Sales (K Units), Revenue (M USD), Price (USD/Unit) and Gross Margin (2019-2025)
Table 46. Wolfspeed Business Overview
Table 47. Wolfspeed Wide Bandgap Semiconductor SWOT Analysis
Table 48. Wolfspeed Recent Developments
Table 49. Coherent Wide Bandgap Semiconductor Basic Information
Table 50. Coherent Wide Bandgap Semiconductor Product Overview
Table 51. Coherent Wide Bandgap Semiconductor Sales (K Units), Revenue (M USD), Price (USD/Unit) and Gross Margin (2019-2025)
Table 52. Coherent Business Overview
Table 53. Coherent Wide Bandgap Semiconductor SWOT Analysis
Table 54. Coherent Recent Developments
Table 55. TankeBlue Semiconductor Wide Bandgap Semiconductor Basic Information
Table 56. TankeBlue Semiconductor Wide Bandgap Semiconductor Product Overview
Table 57. TankeBlue Semiconductor Wide Bandgap Semiconductor Sales (K Units), Revenue (M USD), Price (USD/Unit) and Gross Margin (2019-2025)
Table 58. TankeBlue Semiconductor Wide Bandgap Semiconductor SWOT Analysis
Table 59. TankeBlue Semiconductor Business Overview
Table 60. TankeBlue Semiconductor Recent Developments
Table 61. SICC Materials Wide Bandgap Semiconductor Basic Information
Table 62. SICC Materials Wide Bandgap Semiconductor Product Overview
Table 63. SICC Materials Wide Bandgap Semiconductor Sales (K Units), Revenue (M USD), Price (USD/Unit) and Gross Margin (2019-2025)
Table 64. SICC Materials Business Overview
Table 65. SICC Materials Recent Developments
Table 66. Beijing Cengol Semiconductor Wide Bandgap Semiconductor Basic Information
Table 67. Beijing Cengol Semiconductor Wide Bandgap Semiconductor Product Overview
Table 68. Beijing Cengol Semiconductor Wide Bandgap Semiconductor Sales (K Units), Revenue (M USD), Price (USD/Unit) and Gross Margin (2019-2025)
Table 69. Beijing Cengol Semiconductor Business Overview
Table 70. Beijing Cengol Semiconductor Recent Developments
Table 71. Resonac Wide Bandgap Semiconductor Basic Information
Table 72. Resonac Wide Bandgap Semiconductor Product Overview
Table 73. Resonac Wide Bandgap Semiconductor Sales (K Units), Revenue (M USD), Price (USD/Unit) and Gross Margin (2019-2025)
Table 74. Resonac Business Overview
Table 75. Resonac Recent Developments
Table 76. Hebei Synlight Crystal Wide Bandgap Semiconductor Basic Information
Table 77. Hebei Synlight Crystal Wide Bandgap Semiconductor Product Overview
Table 78. Hebei Synlight Crystal Wide Bandgap Semiconductor Sales (K Units), Revenue (M USD), Price (USD/Unit) and Gross Margin (2019-2025)
Table 79. Hebei Synlight Crystal Business Overview
Table 80. Hebei Synlight Crystal Recent Developments
Table 81. Norstel Wide Bandgap Semiconductor Basic Information
Table 82. Norstel Wide Bandgap Semiconductor Product Overview
Table 83. Norstel Wide Bandgap Semiconductor Sales (K Units), Revenue (M USD), Price (USD/Unit) and Gross Margin (2019-2025)
Table 84. Norstel Business Overview
Table 85. Norstel Recent Developments
Table 86. ROHM Group (SiCrystal) Wide Bandgap Semiconductor Basic Information
Table 87. ROHM Group (SiCrystal) Wide Bandgap Semiconductor Product Overview
Table 88. ROHM Group (SiCrystal) Wide Bandgap Semiconductor Sales (K Units), Revenue (M USD), Price (USD/Unit) and Gross Margin (2019-2025)
Table 89. ROHM Group (SiCrystal) Business Overview
Table 90. ROHM Group (SiCrystal) Recent Developments
Table 91. SK Siltron Wide Bandgap Semiconductor Basic Information
Table 92. SK Siltron Wide Bandgap Semiconductor Product Overview
Table 93. SK Siltron Wide Bandgap Semiconductor Sales (K Units), Revenue (M USD), Price (USD/Unit) and Gross Margin (2019-2025)
Table 94. SK Siltron Business Overview
Table 95. SK Siltron Recent Developments
Table 96. San’an Optoelectronics Wide Bandgap Semiconductor Basic Information
Table 97. San’an Optoelectronics Wide Bandgap Semiconductor Product Overview
Table 98. San’an Optoelectronics Wide Bandgap Semiconductor Sales (K Units), Revenue (M USD), Price (USD/Unit) and Gross Margin (2019-2025)
Table 99. San’an Optoelectronics Business Overview
Table 100. San’an Optoelectronics Recent Developments
Table 101. CETC Wide Bandgap Semiconductor Basic Information
Table 102. CETC Wide Bandgap Semiconductor Product Overview
Table 103. CETC Wide Bandgap Semiconductor Sales (K Units), Revenue (M USD), Price (USD/Unit) and Gross Margin (2019-2025)
Table 104. CETC Business Overview
Table 105. CETC Recent Developments
Table 106. Mitsubishi Chemical Wide Bandgap Semiconductor Basic Information
Table 107. Mitsubishi Chemical Wide Bandgap Semiconductor Product Overview
Table 108. Mitsubishi Chemical Wide Bandgap Semiconductor Sales (K Units), Revenue (M USD), Price (USD/Unit) and Gross Margin (2019-2025)
Table 109. Mitsubishi Chemical Business Overview
Table 110. Mitsubishi Chemical Recent Developments
Table 111. SUMITOMO ELECTRIC Wide Bandgap Semiconductor Basic Information
Table 112. SUMITOMO ELECTRIC Wide Bandgap Semiconductor Product Overview
Table 113. SUMITOMO ELECTRIC Wide Bandgap Semiconductor Sales (K Units), Revenue (M USD), Price (USD/Unit) and Gross Margin (2019-2025)
Table 114. SUMITOMO ELECTRIC Business Overview
Table 115. SUMITOMO ELECTRIC Recent Developments
Table 116. Kyma Technologies Wide Bandgap Semiconductor Basic Information
Table 117. Kyma Technologies Wide Bandgap Semiconductor Product Overview
Table 118. Kyma Technologies Wide Bandgap Semiconductor Sales (K Units), Revenue (M USD), Price (USD/Unit) and Gross Margin (2019-2025)
Table 119. Kyma Technologies Business Overview
Table 120. Kyma Technologies Recent Developments
Table 121. Element Six Wide Bandgap Semiconductor Basic Information
Table 122. Element Six Wide Bandgap Semiconductor Product Overview
Table 123. Element Six Wide Bandgap Semiconductor Sales (K Units), Revenue (M USD), Price (USD/Unit) and Gross Margin (2019-2025)
Table 124. Element Six Business Overview
Table 125. Element Six Recent Developments
Table 126. Akash Systems Wide Bandgap Semiconductor Basic Information
Table 127. Akash Systems Wide Bandgap Semiconductor Product Overview
Table 128. Akash Systems Wide Bandgap Semiconductor Sales (K Units), Revenue (M USD), Price (USD/Unit) and Gross Margin (2019-2025)
Table 129. Akash Systems Business Overview
Table 130. Akash Systems Recent Developments
Table 131. Qorvo Wide Bandgap Semiconductor Basic Information
Table 132. Qorvo Wide Bandgap Semiconductor Product Overview
Table 133. Qorvo Wide Bandgap Semiconductor Sales (K Units), Revenue (M USD), Price (USD/Unit) and Gross Margin (2019-2025)
Table 134. Qorvo Business Overview
Table 135. Qorvo Recent Developments
Table 136. RFHIC Corporation Wide Bandgap Semiconductor Basic Information
Table 137. RFHIC Corporation Wide Bandgap Semiconductor Product Overview
Table 138. RFHIC Corporation Wide Bandgap Semiconductor Sales (K Units), Revenue (M USD), Price (USD/Unit) and Gross Margin (2019-2025)
Table 139. RFHIC Corporation Business Overview
Table 140. RFHIC Corporation Recent Developments
Table 141. Maruwa Wide Bandgap Semiconductor Basic Information
Table 142. Maruwa Wide Bandgap Semiconductor Product Overview
Table 143. Maruwa Wide Bandgap Semiconductor Sales (K Units), Revenue (M USD), Price (USD/Unit) and Gross Margin (2019-2025)
Table 144. Maruwa Business Overview
Table 145. Maruwa Recent Developments
Table 146. Toshiba Materials Wide Bandgap Semiconductor Basic Information
Table 147. Toshiba Materials Wide Bandgap Semiconductor Product Overview
Table 148. Toshiba Materials Wide Bandgap Semiconductor Sales (K Units), Revenue (M USD), Price (USD/Unit) and Gross Margin (2019-2025)
Table 149. Toshiba Materials Business Overview
Table 150. Toshiba Materials Recent Developments
Table 151. CeramTec Wide Bandgap Semiconductor Basic Information
Table 152. CeramTec Wide Bandgap Semiconductor Product Overview
Table 153. CeramTec Wide Bandgap Semiconductor Sales (K Units), Revenue (M USD), Price (USD/Unit) and Gross Margin (2019-2025)
Table 154. CeramTec Business Overview
Table 155. CeramTec Recent Developments
Table 156. Denka Wide Bandgap Semiconductor Basic Information
Table 157. Denka Wide Bandgap Semiconductor Product Overview
Table 158. Denka Wide Bandgap Semiconductor Sales (K Units), Revenue (M USD), Price (USD/Unit) and Gross Margin (2019-2025)
Table 159. Denka Business Overview
Table 160. Denka Recent Developments
Table 161. TD Power Materials Wide Bandgap Semiconductor Basic Information
Table 162. TD Power Materials Wide Bandgap Semiconductor Product Overview
Table 163. TD Power Materials Wide Bandgap Semiconductor Sales (K Units), Revenue (M USD), Price (USD/Unit) and Gross Margin (2019-2025)
Table 164. TD Power Materials Business Overview
Table 165. TD Power Materials Recent Developments
Table 166. Kyocera Wide Bandgap Semiconductor Basic Information
Table 167. Kyocera Wide Bandgap Semiconductor Product Overview
Table 168. Kyocera Wide Bandgap Semiconductor Sales (K Units), Revenue (M USD), Price (USD/Unit) and Gross Margin (2019-2025)
Table 169. Kyocera Business Overview
Table 170. Kyocera Recent Developments
Table 171. CoorsTek Wide Bandgap Semiconductor Basic Information
Table 172. CoorsTek Wide Bandgap Semiconductor Product Overview
Table 173. CoorsTek Wide Bandgap Semiconductor Sales (K Units), Revenue (M USD), Price (USD/Unit) and Gross Margin (2019-2025)
Table 174. CoorsTek Business Overview
Table 175. CoorsTek Recent Developments
Table 176. LEATEC Fine Ceramics Wide Bandgap Semiconductor Basic Information
Table 177. LEATEC Fine Ceramics Wide Bandgap Semiconductor Product Overview
Table 178. LEATEC Fine Ceramics Wide Bandgap Semiconductor Sales (K Units), Revenue (M USD), Price (USD/Unit) and Gross Margin (2019-2025)
Table 179. LEATEC Fine Ceramics Business Overview
Table 180. LEATEC Fine Ceramics Recent Developments
Table 181. Fujian Huaqing Electronic Material Technology Wide Bandgap Semiconductor Basic Information
Table 182. Fujian Huaqing Electronic Material Technology Wide Bandgap Semiconductor Product Overview
Table 183. Fujian Huaqing Electronic Material Technology Wide Bandgap Semiconductor Sales (K Units), Revenue (M USD), Price (USD/Unit) and Gross Margin (2019-2025)
Table 184. Fujian Huaqing Electronic Material Technology Business Overview
Table 185. Fujian Huaqing Electronic Material Technology Recent Developments
Table 186. Wuxi Hygood New Technology Wide Bandgap Semiconductor Basic Information
Table 187. Wuxi Hygood New Technology Wide Bandgap Semiconductor Product Overview
Table 188. Wuxi Hygood New Technology Wide Bandgap Semiconductor Sales (K Units), Revenue (M USD), Price (USD/Unit) and Gross Margin (2019-2025)
Table 189. Wuxi Hygood New Technology Business Overview
Table 190. Wuxi Hygood New Technology Recent Developments
Table 191. Zhuzhou Ascendus New Material Technology Wide Bandgap Semiconductor Basic Information
Table 192. Zhuzhou Ascendus New Material Technology Wide Bandgap Semiconductor Product Overview
Table 193. Zhuzhou Ascendus New Material Technology Wide Bandgap Semiconductor Sales (K Units), Revenue (M USD), Price (USD/Unit) and Gross Margin (2019-2025)
Table 194. Zhuzhou Ascendus New Material Technology Business Overview
Table 195. Zhuzhou Ascendus New Material Technology Recent Developments
Table 196. Global Wide Bandgap Semiconductor Sales Forecast by Region (2025-2030) & (K Units)
Table 197. Global Wide Bandgap Semiconductor Market Size Forecast by Region (2025-2030) & (M USD)
Table 198. North America Wide Bandgap Semiconductor Sales Forecast by Country (2025-2030) & (K Units)
Table 199. North America Wide Bandgap Semiconductor Market Size Forecast by Country (2025-2030) & (M USD)
Table 200. Europe Wide Bandgap Semiconductor Sales Forecast by Country (2025-2030) & (K Units)
Table 201. Europe Wide Bandgap Semiconductor Market Size Forecast by Country (2025-2030) & (M USD)
Table 202. Asia Pacific Wide Bandgap Semiconductor Sales Forecast by Region (2025-2030) & (K Units)
Table 203. Asia Pacific Wide Bandgap Semiconductor Market Size Forecast by Region (2025-2030) & (M USD)
Table 204. South America Wide Bandgap Semiconductor Sales Forecast by Country (2025-2030) & (K Units)
Table 205. South America Wide Bandgap Semiconductor Market Size Forecast by Country (2025-2030) & (M USD)
Table 206. Middle East and Africa Wide Bandgap Semiconductor Consumption Forecast by Country (2025-2030) & (Units)
Table 207. Middle East and Africa Wide Bandgap Semiconductor Market Size Forecast by Country (2025-2030) & (M USD)
Table 208. Global Wide Bandgap Semiconductor Sales Forecast by Type (2025-2030) & (K Units)
Table 209. Global Wide Bandgap Semiconductor Market Size Forecast by Type (2025-2030) & (M USD)
Table 210. Global Wide Bandgap Semiconductor Price Forecast by Type (2025-2030) & (USD/Unit)
Table 211. Global Wide Bandgap Semiconductor Sales (K Units) Forecast by Application (2025-2030)
Table 212. Global Wide Bandgap Semiconductor Market Size Forecast by Application (2025-2030) & (M USD)
List of Figures
Figure 1. Product Picture of Wide Bandgap Semiconductor
Figure 2. Data Triangulation
Figure 3. Key Caveats
Figure 4. Global Wide Bandgap Semiconductor Market Size (M USD), 2026-2034
Figure 5. Global Wide Bandgap Semiconductor Market Size (M USD) (2026-2034)
Figure 6. Global Wide Bandgap Semiconductor Sales (K Units) & (2026-2034)
Figure 7. Evaluation Matrix of Segment Market Development Potential (Type)
Figure 8. Evaluation Matrix of Segment Market Development Potential (Application)
Figure 9. Evaluation Matrix of Regional Market Development Potential
Figure 10. Wide Bandgap Semiconductor Market Size by Country (M USD)
Figure 11. Wide Bandgap Semiconductor Sales Share by Manufacturers in 2023
Figure 12. Global Wide Bandgap Semiconductor Revenue Share by Manufacturers in 2023
Figure 13. Wide Bandgap Semiconductor Market Share by Company Type (Tier 1, Tier 2 and Tier 3): 2023
Figure 14. Global Market Wide Bandgap Semiconductor Average Price (USD/Unit) of Key Manufacturers in 2023
Figure 15. The Global 5 and 10 Largest Players: Market Share by Wide Bandgap Semiconductor Revenue in 2023
Figure 16. Evaluation Matrix of Segment Market Development Potential (Type)
Figure 17. Global Wide Bandgap Semiconductor Market Share by Type
Figure 18. Sales Market Share of Wide Bandgap Semiconductor by Type (2019-2025)
Figure 19. Sales Market Share of Wide Bandgap Semiconductor by Type in 2023
Figure 20. Market Size Share of Wide Bandgap Semiconductor by Type (2019-2025)
Figure 21. Market Size Market Share of Wide Bandgap Semiconductor by Type in 2023
Figure 22. Evaluation Matrix of Segment Market Development Potential (Application)
Figure 23. Global Wide Bandgap Semiconductor Market Share by Application
Figure 24. Global Wide Bandgap Semiconductor Sales Market Share by Application (2019-2025)
Figure 25. Global Wide Bandgap Semiconductor Sales Market Share by Application in 2023
Figure 26. Global Wide Bandgap Semiconductor Market Share by Application (2019-2025)
Figure 27. Global Wide Bandgap Semiconductor Market Share by Application in 2023
Figure 28. Global Wide Bandgap Semiconductor Sales Growth Rate by Application (2019-2025)
Figure 29. Global Wide Bandgap Semiconductor Sales Market Share by Region (2019-2025)
Figure 30. North America Wide Bandgap Semiconductor Sales and Growth Rate (2019-2025) & (K Units)
Figure 31. North America Wide Bandgap Semiconductor Sales Market Share by Country in 2023
Figure 32. U.S. Wide Bandgap Semiconductor Sales and Growth Rate (2019-2025) & (K Units)
Figure 33. Canada Wide Bandgap Semiconductor Sales (K Units) and Growth Rate (2019-2025)
Figure 34. Mexico Wide Bandgap Semiconductor Sales (Units) and Growth Rate (2019-2025)
Figure 35. Europe Wide Bandgap Semiconductor Sales and Growth Rate (2019-2025) & (K Units)
Figure 36. Europe Wide Bandgap Semiconductor Sales Market Share by Country in 2023
Figure 37. Germany Wide Bandgap Semiconductor Sales and Growth Rate (2019-2025) & (K Units)
Figure 38. France Wide Bandgap Semiconductor Sales and Growth Rate (2019-2025) & (K Units)
Figure 39. U.K. Wide Bandgap Semiconductor Sales and Growth Rate (2019-2025) & (K Units)
Figure 40. Italy Wide Bandgap Semiconductor Sales and Growth Rate (2019-2025) & (K Units)
Figure 41. Russia Wide Bandgap Semiconductor Sales and Growth Rate (2019-2025) & (K Units)
Figure 42. Asia Pacific Wide Bandgap Semiconductor Sales and Growth Rate (K Units)
Figure 43. Asia Pacific Wide Bandgap Semiconductor Sales Market Share by Region in 2023
Figure 44. China Wide Bandgap Semiconductor Sales and Growth Rate (2019-2025) & (K Units)
Figure 45. Japan Wide Bandgap Semiconductor Sales and Growth Rate (2019-2025) & (K Units)
Figure 46. South Korea Wide Bandgap Semiconductor Sales and Growth Rate (2019-2025) & (K Units)
Figure 47. India Wide Bandgap Semiconductor Sales and Growth Rate (2019-2025) & (K Units)
Figure 48. Southeast Asia Wide Bandgap Semiconductor Sales and Growth Rate (2019-2025) & (K Units)
Figure 49. South America Wide Bandgap Semiconductor Sales and Growth Rate (K Units)
Figure 50. South America Wide Bandgap Semiconductor Sales Market Share by Country in 2023
Figure 51. Brazil Wide Bandgap Semiconductor Sales and Growth Rate (2019-2025) & (K Units)
Figure 52. Argentina Wide Bandgap Semiconductor Sales and Growth Rate (2019-2025) & (K Units)
Figure 53. Columbia Wide Bandgap Semiconductor Sales and Growth Rate (2019-2025) & (K Units)
Figure 54. Middle East and Africa Wide Bandgap Semiconductor Sales and Growth Rate (K Units)
Figure 55. Middle East and Africa Wide Bandgap Semiconductor Sales Market Share by Region in 2023
Figure 56. Saudi Arabia Wide Bandgap Semiconductor Sales and Growth Rate (2019-2025) & (K Units)
Figure 57. UAE Wide Bandgap Semiconductor Sales and Growth Rate (2019-2025) & (K Units)
Figure 58. Egypt Wide Bandgap Semiconductor Sales and Growth Rate (2019-2025) & (K Units)
Figure 59. Nigeria Wide Bandgap Semiconductor Sales and Growth Rate (2019-2025) & (K Units)
Figure 60. South Africa Wide Bandgap Semiconductor Sales and Growth Rate (2019-2025) & (K Units)
Figure 61. Global Wide Bandgap Semiconductor Sales Forecast by Volume (2026-2034) & (K Units)
Figure 62. Global Wide Bandgap Semiconductor Market Size Forecast by Value (2026-2034) & (M USD)
Figure 63. Global Wide Bandgap Semiconductor Sales Market Share Forecast by Type (2025-2030)
Figure 64. Global Wide Bandgap Semiconductor Market Share Forecast by Type (2025-2030)
Figure 65. Global Wide Bandgap Semiconductor Sales Forecast by Application (2025-2030)
Figure 66. Global Wide Bandgap Semiconductor Market Share Forecast by Application (2025-2030)