➣ Global Underwater Connectors Market Overview
➣ Market Growth
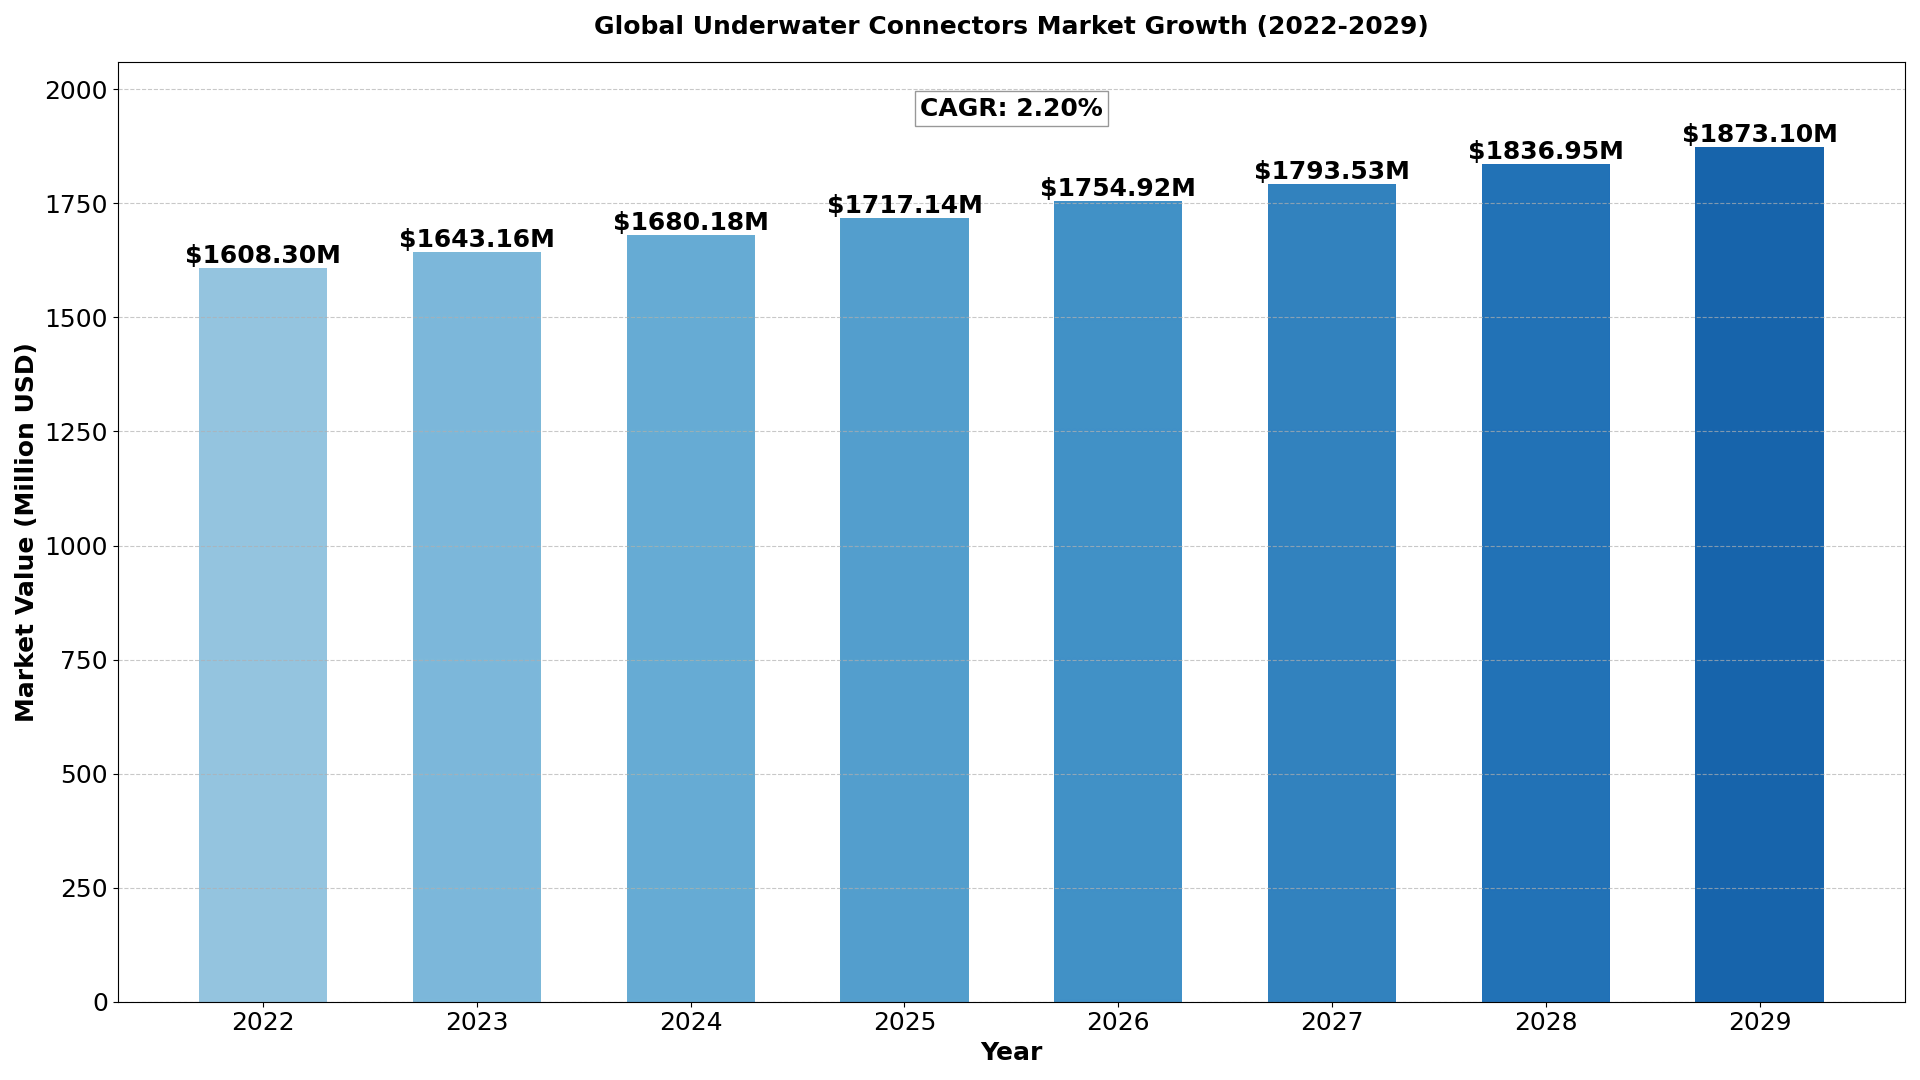
The global Underwater Connectors market was valued at US$ 1608.3 million in 2022 and is projected to reach US$ 1643.16 million by 2023, US$ 1680.18 million by 2024, US$ 1836.95 million by 2028, and US$ 1873.1 million by 2029, at a CAGR of 2.2% during the forecast period.
| Market size in 2022 | US$ 1608.3 million | Forecast Market size by 2029 | US$ 1873.1 million |
|---|---|---|---|
| Growth Rate | CAGR of 2.2% | Number of Pages | 125+Pages |
Underwater connectors are designed to connect power in applications that include equipment placed on the ocean floor. Underwater application areas that require underwater connectors are offshore oil and gas, renewable energy and subsea systems, defense systems and equipment, oceanographic systems, equipment and instrumentation solutions, remotely operated vehicles, and remotely operated towed vehicle systems.
An underwater connector serves as a pivotal electrical nexus, facilitating the seamless interconnection of cables across various systems. It stands as a linchpin within any system, enabling vital connectivity. These connectors not only bridge systems and cables but also serve as indispensable solutions for connectivity in diverse marine sectors. They streamline offshore testing and cable management processes, thereby enhancing operational efficiency.
Their applications span across a multitude of industries including military & defense, oil & gas, telecommunications, and others, catalyzing significant advancements within these sectors. The relentless march of innovation within the electronic systems industry promises further enhancements in underwater connector technology, driving towards heightened performance and functionality.
The global underwater connectors market is currently witnessing substantial growth and is poised for considerable expansion in the coming years. Its size is delineated based on Type, Connection, and End User categories. Types range from Inductive Coupling, Rigid Shell, Underwater Electric Mateable Connectors, to Rubber Molded variants, among others. Connection options encompass Optical Fiber, Electrical, Hybrid, and more. End users include Military & Defense, Oil & Gas, Telecommunications, and other sectors.
Click Here to Access Your Complimentary Report
Geographically, market analysis spans across key regions including North America, Europe, Asia-Pacific, as well as Latin America, the Middle East, and Africa (LAMEA). This global panorama underscores the pervasive importance and evolving landscape of underwater connectors in powering connectivity across various domains.
The expansion of the underwater fiber optic network stands as a significant catalyst for driving growth within the underwater connectors market. With over 95% of the globe’s data, spanning from routine phone calls to highly secure military communications, traversing vast distances through subsea fiber optic cables, the demand for enhanced connectivity has surged.
Major corporations and tech giants are channeling investments into the deployment of new subsea cable lines to meet the escalating need for greater bandwidth and accelerated data transmission speeds in response to the exponential growth in internet traffic.
The evolution of underwater systems hinges upon advancements in data transfer and power capabilities. This next-generation capability not only enables swifter data rates and expanded bandwidth but also facilitates the integration of additional sensors while efficiently powering larger systems and multiple devices through a single input cable and connector.
Submarine communication networks, comprising a network of underwater cables and supporting infrastructure, serve as the backbone for long-distance transmission of voice and data signals beneath the ocean’s surface. These networks are vital for intercontinental and inter-island connectivity, as well as facilitating communication between offshore oil and gas installations. Here, underwater connectors play a pivotal role within the transmission equipment, ensuring seamless data transfer over extensive distances.
Consequently, the anticipated expansion of the undersea fiber optic network is poised to fuel the development of the underwater connectors market in the forthcoming years, as the demand for robust and efficient connectivity solutions continues to escalate.
Underwater Connectors Market aims to provide a comprehensive presentation of the global market for Underwater Connectors, with both quantitative and qualitative analysis, to help readers develop business/growth strategies, assess the market competitive situation, analyze their position in the current marketplace, and make informed business decisions regarding Underwater Connectors. Underwater Connectors Market contains market size and forecasts of Underwater Connectors in global, including the following market information:
Global Underwater Connectors Market Revenue, 2018-2023, 2024-2032, ($ millions)
Global Underwater Connectors Market Sales, 2018-2023, 2024-2032, (K Units)
Global top five Underwater Connectors companies in 2022 (%)
The U.S. Market is Estimated at $ Million in 2022, While China is Forecast to Reach $ Million.
Dry Mate Connector Segment to Reach $ Million by 2029, with a % CAGR in next six years.
The global key manufacturers of Underwater Connectors include SEACON, Eaton, Teledyne Marine, Hydro Group, Glenair, Amphenol, MacArtney, BIRNS and Marshall Underwater Industries, etc. in 2022, the global top five players have a share approximately % in terms of revenue.
We surveyed the Underwater Connectors manufacturers, suppliers, distributors and industry experts on this industry, involving the sales, revenue, demand, price change, product type, recent development and plan, industry trends, drivers, challenges, obstacles, and potential risks.
➣ Total Market by Segment:
Global Underwater Connectors Market Segment :
- Type
- Dry-Mateable Connectors
- Wet-Mateable Connectors
- Others
- Sealing
- Rubber-molded
- Rigid shell
- Fluid-filled
- Inductive Couplings
- Connection
- Electrical
- Optical
- Hybrid
- Material
- Stainless Steel
- Inconel
- Titanium
- Application
- Oil & Gas Exploration Equipment’s and Meters
- Offshore wind Energy
- Submarine Systems
- ROV/AUV
- Underwater Communication Infrastructure
- Underwater Observatories
- Others
- End-use Industry
- Oil & Gas Exploration Equipment’s and Meters
- Offshore wind Energy
- Submarine Systems
- ROV/AUV
- Underwater Communication Infrastructure
- Underwater Observatories
- Others
Click Here to Access Your Complimentary Report
key benefits of the report:
Comprehensive Analysis: This study offers an in-depth analytical depiction of the global underwater connectors industry, including current trends and future estimations, aiding in identifying imminent investment opportunities.
Insights into Market Dynamics: The report provides insights into key drivers, restraints, and opportunities shaping the global underwater connectors market, facilitating informed decision-making.
Quantitative Market Analysis: A quantitative analysis of the current market scenario is presented, highlighting the growth trajectory of the global underwater connectors market.
Competitive Landscape Analysis: The report offers a detailed analysis of the global underwater connectors market based on competitive intensity, predicting how competition will evolve in the coming years.
➣ Competitor Analysis
The report also provides analysis of leading market participants including:
- Key companies Underwater Connectors revenues in global market, 2018-2023 (Estimated), ($ millions)
- Key companies Underwater Connectors revenues share in global market, 2022 (%)
- Key companies Underwater Connectors sales in global market, 2018-2023 (Estimated), (K Units)
- Key companies Underwater Connectors sales share in global market, 2022 (%)
Further, the report presents profiles of competitors in the market, key players include:
- SEACON
- Eaton
- Teledyne Marine
- Hydro Group
- Glenair
- Amphenol
- MacArtney
- BIRNS
- Marshall Underwater Industries
- Gisma
- Sea and Land Technologies Pte. Ltd.
- CRE
key trends shaping the underwater connectors market:
-
Growing demand for underwater exploration: The increasing demand for underwater exploration activities, such as deep-sea mining, oil and gas exploration, and scientific research, is driving the need for reliable underwater connectors.
-
Advancements in underwater connector technology: The development of new materials and technologies, such as fiber optics and wireless connectors, is enabling higher bandwidth and more reliable underwater communication.
-
Rising demand for remotely operated vehicles (ROVs): The growing use of ROVs for underwater exploration and maintenance activities is driving the demand for underwater connectors that can withstand harsh conditions.
-
Increasing demand for renewable energy: The trend toward renewable energy sources, such as offshore wind farms and tidal energy, is driving the need for underwater connectors that can withstand harsh marine environments.
some notable developments in the field of connector manufacturing:
- In 2022, CRE inaugurated a state-of-the-art connector manufacturing cell within its Aberdeen facility, tailored to meet the rising demand for its expanding metal shell connector range.
- Fischer Connectors made significant strides in 2021 by expanding its renowned series of ultra-rugged connectors with the introduction of two innovative products: Fischer UltiMate 80 and Fischer UltiMate in size 15, further solidifying its position in the market.
- Also in 2021, Hydro Group made waves with the announcement of their comprehensive range of rubber-molded subsea connectivity solutions. This expansion includes new configurations added to their Hydro Rubber Moulded (HRM) series of subsea connectors, enhancing their offerings to meet evolving industry needs.
- In February 2020, Northrop Grumman Corporation took a pioneering step by signing its inaugural non-exclusive agreement for the production of niobium-based connectors, known as NiobiCon. These connectors are specifically engineered to withstand harsh environmental conditions, marking a significant advancement in connector technology.
Interested in related market reports? Click here to explore more!
➣ About Semiconductor Insight:
Semiconductor Insight was founded in 2016 and focuses on offering thorough research and analysis of the semiconductor industry to help companies make informed decisions in this fast-paced, dynamic field. We have always been dedicated to providing comprehensive semiconductor market research, recognizing the major trends, opportunities, and difficulties influencing the worldwide semiconductor market.
Our clients can stay ahead of the competition thanks to the actionable intelligence provided by our professionally prepared semiconductor market studies, which include competitive analysis, market predictions, in-depth semiconductor industry analysis, and insights into technical breakthroughs. With almost ten years of experience, we continue to lead innovation and provide strategic clarity to semiconductor companies.
Our dedication to provide our clients insights into semiconductor market share and industry trends guarantees that they have the data they require.
FAQs –
Get Sample Report PDF for Exclusive Insights
Report Sample Includes
- Table of Contents
- List of Tables & Figures
- Charts, Research Methodology, and more...


Be the first to review “Underwater Connectors Market Size, Share, Trends, Market Growth, and Business Strategies 2025-2030”