SEMICONDUCTOR INSIGHT
MARKET RESEARCH REPORT

Semiconductor Etching Equipment Market

2026 to 2034
MARKET INTELLIGENCE
ACROSS KEY REGIONS
2026 EDITION
ELECTRONIC COMPONENTS Semiconductor Market Research

Semiconductor Etching Equipment Market

Size, Trends, Business Strategies 2026-2034

◷
UPDATED 23 September 2026
▤
REPORT LENGTH Detailed Report
▣
REPORT CODE 0684abe69ce1
▯
FORMATS PDF

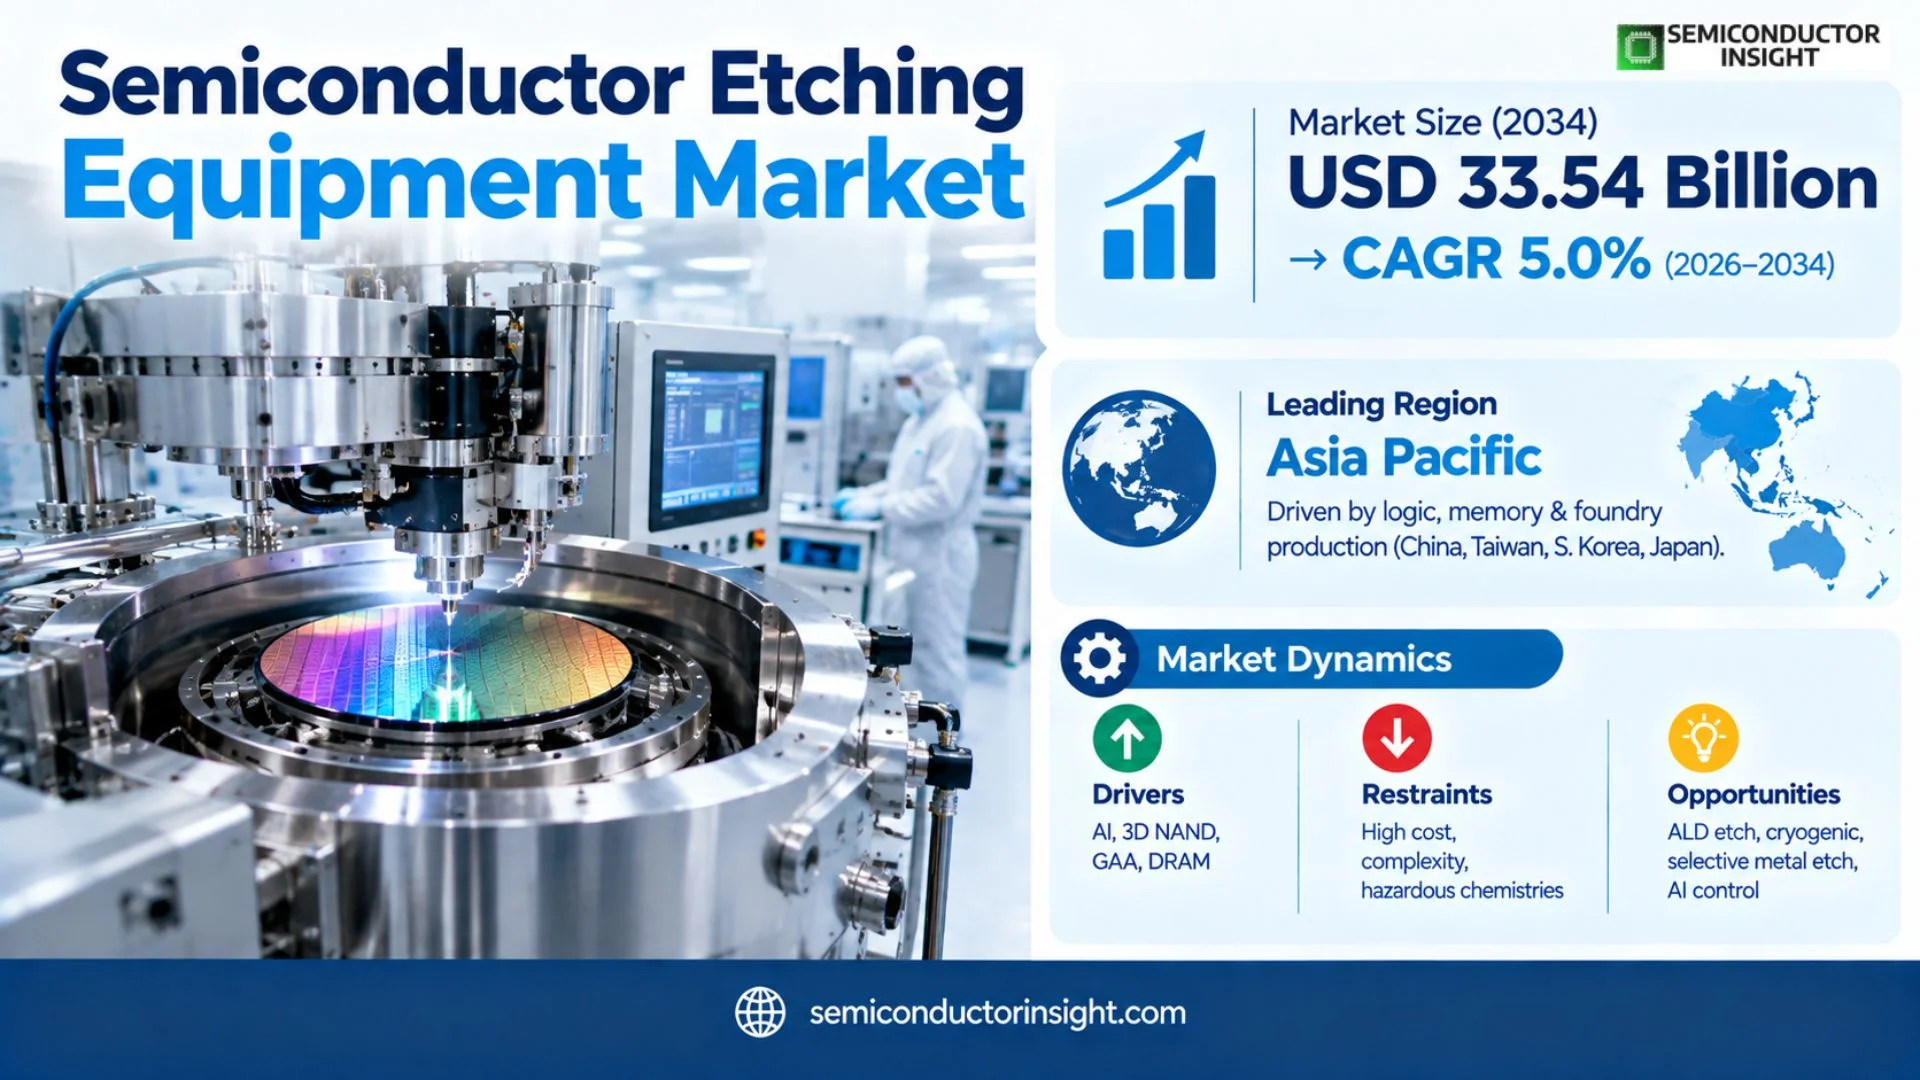
Semiconductor Etching Equipment market is projected to reach USD 33.54 billion by 2034, representing a 5.0% CAGR during 2026–2034. The 2026 estimated market size is USD 22.70 billion. Asia Pacific is the dominant regional market because the largest concentrations of logic, memory and foundry production are located in China, Taiwan, South Korea and Japan.

Get the sample PDF with study scope, segmentation and methodology details.

Key Statistics

2025 Market Size
USD 21.62 billion
2034 Projected Size
USD 33.54 billion
CAGR (2026–2034)
5.0%
Largest Market in 2025
Asia Pacific

Key Takeaways

  • Dry etching equipment is the largest product segment because advanced logic, DRAM, 3D NAND and power devices require plasma-based anisotropic etch with precise profile and selectivity control.
  • Logic and memory form the largest application group, and AI-driven investment is increasing process intensity as 3D NAND, GAA logic, HBM-related memory and future 3D DRAM use deeper and more complex structures.
  • Asia Pacific is the dominant regional market through the concentration of semiconductor fabs in China, Taiwan, South Korea and Japan.
  • Semiconductor equipment spending remains a strong demand backdrop. SEMI’s Q2 2026 outlook projects record 300 mm front-end equipment investment and tracks more than 400 fabs and production lines worldwide.
  • Etch technology is moving toward atomic precision and deeper 3D structures. 2026 developments include Lam’s high-NA EUV ruthenium direct-metal etch and Applied Materials’ selective molybdenum etch for next-generation 3D NAND.

Semiconductor Etching Equipment Market Overview

Semiconductor Etching Equipment market is valued at USD 21.62 billion in 2025 and is projected to reach USD 33.54 billion by 2034, representing a 5.0% CAGR during 2026–2034. The 2026 estimated market size is USD 22.70 billion. Asia Pacific is the dominant regional market because the largest concentrations of logic, memory and foundry production are located in China, Taiwan, South Korea and Japan.

Base year: 2025 · Estimated year: 2026 · Forecast period: 2026–2034 · Historical data: 2019–2025 · Values in USD

Semiconductor etching selectively removes films from a wafer to transfer lithographic patterns and shape the structures that form transistors, interconnects, memory cells and isolation regions. Dry etch uses plasma, reactive ions or gas chemistry to achieve directional and highly selective material removal, while wet etch uses liquid chemicals for isotropic or high-rate removal where profile control is less demanding.

Etch has become more important as device structures move from planar to three-dimensional architectures. Gate-all-around transistors, high-aspect-ratio 3D NAND channels, advanced DRAM, backside power delivery and heterogeneous integration require deeper features, new materials and tighter critical-dimension uniformity. Many process steps can no longer tolerate conventional bulk removal and instead need cyclic or atomic-layer techniques.

Equipment performance is measured through selectivity, etch rate, profile control, across-wafer uniformity, defectivity, chamber matching, uptime and environmental efficiency. Advanced fabs increasingly combine sensor-rich process chambers with data analytics, virtual process modeling and automated maintenance to stabilize results across large fleets.

Segment Analysis: By Type

By type, the market is segmented into Dry Etching Equipment and Wet Etching Equipment. Dry etch is the largest segment because anisotropic plasma processes are essential for the fine vertical structures used in advanced logic, memory and interconnect fabrication.

Type Process profile Market position
Dry Etching Equipment Uses reactive-ion etch, inductively coupled plasma, capacitively coupled plasma, chemical dry etch, cryogenic etch or atomic-layer etch to remove material with precise directionality and selectivity. Largest segment. Advanced logic, DRAM, NAND, MEMS and power devices require dry etch for critical dimensions, trenches, vias and high-aspect-ratio structures.
Wet Etching Equipment Uses liquid chemistries for isotropic removal, cleaning or material-selective processes. Batch and single-wafer systems can provide high throughput and straightforward chemistry control where strict anisotropy is unnecessary. Important in cleaning, bulk removal, MEMS, specialty devices and selected wafer processes where high etch rate and lower tool complexity are advantageous.

Film-type and process-technology segmentation

The market can also be segmented by film type and process technology. Conductor etch shapes silicon, metals and transistor structures; dielectric etch opens contacts, vias and 3D memory holes; polysilicon and specialty-material etch serve memory, power and MEMS. Atomic-layer, cryogenic and selective etch are expanding as process windows narrow.

Axis Segments Commercial implication
By Film / Material Conductor Etch · Dielectric Etch · Polysilicon Etch · Metal / Selective Etch · Compound Semiconductor Etch Each material stack needs different plasma chemistry, ion energy and selectivity. New metals such as ruthenium and molybdenum create new selective-etch opportunities.
By Process Technology Reactive Ion Etch · Atomic Layer Etch · Cryogenic Etch · Chemical Dry Etch · Wet Etch RIE remains the workhorse; ALE provides atomic-scale control; cryogenic etch improves deep NAND features; chemical dry etch enables highly selective isotropic removal.

Segment Analysis: By Application

By application, Logic and Memory form the largest segment, followed by MEMS, power devices and other specialty semiconductor applications. AI demand increases both advanced-node logic and advanced-memory equipment intensity.

Application Key market insight
Logic and Memory GAA logic, DRAM and 3D NAND require repeated conductor and dielectric etch. Feature depth, sidewall profile and layer selectivity are critical, making this the highest-value application group.
MEMS Sensors, microphones, inertial devices and microfluidics use deep silicon etch, release etch and cavity formation. MEMS often requires high aspect ratio on 150 mm, 200 mm and increasingly 300 mm wafers.
Power Devices Si, SiC and GaN devices use trench, mesa, contact and passivation etch. SiC’s material hardness and high-voltage structures require dedicated plasma process optimization.
Advanced Packaging TSV, hybrid bonding, wafer thinning and redistribution structures use deep etch and surface-clean processes, extending etch demand beyond traditional transistor fabrication.
Other Specialty Devices RF, CMOS image sensors, photonics and compound semiconductors require application-specific materials and etch profiles.

Semiconductor Etching Equipment Market Size 2026

Regional Analysis

Asia Pacific dominates the Semiconductor Etching Equipment market through large-scale semiconductor manufacturing in China, Taiwan, South Korea and Japan. North America remains a major advanced-node and equipment-development market, while Europe is expanding power, automotive and specialty semiconductor capacity.

Why is etch-equipment demand concentrated in Asia Pacific?

Etch spending tracks wafer starts, process complexity and new fab equipment installation. Asia Pacific contains the largest installed base of 300 mm logic and memory capacity. North America is expanding leading-edge and memory fabs, Europe is investing in power and automotive semiconductors, and emerging regions create demand when front-end wafer manufacturing moves into volume production.

Region Market position Growth outlook Core demand Commercial priority
Asia Pacific Dominant Very high Foundry, DRAM & NAND Advanced-node precision and fleet scale
North America Major advanced-node market High Logic, memory & equipment R&D Atomic precision and domestic capacity
Europe Specialty growth market Moderate to high Power, automotive & industrial SiC/GaN, lifecycle and process reliability
South America Small Selective Research / specialty Fab installed base
Middle East & Africa Emerging Selective Existing / future fabs Local ecosystem and service
Asia PacificDOMINANT REGIONAL MARKET

Why does Asia Pacific lead etch-equipment demand?

China, Taiwan, South Korea and Japan together represent the largest concentration of semiconductor wafer fabrication. Taiwan drives leading-edge foundry investment, South Korea is a global memory center, China continues broad fab expansion, and Japan combines device manufacturing with major semiconductor-equipment and materials companies.

Market position
Dominant
Growth outlook
Very high
Demand profile
Foundry & memory
Commercial gate
Yield and fleet productivity
Country / cluster Role Market instance
China Large equipment-spending market Mature-node and selected advanced capacity create broad dry and wet etch demand.
Taiwan Leading-edge foundry hub 2 nm and sub-2 nm logic require increasingly precise conductor, dielectric and selective etch.
South Korea Memory center HBM-related DRAM and high-layer 3D NAND drive high-aspect-ratio etch investment.
Japan Equipment / specialty semiconductor hub Tokyo Electron and Hitachi High-Tech participate alongside logic, memory and power-device fabs.
SEMI projects record 300 mm front-end equipment spending in 2026. Foundry and memory are the largest product segments in the latest outlook.
Memory equipment investment is projected above USD 50 billion in 2026. Advanced DRAM and higher-layer NAND require more demanding etch steps.
Tokyo Electron’s current etch portfolio spans dielectric, conductor, RIE and chemical dry etch on 300 mm platforms.
North AmericaADVANCED-NODE & EQUIPMENT R&D

What supports North American growth?

The United States combines leading equipment suppliers, advanced logic design and rapidly growing domestic fab investment. Lam Research and Applied Materials are major etch technology developers, and new logic and memory projects increase local installed-base demand.

Market position
Major advanced-node
Growth outlook
High
Demand profile
Logic, memory & equipment R&D
Commercial gate
Atomic precision and uptime
Country / cluster Role Market instance
United States Primary regional market New advanced logic and memory capacity expands etch tool installation and service demand.
Canada Research / specialty niche Photonics and semiconductor R&D create specialized requirements.
Mexico Limited front-end demand Most semiconductor activity is downstream, so direct etch-equipment demand remains small.
Applied Materials introduced Producer Selectra Mo Etch in June 2026. The system selectively removes molybdenum for wordline separation in advanced 3D NAND.
Lam demonstrated direct ruthenium metal etch with single-exposure high-NA EUV in July 2026. The work targets simpler interconnect patterning at 20 nm metal pitch.
Lam Akara uses a solid-state plasma source for future CFET and 3D DRAM etch. DirectDrive responds to process changes far faster than previous plasma-source architectures.
Europe

What drives European etch-equipment demand?

Europe has strong automotive, power, analog, MEMS and research semiconductor ecosystems. SiC and GaN investment increases demand for trench and contact etch, while research institutes contribute to advanced patterning, MEMS and heterogeneous integration. New regional fabs support additional 300 mm tool installations.

Market position
Specialty growth
Growth outlook

<divstyle=”font-weight:700;color:#0f2a56″>Moderate to high

Demand profile
Power, MEMS & auto
Commercial gate
Material-specific process control
Country / cluster Role Market instance
Germany Power / automotive hub SiC, analog and automotive semiconductors create plasma-etch demand.
France / Italy Analog / power base Specialty fabs use long-lived etch platforms across mature and power nodes.
Benelux R&D ecosystem Advanced patterning and process-development facilities support next-generation etch.
SiC trench etch remains a specialized growth area. Tokyo Electron’s UNITY platform supports Si and SiC trench processing on 200 mm and smaller wafers.
Advanced packaging broadens etch beyond front-end transistors. TSV and wafer-edge processes create additional equipment demand.
European localization reduces supply-chain dependence. New fabs create requirements for local service engineers and spare-parts infrastructure.
South America

How large is the South American opportunity?

The market is small because large front-end wafer fabs are limited. Brazil has the strongest research and specialty electronics base, but most advanced semiconductor equipment is imported and used in low-volume facilities. Significant market expansion would require new wafer-fab investment.

Market position
Small
Growth outlook
Selective
Demand profile
Research & specialty
Commercial gate
Fab investment
Country / cluster Role Market instance
Brazil Largest regional niche Research and specialty semiconductor activity create limited equipment demand.
Argentina Research-led University and technology programs create smaller requirements.
Rest of region Low direct demand Most semiconductor consumption occurs through imported devices.
Etch-equipment demand follows wafer-fab capacity rather than electronics consumption.
Research tools can support MEMS and specialty processes.
Service availability is essential for low-volume remote installations.
Middle East & Africa

Where could future etch demand emerge?

Israel has the strongest established front-end semiconductor base in the region, while Gulf states are evaluating broader semiconductor investment. Etch-equipment purchases become meaningful only after fabs enter tool-installation and process-qualification stages.

Market position
Emerging
Growth outlook
Selective
Demand profile
Existing / future fabs
Commercial gate
Fab commissioning and service
Country / cluster Role Market instance
Israel Established semiconductor niche Existing fabs and R&D create the largest current regional demand.
Saudi Arabia Long-term opportunity Industrial policy can create future demand if front-end projects mature.
UAE Technology investment market Advanced-industry programs create longer-term ecosystem potential.
Regional equipment demand requires real wafer starts.
Process support and spare parts are major entry requirements.
New fabs can adopt newer etch platforms without legacy-tool constraints.

Competitive Landscape

Key participants include Lam Research, Tokyo Electron, Applied Materials, Hitachi High-Tech, SEMES, Advanced Micro-Fabrication Equipment, KLA, NAURA, ULVAC, SPTS Technologies, Plasma-Therm, GigaLane, Oxford Instruments and Beijing E-Town-related equipment suppliers.

Lam Research is one of the strongest pure-play etch technology leaders. Its portfolio spans conductor, dielectric, bevel, atomic-layer and cryogenic etch, with Akara aimed at CFET and 3D DRAM and Flex platforms serving high-aspect-ratio NAND and other demanding applications.

Tokyo Electron competes with Tactras, Episode UL, Certas LEAGA and UNITY platforms. These systems cover conductor, dielectric, reactive-ion and gas chemical etch across 200 mm and 300 mm wafers, including SiC power devices and advanced logic or memory.

Applied Materials combines etch with deposition and materials-engineering expertise. Its 2026 Selectra molybdenum etch targets 3D NAND wordline scaling. Regional suppliers such as AMEC and NAURA are expanding their positions as China localizes semiconductor equipment.

Competitive tier structure

Competitive tier Representative companies Competitive strengths
Global front-end leaders Lam Research; Tokyo Electron; Applied Materials Advanced logic/memory etch, large installed bases, process integration and global service
Specialty / process leaders Hitachi High-Tech; SEMES; SPTS; Oxford Instruments; Plasma-Therm; ULVAC MEMS, compound semiconductor, regional memory and specialty etch expertise
China localization leaders AMEC; NAURA; Beijing E-Town-related suppliers Domestic fab proximity, expanding dry-etch portfolios and localization-driven qualification

Key companies profiled

Lam ResearchTokyo ElectronApplied MaterialsHitachi High-TechSEMESAdvanced Micro-Fabrication Equipment (AMEC)KLANAURAULVACSPTS TechnologiesPlasma-ThermGigaLaneOxford InstrumentsBeijing E-Town-related equipment suppliers

Semiconductor Etch Equipment Capacity & Installed-Base Analysis

Equipment manufacturing capacity depends on vacuum chambers, RF power systems, electrostatic chucks, mass-flow control, plasma sources, precision gas delivery, automation platforms, software and final process qualification. A tool can contain multiple process chambers, so chamber output and platform integration are both relevant measures of manufacturing capacity.

Installed-base service is a major part of capacity economics. Fabs run etch tools continuously and require chamber cleaning, replacement consumables, hardware upgrades and process tuning. Suppliers with large field-service networks can monetize installed systems for many years.

Advanced processes increase tool specialization. A chamber optimized for high-aspect-ratio dielectric etch is not interchangeable with conductor etch, SiC trench etch or selective metal removal. Equipment growth therefore follows both wafer capacity and the number of distinct process steps per device.

Market Dynamics

Growth is driven by AI semiconductor investment, 3D NAND, GAA logic, advanced DRAM, power devices and new fabs. Restraints include very high capital cost, process complexity, hazardous chemistries and long customer qualification. Opportunities center on atomic-layer etch, cryogenic NAND etch, selective metal etch and AI-enabled chamber control.

MARKET DRIVERS

AI increases both logic and memory capital intensity

Accelerators require leading-edge logic, HBM and storage, driving simultaneous investment in foundry, DRAM and NAND equipment.

3D architectures require deeper etch

Higher NAND layer counts and future 3D DRAM increase aspect ratio and process time, raising the value of faster and more precise plasma systems.

GAA logic adds new selective-removal steps

Nanosheet and backside architectures need atomic or highly selective material removal without damaging neighboring layers.

New regional fabs expand the installed base

Localization programs in the U.S., Europe and Asia add complete tool fleets, creating new equipment and service revenue.

Drivers Impact Analysis

Driver Impact Primary markets Time horizon
AI / advanced-node investment High Asia Pacific, North America Short to long term
3D NAND / advanced memory High Korea, China, Japan, U.S. Persistent
GAA / future logic High Taiwan, U.S., Korea Medium to long term
Power / SiC devices Medium to high Europe, Asia, U.S. Persistent

MARKET RESTRAINTS

Advanced etch systems are very expensive

Vacuum, RF, gas and control subsystems create high capital cost, limiting buyers to established fabs and research centers.

Process windows are narrow

Small changes in plasma density, ion energy or wall condition can change critical dimensions and yield.

Etch chemistry creates environmental burden

Fluorinated gases and hazardous chemicals require abatement, monitoring and increasingly efficient process design.

Qualification can take many months

A new chamber must demonstrate yield, repeatability, defectivity and fleet matching before entering volume manufacturing.

Restraints Impact Analysis

Restraint Impact Exposure Time horizon
Capital cost High All fabs Persistent
Process / chamber complexity High Advanced nodes Persistent
Hazardous chemistry / emissions Medium to high Global Persistent
Long process-of-record qualification High New tools Persistent

MARKET OPPORTUNITIES

Scale atomic-layer etch

ALE removes material in controlled cycles and is increasingly useful when device dimensions approach atomic scales.

Expand cryogenic high-aspect-ratio etch

Low-temperature chemistry can increase NAND etch rate while preserving vertical profiles in very deep structures.

Develop selective metal etch

Ruthenium, molybdenum and other new materials need chemistry that removes one film without attacking surrounding layers.

Use AI and digital twins for chamber optimization

Sensor data and process models can shorten recipe development and detect chamber drift before yield loss occurs.

Semiconductor Etching Equipment Value Chain Analysis

Vacuum, RF & precision components

Chambers, generators, gas delivery and electrostatic chucks determine plasma stability.

Tool platform integration

Equipment OEMs combine process modules, wafer handling, sensors and control software.

Fab process qualification

Chipmakers develop recipes and qualify chambers for specific materials and device structures.

High-volume production & service

Tools operate continuously while consumables, cleaning and upgrades sustain yield.

Plasma source design determines process flexibility

RF frequency, source geometry and ion-energy control influence etch rate, directionality and selectivity.

Wafer temperature is tightly coupled to profile

Electrostatic chucks and backside gas control local reaction kinetics and sidewall behavior.

Recipe knowledge creates supplier lock-in

Once a chamber is the process of record, changing equipment can require extensive device requalification.

Service protects fab economics

High utilization means every hour of downtime is costly, making preventive maintenance and spare-part logistics strategically important.

Recent Developments in the Semiconductor Etching Equipment Market

14 July 2026

Lam, ASML and imec demonstrate high-NA EUV ruthenium direct-metal etch

The joint work validated 20 nm metal pitch using single-exposure high-NA EUV and Lam Aether direct metal etch, reducing multipatterning complexity for advanced interconnect.

Primary source

15 June 2026

Applied Materials launches selective molybdenum etch for 3D NAND

Producer Selectra Mo Etch is designed for precise wordline separation in deep 3D NAND structures and is already being used by leading memory manufacturers.

Primary source

27 April 2026

Lam Akara receives 2026 Edison recognition

Lam’s Akara conductor-etch platform was recognized for its solid-state plasma source and high-speed process control targeted at CFET and future 3D memory.

Primary source

14 April 2026

Lam details cryogenic and atomic etch for AI-era 3D devices

Lam highlighted cryogenic NAND etch and expanded ALD/ALE requirements as logic, DRAM and NAND architectures move deeper into three dimensions.

Primary source

Current

Tokyo Electron advances multi-chamber dry and chemical etch platforms

Tactras, Episode UL and Certas LEAGA provide 300 mm dielectric, conductor, reactive-ion and chemical dry etch with flexible chamber configurations.

Primary source

REPORT SCOPE & SEGMENTATION

Attribute Details
Study Period 2019–2034
Base Year 2025
Estimated Year 2026
Forecast Period 2026–2034
Historical Period 2019–2025
Market Size 2025 USD 21.62 billion
Market Size 2034 USD 33.54 billion
Growth Rate 5.0% during 2026–2034
Unit Value (USD Million/Billion) and etch-system shipments
By Type Dry Etching Equipment · Wet Etching Equipment
By Application Logic and Memory · MEMS · Power Device · Others
By Film / Material Conductor Etch · Dielectric Etch · Polysilicon Etch · Metal / Selective Etch · Compound Semiconductor Etch
By Process Technology Reactive Ion Etch · Atomic Layer Etch · Cryogenic Etch · Chemical Dry Etch · Wet Etch
By Region Each region analysed by etch type, application, film/material, process technology and country fab ecosystem
North AmericaUnited States, Canada, Mexico
EuropeGermany, France, Italy, Benelux and other European markets
Asia PacificChina, Taiwan, South Korea, Japan, Southeast Asia and other Asian markets
South AmericaBrazil, Argentina and other South American markets
Middle East & AfricaIsrael, Saudi Arabia, UAE and other MEA markets
Key Companies Profiled Lam Research · Tokyo Electron · Applied Materials · Hitachi High-Tech · SEMES · Advanced Micro-Fabrication Equipment (AMEC) · KLA · NAURA · ULVAC · SPTS Technologies · Plasma-Therm · GigaLane · Oxford Instruments · Beijing E-Town-related equipment suppliers
Customization Scope Free report customization equivalent to up to four analyst working days with purchase. Addition or alteration to country, regional and segment scope.

Frequently Asked Questions

What is the 2025 size of the Semiconductor Etching Equipment market?

The market is valued at USD 21.62 billion in 2025 and is projected to reach USD 33.54 billion by 2034. The 2026 estimate is USD 22.70 billion and the 2026–2034 CAGR is 5.0%.

Which etch-equipment type leads the market?

Dry etching equipment is the largest segment because advanced semiconductor manufacturing requires anisotropic plasma etch with precise profile and selectivity control.

Which application is the largest?

Logic and memory form the largest application group, including advanced foundry, DRAM and 3D NAND production.

Which region leads the market?

Asia Pacific dominates because China, Taiwan, South Korea and Japan contain the largest concentration of semiconductor wafer-fabrication capacity.

What is the estimated market size in 2026?

The 2026 estimated market size is USD 22.70 billion, based on the mathematically consistent growth path between the 2023 and 2032 global market values.

Why is etch becoming more important?

GAA logic, 3D NAND, advanced DRAM and new interconnect materials require deeper structures, tighter dimensions and more selective material removal.

What are the main market restraints?

High capital cost, process complexity, hazardous chemistry management and long process-of-record qualification cycles are the primary restraints.

What is atomic-layer etch?

Atomic-layer etch removes material in controlled cyclic steps, enabling near-atomic thickness control and very high selectivity for advanced devices.

Which companies are active in the market?

Major participants include Lam Research, Tokyo Electron, Applied Materials, Hitachi High-Tech, SEMES, AMEC, KLA, NAURA, ULVAC, SPTS, Plasma-Therm and Oxford Instruments.

What does the report cover?

The report covers dry and wet etch equipment, logic/memory, MEMS and power applications, material and process categories, five global regions, competition, capacity, dynamics, developments and value chain.

Research Sources & Evidence Base

View primary and authoritative evidence used in this overview
  1. Lam Research. Etch Technology Portfolio – Official technical evidence on RIE, ALE, cryogenic, conductor and dielectric etch.
  2. Lam Research. Akara Conductor Etch – Official evidence on solid-state plasma source, CFET, 3D DRAM and advanced process control.
  3. Applied Materials. Selective Etch Systems for 3D Scaling – June 2026 evidence on selective molybdenum etch for advanced 3D NAND.
  4. Tokyo Electron. Tactras Plasma Etch – Official product evidence on 300 mm plasma etch, high-aspect-ratio, dielectric and conductor applications.
  5. Tokyo Electron. Certas Chemical Dry Etch – Official evidence on selective, plasma-free chemical dry etch and 3D-structure processing.
  6. SEMI. 300mm Fab Outlook Q2 2026 – Industry evidence on record 300 mm equipment investment and more than 400 tracked fabs and lines.

Semiconductor Etching Equipment Market, Size, Trends, Business Strategies 2026-2034

Get Sample Report PDF for Exclusive Insights

Report Sample Includes

  • Table of Contents
  • List of Tables & Figures
  • Charts, Research Methodology, and more...

PDF Icon Download Sample Report PDF

Download Sample Report

Table of Content

Table of Contents
1 Research Methodology and Statistical Scope
1.1 Market Definition and Statistical Scope of Semiconductor Etching Equipment
1.2 Key Market Segments
1.2.1 Semiconductor Etching Equipment Segment by Type
1.2.2 Semiconductor Etching Equipment Segment by Application
1.3 Methodology & Sources of Information
1.3.1 Research Methodology
1.3.2 Research Process
1.3.3 Market Breakdown and Data Triangulation
1.3.4 Base Year
1.3.5 Report Assumptions & Caveats
2 Semiconductor Etching Equipment Market Overview
2.1 Global Market Overview
2.1.1 Global Semiconductor Etching Equipment Market Size (M USD) Estimates and Forecasts (2019-2032)
2.1.2 Global Semiconductor Etching Equipment Sales Estimates and Forecasts (2019-2032)
2.2 Market Segment Executive Summary
2.3 Global Market Size by Region
3 Semiconductor Etching Equipment Market Competitive Landscape
3.1 Global Semiconductor Etching Equipment Sales by Manufacturers (2019-2025)
3.2 Global Semiconductor Etching Equipment Revenue Market Share by Manufacturers (2019-2025)
3.3 Semiconductor Etching Equipment Market Share by Company Type (Tier 1, Tier 2, and Tier 3)
3.4 Global Semiconductor Etching Equipment Average Price by Manufacturers (2019-2025)
3.5 Manufacturers Semiconductor Etching Equipment Sales Sites, Area Served, Product Type
3.6 Semiconductor Etching Equipment Market Competitive Situation and Trends
3.6.1 Semiconductor Etching Equipment Market Concentration Rate
3.6.2 Global 5 and 10 Largest Semiconductor Etching Equipment Players Market Share by Revenue
3.6.3 Mergers & Acquisitions, Expansion
4 Semiconductor Etching Equipment Industry Chain Analysis
4.1 Semiconductor Etching Equipment Industry Chain Analysis
4.2 Market Overview of Key Raw Materials
4.3 Midstream Market Analysis
4.4 Downstream Customer Analysis
5 The Development and Dynamics of Semiconductor Etching Equipment Market
5.1 Key Development Trends
5.2 Driving Factors
5.3 Market Challenges
5.4 Market Restraints
5.5 Industry News
5.5.1 New Product Developments
5.5.2 Mergers & Acquisitions
5.5.3 Expansions
5.5.4 Collaboration/Supply Contracts
5.6 Industry Policies
6 Semiconductor Etching Equipment Market Segmentation by Type
6.1 Evaluation Matrix of Segment Market Development Potential (Type)
6.2 Global Semiconductor Etching Equipment Sales Market Share by Type (2019-2025)
6.3 Global Semiconductor Etching Equipment Market Size Market Share by Type (2019-2025)
6.4 Global Semiconductor Etching Equipment Price by Type (2019-2025)
7 Semiconductor Etching Equipment Market Segmentation by Application
7.1 Evaluation Matrix of Segment Market Development Potential (Application)
7.2 Global Semiconductor Etching Equipment Market Sales by Application (2019-2025)
7.3 Global Semiconductor Etching Equipment Market Size (M USD) by Application (2019-2025)
7.4 Global Semiconductor Etching Equipment Sales Growth Rate by Application (2019-2025)
8 Semiconductor Etching Equipment Market Consumption by Region
8.1 Global Semiconductor Etching Equipment Sales by Region
8.1.1 Global Semiconductor Etching Equipment Sales by Region
8.1.2 Global Semiconductor Etching Equipment Sales Market Share by Region
8.2 North America
8.2.1 North America Semiconductor Etching Equipment Sales by Country
8.2.2 U.S.
8.2.3 Canada
8.2.4 Mexico
8.3 Europe
8.3.1 Europe Semiconductor Etching Equipment Sales by Country
8.3.2 Germany
8.3.3 France
8.3.4 U.K.
8.3.5 Italy
8.3.6 Russia
8.4 Asia Pacific
8.4.1 Asia Pacific Semiconductor Etching Equipment Sales by Region
8.4.2 China
8.4.3 Japan
8.4.4 South Korea
8.4.5 India
8.4.6 Southeast Asia
8.5 South America
8.5.1 South America Semiconductor Etching Equipment Sales by Country
8.5.2 Brazil
8.5.3 Argentina
8.5.4 Columbia
8.6 Middle East and Africa
8.6.1 Middle East and Africa Semiconductor Etching Equipment Sales by Region
8.6.2 Saudi Arabia
8.6.3 UAE
8.6.4 Egypt
8.6.5 Nigeria
8.6.6 South Africa
9 Semiconductor Etching Equipment Market Production by Region
9.1 Global Production of Semiconductor Etching Equipment by Region (2019-2025)
9.2 Global Semiconductor Etching Equipment Revenue Market Share by Region (2019-2025)
9.3 Global Semiconductor Etching Equipment Production, Revenue, Price and Gross Margin (2019-2025)
9.4 North America Semiconductor Etching Equipment Production
9.4.1 North America Semiconductor Etching Equipment Production Growth Rate (2019-2025)
9.4.2 North America Semiconductor Etching Equipment Production, Revenue, Price and Gross Margin (2019-2025)
9.5 Europe Semiconductor Etching Equipment Production
9.5.1 Europe Semiconductor Etching Equipment Production Growth Rate (2019-2025)
9.5.2 Europe Semiconductor Etching Equipment Production, Revenue, Price and Gross Margin (2019-2025)
9.6 Japan Semiconductor Etching Equipment Production (2019-2025)
9.6.1 Japan Semiconductor Etching Equipment Production Growth Rate (2019-2025)
9.6.2 Japan Semiconductor Etching Equipment Production, Revenue, Price and Gross Margin (2019-2025)
9.7 China Semiconductor Etching Equipment Production (2019-2025)
9.7.1 China Semiconductor Etching Equipment Production Growth Rate (2019-2025)
9.7.2 China Semiconductor Etching Equipment Production, Revenue, Price and Gross Margin (2019-2025)
10 Key Companies Profile
10.1 Lam Research
10.1.1 Lam Research Semiconductor Etching Equipment Basic Information
10.1.2 Lam Research Semiconductor Etching Equipment Product Overview
10.1.3 Lam Research Semiconductor Etching Equipment Product Market Performance
10.1.4 Lam Research Business Overview
10.1.5 Lam Research Semiconductor Etching Equipment SWOT Analysis
10.1.6 Lam Research Recent Developments
10.2 TEL
10.2.1 TEL Semiconductor Etching Equipment Basic Information
10.2.2 TEL Semiconductor Etching Equipment Product Overview
10.2.3 TEL Semiconductor Etching Equipment Product Market Performance
10.2.4 TEL Business Overview
10.2.5 TEL Semiconductor Etching Equipment SWOT Analysis
10.2.6 TEL Recent Developments
10.3 Applied Materials
10.3.1 Applied Materials Semiconductor Etching Equipment Basic Information
10.3.2 Applied Materials Semiconductor Etching Equipment Product Overview
10.3.3 Applied Materials Semiconductor Etching Equipment Product Market Performance
10.3.4 Applied Materials Semiconductor Etching Equipment SWOT Analysis
10.3.5 Applied Materials Business Overview
10.3.6 Applied Materials Recent Developments
10.4 Hitachi High-Tech
10.4.1 Hitachi High-Tech Semiconductor Etching Equipment Basic Information
10.4.2 Hitachi High-Tech Semiconductor Etching Equipment Product Overview
10.4.3 Hitachi High-Tech Semiconductor Etching Equipment Product Market Performance
10.4.4 Hitachi High-Tech Business Overview
10.4.5 Hitachi High-Tech Recent Developments
10.5 SEMES
10.5.1 SEMES Semiconductor Etching Equipment Basic Information
10.5.2 SEMES Semiconductor Etching Equipment Product Overview
10.5.3 SEMES Semiconductor Etching Equipment Product Market Performance
10.5.4 SEMES Business Overview
10.5.5 SEMES Recent Developments
10.6 Advanced Micro
10.6.1 Advanced Micro Semiconductor Etching Equipment Basic Information
10.6.2 Advanced Micro Semiconductor Etching Equipment Product Overview
10.6.3 Advanced Micro Semiconductor Etching Equipment Product Market Performance
10.6.4 Advanced Micro Business Overview
10.6.5 Advanced Micro Recent Developments
10.7 KLA
10.7.1 KLA Semiconductor Etching Equipment Basic Information
10.7.2 KLA Semiconductor Etching Equipment Product Overview
10.7.3 KLA Semiconductor Etching Equipment Product Market Performance
10.7.4 KLA Business Overview
10.7.5 KLA Recent Developments
10.8 NAURA
10.8.1 NAURA Semiconductor Etching Equipment Basic Information
10.8.2 NAURA Semiconductor Etching Equipment Product Overview
10.8.3 NAURA Semiconductor Etching Equipment Product Market Performance
10.8.4 NAURA Business Overview
10.8.5 NAURA Recent Developments
10.9 ULVAC
10.9.1 ULVAC Semiconductor Etching Equipment Basic Information
10.9.2 ULVAC Semiconductor Etching Equipment Product Overview
10.9.3 ULVAC Semiconductor Etching Equipment Product Market Performance
10.9.4 ULVAC Business Overview
10.9.5 ULVAC Recent Developments
10.10 SPTS Technologies
10.10.1 SPTS Technologies Semiconductor Etching Equipment Basic Information
10.10.2 SPTS Technologies Semiconductor Etching Equipment Product Overview
10.10.3 SPTS Technologies Semiconductor Etching Equipment Product Market Performance
10.10.4 SPTS Technologies Business Overview
10.10.5 SPTS Technologies Recent Developments
10.11 Plasma-Therm
10.11.1 Plasma-Therm Semiconductor Etching Equipment Basic Information
10.11.2 Plasma-Therm Semiconductor Etching Equipment Product Overview
10.11.3 Plasma-Therm Semiconductor Etching Equipment Product Market Performance
10.11.4 Plasma-Therm Business Overview
10.11.5 Plasma-Therm Recent Developments
10.12 GigaLane
10.12.1 GigaLane Semiconductor Etching Equipment Basic Information
10.12.2 GigaLane Semiconductor Etching Equipment Product Overview
10.12.3 GigaLane Semiconductor Etching Equipment Product Market Performance
10.12.4 GigaLane Business Overview
10.12.5 GigaLane Recent Developments
10.13 Oxford Instruments
10.13.1 Oxford Instruments Semiconductor Etching Equipment Basic Information
10.13.2 Oxford Instruments Semiconductor Etching Equipment Product Overview
10.13.3 Oxford Instruments Semiconductor Etching Equipment Product Market Performance
10.13.4 Oxford Instruments Business Overview
10.13.5 Oxford Instruments Recent Developments
10.14 Beijing E-Town
10.14.1 Beijing E-Town Semiconductor Etching Equipment Basic Information
10.14.2 Beijing E-Town Semiconductor Etching Equipment Product Overview
10.14.3 Beijing E-Town Semiconductor Etching Equipment Product Market Performance
10.14.4 Beijing E-Town Business Overview
10.14.5 Beijing E-Town Recent Developments
11 Semiconductor Etching Equipment Market Forecast by Region
11.1 Global Semiconductor Etching Equipment Market Size Forecast
11.2 Global Semiconductor Etching Equipment Market Forecast by Region
11.2.1 North America Market Size Forecast by Country
11.2.2 Europe Semiconductor Etching Equipment Market Size Forecast by Country
11.2.3 Asia Pacific Semiconductor Etching Equipment Market Size Forecast by Region
11.2.4 South America Semiconductor Etching Equipment Market Size Forecast by Country
11.2.5 Middle East and Africa Forecasted Consumption of Semiconductor Etching Equipment by Country
12 Forecast Market by Type and by Application (2025-2032)
12.1 Global Semiconductor Etching Equipment Market Forecast by Type (2025-2032)
12.1.1 Global Forecasted Sales of Semiconductor Etching Equipment by Type (2025-2032)
12.1.2 Global Semiconductor Etching Equipment Market Size Forecast by Type (2025-2032)
12.1.3 Global Forecasted Price of Semiconductor Etching Equipment by Type (2025-2032)
12.2 Global Semiconductor Etching Equipment Market Forecast by Application (2025-2032)
12.2.1 Global Semiconductor Etching Equipment Sales (K Units) Forecast by Application
12.2.2 Global Semiconductor Etching Equipment Market Size (M USD) Forecast by Application (2025-2032)
13 Conclusion and Key FindingsList of Tables
Table 1. Introduction of the Type
Table 2. Introduction of the Application
Table 3. Market Size (M USD) Segment Executive Summary
Table 4. Semiconductor Etching Equipment Market Size Comparison by Region (M USD)
Table 5. Global Semiconductor Etching Equipment Sales (K Units) by Manufacturers (2019-2025)
Table 6. Global Semiconductor Etching Equipment Sales Market Share by Manufacturers (2019-2025)
Table 7. Global Semiconductor Etching Equipment Revenue (M USD) by Manufacturers (2019-2025)
Table 8. Global Semiconductor Etching Equipment Revenue Share by Manufacturers (2019-2025)
Table 9. Company Type (Tier 1, Tier 2, and Tier 3) & (based on the Revenue in Semiconductor Etching Equipment as of 2022)
Table 10. Global Market Semiconductor Etching Equipment Average Price (USD/Unit) of Key Manufacturers (2019-2025)
Table 11. Manufacturers Semiconductor Etching Equipment Sales Sites and Area Served
Table 12. Manufacturers Semiconductor Etching Equipment Product Type
Table 13. Global Semiconductor Etching Equipment Manufacturers Market Concentration Ratio (CR5 and HHI)
Table 14. Mergers & Acquisitions, Expansion Plans
Table 15. Industry Chain Map of Semiconductor Etching Equipment
Table 16. Market Overview of Key Raw Materials
Table 17. Midstream Market Analysis
Table 18. Downstream Customer Analysis
Table 19. Key Development Trends
Table 20. Driving Factors
Table 21. Semiconductor Etching Equipment Market Challenges
Table 22. Global Semiconductor Etching Equipment Sales by Type (K Units)
Table 23. Global Semiconductor Etching Equipment Market Size by Type (M USD)
Table 24. Global Semiconductor Etching Equipment Sales (K Units) by Type (2019-2025)
Table 25. Global Semiconductor Etching Equipment Sales Market Share by Type (2019-2025)
Table 26. Global Semiconductor Etching Equipment Market Size (M USD) by Type (2019-2025)
Table 27. Global Semiconductor Etching Equipment Market Size Share by Type (2019-2025)
Table 28. Global Semiconductor Etching Equipment Price (USD/Unit) by Type (2019-2025)
Table 29. Global Semiconductor Etching Equipment Sales (K Units) by Application
Table 30. Global Semiconductor Etching Equipment Market Size by Application
Table 31. Global Semiconductor Etching Equipment Sales by Application (2019-2025) & (K Units)
Table 32. Global Semiconductor Etching Equipment Sales Market Share by Application (2019-2025)
Table 33. Global Semiconductor Etching Equipment Sales by Application (2019-2025) & (M USD)
Table 34. Global Semiconductor Etching Equipment Market Share by Application (2019-2025)
Table 35. Global Semiconductor Etching Equipment Sales Growth Rate by Application (2019-2025)
Table 36. Global Semiconductor Etching Equipment Sales by Region (2019-2025) & (K Units)
Table 37. Global Semiconductor Etching Equipment Sales Market Share by Region (2019-2025)
Table 38. North America Semiconductor Etching Equipment Sales by Country (2019-2025) & (K Units)
Table 39. Europe Semiconductor Etching Equipment Sales by Country (2019-2025) & (K Units)
Table 40. Asia Pacific Semiconductor Etching Equipment Sales by Region (2019-2025) & (K Units)
Table 41. South America Semiconductor Etching Equipment Sales by Country (2019-2025) & (K Units)
Table 42. Middle East and Africa Semiconductor Etching Equipment Sales by Region (2019-2025) & (K Units)
Table 43. Global Semiconductor Etching Equipment Production (K Units) by Region (2019-2025)
Table 44. Global Semiconductor Etching Equipment Revenue (US$ Million) by Region (2019-2025)
Table 45. Global Semiconductor Etching Equipment Revenue Market Share by Region (2019-2025)
Table 46. Global Semiconductor Etching Equipment Production (K Units), Revenue (US$ Million), Price (USD/Unit) and Gross Margin (2019-2025)
Table 47. North America Semiconductor Etching Equipment Production (K Units), Revenue (US$ Million), Price (USD/Unit) and Gross Margin (2019-2025)
Table 48. Europe Semiconductor Etching Equipment Production (K Units), Revenue (US$ Million), Price (USD/Unit) and Gross Margin (2019-2025)
Table 49. Japan Semiconductor Etching Equipment Production (K Units), Revenue (US$ Million), Price (USD/Unit) and Gross Margin (2019-2025)
Table 50. China Semiconductor Etching Equipment Production (K Units), Revenue (US$ Million), Price (USD/Unit) and Gross Margin (2019-2025)
Table 51. Lam Research Semiconductor Etching Equipment Basic Information
Table 52. Lam Research Semiconductor Etching Equipment Product Overview
Table 53. Lam Research Semiconductor Etching Equipment Sales (K Units), Revenue (M USD), Price (USD/Unit) and Gross Margin (2019-2025)
Table 54. Lam Research Business Overview
Table 55. Lam Research Semiconductor Etching Equipment SWOT Analysis
Table 56. Lam Research Recent Developments
Table 57. TEL Semiconductor Etching Equipment Basic Information
Table 58. TEL Semiconductor Etching Equipment Product Overview
Table 59. TEL Semiconductor Etching Equipment Sales (K Units), Revenue (M USD), Price (USD/Unit) and Gross Margin (2019-2025)
Table 60. TEL Business Overview
Table 61. TEL Semiconductor Etching Equipment SWOT Analysis
Table 62. TEL Recent Developments
Table 63. Applied Materials Semiconductor Etching Equipment Basic Information
Table 64. Applied Materials Semiconductor Etching Equipment Product Overview
Table 65. Applied Materials Semiconductor Etching Equipment Sales (K Units), Revenue (M USD), Price (USD/Unit) and Gross Margin (2019-2025)
Table 66. Applied Materials Semiconductor Etching Equipment SWOT Analysis
Table 67. Applied Materials Business Overview
Table 68. Applied Materials Recent Developments
Table 69. Hitachi High-Tech Semiconductor Etching Equipment Basic Information
Table 70. Hitachi High-Tech Semiconductor Etching Equipment Product Overview
Table 71. Hitachi High-Tech Semiconductor Etching Equipment Sales (K Units), Revenue (M USD), Price (USD/Unit) and Gross Margin (2019-2025)
Table 72. Hitachi High-Tech Business Overview
Table 73. Hitachi High-Tech Recent Developments
Table 74. SEMES Semiconductor Etching Equipment Basic Information
Table 75. SEMES Semiconductor Etching Equipment Product Overview
Table 76. SEMES Semiconductor Etching Equipment Sales (K Units), Revenue (M USD), Price (USD/Unit) and Gross Margin (2019-2025)
Table 77. SEMES Business Overview
Table 78. SEMES Recent Developments
Table 79. Advanced Micro Semiconductor Etching Equipment Basic Information
Table 80. Advanced Micro Semiconductor Etching Equipment Product Overview
Table 81. Advanced Micro Semiconductor Etching Equipment Sales (K Units), Revenue (M USD), Price (USD/Unit) and Gross Margin (2019-2025)
Table 82. Advanced Micro Business Overview
Table 83. Advanced Micro Recent Developments
Table 84. KLA Semiconductor Etching Equipment Basic Information
Table 85. KLA Semiconductor Etching Equipment Product Overview
Table 86. KLA Semiconductor Etching Equipment Sales (K Units), Revenue (M USD), Price (USD/Unit) and Gross Margin (2019-2025)
Table 87. KLA Business Overview
Table 88. KLA Recent Developments
Table 89. NAURA Semiconductor Etching Equipment Basic Information
Table 90. NAURA Semiconductor Etching Equipment Product Overview
Table 91. NAURA Semiconductor Etching Equipment Sales (K Units), Revenue (M USD), Price (USD/Unit) and Gross Margin (2019-2025)
Table 92. NAURA Business Overview
Table 93. NAURA Recent Developments
Table 94. ULVAC Semiconductor Etching Equipment Basic Information
Table 95. ULVAC Semiconductor Etching Equipment Product Overview
Table 96. ULVAC Semiconductor Etching Equipment Sales (K Units), Revenue (M USD), Price (USD/Unit) and Gross Margin (2019-2025)
Table 97. ULVAC Business Overview
Table 98. ULVAC Recent Developments
Table 99. SPTS Technologies Semiconductor Etching Equipment Basic Information
Table 100. SPTS Technologies Semiconductor Etching Equipment Product Overview
Table 101. SPTS Technologies Semiconductor Etching Equipment Sales (K Units), Revenue (M USD), Price (USD/Unit) and Gross Margin (2019-2025)
Table 102. SPTS Technologies Business Overview
Table 103. SPTS Technologies Recent Developments
Table 104. Plasma-Therm Semiconductor Etching Equipment Basic Information
Table 105. Plasma-Therm Semiconductor Etching Equipment Product Overview
Table 106. Plasma-Therm Semiconductor Etching Equipment Sales (K Units), Revenue (M USD), Price (USD/Unit) and Gross Margin (2019-2025)
Table 107. Plasma-Therm Business Overview
Table 108. Plasma-Therm Recent Developments
Table 109. GigaLane Semiconductor Etching Equipment Basic Information
Table 110. GigaLane Semiconductor Etching Equipment Product Overview
Table 111. GigaLane Semiconductor Etching Equipment Sales (K Units), Revenue (M USD), Price (USD/Unit) and Gross Margin (2019-2025)
Table 112. GigaLane Business Overview
Table 113. GigaLane Recent Developments
Table 114. Oxford Instruments Semiconductor Etching Equipment Basic Information
Table 115. Oxford Instruments Semiconductor Etching Equipment Product Overview
Table 116. Oxford Instruments Semiconductor Etching Equipment Sales (K Units), Revenue (M USD), Price (USD/Unit) and Gross Margin (2019-2025)
Table 117. Oxford Instruments Business Overview
Table 118. Oxford Instruments Recent Developments
Table 119. Beijing E-Town Semiconductor Etching Equipment Basic Information
Table 120. Beijing E-Town Semiconductor Etching Equipment Product Overview
Table 121. Beijing E-Town Semiconductor Etching Equipment Sales (K Units), Revenue (M USD), Price (USD/Unit) and Gross Margin (2019-2025)
Table 122. Beijing E-Town Business Overview
Table 123. Beijing E-Town Recent Developments
Table 124. Global Semiconductor Etching Equipment Sales Forecast by Region (2025-2032) & (K Units)
Table 125. Global Semiconductor Etching Equipment Market Size Forecast by Region (2025-2032) & (M USD)
Table 126. North America Semiconductor Etching Equipment Sales Forecast by Country (2025-2032) & (K Units)
Table 127. North America Semiconductor Etching Equipment Market Size Forecast by Country (2025-2032) & (M USD)
Table 128. Europe Semiconductor Etching Equipment Sales Forecast by Country (2025-2032) & (K Units)
Table 129. Europe Semiconductor Etching Equipment Market Size Forecast by Country (2025-2032) & (M USD)
Table 130. Asia Pacific Semiconductor Etching Equipment Sales Forecast by Region (2025-2032) & (K Units)
Table 131. Asia Pacific Semiconductor Etching Equipment Market Size Forecast by Region (2025-2032) & (M USD)
Table 132. South America Semiconductor Etching Equipment Sales Forecast by Country (2025-2032) & (K Units)
Table 133. South America Semiconductor Etching Equipment Market Size Forecast by Country (2025-2032) & (M USD)
Table 134. Middle East and Africa Semiconductor Etching Equipment Consumption Forecast by Country (2025-2032) & (Units)
Table 135. Middle East and Africa Semiconductor Etching Equipment Market Size Forecast by Country (2025-2032) & (M USD)
Table 136. Global Semiconductor Etching Equipment Sales Forecast by Type (2025-2032) & (K Units)
Table 137. Global Semiconductor Etching Equipment Market Size Forecast by Type (2025-2032) & (M USD)
Table 138. Global Semiconductor Etching Equipment Price Forecast by Type (2025-2032) & (USD/Unit)
Table 139. Global Semiconductor Etching Equipment Sales (K Units) Forecast by Application (2025-2032)
Table 140. Global Semiconductor Etching Equipment Market Size Forecast by Application (2025-2032) & (M USD)
List of Figures
Figure 1. Product Picture of Semiconductor Etching Equipment
Figure 2. Data Triangulation
Figure 3. Key Caveats
Figure 4. Global Semiconductor Etching Equipment Market Size (M USD), 2019-2032
Figure 5. Global Semiconductor Etching Equipment Market Size (M USD) (2019-2032)
Figure 6. Global Semiconductor Etching Equipment Sales (K Units) & (2019-2032)
Figure 7. Evaluation Matrix of Segment Market Development Potential (Type)
Figure 8. Evaluation Matrix of Segment Market Development Potential (Application)
Figure 9. Evaluation Matrix of Regional Market Development Potential
Figure 10. Semiconductor Etching Equipment Market Size by Country (M USD)
Figure 11. Semiconductor Etching Equipment Sales Share by Manufacturers in 2023
Figure 12. Global Semiconductor Etching Equipment Revenue Share by Manufacturers in 2023
Figure 13. Semiconductor Etching Equipment Market Share by Company Type (Tier 1, Tier 2 and Tier 3): 2023
Figure 14. Global Market Semiconductor Etching Equipment Average Price (USD/Unit) of Key Manufacturers in 2023
Figure 15. The Global 5 and 10 Largest Players: Market Share by Semiconductor Etching Equipment Revenue in 2023
Figure 16. Evaluation Matrix of Segment Market Development Potential (Type)
Figure 17. Global Semiconductor Etching Equipment Market Share by Type
Figure 18. Sales Market Share of Semiconductor Etching Equipment by Type (2019-2025)
Figure 19. Sales Market Share of Semiconductor Etching Equipment by Type in 2023
Figure 20. Market Size Share of Semiconductor Etching Equipment by Type (2019-2025)
Figure 21. Market Size Market Share of Semiconductor Etching Equipment by Type in 2023
Figure 22. Evaluation Matrix of Segment Market Development Potential (Application)
Figure 23. Global Semiconductor Etching Equipment Market Share by Application
Figure 24. Global Semiconductor Etching Equipment Sales Market Share by Application (2019-2025)
Figure 25. Global Semiconductor Etching Equipment Sales Market Share by Application in 2023
Figure 26. Global Semiconductor Etching Equipment Market Share by Application (2019-2025)
Figure 27. Global Semiconductor Etching Equipment Market Share by Application in 2023
Figure 28. Global Semiconductor Etching Equipment Sales Growth Rate by Application (2019-2025)
Figure 29. Global Semiconductor Etching Equipment Sales Market Share by Region (2019-2025)
Figure 30. North America Semiconductor Etching Equipment Sales and Growth Rate (2019-2025) & (K Units)
Figure 31. North America Semiconductor Etching Equipment Sales Market Share by Country in 2023
Figure 32. U.S. Semiconductor Etching Equipment Sales and Growth Rate (2019-2025) & (K Units)
Figure 33. Canada Semiconductor Etching Equipment Sales (K Units) and Growth Rate (2019-2025)
Figure 34. Mexico Semiconductor Etching Equipment Sales (Units) and Growth Rate (2019-2025)
Figure 35. Europe Semiconductor Etching Equipment Sales and Growth Rate (2019-2025) & (K Units)
Figure 36. Europe Semiconductor Etching Equipment Sales Market Share by Country in 2023
Figure 37. Germany Semiconductor Etching Equipment Sales and Growth Rate (2019-2025) & (K Units)
Figure 38. France Semiconductor Etching Equipment Sales and Growth Rate (2019-2025) & (K Units)
Figure 39. U.K. Semiconductor Etching Equipment Sales and Growth Rate (2019-2025) & (K Units)
Figure 40. Italy Semiconductor Etching Equipment Sales and Growth Rate (2019-2025) & (K Units)
Figure 41. Russia Semiconductor Etching Equipment Sales and Growth Rate (2019-2025) & (K Units)
Figure 42. Asia Pacific Semiconductor Etching Equipment Sales and Growth Rate (K Units)
Figure 43. Asia Pacific Semiconductor Etching Equipment Sales Market Share by Region in 2023
Figure 44. China Semiconductor Etching Equipment Sales and Growth Rate (2019-2025) & (K Units)
Figure 45. Japan Semiconductor Etching Equipment Sales and Growth Rate (2019-2025) & (K Units)
Figure 46. South Korea Semiconductor Etching Equipment Sales and Growth Rate (2019-2025) & (K Units)
Figure 47. India Semiconductor Etching Equipment Sales and Growth Rate (2019-2025) & (K Units)
Figure 48. Southeast Asia Semiconductor Etching Equipment Sales and Growth Rate (2019-2025) & (K Units)
Figure 49. South America Semiconductor Etching Equipment Sales and Growth Rate (K Units)
Figure 50. South America Semiconductor Etching Equipment Sales Market Share by Country in 2023
Figure 51. Brazil Semiconductor Etching Equipment Sales and Growth Rate (2019-2025) & (K Units)
Figure 52. Argentina Semiconductor Etching Equipment Sales and Growth Rate (2019-2025) & (K Units)
Figure 53. Columbia Semiconductor Etching Equipment Sales and Growth Rate (2019-2025) & (K Units)
Figure 54. Middle East and Africa Semiconductor Etching Equipment Sales and Growth Rate (K Units)
Figure 55. Middle East and Africa Semiconductor Etching Equipment Sales Market Share by Region in 2023
Figure 56. Saudi Arabia Semiconductor Etching Equipment Sales and Growth Rate (2019-2025) & (K Units)
Figure 57. UAE Semiconductor Etching Equipment Sales and Growth Rate (2019-2025) & (K Units)
Figure 58. Egypt Semiconductor Etching Equipment Sales and Growth Rate (2019-2025) & (K Units)
Figure 59. Nigeria Semiconductor Etching Equipment Sales and Growth Rate (2019-2025) & (K Units)
Figure 60. South Africa Semiconductor Etching Equipment Sales and Growth Rate (2019-2025) & (K Units)
Figure 61. Global Semiconductor Etching Equipment Production Market Share by Region (2019-2025)
Figure 62. North America Semiconductor Etching Equipment Production (K Units) Growth Rate (2019-2025)
Figure 63. Europe Semiconductor Etching Equipment Production (K Units) Growth Rate (2019-2025)
Figure 64. Japan Semiconductor Etching Equipment Production (K Units) Growth Rate (2019-2025)
Figure 65. China Semiconductor Etching Equipment Production (K Units) Growth Rate (2019-2025)
Figure 66. Global Semiconductor Etching Equipment Sales Forecast by Volume (2019-2032) & (K Units)
Figure 67. Global Semiconductor Etching Equipment Market Size Forecast by Value (2019-2032) & (M USD)
Figure 68. Global Semiconductor Etching Equipment Sales Market Share Forecast by Type (2025-2032)
Figure 69. Global Semiconductor Etching Equipment Market Share Forecast by Type (2025-2032)
Figure 70. Global Semiconductor Etching Equipment Sales Forecast by Application (2025-2032)
Figure 71. Global Semiconductor Etching Equipment Market Share Forecast by Application (2025-2032)