Semiconductor Dry Vacuum Pump Market, Global Outlook and Forecast 2026-2034

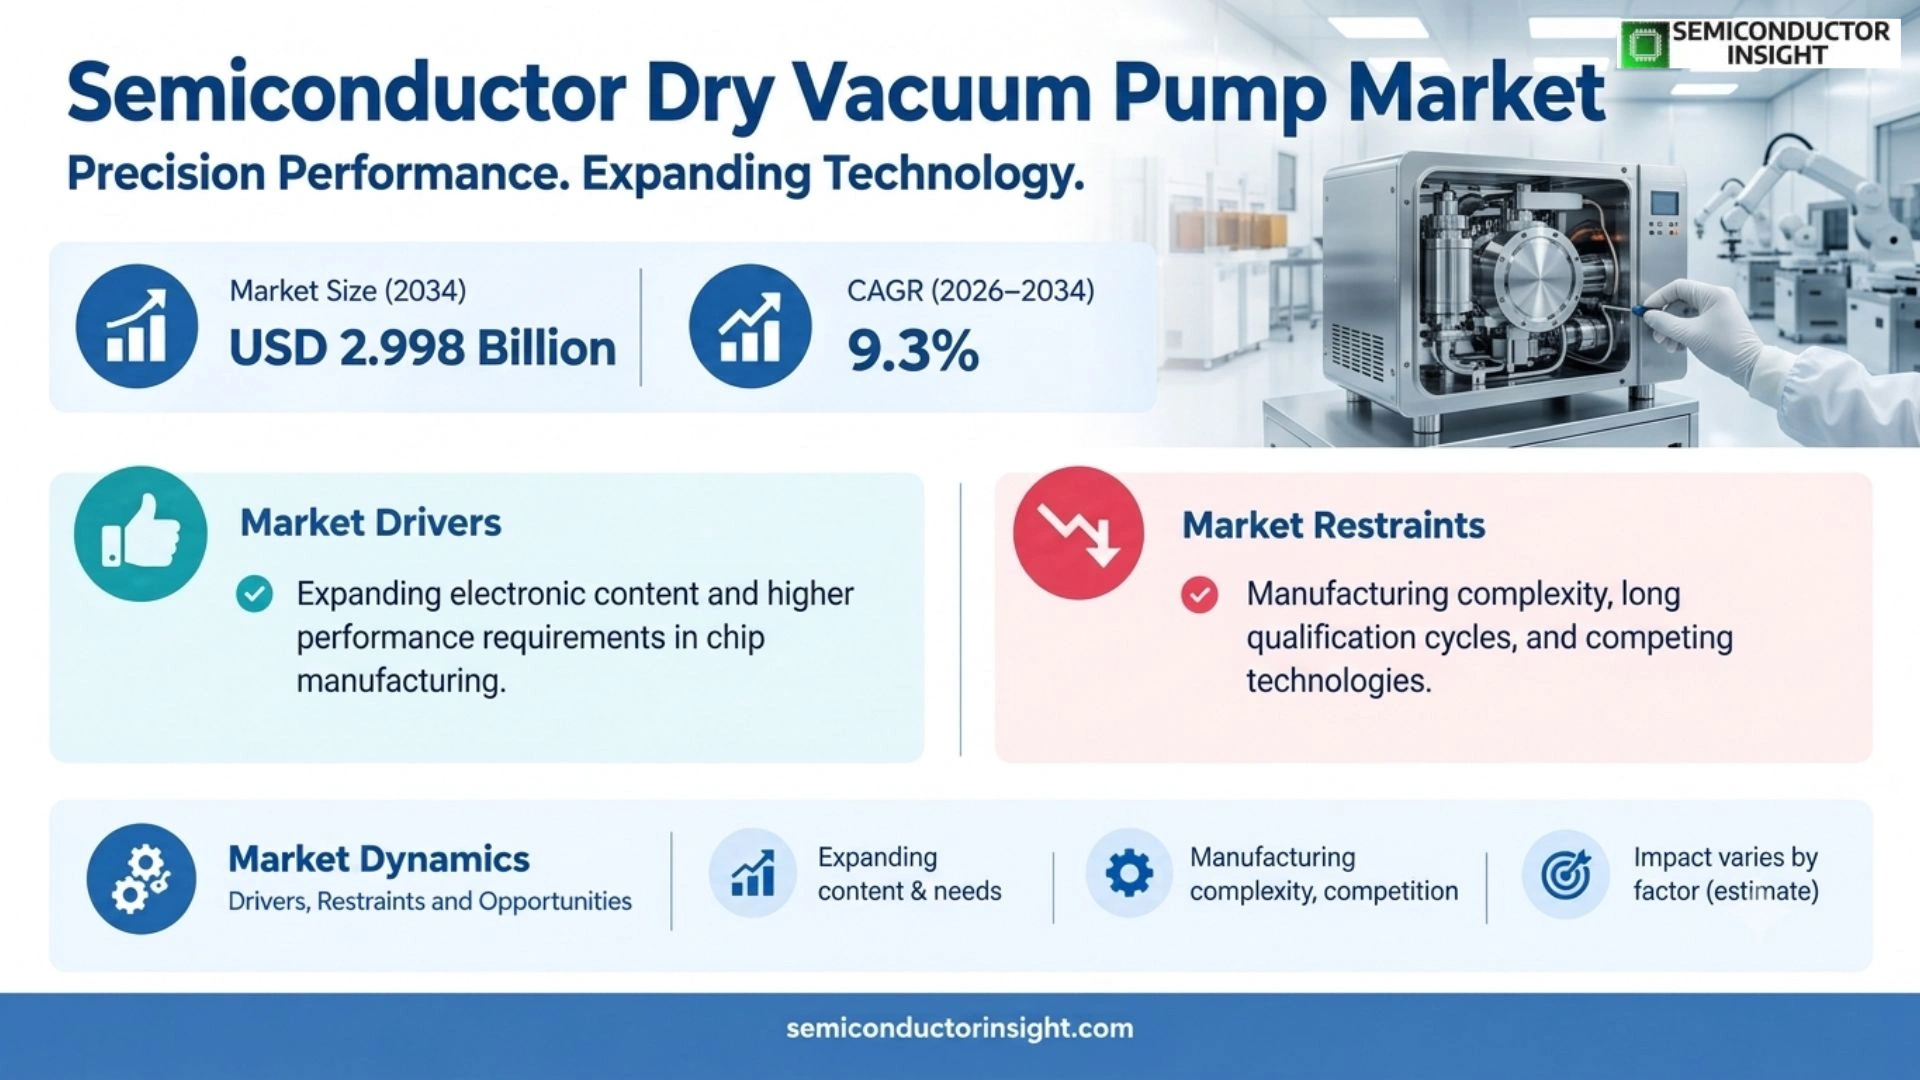
Semiconductor Dry Vacuum Pump Market was valued at USD 1.345 billion in 2025 and is projected to reach USD 2.998 billion by 2034, growing at a CAGR of 9.3% during 2026–2034. Asia Pacific held the largest regional position in 2025, supported by concentrated manufacturing, downstream electronics production and established component supply networks.

PDF Icon Download Sample Report PDF
  • Quick Dispatch

    All Orders

  • Secure Payment

    100% Secure Payment

Price range: $1,500.00 through $4,250.00

Clear

Key Statistics

2025 Market Size
USD 1.345 billion
2034 Projected Size
USD 2.998 billion
CAGR (2026–2034)
9.3%
Largest Market in 2025
Asia Pacific

Key Takeaways

  • The Semiconductor Dry Vacuum Pump Market was valued at USD 1.345 billion in the 2025 base year and is projected to reach USD 2.998 billion by 2034, expanding at a 9.3% CAGR during 2026–2034.
  • Screw Vacuum Pump is a leading product grouping because customers value qualified performance, integration readiness, and lifecycle support.
  • CVD and PVD is a major demand centre, while adjacent uses broaden the addressable opportunity.
  • Asia Pacific leads the regional market through concentrated manufacturing, customers, and technology investment.
  • Reliability, qualification, software or service, and total ownership economics shape competition.

Semiconductor Dry Vacuum Pump Market Overview

Semiconductor Dry Vacuum Pump Market was valued at USD 1.345 billion in 2025 and is projected to reach USD 2.998 billion by 2034, growing at a CAGR of 9.3% during 2026–2034. Asia Pacific held the largest regional position in 2025, supported by concentrated manufacturing, downstream electronics production and established component supply networks.

Base year: 2025 · Estimated year: 2026 · Forecast year: 2034 · Historical data: 2021–2025 · Values in USD; volumes reported where disclosed

Semiconductor dry vacuum pumps generate oil-free vacuum for deposition, etching, lithography, implantation, thermal processing, metrology, and wafer-handling systems. Screw, scroll, claw, and hybrid architectures remove process gases without introducing lubricants into the chamber environment. Product value depends on pumping speed, ultimate pressure, particle control, corrosion resistance, exhaust management, uptime, energy use, footprint, and serviceability.

The 2026 estimated year begins with fab expansion, advanced-node process complexity, mature-node capacity, power-semiconductor investment, and demand for cleaner and more efficient process equipment. Dry pumps must tolerate corrosive gases, by-products, temperature variation, and frequent cycling while maintaining stable performance. Customers increasingly compare total ownership cost, abatement compatibility, predictive maintenance, and service response.

The market is an integrated equipment and service ecosystem. Pump selection depends on chamber chemistry, pressure range, gas load, throughput, abatement, facility utilities, and tool architecture. Suppliers that provide pump, exhaust, monitoring, rebuild, spare-parts, and application engineering capability can secure longer customer relationships than component-only vendors. The analysis also considers qualification requirements, supplier capability, regional purchasing conditions, technology substitution, operating economics, implementation risk, customer procurement cycles, lifecycle support, regulatory context, and evidence required for sustained commercial adoption through the forecast period.

Segment Analysis: By Type

By type, the Semiconductor Dry Vacuum Pump market is segmented into Screw Vacuum Pump · Scroll Vacuum Pump · Claw Vacuum Pump · Other Dry Pump Architectures. Each category represents a different degree of integration, qualification burden and value capture, so suppliers compete through a combination of material performance, design support, manufacturing consistency, package architecture and application-specific testing rather than through unit price alone. Procurement also reflects lifecycle support, interoperability, compliance evidence, warranty exposure, and the cost of unsuccessful qualification.

Type Market relevance
Screw Vacuum Pump Distinct performance, condition, integration, and qualification requirements shape demand and supplier positioning.
Scroll Vacuum Pump Distinct performance, condition, integration, and qualification requirements shape demand and supplier positioning.
Claw Vacuum Pump Distinct performance, condition, integration, and qualification requirements shape demand and supplier positioning.
Other Dry Pump Architectures Distinct performance, condition, integration, and qualification requirements shape demand and supplier positioning.

Segment Analysis: By Application

By application, the market covers CVD and PVD · Lithography and Etching · Implant and Thermal Processing · Other Semiconductor Processes. Demand varies by production volume and qualification intensity: consumer programmes reward scale and miniaturisation, while automotive, industrial, aerospace, medical or security designs place greater weight on reliability evidence, long product availability and system-level performance under demanding operating conditions. Channel design, documentation, service coverage, and total ownership economics further determine which application converts technical interest into repeat purchasing.

Application Market relevance
CVD and PVD Purchasing criteria reflect use-case economics, technical requirements, warranty expectations, and channel support.
Lithography and Etching Purchasing criteria reflect use-case economics, technical requirements, warranty expectations, and channel support.
Implant and Thermal Processing Purchasing criteria reflect use-case economics, technical requirements, warranty expectations, and channel support.
Other Semiconductor Processes Purchasing criteria reflect use-case economics, technical requirements, warranty expectations, and channel support.

Semiconductor Dry Vacuum Pump Market Outlook

Regional Analysis

Asia Pacific is the largest regional market for Semiconductor Dry Vacuum Pump products, combining an established component-production ecosystem with major downstream customers. North America and Europe are strategically important for premium, automotive, aerospace, industrial and specialised applications, while South America and Middle East & Africa are primarily import- and project-led markets where distributor reach, local support and supply continuity shape vendor selection.

How does regional demand differ across this market?

For Semiconductor Dry Vacuum Pump, Asia Pacific holds the largest position, supported by an established customer base, supplier presence, and mature purchasing channels. Europe contributes regulation, industrial demand, and technical expertise, while Asia Pacific combines electronics manufacturing, large device populations, and expanding engineering capability. South America and the Middle East and Africa develop through targeted infrastructure, enterprise, research, consumer, or public-sector programs rather than uniform adoption.

Region Position
North America Developing demand shaped by local applications, channels, and qualification conditions
Europe Developing demand shaped by local applications, channels, and qualification conditions
Asia Pacific Largest and most established demand base
South America Developing demand shaped by local applications, channels, and qualification conditions
Middle East & Africa Developing demand shaped by local applications, channels, and qualification conditions
Asia Pacific LARGEST & FASTEST-GROWING

Why is North America strategically important?

North America demand for Semiconductor Dry Vacuum Pump reflects its mix of research, industrial, consumer, enterprise, infrastructure, and technology investment. Commercial outcomes depend on local procurement, technical or quality qualification, channel trust, service coverage, and total ownership economics. The region is assessed separately because adoption conditions and routes to market differ materially across countries, even when the underlying product or measurement need is similar.

Market positionLargest region
Growth outlookAbove market average
Demand profileProduction and demand hub
Market access gateScale and local qualification
Indicator Assessment
Demand base Application- and program-led
Supplier access Direct sales, partners, distributors, or marketplaces
Decision criteria Performance, quality, compliance, price, and support

Market instances

  • Official and industry evidence for North America shows that adoption is tied to documented performance, repair or measurement capability, and dependable after-sales support. The report therefore evaluates concrete programs, regulatory signals, supplier activity, channel maturity, and customer requirements rather than treating population or headline technology spending as a direct proxy for market revenue. Source Source
  • 2025–2026 commercial signal. Asia Pacific demand is governed by the same application and qualification conditions described above, but purchasing decisions are made through local OEM programmes, distributors and technical approvals. Suppliers that document electrical performance, reliability and continuity of supply can convert a regional deployment into repeat orders; vendors relying only on headline pricing face a slower qualification path.
  • 2026–2034 execution issue. Growth in Asia Pacific will depend on whether suppliers align manufacturing, field engineering and inventory with the region’s downstream customers. The practical opportunity is not uniform across every country: it concentrates where device assembly, telecom investment, vehicle production, industrial automation or security deployment creates a repeatable design-in pipeline backed by local technical support.
In the full report: country-level market size, sales volume, pricing, application mix and CAGR for every market listed above across 2021–2034.
North America HIGH-VALUE SPECIALTY

Why is Europe strategically important?

Europe demand for Semiconductor Dry Vacuum Pump reflects its mix of research, industrial, consumer, enterprise, infrastructure, and technology investment. Commercial outcomes depend on local procurement, technical or quality qualification, channel trust, service coverage, and total ownership economics. The region is assessed separately because adoption conditions and routes to market differ materially across countries, even when the underlying product or measurement need is similar.

Market positionHigh-value market
Growth outlookModerate
Demand profileSpecialty demand
Market access gateReliability and long-term support
Indicator Assessment
Demand base Application- and program-led
Supplier access Direct sales, partners, distributors, or marketplaces
Decision criteria Performance, quality, compliance, price, and support

Market instances

  • Official and industry evidence for Europe shows that adoption is tied to documented performance, repair or measurement capability, and dependable after-sales support. The report therefore evaluates concrete programs, regulatory signals, supplier activity, channel maturity, and customer requirements rather than treating population or headline technology spending as a direct proxy for market revenue. Source Source
  • 2025–2026 commercial signal. North America demand is governed by the same application and qualification conditions described above, but purchasing decisions are made through local OEM programmes, distributors and technical approvals. Suppliers that document electrical performance, reliability and continuity of supply can convert a regional deployment into repeat orders; vendors relying only on headline pricing face a slower qualification path.
  • 2026–2034 execution issue. Growth in North America will depend on whether suppliers align manufacturing, field engineering and inventory with the region’s downstream customers. The practical opportunity is not uniform across every country: it concentrates where device assembly, telecom investment, vehicle production, industrial automation or security deployment creates a repeatable design-in pipeline backed by local technical support.
In the full report: country-level market size, sales volume, pricing, application mix and CAGR for every market listed above across 2021–2034.
Europe AUTOMOTIVE & INDUSTRIAL

Why is Asia Pacific strategically important?

Asia Pacific demand for Semiconductor Dry Vacuum Pump reflects its mix of research, industrial, consumer, enterprise, infrastructure, and technology investment. Commercial outcomes depend on local procurement, technical or quality qualification, channel trust, service coverage, and total ownership economics. The region is assessed separately because adoption conditions and routes to market differ materially across countries, even when the underlying product or measurement need is similar.

Market positionEstablished market
Growth outlookSteady
Demand profileQualification led
Market access gateAutomotive or industrial approval
Indicator Assessment
Demand base Application- and program-led
Supplier access Direct sales, partners, distributors, or marketplaces
Decision criteria Performance, quality, compliance, price, and support

Market instances

  • Official and industry evidence for Asia Pacific shows that adoption is tied to documented performance, repair or measurement capability, and dependable after-sales support. The report therefore evaluates concrete programs, regulatory signals, supplier activity, channel maturity, and customer requirements rather than treating population or headline technology spending as a direct proxy for market revenue. Source Source
  • 2025–2026 commercial signal. Europe demand is governed by the same application and qualification conditions described above, but purchasing decisions are made through local OEM programmes, distributors and technical approvals. Suppliers that document electrical performance, reliability and continuity of supply can convert a regional deployment into repeat orders; vendors relying only on headline pricing face a slower qualification path.
  • 2026–2034 execution issue. Growth in Europe will depend on whether suppliers align manufacturing, field engineering and inventory with the region’s downstream customers. The practical opportunity is not uniform across every country: it concentrates where device assembly, telecom investment, vehicle production, industrial automation or security deployment creates a repeatable design-in pipeline backed by local technical support.
In the full report: country-level market size, sales volume, pricing, application mix and CAGR for every market listed above across 2021–2034.
South America IMPORT-LED

Why is South America strategically important?

South America demand for Semiconductor Dry Vacuum Pump reflects its mix of research, industrial, consumer, enterprise, infrastructure, and technology investment. Commercial outcomes depend on local procurement, technical or quality qualification, channel trust, service coverage, and total ownership economics. The region is assessed separately because adoption conditions and routes to market differ materially across countries, even when the underlying product or measurement need is similar.

Market positionEmerging market
Growth outlookSelective growth
Demand profileImport dependent
Market access gateLanded cost and distribution
Indicator Assessment
Demand base Application- and program-led
Supplier access Direct sales, partners, distributors, or marketplaces
Decision criteria Performance, quality, compliance, price, and support

Market instances

  • Official and industry evidence for South America shows that adoption is tied to documented performance, repair or measurement capability, and dependable after-sales support. The report therefore evaluates concrete programs, regulatory signals, supplier activity, channel maturity, and customer requirements rather than treating population or headline technology spending as a direct proxy for market revenue. Source Source
  • 2025–2026 commercial signal. South America demand is governed by the same application and qualification conditions described above, but purchasing decisions are made through local OEM programmes, distributors and technical approvals. Suppliers that document electrical performance, reliability and continuity of supply can convert a regional deployment into repeat orders; vendors relying only on headline pricing face a slower qualification path.
  • 2026–2034 execution issue. Growth in South America will depend on whether suppliers align manufacturing, field engineering and inventory with the region’s downstream customers. The practical opportunity is not uniform across every country: it concentrates where device assembly, telecom investment, vehicle production, industrial automation or security deployment creates a repeatable design-in pipeline backed by local technical support.
In the full report: country-level market size, sales volume, pricing, application mix and CAGR for every market listed above across 2021–2034.
Middle East & Africa

Why is Middle East & Africa strategically important?

Middle East & Africa demand for Semiconductor Dry Vacuum Pump reflects its mix of research, industrial, consumer, enterprise, infrastructure, and technology investment. Commercial outcomes depend on local procurement, technical or quality qualification, channel trust, service coverage, and total ownership economics. The region is assessed separately because adoption conditions and routes to market differ materially across countries, even when the underlying product or measurement need is similar.

Market positionDeveloping market
Growth outlookInfrastructure-led
Demand profileProject dependent
Market access gateProject access and logistics
Indicator Assessment
Demand base Application- and program-led
Supplier access Direct sales, partners, distributors, or marketplaces
Decision criteria Performance, quality, compliance, price, and support

Market instances

  • Official and industry evidence for Middle East & Africa shows that adoption is tied to documented performance, repair or measurement capability, and dependable after-sales support. The report therefore evaluates concrete programs, regulatory signals, supplier activity, channel maturity, and customer requirements rather than treating population or headline technology spending as a direct proxy for market revenue. Source Source
  • 2025–2026 commercial signal. Middle East & Africa demand is governed by the same application and qualification conditions described above, but purchasing decisions are made through local OEM programmes, distributors and technical approvals. Suppliers that document electrical performance, reliability and continuity of supply can convert a regional deployment into repeat orders; vendors relying only on headline pricing face a slower qualification path.
  • 2026–2034 execution issue. Growth in Middle East & Africa will depend on whether suppliers align manufacturing, field engineering and inventory with the region’s downstream customers. The practical opportunity is not uniform across every country: it concentrates where device assembly, telecom investment, vehicle production, industrial automation or security deployment creates a repeatable design-in pipeline backed by local technical support.
In the full report: country-level market size, sales volume, pricing, application mix and CAGR for every market listed above across 2021–2034.

Key Semiconductor Dry Vacuum Pump Manufacturers and Competitive Landscape

The Semiconductor Dry Vacuum Pump competitive landscape includes global technology leaders, diversified semiconductor or component groups, RF and imaging specialists, and regional manufacturers. The report profiles every named company across product positioning, manufacturing footprint, application exposure, recent development activity and strategic strengths; the complete coverage list is reproduced below so the intended company universe is explicit.

The competitive landscape covers Atlas Copco (Edwards Vacuum), Ebara, Kashiyama Industries, ULVAC, Pfeiffer Vacuum, Busch Vacuum Solutions, VAT Group, Osaka Vacuum, Agilent Technologies, and Tuthill Vacuum & Blower. Profiles examine pump architecture, semiconductor applications, manufacturing footprint, service coverage, energy strategy, regional presence, and recent developments. The analysis also considers qualification requirements, supplier capability, regional purchasing conditions, technology substitution, operating economics, implementation risk, customer procurement cycles, lifecycle support, regulatory context, and evidence required for sustained commercial adoption through the forecast period.

Suppliers compete on pumping speed, pressure stability, corrosion resistance, particle performance, power consumption, noise, footprint, mean time between service, rebuild economics, monitoring, abatement integration, and delivery. Fabs value proven process compatibility because a pump failure can interrupt expensive tools and contaminate wafers. The analysis also considers qualification requirements, supplier capability, regional purchasing conditions, technology substitution, operating economics, implementation risk, customer procurement cycles, lifecycle support, regulatory context, and evidence required for sustained commercial adoption through the forecast period.

Key companies profiled

  • Atlas Copco (Edwards Vacuum)
  • Ebara
  • Kashiyama Industries
  • ULVAC
  • Pfeiffer Vacuum
  • Busch Vacuum Solutions
  • VAT Group
  • Osaka Vacuum
  • Agilent Technologies
  • Tuthill Vacuum & Blower

Semiconductor Dry Vacuum Pump Production Capacity Analysis

Production capacity is a material competitive factor in the Semiconductor Dry Vacuum Pump market because electrical performance depends on specialised processes, qualified materials, repeatable yields and application-specific test capability. Capacity cannot be assessed only by nominal factory floor area: effective supply is the output that passes dimensional, electrical, reliability and customer qualification requirements at the required product mix.

Production capacity depends on precision rotors, screws, bearings, seals, motors, coatings, controllers, sensors, corrosion-resistant materials, machining, balancing, assembly, and high-vacuum testing. Effective capacity is tested pump output that meets leak-rate, vibration, particle, pressure, gas-load, and reliability requirements for semiconductor processes. The analysis also considers qualification requirements, supplier capability, regional purchasing conditions, technology substitution, operating economics, implementation risk, customer procurement cycles, lifecycle support, regulatory context, and evidence required for sustained commercial adoption through the forecast period.

Corrosive chemistries and high-temperature exhaust require specialized materials, coatings, purge systems, and component qualification. Suppliers expand capacity through standardized pump platforms, modular rebuilds, automated testing, and regional service centers, while custom gas loads and tool interfaces can add engineering cycles. The analysis also considers qualification requirements, supplier capability, regional purchasing conditions, technology substitution, operating economics, implementation risk, customer procurement cycles, lifecycle support, regulatory context, and evidence required for sustained commercial adoption through the forecast period.

Service capacity is commercially important. Rebuild facilities, spare rotors, seal kits, field engineers, remote monitoring, and contamination analysis reduce downtime. Customers increasingly prefer lifecycle contracts that cover installation, preventive maintenance, energy optimization, and rapid exchange units. The analysis also considers qualification requirements, supplier capability, regional purchasing conditions, technology substitution, operating economics, implementation risk, customer procurement cycles, lifecycle support, regulatory context, and evidence required for sustained commercial adoption through the forecast period.

Semiconductor Dry Vacuum Pump Market Dynamics: Drivers, Restraints and Opportunities

Semiconductor Dry Vacuum Pump market growth reflects expanding electronic content and higher performance requirements, moderated by manufacturing complexity, long qualification cycles and competing technologies. The impact ranges below are directional analytical estimates rather than additive forecasts; they show the relative pressure each factor can place on the baseline CAGR when other assumptions remain broadly stable.

Demand follows wafer-fab additions, chamber count, process intensity, utilization, and the shift toward cleaner oil-free vacuum. Advanced deposition and etch processes can increase gas loads and corrosive exposure, raising pump specifications and service requirements. Mature-node, power, MEMS, and compound-semiconductor lines add demand for robust and flexible platforms. The analysis also considers qualification requirements, supplier capability, regional purchasing conditions, technology substitution, operating economics, implementation risk, customer procurement cycles, lifecycle support, regulatory context, and evidence required for sustained commercial adoption through the forecast period.

Architecture choices reflect pressure range, gas chemistry, pumping speed, temperature, particle tolerance, energy use, and ownership cost. Screw pumps suit many high-throughput process tools, scroll and claw designs address selected clean or compact applications, and hybrid configurations combine roughing, isolation, and monitoring functions. The analysis also considers qualification requirements, supplier capability, regional purchasing conditions, technology substitution, operating economics, implementation risk, customer procurement cycles, lifecycle support, regulatory context, and evidence required for sustained commercial adoption through the forecast period.

MARKET DRIVERS

Drivers Impact Analysis*

Driver (~) % impact on CAGR forecast Geographic relevance Impact timeline
New fab and cleanroom capacity +2.4% Asia Pacific, North America, Europe Medium term (2–4 years)
Higher chamber count in advanced processes +1.8% Taiwan, South Korea, United States Long term (≥4 years)
Corrosive etch and deposition chemistries +1.4% Global semiconductor fabs Long term (≥4 years)
Energy-efficiency and oil-free requirements +1.1% Europe, North America, Asia Pacific Medium term (2–4 years)
Mature-node and power-device investment +0.9% China, Japan, Europe, Southeast Asia Medium term (2–4 years)
Predictive maintenance and service contracts +0.7% Global installed base Short term (≤2 years)

New fab and cleanroom capacity is influencing demand, investment and adoption across the Asia Pacific, North America, Europe region over the medium term (2–4 years). The analysis also considers qualification requirements, supplier capability, regional purchasing conditions, technology substitution, operating economics, implementation risk, customer procurement cycles, lifecycle support, regulatory context, and evidence required for sustained commercial adoption through the forecast period.

Higher chamber count in advanced processes is influencing demand, investment and adoption across the Taiwan, South Korea, United States region over the long term (≥4 years). The analysis also considers qualification requirements, supplier capability, regional purchasing conditions, technology substitution, operating economics, implementation risk, customer procurement cycles, lifecycle support, regulatory context, and evidence required for sustained commercial adoption through the forecast period.

Corrosive etch and deposition chemistries is influencing demand, investment and adoption across the Global semiconductor fabs region over the long term (≥4 years). The analysis also considers qualification requirements, supplier capability, regional purchasing conditions, technology substitution, operating economics, implementation risk, customer procurement cycles, lifecycle support, regulatory context, and evidence required for sustained commercial adoption through the forecast period.

MARKET RESTRAINTS

Restraints Impact Analysis*

Restraint (~) % impact on CAGR forecast Geographic relevance Impact timeline
High equipment and service cost −1.3% Global fabs Persistent
Long qualification and chemistry testing −1.0% Advanced process tools Persistent
Corrosion and by-product damage −0.8% Etch and deposition applications Long term (≥4 years)
Cyclical semiconductor capital spending −0.7% Global equipment programs Medium term (2–4 years)
Specialized materials and component supply −0.5% Cross-border supply chains Medium term (2–4 years)

High equipment and service cost can delay purchasing, reduce utilisation, or increase qualification and lifecycle cost for global fabs customers over the persistent. The analysis also considers qualification requirements, supplier capability, regional purchasing conditions, technology substitution, operating economics, implementation risk, customer procurement cycles, lifecycle support, regulatory context, and evidence required for sustained commercial adoption through the forecast period.

Long qualification and chemistry testing can delay purchasing, reduce utilisation, or increase qualification and lifecycle cost for advanced process tools customers over the persistent. The analysis also considers qualification requirements, supplier capability, regional purchasing conditions, technology substitution, operating economics, implementation risk, customer procurement cycles, lifecycle support, regulatory context, and evidence required for sustained commercial adoption through the forecast period.

Corrosion and by-product damage can delay purchasing, reduce utilisation, or increase qualification and lifecycle cost for etch and deposition applications customers over the long term (≥4 years). The analysis also considers qualification requirements, supplier capability, regional purchasing conditions, technology substitution, operating economics, implementation risk, customer procurement cycles, lifecycle support, regulatory context, and evidence required for sustained commercial adoption through the forecast period.

MARKET OPPORTUNITIES

Advanced etch, deposition, EUV support, power semiconductors, compound devices, MEMS, and mature-node fabs create demand for application-specific dry pumps. Suppliers can offer corrosion-resistant designs, higher pumping speed, lower particle generation, and integrated exhaust monitoring. The analysis also considers qualification requirements, supplier capability, regional purchasing conditions, technology substitution, operating economics, implementation risk, customer procurement cycles, lifecycle support, regulatory context, and evidence required for sustained commercial adoption through the forecast period.

Energy optimization and predictive maintenance can improve total ownership economics. Variable-speed drives, remote diagnostics, pump-health models, efficient purge systems, and rebuild programs help fabs reduce electricity, unplanned downtime, and replacement cost. The analysis also considers qualification requirements, supplier capability, regional purchasing conditions, technology substitution, operating economics, implementation risk, customer procurement cycles, lifecycle support, regulatory context, and evidence required for sustained commercial adoption through the forecast period.

Regional service centers, exchange-pump inventory, local rebuild capability, and abatement partnerships are attractive in expanding fab regions. Turnkey vacuum packages that combine pumps, valves, controls, exhaust, and commissioning can shorten qualification and improve accountability. The analysis also considers qualification requirements, supplier capability, regional purchasing conditions, technology substitution, operating economics, implementation risk, customer procurement cycles, lifecycle support, regulatory context, and evidence required for sustained commercial adoption through the forecast period.

Semiconductor Dry Vacuum Pump Supply Chain Analysis

The Semiconductor Dry Vacuum Pump supply chain links specialty materials and wafer or ceramic processing equipment to high-precision manufacturing, packaging, distribution and downstream system integration. Commercial resilience depends on qualified alternate materials, realistic yield assumptions, geographic redundancy and traceable process controls because a nominal second source is not interchangeable until the customer has validated electrical behaviour, reliability and package compatibility.

Upstream InputsThe supply chain includes castings, precision-machined rotors, seals, bearings, motors, coatings, sensors, controllers, valves, exhaust and abatement equipment, test systems, service parts, and logistics. Pump companies integrate these inputs, qualify them for process chemistries, and install systems at semiconductor fabs and equipment OEMs.
Core ManufacturingProduction capacity depends on precision rotors, screws, bearings, seals, motors, coatings, controllers, sensors, corrosion-resistant materials, machining, balancing, assembly, and high-vacuum testing. Effective capacity is tested pump output that meets leak-rate, vibration, particle, pressure, gas-load, and reliability requirements for semiconductor processes.
System IntegrationCorrosive chemistries and high-temperature exhaust require specialized materials, coatings, purge systems, and component qualification. Suppliers expand capacity through standardized pump platforms, modular rebuilds, automated testing, and regional service centers, while custom gas loads and tool interfaces can add engineering cycles.
Deployment and ServiceService capacity is commercially important. Rebuild facilities, spare rotors, seal kits, field engineers, remote monitoring, and contamination analysis reduce downtime. Customers increasingly prefer lifecycle contracts that cover installation, preventive maintenance, energy optimization, and rapid exchange units.

The supply chain includes castings, precision-machined rotors, seals, bearings, motors, coatings, sensors, controllers, valves, exhaust and abatement equipment, test systems, service parts, and logistics. Pump companies integrate these inputs, qualify them for process chemistries, and install systems at semiconductor fabs and equipment OEMs. The analysis also considers qualification requirements, supplier capability, regional purchasing conditions, technology substitution, operating economics, implementation risk, customer procurement cycles, lifecycle support, regulatory context, and evidence required for sustained commercial adoption through the forecast period.

Resilience depends on qualified material sources, coating capacity, regional spare inventories, rebuild centers, corrosion testing, and documented engineering changes. A small change in rotor balance, seal material, purge flow, or controller firmware can affect vibration, pressure, particle performance, or uptime and may require customer requalification. The analysis also considers qualification requirements, supplier capability, regional purchasing conditions, technology substitution, operating economics, implementation risk, customer procurement cycles, lifecycle support, regulatory context, and evidence required for sustained commercial adoption through the forecast period.

Recent Developments in the Semiconductor Dry Vacuum Pump Market

Developments tracked to September 2026 and linked to official company or industry sources.

  • August 2026 Published
    Ebara continued to highlight energy-efficient, compact dry vacuum pumps for semiconductor manufacturing and other precision applications. Source
  • 2026 Published
    Edwards Vacuum continued to promote semiconductor vacuum and abatement solutions, including long-life chemical dry pumps and service programs. Source
  • August 2026 Published
    Ebara’s corporate updates described ongoing precision-and-electronics activities supporting semiconductor manufacturing equipment. Source
  • 2025 Published
    Atlas Copco and Edwards Vacuum continued development of vacuum, abatement, monitoring, and service solutions for semiconductor manufacturing. Source
  • 2025 Published
    Azbil described Ebara’s Fujisawa district as a development and manufacturing location for dry vacuum pumps used in semiconductor production. Source

REPORT SCOPE & SEGMENTATION

Attribute Details
Study Period 2021–2034
Base Year 2025
Estimated Year 2026
Forecast Year 2034
Historical Period 2021–2025
Market Size 2025 USD 1.345 billion
Market Size 2034 USD 2.998 billion
Growth Rate CAGR of 9.3% from 2026–2034
Unit Value in USD billion and shipment or production volume where disclosed
Segmentation By Type, By Application, additional technology axis and By Region
By Type Screw Vacuum Pump · Scroll Vacuum Pump · Claw Vacuum Pump · Other Dry Pump Architectures
By Application CVD and PVD · Lithography and Etching · Implant and Thermal Processing · Other Semiconductor Processes
By Gas Chemistry and Service Model Corrosive Process Duty · Clean Vacuum Duty · New Pump Sales · Rebuild and Exchange · Lifecycle Service Contracts
By Region Each region analysed by type, application and countryNorth AmericaU.S., Canada, MexicoEuropeGermany, France, U.K., Italy, Nordic Countries, BeneluxAsia PacificChina, Japan, South Korea, India, Southeast AsiaSouth AmericaBrazil, Argentina, Rest of South AmericaMiddle East & AfricaTurkey, Israel, Saudi Arabia, UAE, Rest of MEA
Key Companies Profiled Atlas Copco (Edwards Vacuum); Ebara; Kashiyama Industries; ULVAC; Pfeiffer Vacuum; Busch Vacuum Solutions; VAT Group; Osaka Vacuum; Agilent Technologies; Tuthill Vacuum & Blower
Customization Scope Free report customization equivalent to up to four analyst working days with purchase, including additions or alterations to country, regional and segment coverage.

Frequently Asked Questions

What is a semiconductor dry vacuum pump?

The Semiconductor Dry Vacuum Pump Market is valued at USD 1.345 billion in the 2025 base year and is projected to reach USD 2.998 billion by 2034, expanding at a CAGR of 9.3% during 2026–2034. The outlook covers screw, scroll, claw, and other oil-free pumps used in deposition, etching, lithography, implantation, thermal processing, and related semiconductor applications, with Asia Pacific holding the leading regional position.

What is the market outlook through 2034?

Demand should increase through 2034 as new fabs add process chambers, advanced nodes raise gas loads and process intensity, mature-node and power-device investment continues, and fabs pursue lower contamination, energy use, and unplanned downtime. Corrosion resistance, pumping stability, abatement compatibility, predictive monitoring, rebuild economics, and regional service coverage will determine supplier selection.

Which pump type leads?

Screw pumps lead many high-throughput semiconductor applications because they provide robust continuous pumping and can be engineered for corrosive process gases. Scroll and claw pumps address selected clean, compact, or lower-flow duties, while hybrid systems combine roughing, isolation, monitoring, and application-specific control. The analysis also considers qualification requirements, supplier capability, regional purchasing conditions, technology substitution, operating economics, implementation risk, customer procurement cycles, lifecycle support, regulatory context, and evidence required for sustained commercial adoption through the forecast period.

Which applications create demand?

CVD, PVD, etching, lithography, implantation, thermal processing, wafer handling, and other semiconductor operations use dry vacuum pumps. Gas chemistry, pressure range, chamber size, cycle time, by-product load, temperature, and abatement configuration determine the required pump architecture. The analysis also considers qualification requirements, supplier capability, regional purchasing conditions, technology substitution, operating economics, implementation risk, customer procurement cycles, lifecycle support, regulatory context, and evidence required for sustained commercial adoption through the forecast period.

Why does Asia Pacific lead?

Asia Pacific combines the largest concentration of foundries, memory fabs, equipment makers, semiconductor materials, and electronics manufacturing. Taiwan, South Korea, China, Japan, and Southeast Asia support both leading-edge and mature-node capacity, while North America and Europe contribute advanced research, equipment development, and automotive or industrial semiconductor programs. The analysis also considers qualification requirements, supplier capability, regional purchasing conditions, technology substitution, operating economics, implementation risk, customer procurement cycles, lifecycle support, regulatory context, and evidence required for sustained commercial adoption through the forecast period.

What drives growth?

New fabs, increasing chamber counts, corrosive etch and deposition chemistries, oil-free requirements, energy reduction, mature-node capacity, power devices, compound semiconductors, and predictive maintenance drive growth. Each additional process tool requires qualified vacuum equipment and lifecycle support. The analysis also considers qualification requirements, supplier capability, regional purchasing conditions, technology substitution, operating economics, implementation risk, customer procurement cycles, lifecycle support, regulatory context, and evidence required for sustained commercial adoption through the forecast period.

What limits adoption?

High capital cost, long qualification, corrosion, by-product damage, cyclical fab spending, specialized materials, service availability, and facility-integration requirements limit adoption. Customers evaluate uptime and cost per processed wafer rather than pump price alone because a vacuum failure can idle an expensive process tool. The analysis also considers qualification requirements, supplier capability, regional purchasing conditions, technology substitution, operating economics, implementation risk, customer procurement cycles, lifecycle support, regulatory context, and evidence required for sustained commercial adoption through the forecast period.

How do suppliers compete?

Suppliers compete on pumping speed, pressure stability, corrosion resistance, particle control, energy consumption, footprint, noise, service interval, rebuild economics, monitoring, abatement compatibility, and application support. Proven chemistry data and rapid service can outweigh small differences in nominal specifications. The analysis also considers qualification requirements, supplier capability, regional purchasing conditions, technology substitution, operating economics, implementation risk, customer procurement cycles, lifecycle support, regulatory context, and evidence required for sustained commercial adoption through the forecast period.

Where are the best opportunities?

Advanced etch and deposition, EUV support, power semiconductors, compound devices, MEMS, mature-node fabs, energy optimization, predictive maintenance, exchange units, and regional rebuild centers offer opportunities. Integrated vacuum and abatement packages can shorten installation and qualification. The analysis also considers qualification requirements, supplier capability, regional purchasing conditions, technology substitution, operating economics, implementation risk, customer procurement cycles, lifecycle support, regulatory context, and evidence required for sustained commercial adoption through the forecast period.

Which companies are covered?

The report covers Atlas Copco (Edwards Vacuum), Ebara, Kashiyama Industries, ULVAC, Pfeiffer Vacuum, Busch Vacuum Solutions, VAT Group, Osaka Vacuum, Agilent Technologies, and Tuthill Vacuum & Blower. Profiles assess architecture, process applications, capacity, service, regional presence, and strategy. The analysis also considers qualification requirements, supplier capability, regional purchasing conditions, technology substitution, operating economics, implementation risk, customer procurement cycles, lifecycle support, regulatory context, and evidence required for sustained commercial adoption through the forecast period.

Semiconductor Dry Vacuum Pump Market, Global Outlook and Forecast 2026-2034

Get Sample Report PDF for Exclusive Insights

Report Sample Includes

  • Table of Contents
  • List of Tables & Figures
  • Charts, Research Methodology, and more...

PDF Icon Download Sample Report PDF

Download Sample Report

Table of Content

1 Introduction to Research & Analysis Reports
1.1 Semiconductor Dry Vacuum Pump Market Definition
1.2 Market Segments
1.2.1 Segment by Type
1.2.2 Segment by Application
1.3 Global Semiconductor Dry Vacuum Pump Market Overview
1.4 Features & Benefits of This Report
1.5 Methodology & Sources of Information
1.5.1 Research Methodology
1.5.2 Research Process
1.5.3 Base Year
1.5.4 Report Assumptions & Caveats
2 Global Semiconductor Dry Vacuum Pump Overall Market Size
2.1 Global Semiconductor Dry Vacuum Pump Market Size: 2023 VS 2030
2.2 Global Semiconductor Dry Vacuum Pump Market Size, Prospects & Forecasts: 2019-2030
2.3 Global Semiconductor Dry Vacuum Pump Sales: 2019-2030
3 Company Landscape
3.1 Top Semiconductor Dry Vacuum Pump Players in Global Market
3.2 Top Global Semiconductor Dry Vacuum Pump Companies Ranked by Revenue
3.3 Global Semiconductor Dry Vacuum Pump Revenue by Companies
3.4 Global Semiconductor Dry Vacuum Pump Sales by Companies
3.5 Global Semiconductor Dry Vacuum Pump Price by Manufacturer (2019-2024)
3.6 Top 3 and Top 5 Semiconductor Dry Vacuum Pump Companies in Global Market, by Revenue in 2023
3.7 Global Manufacturers Semiconductor Dry Vacuum Pump Product Type
3.8 Tier 1, Tier 2, and Tier 3 Semiconductor Dry Vacuum Pump Players in Global Market
3.8.1 List of Global Tier 1 Semiconductor Dry Vacuum Pump Companies
3.8.2 List of Global Tier 2 and Tier 3 Semiconductor Dry Vacuum Pump Companies
4 Sights by Product
4.1 Overview
4.1.1 Segment by Type – Global Semiconductor Dry Vacuum Pump Market Size Markets, 2023 & 2030
4.1.2 Screw Vacuum Pump
4.1.3 Scroll Vacuum Pump
4.1.4 Claw Vacuum Pump
4.1.5 Others
4.2 Segment – Global Semiconductor Dry Vacuum Pump Revenue & Forecasts
4.2.1 Segment – Global Semiconductor Dry Vacuum Pump Revenue, 2019-2024
4.2.2 Segment – Global Semiconductor Dry Vacuum Pump Revenue, 2025-2030
4.2.3 Segment – Global Semiconductor Dry Vacuum Pump Revenue Market Share, 2019-2030
4.3 Segment – Global Semiconductor Dry Vacuum Pump Sales & Forecasts
4.3.1 Segment – Global Semiconductor Dry Vacuum Pump Sales, 2019-2024
4.3.2 Segment – Global Semiconductor Dry Vacuum Pump Sales, 2025-2030
4.3.3 Segment – Global Semiconductor Dry Vacuum Pump Sales Market Share, 2019-2030
4.4 Segment – Global Semiconductor Dry Vacuum Pump Price (Manufacturers Selling Prices), 2019-2030
5 Sights by Application
5.1 Overview
5.1.1 Segment by Application – Global Semiconductor Dry Vacuum Pump Market Size, 2023 & 2030
5.1.2 CVD&PVD
5.1.3 Lithography&Etching
5.1.4 Others
5.2 Segment by Application – Global Semiconductor Dry Vacuum Pump Revenue & Forecasts
5.2.1 Segment by Application – Global Semiconductor Dry Vacuum Pump Revenue, 2019-2024
5.2.2 Segment by Application – Global Semiconductor Dry Vacuum Pump Revenue, 2025-2030
5.2.3 Segment by Application – Global Semiconductor Dry Vacuum Pump Revenue Market Share, 2019-2030
5.3 Segment by Application – Global Semiconductor Dry Vacuum Pump Sales & Forecasts
5.3.1 Segment by Application – Global Semiconductor Dry Vacuum Pump Sales, 2019-2024
5.3.2 Segment by Application – Global Semiconductor Dry Vacuum Pump Sales, 2025-2030
5.3.3 Segment by Application – Global Semiconductor Dry Vacuum Pump Sales Market Share, 2019-2030
5.4 Segment by Application – Global Semiconductor Dry Vacuum Pump Price (Manufacturers Selling Prices), 2019-2030
6 Sights by Region
6.1 By Region – Global Semiconductor Dry Vacuum Pump Market Size, 2023 & 2030
6.2 By Region – Global Semiconductor Dry Vacuum Pump Revenue & Forecasts
6.2.1 By Region – Global Semiconductor Dry Vacuum Pump Revenue, 2019-2024
6.2.2 By Region – Global Semiconductor Dry Vacuum Pump Revenue, 2025-2030
6.2.3 By Region – Global Semiconductor Dry Vacuum Pump Revenue Market Share, 2019-2030
6.3 By Region – Global Semiconductor Dry Vacuum Pump Sales & Forecasts
6.3.1 By Region – Global Semiconductor Dry Vacuum Pump Sales, 2019-2024
6.3.2 By Region – Global Semiconductor Dry Vacuum Pump Sales, 2025-2030
6.3.3 By Region – Global Semiconductor Dry Vacuum Pump Sales Market Share, 2019-2030
6.4 North America
6.4.1 By Country – North America Semiconductor Dry Vacuum Pump Revenue, 2019-2030
6.4.2 By Country – North America Semiconductor Dry Vacuum Pump Sales, 2019-2030
6.4.3 United States Semiconductor Dry Vacuum Pump Market Size, 2019-2030
6.4.4 Canada Semiconductor Dry Vacuum Pump Market Size, 2019-2030
6.4.5 Mexico Semiconductor Dry Vacuum Pump Market Size, 2019-2030
6.5 Europe
6.5.1 By Country – Europe Semiconductor Dry Vacuum Pump Revenue, 2019-2030
6.5.2 By Country – Europe Semiconductor Dry Vacuum Pump Sales, 2019-2030
6.5.3 Germany Semiconductor Dry Vacuum Pump Market Size, 2019-2030
6.5.4 France Semiconductor Dry Vacuum Pump Market Size, 2019-2030
6.5.5 U.K. Semiconductor Dry Vacuum Pump Market Size, 2019-2030
6.5.6 Italy Semiconductor Dry Vacuum Pump Market Size, 2019-2030
6.5.7 Russia Semiconductor Dry Vacuum Pump Market Size, 2019-2030
6.5.8 Nordic Countries Semiconductor Dry Vacuum Pump Market Size, 2019-2030
6.5.9 Benelux Semiconductor Dry Vacuum Pump Market Size, 2019-2030
6.6 Asia
6.6.1 By Region – Asia Semiconductor Dry Vacuum Pump Revenue, 2019-2030
6.6.2 By Region – Asia Semiconductor Dry Vacuum Pump Sales, 2019-2030
6.6.3 China Semiconductor Dry Vacuum Pump Market Size, 2019-2030
6.6.4 Japan Semiconductor Dry Vacuum Pump Market Size, 2019-2030
6.6.5 South Korea Semiconductor Dry Vacuum Pump Market Size, 2019-2030
6.6.6 Southeast Asia Semiconductor Dry Vacuum Pump Market Size, 2019-2030
6.6.7 India Semiconductor Dry Vacuum Pump Market Size, 2019-2030
6.7 South America
6.7.1 By Country – South America Semiconductor Dry Vacuum Pump Revenue, 2019-2030
6.7.2 By Country – South America Semiconductor Dry Vacuum Pump Sales, 2019-2030
6.7.3 Brazil Semiconductor Dry Vacuum Pump Market Size, 2019-2030
6.7.4 Argentina Semiconductor Dry Vacuum Pump Market Size, 2019-2030
6.8 Middle East & Africa
6.8.1 By Country – Middle East & Africa Semiconductor Dry Vacuum Pump Revenue, 2019-2030
6.8.2 By Country – Middle East & Africa Semiconductor Dry Vacuum Pump Sales, 2019-2030
6.8.3 Turkey Semiconductor Dry Vacuum Pump Market Size, 2019-2030
6.8.4 Israel Semiconductor Dry Vacuum Pump Market Size, 2019-2030
6.8.5 Saudi Arabia Semiconductor Dry Vacuum Pump Market Size, 2019-2030
6.8.6 UAE Semiconductor Dry Vacuum Pump Market Size, 2019-2030
7 Manufacturers & Brands Profiles
7.1 Atlas Copco (Edwards Vacuum)
7.1.1 Atlas Copco (Edwards Vacuum) Company Summary
7.1.2 Atlas Copco (Edwards Vacuum) Business Overview
7.1.3 Atlas Copco (Edwards Vacuum) Semiconductor Dry Vacuum Pump Major Product Offerings
7.1.4 Atlas Copco (Edwards Vacuum) Semiconductor Dry Vacuum Pump Sales and Revenue in Global (2019-2024)
7.1.5 Atlas Copco (Edwards Vacuum) Key News & Latest Developments
7.2 Ebara Corporation
7.2.1 Ebara Corporation Company Summary
7.2.2 Ebara Corporation Business Overview
7.2.3 Ebara Corporation Semiconductor Dry Vacuum Pump Major Product Offerings
7.2.4 Ebara Corporation Semiconductor Dry Vacuum Pump Sales and Revenue in Global (2019-2024)
7.2.5 Ebara Corporation Key News & Latest Developments
7.3 Pfeiffer Vacuum GmbH
7.3.1 Pfeiffer Vacuum GmbH Company Summary
7.3.2 Pfeiffer Vacuum GmbH Business Overview
7.3.3 Pfeiffer Vacuum GmbH Semiconductor Dry Vacuum Pump Major Product Offerings
7.3.4 Pfeiffer Vacuum GmbH Semiconductor Dry Vacuum Pump Sales and Revenue in Global (2019-2024)
7.3.5 Pfeiffer Vacuum GmbH Key News & Latest Developments
7.4 Kashiyama Industries
7.4.1 Kashiyama Industries Company Summary
7.4.2 Kashiyama Industries Business Overview
7.4.3 Kashiyama Industries Semiconductor Dry Vacuum Pump Major Product Offerings
7.4.4 Kashiyama Industries Semiconductor Dry Vacuum Pump Sales and Revenue in Global (2019-2024)
7.4.5 Kashiyama Industries Key News & Latest Developments
7.5 Beijing Grand Hitek
7.5.1 Beijing Grand Hitek Company Summary
7.5.2 Beijing Grand Hitek Business Overview
7.5.3 Beijing Grand Hitek Semiconductor Dry Vacuum Pump Major Product Offerings
7.5.4 Beijing Grand Hitek Semiconductor Dry Vacuum Pump Sales and Revenue in Global (2019-2024)
7.5.5 Beijing Grand Hitek Key News & Latest Developments
7.6 SKY Technology Development
7.6.1 SKY Technology Development Company Summary
7.6.2 SKY Technology Development Business Overview
7.6.3 SKY Technology Development Semiconductor Dry Vacuum Pump Major Product Offerings
7.6.4 SKY Technology Development Semiconductor Dry Vacuum Pump Sales and Revenue in Global (2019-2024)
7.6.5 SKY Technology Development Key News & Latest Developments
7.7 Ningbo Baosi Energy Equipment
7.7.1 Ningbo Baosi Energy Equipment Company Summary
7.7.2 Ningbo Baosi Energy Equipment Business Overview
7.7.3 Ningbo Baosi Energy Equipment Semiconductor Dry Vacuum Pump Major Product Offerings
7.7.4 Ningbo Baosi Energy Equipment Semiconductor Dry Vacuum Pump Sales and Revenue in Global (2019-2024)
7.7.5 Ningbo Baosi Energy Equipment Key News & Latest Developments
7.8 LOTVACUUM
7.8.1 LOTVACUUM Company Summary
7.8.2 LOTVACUUM Business Overview
7.8.3 LOTVACUUM Semiconductor Dry Vacuum Pump Major Product Offerings
7.8.4 LOTVACUUM Semiconductor Dry Vacuum Pump Sales and Revenue in Global (2019-2024)
7.8.5 LOTVACUUM Key News & Latest Developments
7.9 Taiko Kikai Industries
7.9.1 Taiko Kikai Industries Company Summary
7.9.2 Taiko Kikai Industries Business Overview
7.9.3 Taiko Kikai Industries Semiconductor Dry Vacuum Pump Major Product Offerings
7.9.4 Taiko Kikai Industries Semiconductor Dry Vacuum Pump Sales and Revenue in Global (2019-2024)
7.9.5 Taiko Kikai Industries Key News & Latest Developments
7.10 Busch Vacuum
7.10.1 Busch Vacuum Company Summary
7.10.2 Busch Vacuum Business Overview
7.10.3 Busch Vacuum Semiconductor Dry Vacuum Pump Major Product Offerings
7.10.4 Busch Vacuum Semiconductor Dry Vacuum Pump Sales and Revenue in Global (2019-2024)
7.10.5 Busch Vacuum Key News & Latest Developments
7.11 EVP Vacuum Technology
7.11.1 EVP Vacuum Technology Company Summary
7.11.2 EVP Vacuum Technology Business Overview
7.11.3 EVP Vacuum Technology Semiconductor Dry Vacuum Pump Major Product Offerings
7.11.4 EVP Vacuum Technology Semiconductor Dry Vacuum Pump Sales and Revenue in Global (2019-2024)
7.11.5 EVP Vacuum Technology Key News & Latest Developments
7.12 Scroll Laboratories, Inc
7.12.1 Scroll Laboratories, Inc Company Summary
7.12.2 Scroll Laboratories, Inc Business Overview
7.12.3 Scroll Laboratories, Inc Semiconductor Dry Vacuum Pump Major Product Offerings
7.12.4 Scroll Laboratories, Inc Semiconductor Dry Vacuum Pump Sales and Revenue in Global (2019-2024)
7.12.5 Scroll Laboratories, Inc Key News & Latest Developments
7.13 ULVAC, Inc
7.13.1 ULVAC, Inc Company Summary
7.13.2 ULVAC, Inc Business Overview
7.13.3 ULVAC, Inc Semiconductor Dry Vacuum Pump Major Product Offerings
7.13.4 ULVAC, Inc Semiconductor Dry Vacuum Pump Sales and Revenue in Global (2019-2024)
7.13.5 ULVAC, Inc Key News & Latest Developments
7.14 Highvac Corporation
7.14.1 Highvac Corporation Company Summary
7.14.2 Highvac Corporation Business Overview
7.14.3 Highvac Corporation Semiconductor Dry Vacuum Pump Major Product Offerings
7.14.4 Highvac Corporation Semiconductor Dry Vacuum Pump Sales and Revenue in Global (2019-2024)
7.14.5 Highvac Corporation Key News & Latest Developments
7.15 Osaka Vacuum, Ltd
7.15.1 Osaka Vacuum, Ltd Company Summary
7.15.2 Osaka Vacuum, Ltd Business Overview
7.15.3 Osaka Vacuum, Ltd Semiconductor Dry Vacuum Pump Major Product Offerings
7.15.4 Osaka Vacuum, Ltd Semiconductor Dry Vacuum Pump Sales and Revenue in Global (2019-2024)
7.15.5 Osaka Vacuum, Ltd Key News & Latest Developments
8 Global Semiconductor Dry Vacuum Pump Production Capacity, Analysis
8.1 Global Semiconductor Dry Vacuum Pump Production Capacity, 2019-2030
8.2 Semiconductor Dry Vacuum Pump Production Capacity of Key Manufacturers in Global Market
8.3 Global Semiconductor Dry Vacuum Pump Production by Region
9 Key Market Trends, Opportunity, Drivers and Restraints
9.1 Market Opportunities & Trends
9.2 Market Drivers
9.3 Market Restraints
10 Semiconductor Dry Vacuum Pump Supply Chain Analysis
10.1 Semiconductor Dry Vacuum Pump Industry Value Chain
10.2 Semiconductor Dry Vacuum Pump Upstream Market
10.3 Semiconductor Dry Vacuum Pump Downstream and Clients
10.4 Marketing Channels Analysis
10.4.1 Marketing Channels
10.4.2 Semiconductor Dry Vacuum Pump Distributors and Sales Agents in Global
11 Conclusion
12 Appendix
12.1 Note
12.2 Examples of Clients
12.3 DisclaimerList of Tables
Table 1. Key Players of Semiconductor Dry Vacuum Pump in Global Market
Table 2. Top Semiconductor Dry Vacuum Pump Players in Global Market, Ranking by Revenue (2023)
Table 3. Global Semiconductor Dry Vacuum Pump Revenue by Companies, (US$, Mn), 2019-2024
Table 4. Global Semiconductor Dry Vacuum Pump Revenue Share by Companies, 2019-2024
Table 5. Global Semiconductor Dry Vacuum Pump Sales by Companies, (K Units), 2019-2024
Table 6. Global Semiconductor Dry Vacuum Pump Sales Share by Companies, 2019-2024
Table 7. Key Manufacturers Semiconductor Dry Vacuum Pump Price (2019-2024) & (K US$/Unit)
Table 8. Global Manufacturers Semiconductor Dry Vacuum Pump Product Type
Table 9. List of Global Tier 1 Semiconductor Dry Vacuum Pump Companies, Revenue (US$, Mn) in 2023 and Market Share
Table 10. List of Global Tier 2 and Tier 3 Semiconductor Dry Vacuum Pump Companies, Revenue (US$, Mn) in 2023 and Market Share
Table 11. Segment by Type – Global Semiconductor Dry Vacuum Pump Revenue, (US$, Mn), 2023 & 2030
Table 12. Segment by Type – Global Semiconductor Dry Vacuum Pump Revenue (US$, Mn), 2019-2024
Table 13. Segment by Type – Global Semiconductor Dry Vacuum Pump Revenue (US$, Mn), 2025-2030
Table 14. Segment by Type – Global Semiconductor Dry Vacuum Pump Sales (K Units), 2019-2024
Table 15. Segment by Type – Global Semiconductor Dry Vacuum Pump Sales (K Units), 2025-2030
Table 16. Segment by Application – Global Semiconductor Dry Vacuum Pump Revenue, (US$, Mn), 2023 & 2030
Table 17. Segment by Application – Global Semiconductor Dry Vacuum Pump Revenue, (US$, Mn), 2019-2024
Table 18. Segment by Application – Global Semiconductor Dry Vacuum Pump Revenue, (US$, Mn), 2025-2030
Table 19. Segment by Application – Global Semiconductor Dry Vacuum Pump Sales, (K Units), 2019-2024
Table 20. Segment by Application – Global Semiconductor Dry Vacuum Pump Sales, (K Units), 2025-2030
Table 21. By Region – Global Semiconductor Dry Vacuum Pump Revenue, (US$, Mn), 2023-2030
Table 22. By Region – Global Semiconductor Dry Vacuum Pump Revenue, (US$, Mn), 2019-2024
Table 23. By Region – Global Semiconductor Dry Vacuum Pump Revenue, (US$, Mn), 2025-2030
Table 24. By Region – Global Semiconductor Dry Vacuum Pump Sales, (K Units), 2019-2024
Table 25. By Region – Global Semiconductor Dry Vacuum Pump Sales, (K Units), 2025-2030
Table 26. By Country – North America Semiconductor Dry Vacuum Pump Revenue, (US$, Mn), 2019-2024
Table 27. By Country – North America Semiconductor Dry Vacuum Pump Revenue, (US$, Mn), 2025-2030
Table 28. By Country – North America Semiconductor Dry Vacuum Pump Sales, (K Units), 2019-2024
Table 29. By Country – North America Semiconductor Dry Vacuum Pump Sales, (K Units), 2025-2030
Table 30. By Country – Europe Semiconductor Dry Vacuum Pump Revenue, (US$, Mn), 2019-2024
Table 31. By Country – Europe Semiconductor Dry Vacuum Pump Revenue, (US$, Mn), 2025-2030
Table 32. By Country – Europe Semiconductor Dry Vacuum Pump Sales, (K Units), 2019-2024
Table 33. By Country – Europe Semiconductor Dry Vacuum Pump Sales, (K Units), 2025-2030
Table 34. By Region – Asia Semiconductor Dry Vacuum Pump Revenue, (US$, Mn), 2019-2024
Table 35. By Region – Asia Semiconductor Dry Vacuum Pump Revenue, (US$, Mn), 2025-2030
Table 36. By Region – Asia Semiconductor Dry Vacuum Pump Sales, (K Units), 2019-2024
Table 37. By Region – Asia Semiconductor Dry Vacuum Pump Sales, (K Units), 2025-2030
Table 38. By Country – South America Semiconductor Dry Vacuum Pump Revenue, (US$, Mn), 2019-2024
Table 39. By Country – South America Semiconductor Dry Vacuum Pump Revenue, (US$, Mn), 2025-2030
Table 40. By Country – South America Semiconductor Dry Vacuum Pump Sales, (K Units), 2019-2024
Table 41. By Country – South America Semiconductor Dry Vacuum Pump Sales, (K Units), 2025-2030
Table 42. By Country – Middle East & Africa Semiconductor Dry Vacuum Pump Revenue, (US$, Mn), 2019-2024
Table 43. By Country – Middle East & Africa Semiconductor Dry Vacuum Pump Revenue, (US$, Mn), 2025-2030
Table 44. By Country – Middle East & Africa Semiconductor Dry Vacuum Pump Sales, (K Units), 2019-2024
Table 45. By Country – Middle East & Africa Semiconductor Dry Vacuum Pump Sales, (K Units), 2025-2030
Table 46. Atlas Copco (Edwards Vacuum) Company Summary
Table 47. Atlas Copco (Edwards Vacuum) Semiconductor Dry Vacuum Pump Product Offerings
Table 48. Atlas Copco (Edwards Vacuum) Semiconductor Dry Vacuum Pump Sales (K Units), Revenue (US$, Mn) and Average Price (K US$/Unit) & (2019-2024)
Table 49. Atlas Copco (Edwards Vacuum) Key News & Latest Developments
Table 50. Ebara Corporation Company Summary
Table 51. Ebara Corporation Semiconductor Dry Vacuum Pump Product Offerings
Table 52. Ebara Corporation Semiconductor Dry Vacuum Pump Sales (K Units), Revenue (US$, Mn) and Average Price (K US$/Unit) & (2019-2024)
Table 53. Ebara Corporation Key News & Latest Developments
Table 54. Pfeiffer Vacuum GmbH Company Summary
Table 55. Pfeiffer Vacuum GmbH Semiconductor Dry Vacuum Pump Product Offerings
Table 56. Pfeiffer Vacuum GmbH Semiconductor Dry Vacuum Pump Sales (K Units), Revenue (US$, Mn) and Average Price (K US$/Unit) & (2019-2024)
Table 57. Pfeiffer Vacuum GmbH Key News & Latest Developments
Table 58. Kashiyama Industries Company Summary
Table 59. Kashiyama Industries Semiconductor Dry Vacuum Pump Product Offerings
Table 60. Kashiyama Industries Semiconductor Dry Vacuum Pump Sales (K Units), Revenue (US$, Mn) and Average Price (K US$/Unit) & (2019-2024)
Table 61. Kashiyama Industries Key News & Latest Developments
Table 62. Beijing Grand Hitek Company Summary
Table 63. Beijing Grand Hitek Semiconductor Dry Vacuum Pump Product Offerings
Table 64. Beijing Grand Hitek Semiconductor Dry Vacuum Pump Sales (K Units), Revenue (US$, Mn) and Average Price (K US$/Unit) & (2019-2024)
Table 65. Beijing Grand Hitek Key News & Latest Developments
Table 66. SKY Technology Development Company Summary
Table 67. SKY Technology Development Semiconductor Dry Vacuum Pump Product Offerings
Table 68. SKY Technology Development Semiconductor Dry Vacuum Pump Sales (K Units), Revenue (US$, Mn) and Average Price (K US$/Unit) & (2019-2024)
Table 69. SKY Technology Development Key News & Latest Developments
Table 70. Ningbo Baosi Energy Equipment Company Summary
Table 71. Ningbo Baosi Energy Equipment Semiconductor Dry Vacuum Pump Product Offerings
Table 72. Ningbo Baosi Energy Equipment Semiconductor Dry Vacuum Pump Sales (K Units), Revenue (US$, Mn) and Average Price (K US$/Unit) & (2019-2024)
Table 73. Ningbo Baosi Energy Equipment Key News & Latest Developments
Table 74. LOTVACUUM Company Summary
Table 75. LOTVACUUM Semiconductor Dry Vacuum Pump Product Offerings
Table 76. LOTVACUUM Semiconductor Dry Vacuum Pump Sales (K Units), Revenue (US$, Mn) and Average Price (K US$/Unit) & (2019-2024)
Table 77. LOTVACUUM Key News & Latest Developments
Table 78. Taiko Kikai Industries Company Summary
Table 79. Taiko Kikai Industries Semiconductor Dry Vacuum Pump Product Offerings
Table 80. Taiko Kikai Industries Semiconductor Dry Vacuum Pump Sales (K Units), Revenue (US$, Mn) and Average Price (K US$/Unit) & (2019-2024)
Table 81. Taiko Kikai Industries Key News & Latest Developments
Table 82. Busch Vacuum Company Summary
Table 83. Busch Vacuum Semiconductor Dry Vacuum Pump Product Offerings
Table 84. Busch Vacuum Semiconductor Dry Vacuum Pump Sales (K Units), Revenue (US$, Mn) and Average Price (K US$/Unit) & (2019-2024)
Table 85. Busch Vacuum Key News & Latest Developments
Table 86. EVP Vacuum Technology Company Summary
Table 87. EVP Vacuum Technology Semiconductor Dry Vacuum Pump Product Offerings
Table 88. EVP Vacuum Technology Semiconductor Dry Vacuum Pump Sales (K Units), Revenue (US$, Mn) and Average Price (K US$/Unit) & (2019-2024)
Table 89. EVP Vacuum Technology Key News & Latest Developments
Table 90. Scroll Laboratories, Inc Company Summary
Table 91. Scroll Laboratories, Inc Semiconductor Dry Vacuum Pump Product Offerings
Table 92. Scroll Laboratories, Inc Semiconductor Dry Vacuum Pump Sales (K Units), Revenue (US$, Mn) and Average Price (K US$/Unit) & (2019-2024)
Table 93. Scroll Laboratories, Inc Key News & Latest Developments
Table 94. ULVAC, Inc Company Summary
Table 95. ULVAC, Inc Semiconductor Dry Vacuum Pump Product Offerings
Table 96. ULVAC, Inc Semiconductor Dry Vacuum Pump Sales (K Units), Revenue (US$, Mn) and Average Price (K US$/Unit) & (2019-2024)
Table 97. ULVAC, Inc Key News & Latest Developments
Table 98. Highvac Corporation Company Summary
Table 99. Highvac Corporation Semiconductor Dry Vacuum Pump Product Offerings
Table 100. Highvac Corporation Semiconductor Dry Vacuum Pump Sales (K Units), Revenue (US$, Mn) and Average Price (K US$/Unit) & (2019-2024)
Table 101. Highvac Corporation Key News & Latest Developments
Table 102. Osaka Vacuum, Ltd Company Summary
Table 103. Osaka Vacuum, Ltd Semiconductor Dry Vacuum Pump Product Offerings
Table 104. Osaka Vacuum, Ltd Semiconductor Dry Vacuum Pump Sales (K Units), Revenue (US$, Mn) and Average Price (K US$/Unit) & (2019-2024)
Table 105. Osaka Vacuum, Ltd Key News & Latest Developments
Table 106. Semiconductor Dry Vacuum Pump Capacity of Key Manufacturers in Global Market, 2022-2024 (K Units)
Table 107. Global Semiconductor Dry Vacuum Pump Capacity Market Share of Key Manufacturers, 2022-2024
Table 108. Global Semiconductor Dry Vacuum Pump Production by Region, 2019-2024 (K Units)
Table 109. Global Semiconductor Dry Vacuum Pump Production by Region, 2025-2030 (K Units)
Table 110. Semiconductor Dry Vacuum Pump Market Opportunities & Trends in Global Market
Table 111. Semiconductor Dry Vacuum Pump Market Drivers in Global Market
Table 112. Semiconductor Dry Vacuum Pump Market Restraints in Global Market
Table 113. Semiconductor Dry Vacuum Pump Raw Materials
Table 114. Semiconductor Dry Vacuum Pump Raw Materials Suppliers in Global Market
Table 115. Typical Semiconductor Dry Vacuum Pump Downstream
Table 116. Semiconductor Dry Vacuum Pump Downstream Clients in Global Market
Table 117. Semiconductor Dry Vacuum Pump Distributors and Sales Agents in Global Market

List of Figures
Figure 1. Semiconductor Dry Vacuum Pump Segment by Type in 2023
Figure 2. Semiconductor Dry Vacuum Pump Segment by Application in 2023
Figure 3. Global Semiconductor Dry Vacuum Pump Market Overview: 2023
Figure 4. Key Caveats
Figure 5. Global Semiconductor Dry Vacuum Pump Market Size: 2023 VS 2030 (US$, Mn)
Figure 6. Global Semiconductor Dry Vacuum Pump Revenue: 2019-2030 (US$, Mn)
Figure 7. Semiconductor Dry Vacuum Pump Sales in Global Market: 2019-2030 (K Units)
Figure 8. The Top 3 and 5 Players Market Share by Semiconductor Dry Vacuum Pump Revenue in 2023
Figure 9. Segment by Type – Global Semiconductor Dry Vacuum Pump Revenue, (US$, Mn), 2023 & 2030
Figure 10. Segment by Type – Global Semiconductor Dry Vacuum Pump Revenue Market Share, 2019-2030
Figure 11. Segment by Type – Global Semiconductor Dry Vacuum Pump Sales Market Share, 2019-2030
Figure 12. Segment by Type – Global Semiconductor Dry Vacuum Pump Price (K US$/Unit), 2019-2030
Figure 13. Segment by Application – Global Semiconductor Dry Vacuum Pump Revenue, (US$, Mn), 2023 & 2030
Figure 14. Segment by Application – Global Semiconductor Dry Vacuum Pump Revenue Market Share, 2019-2030
Figure 15. Segment by Application – Global Semiconductor Dry Vacuum Pump Sales Market Share, 2019-2030
Figure 16. Segment by Application -Global Semiconductor Dry Vacuum Pump Price (K US$/Unit), 2019-2030
Figure 17. By Region – Global Semiconductor Dry Vacuum Pump Revenue, (US$, Mn), 2023 & 2030
Figure 18. By Region – Global Semiconductor Dry Vacuum Pump Revenue Market Share, 2019 VS 2023 VS 2030
Figure 19. By Region – Global Semiconductor Dry Vacuum Pump Revenue Market Share, 2019-2030
Figure 20. By Region – Global Semiconductor Dry Vacuum Pump Sales Market Share, 2019-2030
Figure 21. By Country – North America Semiconductor Dry Vacuum Pump Revenue Market Share, 2019-2030
Figure 22. By Country – North America Semiconductor Dry Vacuum Pump Sales Market Share, 2019-2030
Figure 23. United States Semiconductor Dry Vacuum Pump Revenue, (US$, Mn), 2019-2030
Figure 24. Canada Semiconductor Dry Vacuum Pump Revenue, (US$, Mn), 2019-2030
Figure 25. Mexico Semiconductor Dry Vacuum Pump Revenue, (US$, Mn), 2019-2030
Figure 26. By Country – Europe Semiconductor Dry Vacuum Pump Revenue Market Share, 2019-2030
Figure 27. By Country – Europe Semiconductor Dry Vacuum Pump Sales Market Share, 2019-2030
Figure 28. Germany Semiconductor Dry Vacuum Pump Revenue, (US$, Mn), 2019-2030
Figure 29. France Semiconductor Dry Vacuum Pump Revenue, (US$, Mn), 2019-2030
Figure 30. U.K. Semiconductor Dry Vacuum Pump Revenue, (US$, Mn), 2019-2030
Figure 31. Italy Semiconductor Dry Vacuum Pump Revenue, (US$, Mn), 2019-2030
Figure 32. Russia Semiconductor Dry Vacuum Pump Revenue, (US$, Mn), 2019-2030
Figure 33. Nordic Countries Semiconductor Dry Vacuum Pump Revenue, (US$, Mn), 2019-2030
Figure 34. Benelux Semiconductor Dry Vacuum Pump Revenue, (US$, Mn), 2019-2030
Figure 35. By Region – Asia Semiconductor Dry Vacuum Pump Revenue Market Share, 2019-2030
Figure 36. By Region – Asia Semiconductor Dry Vacuum Pump Sales Market Share, 2019-2030
Figure 37. China Semiconductor Dry Vacuum Pump Revenue, (US$, Mn), 2019-2030
Figure 38. Japan Semiconductor Dry Vacuum Pump Revenue, (US$, Mn), 2019-2030
Figure 39. South Korea Semiconductor Dry Vacuum Pump Revenue, (US$, Mn), 2019-2030
Figure 40. Southeast Asia Semiconductor Dry Vacuum Pump Revenue, (US$, Mn), 2019-2030
Figure 41. India Semiconductor Dry Vacuum Pump Revenue, (US$, Mn), 2019-2030
Figure 42. By Country – South America Semiconductor Dry Vacuum Pump Revenue Market Share, 2019-2030
Figure 43. By Country – South America Semiconductor Dry Vacuum Pump Sales, Market Share, 2019-2030
Figure 44. Brazil Semiconductor Dry Vacuum Pump Revenue, (US$, Mn), 2019-2030
Figure 45. Argentina Semiconductor Dry Vacuum Pump Revenue, (US$, Mn), 2019-2030
Figure 46. By Country – Middle East & Africa Semiconductor Dry Vacuum Pump Revenue, Market Share, 2019-2030
Figure 47. By Country – Middle East & Africa Semiconductor Dry Vacuum Pump Sales, Market Share, 2019-2030
Figure 48. Turkey Semiconductor Dry Vacuum Pump Revenue, (US$, Mn), 2019-2030
Figure 49. Israel Semiconductor Dry Vacuum Pump Revenue, (US$, Mn), 2019-2030
Figure 50. Saudi Arabia Semiconductor Dry Vacuum Pump Revenue, (US$, Mn), 2019-2030
Figure 51. UAE Semiconductor Dry Vacuum Pump Revenue, (US$, Mn), 2019-2030
Figure 52. Global Semiconductor Dry Vacuum Pump Production Capacity (K Units), 2019-2030
Figure 53. The Percentage of Production Semiconductor Dry Vacuum Pump by Region, 2023 VS 2030
Figure 54. Semiconductor Dry Vacuum Pump Industry Value Chain
Figure 55. Marketing Channels