SEMICONDUCTOR INSIGHT
MARKET RESEARCH REPORT

Semiconductor Automated Test Equipment (ATE) Market

2026 to 2034
MARKET INTELLIGENCE
ACROSS KEY REGIONS
2026 EDITION
ELECTRONIC COMPONENTS Semiconductor Market Research

Semiconductor Automated Test Equipment (ATE) Market

Trends, Business Strategies 2026-2034

◷
UPDATED 16 September 2026
▤
REPORT LENGTH Detailed Report
▣
REPORT CODE 38211c2253ec
▯
FORMATS PDF

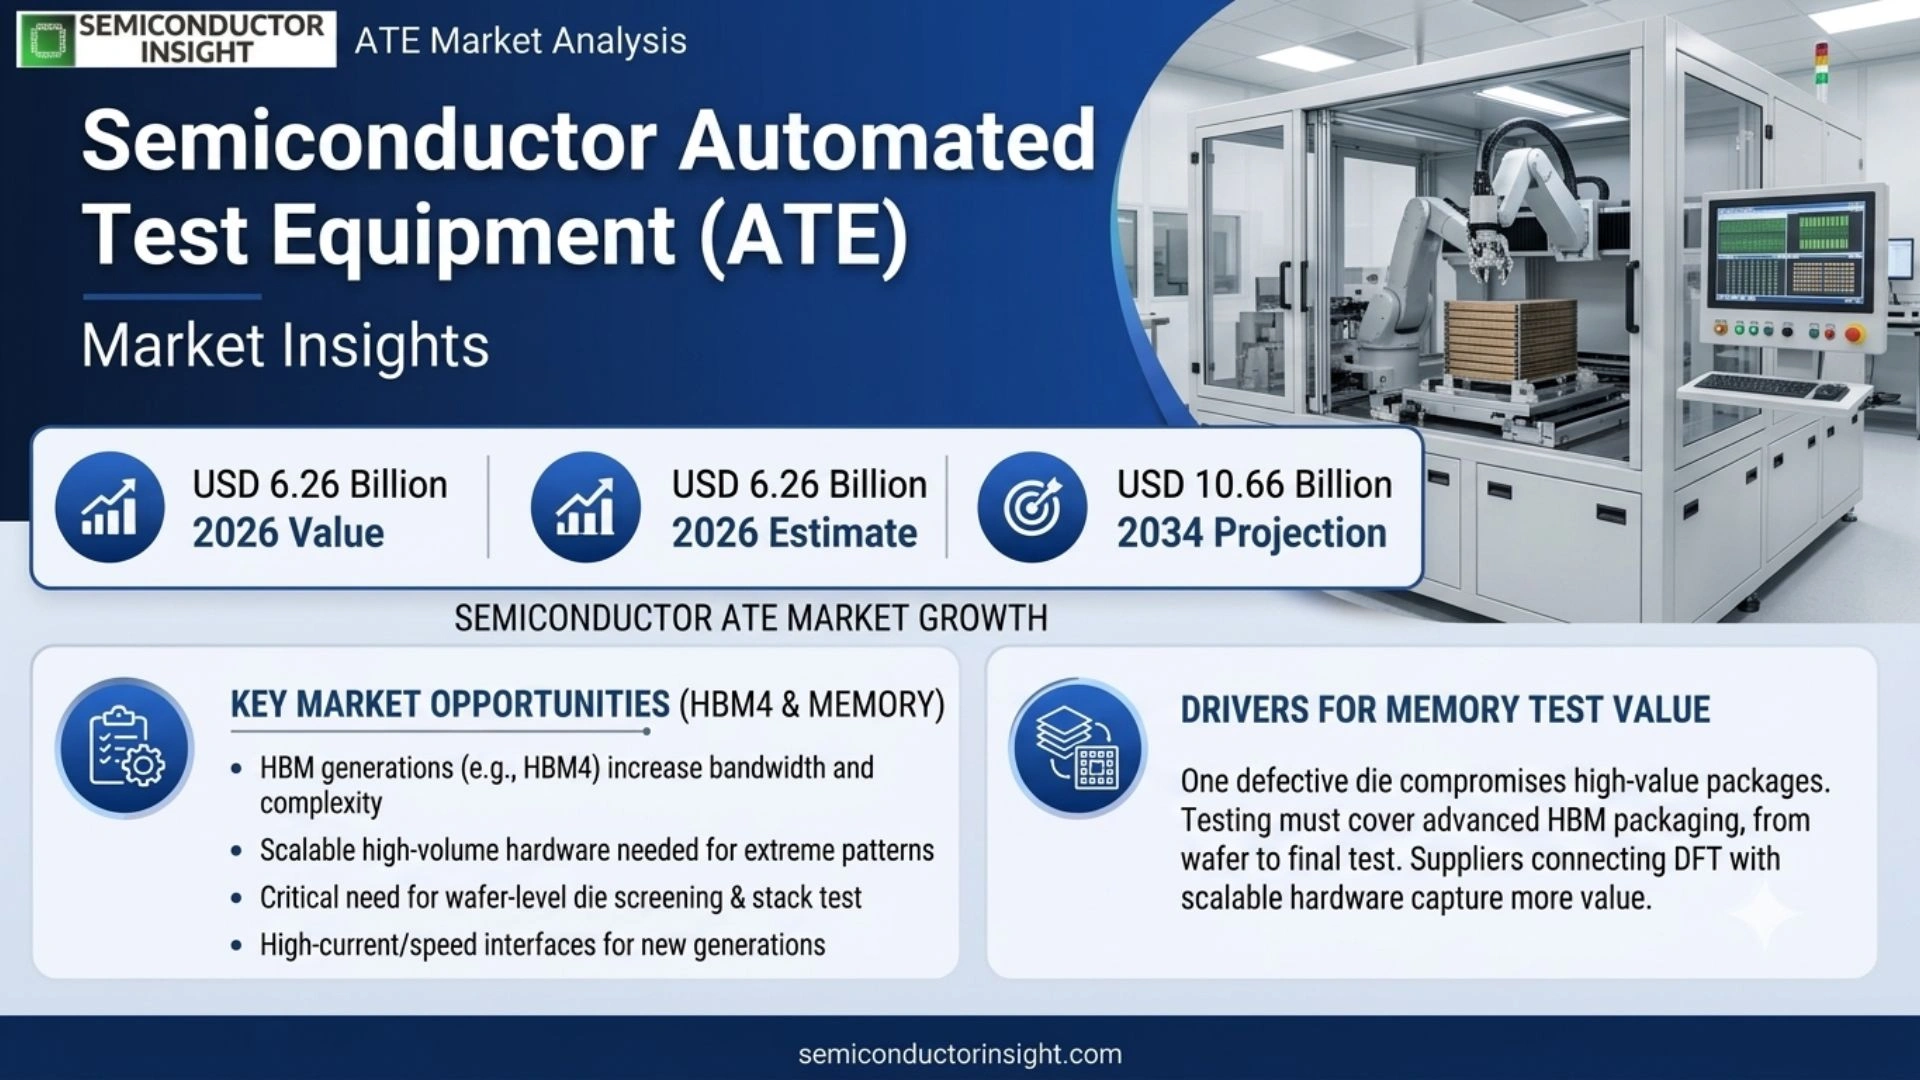
Semiconductor Automated Test Equipment (ATE) market is valued at USD 5.85 billion in 2025, increases to an estimated USD 6.26 billion in 2026, and is projected to reach USD 10.66 billion by 2034. The selected source-page size anchors imply a 6.9% CAGR during 2026–2034. Asia Pacific is the largest market in 2025 because the source page explicitly calls Asia Pacific the global leader by both volume and value, while current demand is being reshaped by AI and high-performance-computing test intensity, HBM and DRAM final test, advanced SoC complexity, wafer-level known-good-die requirements, heterogeneous integration, automotive qualification and a strong 2026 rebound in semiconductor test-equipment spending.

Get the sample PDF with study scope, segmentation and methodology details.

Key Statistics

2025 Market Size
USD 5.85 billion
2034 Projected Market Size
USD 10.66 billion
CAGR (2026–2034)
6.9%
Largest Market in 2025
Asia Pacific

Key Takeaways

  • SoC Testers dominate the source-page type segmentation because AI accelerators, high-performance CPUs, networking ASICs and mixed-signal devices require large pattern volumes, high pin counts, high-speed digital resources and increasingly complex power delivery and calibration.
  • IT & Telecommunications is the leading source-page application. Teradyne reported USD 1.122 billion of Semiconductor Test revenue in Q2 2026 and said AI compute and memory demand drove record results, while Advantest’s Q1 FY2026 Test System sales increased 38.7% year over year to JPY 333.6 billion.
  • Asia Pacific is the largest and fastest-growing region on the source page, with a 2024 combined China plus ex-China Asia-Pacific value of about USD 4.79 billion and a 2030 projection near USD 7.35 billion. China alone is cited at USD 1.63 billion in 2024.
  • The wider test-equipment cycle has accelerated sharply. SEMI’s July 2026 forecast projects semiconductor test-equipment sales of USD 15.3 billion in 2026, up 31%, after 55.3% growth in 2025, supported by AI, HBM, advanced packaging and more rigorous device reliability requirements.
  • The source-page size anchors imply lower growth than the printed CAGR. USD 5.475 billion in 2024 and USD 9.331 billion in 2032 imply approximately 6.9% CAGR, not 8.1%, producing rebased values of about USD 5.85 billion in 2025 and USD 10.66 billion in 2034.

Semiconductor Automated Test Equipment (ATE) Market Overview

Semiconductor Automated Test Equipment (ATE) market is valued at USD 5.85 billion in 2025, increases to an estimated USD 6.26 billion in 2026, and is projected to reach USD 10.66 billion by 2034. The selected source-page size anchors imply a 6.9% CAGR during 2026–2034. Asia Pacific is the largest market in 2025 because the source page explicitly calls Asia Pacific the global leader by both volume and value, while current demand is being reshaped by AI and high-performance-computing test intensity, HBM and DRAM final test, advanced SoC complexity, wafer-level known-good-die requirements, heterogeneous integration, automotive qualification and a strong 2026 rebound in semiconductor test-equipment spending.

Base year: 2025 · Estimated year: 2026 · Forecast period: 2026–2034 · Values in USD million unless stated otherwise

Semiconductor automated test equipment combines high-speed instrumentation, pattern generation, precision analog resources, RF measurement, power supplies, device interfaces and production software to determine whether integrated circuits meet electrical and functional specifications. ATE is used at wafer probe, packaged final test and increasingly at system-level test. The economics are driven by test time, parallelism, uptime and coverage because a tester must identify defective devices quickly enough that test cost does not erase semiconductor manufacturing margin.

AI is changing both the volume and complexity of test demand. Teradyne’s Semiconductor Test revenue reached USD 1.122 billion in the second quarter of 2026, more than double the year-earlier level, with AI compute and memory cited as the primary drivers. Advantest reported Q1 FY2026 Test System sales of JPY 333.6 billion, up 38.7%, and said demand for SoC test systems increased significantly because production volumes of complex AI and HPC semiconductors were rising. These primary results validate the source page’s SoC-test leadership and show that the 2026 cycle is stronger than the older source forecast.

ATE growth is not limited to front-end advanced logic. HBM and DRAM need high-throughput memory test, GaN and SiC need high-voltage power-device test, silicon photonics requires optical/electrical test alignment and automotive parts require extended-temperature and reliability coverage. The source page therefore separates SoC, memory and discrete-device testers and also distinguishes wafer, package and system-level test, which is preserved in the article instead of collapsing the market into one generic tester category.

Segment Analysis: By Type

The source page segments the market into SoC Testers, Memory Testers and Discrete Device Testers. SoC Testers lead because advanced compute, networking and mixed-signal devices need highly flexible digital, analog and RF resources, while Memory Testers are benefiting strongly from HBM and DRAM demand and Discrete Device Testers gain from power-semiconductor electrification.

Type Technical / commercial role Market position
SoC Testers SoC testers combine high-speed digital channels, analog measurement, RF resources, device power supplies and software to test CPUs, GPUs, AI accelerators, connectivity ICs and mixed-signal devices. Modern systems must manage very large scan-pattern volumes and high parallelism while minimizing test time. Advanced-node devices also require sophisticated DFT integration and correlation between characterization and production. Dominant source-page segment. Advantest and Teradyne both reported record or near-record 2026 demand tied to AI compute. Product differentiation centers on channel density, timing accuracy, software ecosystem, multisite efficiency and the ability to reuse test content across engineering and production.
Memory Testers Memory testers verify DRAM, HBM, NAND and other memory for speed, retention, interface timing and failure modes. HBM raises test intensity because each stack contains multiple dies and must deliver enormous bandwidth with tight yield requirements. Final test and wafer-level screening both become more valuable as memory package cost increases. High-growth 2026 segment. Teradyne said memory revenue exceeded USD 200 million for the third consecutive quarter in Q2 2026, driven by HBM and DRAM plus renewed NAND final-test demand. Advantest also benefits from memory test through its broad installed base and AI-related device expansion.
Discrete Device Testers Discrete testers address power devices, analog components, diodes, transistors and specialty semiconductors. GaN and SiC introduce higher voltage, faster switching and demanding dynamic measurements, requiring specialized instrumentation and contact solutions. Automotive power devices add high-temperature and reliability screening requirements. Smaller but strategically important segment. Cohu announced approximately USD 5 million of multiple orders in May 2026 for next-generation GaN power-device testing for AI data centers, demonstrating how new power technologies create application-specific ATE demand.

Secondary segmentation: By Test Type

The source page divides semiconductor testing into Wafer Test, Package Test and System Level Test. Wafer Test is described as holding a significant share because early defect detection protects downstream packaging value, while final and system-level test remain critical as devices become more complex and heterogeneous. For ATE suppliers, the commercial consequence is that test coverage, parallelism, software readiness, installed-base utilization and customer qualification determine revenue quality much more directly than broad semiconductor unit shipments.

Test type Commercial implication
Wafer Test Wafer test uses probers, probe cards and ATE before die separation. It is economically important for known-good-die strategies in HBM, chiplets and advanced packages because a defective die can otherwise destroy expensive assembly value. Test coverage must be balanced against wafer throughput and probe-card contact limits.
Package Test Final and burn-in test verify packaged devices across functional, speed, thermal and reliability conditions. Packaging can introduce defects that are not visible at wafer test, so final test remains essential for automotive, memory and high-value SoCs. Handler integration and parallelism strongly affect throughput.
System Level Test System-level test exercises devices in a more application-like environment and can catch defects missed by structural or parametric testing. It is gaining importance for complex SoCs, chiplets and AI devices, but adds cost and floor space, so customers use it where downstream failure risk justifies the added coverage.

Secondary segmentation: By End User

The source page identifies Integrated Device Manufacturers, Foundries, OSAT Providers and Research & Development Institutions. IDMs and foundries are described as core end users because they control wafer-level manufacturing and yield, while OSATs are increasingly important as advanced packaging expands test insertion points. This distinction matters because SoC, memory and power-device test use different instruments and interface hardware, so AI growth can create sharply different demand across tester platforms and customer production stages.

End user Demand characteristics
Integrated Device Manufacturers (IDMs) IDMs such as memory and automotive semiconductor companies own product, process and test flows and may purchase both engineering and high-volume production testers. They value platform continuity because test programs and hardware are reused across generations and multiple production sites.
Foundries Foundries support many fabless customers and therefore need flexible characterization and production systems that can handle diverse SoCs, process-monitor structures and advanced-node devices. Their test strategy also interacts with OSAT and customer-owned test flows, making ecosystem compatibility important.
OSAT Providers OSATs run package test, burn-in, system-level test and some wafer probe for many customers. Advanced packaging and HBM increase the number of test insertions and the value of rapid equipment utilization, creating strong demand for multisite and modular ATE platforms.
Research & Development Institutions R&D labs use flexible testers for device characterization, DFT development, silicon bring-up and process research. Volumes are small but instrumentation flexibility is high, and tools can influence later production-platform selection when engineering and manufacturing environments are aligned.

Segment Analysis: By Application

By application, the source page lists Automotive, Consumer Electronics, Defense and Aerospace, IT & Telecommunications and Others. IT & Telecommunications leads because AI data centers, 5G infrastructure and networking devices require large volumes of high-performance SoCs and memory, while automotive and defense create high-value reliability-driven test requirements. Buyers therefore evaluate seconds of test, multisite efficiency, uptime, correlation, software ecosystem, local service and reuse of existing instrumentation before committing to a new production tester.

Application Demand characteristics
IT & Telecommunications AI accelerators, data-center CPUs, networking ASICs, optical devices and memory create the strongest 2026 test demand. Teradyne’s record compute and memory revenue and Advantest’s 38.7% Test System growth provide direct evidence. Device complexity increases test vectors, channel count and power requirements, supporting both new systems and higher-value configurations.
Automotive ADAS, powertrain, radar, zonal controllers and EV power devices require high test coverage and extended temperature ranges because field failure can create safety or warranty risk. Growth is slower than AI in 2026, but qualification and long production lifecycles create durable tester and handler demand.
Consumer Electronics Smartphones, PCs, wearables and appliances generate very large semiconductor units but remain cyclical and cost sensitive. Test economics depend on high parallelism and low seconds-per-device. Premium mobile SoCs and RF devices require sophisticated mixed-signal and RF resources, while commodity devices use more mature platforms.
Defense and Aerospace Defense, aerospace and space electronics require traceability, high reliability, long lifecycle and specialized analog/RF test. Volumes are low relative to consumer or AI, but equipment configurations can be expensive because they need wide performance ranges and support for legacy devices.
Others Other applications include industrial, medical, power electronics and silicon photonics. Cohu’s GaN orders and Advantest’s OpenLight silicon-photonics collaboration show that new device classes can create niche ATE requirements that are technically distinct from mainstream SoC or memory test.

Semiconductor Automated Test Equipment (ATE) Market Share

Regional Analysis

The source page explicitly calls Asia Pacific the undisputed global leader by both volume and value and gives a combined China plus ex-China regional value of about USD 4.79 billion in 2024, rising to nearly USD 7.35 billion by 2030. China is separately estimated at USD 1.63 billion in 2024 and USD 2.77 billion by 2030, making it one of the page’s most quantitative regional sections.

Why does Asia Pacific dominate ATE while North America remains strategically critical?

ATE demand follows semiconductor manufacturing, packaging and test capacity more closely than chip consumption. Asia Pacific contains the largest concentration of foundries, memory IDMs and OSATs, producing the greatest installed tester base. North America hosts Teradyne, major fabless AI companies and growing U.S. fab investment. Europe specializes in automotive, aerospace and industrial reliability, while South America and MEA remain much smaller because local wafer and package-test infrastructure is limited.

Region Position Growth outlook Demand profile What decides supplier selection
Asia Pacific Largest & fastest-growing High Foundry, HBM, OSAT and local semiconductor expansion-led Throughput, local service, AI/HBM capability and price
North America Innovation and high-value hub High AI SoC, networking and reshoring-led Platform flexibility, DFT ecosystem and customer co-development
Europe Specialized reliability market Moderate to high Automotive, aerospace and industrial-led Temperature coverage, zero-defect capability and lifecycle
South America Nascent Low to moderate Mature-node and repair/test-led Cost, imported equipment and local manufacturing scale
Middle East & Africa Early-stage Low from small base Future semiconductor and technology projects-led Project scale, support and actual local test capacity
Asia Pacific LARGEST BY VOLUME & VALUE

Why does Asia Pacific dominate ATE demand?

The source page estimates a combined China plus ex-China Asia-Pacific market of about USD 4.79 billion in 2024 and nearly USD 7.35 billion by 2030. Taiwan, South Korea, China and Japan contain leading foundries, memory manufacturers, OSATs and ATE suppliers, creating dense demand for advanced and mature test systems. Through 2034, suppliers that connect design-for-test workflows with scalable high-volume hardware can capture more value as AI, HBM and heterogeneous integration add test insertions and pattern complexity.

Market positionLargest & fastest-growing
2024 source-page value~USD 4.79 billion
2030 source-page value~USD 7.35 billion
Demand profileFoundry, HBM and OSAT-led
Country / subregion Position Demand mechanism
China Fast-growing national market The source page estimates USD 1.63 billion in 2024 and USD 2.77 billion by 2030. Domestic suppliers such as Hangzhou Changchuan and Beijing Huafeng compete against global vendors, supported by local semiconductor expansion.
Taiwan Foundry and OSAT hub Leading foundry and packaging capacity creates constant wafer, package and system-level test demand. Chroma and other regional suppliers benefit from proximity, while global vendors maintain large service organizations around major customers.
South Korea & Japan Memory and ATE supplier stronghold South Korea’s HBM and DRAM manufacturing drives memory testers, while Japan hosts Advantest, ACCRETECH, TEL and Shibasoku. Advantest’s Q1 FY2026 Test System sales reached JPY 333.6 billion, showing the region’s supplier scale.

Market instances

  • Advantest reported Q1 FY2026 Test System sales of JPY 333.6 billion, up 38.7% year over year, and said SoC tester demand rose significantly with higher production of complex AI and HPC semiconductors. The company’s Japanese base and Asian customer concentration make this a direct indicator of regional advanced-test momentum. For semiconductor ATE vendors, the development matters because it changes a measurable tester demand, product capability, utilization, test methodology or application condition and therefore affects equipment revenue or installed-base expansion.
  • SEMI forecasts China, Taiwan and Korea to remain the top three semiconductor-equipment spending destinations through 2028. Although that forecast covers broader equipment, the same leading-edge logic, HBM and packaging investments require substantial back-end test capacity and support the source page’s ATE regional ranking. For semiconductor ATE vendors, the development matters because it changes a measurable tester demand, product capability, utilization, test methodology or application condition and therefore affects equipment revenue or installed-base expansion.
  • China’s source-page ATE value rises from USD 1.63 billion in 2024 to USD 2.77 billion by 2030. Domestic tester suppliers are expanding in mid-range and power-device applications, adding price competition and localization pressure to established Advantest, Teradyne and Cohu platforms. For semiconductor ATE vendors, the development matters because it changes a measurable tester demand, product capability, utilization, test methodology or application condition and therefore affects equipment revenue or installed-base expansion.

Asia Pacific leads because semiconductor fabrication and package-test operations are physically concentrated there. Customer proximity matters because production ATE requires rapid applications engineering, calibration, spare parts and interface support. The market implication is that hardware shipment capacity alone does not guarantee revenue because each advanced device needs test-program development, interface engineering and production correlation before equipment can be fully utilized.

North America AI DESIGN & ATE INNOVATION HUB

Why is North America a high-value ATE market?

The source page estimates North America at USD 0.93 billion in 2024 and USD 1.51 billion by 2030. The region is smaller in production volume than Asia but hosts Teradyne, major AI and networking chip designers and U.S. fab expansion that drives high-value SoC and memory test development. For ATE suppliers, the commercial consequence is that test coverage, parallelism, software readiness, installed-base utilization and customer qualification determine revenue quality much more directly than broad semiconductor unit shipments.

Market positionInnovation and high-value hub
2024 source-page valueUSD 0.93 billion
2030 source-page valueUSD 1.51 billion
Demand profileAI compute and networking-led
Country / subregion Position Demand mechanism
United States Primary regional market Teradyne’s Q2 2026 Semiconductor Test revenue reached USD 1.122 billion, with compute and memory AI demand driving record results. U.S. fabless companies also influence test requirements through complex accelerator and networking designs.
Canada Research, photonics and specialty demand Canadian semiconductor and photonics R&D creates selective characterization and production-test needs. Equipment volumes are smaller, but advanced optical and mixed-signal requirements can be technically demanding.
Mexico Backend and electronics manufacturing link Electronics and automotive manufacturing create package-test and component-test demand through multinational supply chains, though leading-edge wafer-test volume remains smaller than in Asia.

Market instances

  • Teradyne reported Q2 2026 Semiconductor Test revenue of USD 1.122 billion, up 128% from the prior year, and said AI compute and memory were the principal drivers. Memory revenue exceeded USD 200 million for the third consecutive quarter, with HBM, DRAM and renewed NAND final test all contributing. For semiconductor ATE vendors, the development matters because it changes a measurable tester demand, product capability, utilization, test methodology or application condition and therefore affects equipment revenue or installed-base expansion.
  • Teradyne’s Q1 2026 Semiconductor Test revenue exceeded USD 1.0 billion for the first time, providing evidence that the AI-related test upcycle was already established before the second quarter. The company said compute demand was the main contributor, validating North America’s role in AI test development. For semiconductor ATE vendors, the development matters because it changes a measurable tester demand, product capability, utilization, test methodology or application condition and therefore affects equipment revenue or installed-base expansion.
  • Cohu reported second-quarter 2026 sales of USD 149 million, up 38% year over year, and estimated semiconductor test-cell utilization at 80%. Cohu also expanded its AI-driven compute opportunity pipeline, demonstrating broader improvement beyond the two largest ATE vendors. For semiconductor ATE vendors, the development matters because it changes a measurable tester demand, product capability, utilization, test methodology or application condition and therefore affects equipment revenue or installed-base expansion.

North America’s influence is disproportionately high because major chip designers and ATE suppliers co-develop next-generation test solutions even when the physical volume production later occurs in Asia. This distinction matters because SoC, memory and power-device test use different instruments and interface hardware, so AI growth can create sharply different demand across tester platforms and customer production stages.

Europe AUTOMOTIVE & HIGH-RELIABILITY TEST

What differentiates European ATE demand?

The source page emphasizes automotive, aerospace, defense and industrial applications rather than consumer-electronics volume. These markets require extended-temperature, high-voltage, RF and zero-defect test capability, creating a specialized equipment opportunity even though Europe’s overall tester installed base is smaller than Asia’s. Buyers therefore evaluate seconds of test, multisite efficiency, uptime, correlation, software ecosystem, local service and reuse of existing instrumentation before committing to a new production tester.

Market positionSpecialized reliability market
Growth outlookModerate to high
Demand profileAutomotive, aerospace and industrial-led
Market access gateReliability, temperature and lifecycle support
Country / subregion Position Demand mechanism
Germany Automotive and power-semiconductor hub Automotive and industrial semiconductor production creates demand for mixed-signal, power-device and high-temperature test. Long vehicle lifecycles make platform support and calibration continuity commercially important.
Italy ATE supplier niche SPEA is included in the source company list and serves semiconductor and electronics test applications. Regional industrial and automotive customers support specialized configurations rather than hyperscale AI volume.
France & Rest of Europe Aerospace, defense and industrial demand Space, avionics and industrial electronics require low-volume but high-coverage test. European semiconductor investment under regional industrial policy can add local ATE installations over time.

Market instances

  • The source page explicitly identifies automotive quality and safety as Europe’s central ATE demand mechanism. ADAS, powertrain and infotainment devices require test across extended temperature and failure modes, supporting more instrumentation per device than ordinary consumer ICs. For semiconductor ATE vendors, the development matters because it changes a measurable tester demand, product capability, utilization, test methodology or application condition and therefore affects equipment revenue or installed-base expansion.
  • Cohu announced multiple orders totaling approximately USD 5 million in May 2026 for next-generation GaN power-device testing for AI data centers. While the orders are global, the same high-voltage test capabilities are relevant to Europe’s strong power-semiconductor and automotive electronics ecosystem. For semiconductor ATE vendors, the development matters because it changes a measurable tester demand, product capability, utilization, test methodology or application condition and therefore affects equipment revenue or installed-base expansion.
  • European aerospace and defense customers maintain long product lifecycles and strict traceability. ATE vendors can therefore generate durable service and upgrade revenue from specialized installed bases even when annual system volumes are smaller than Asian high-volume manufacturing. For semiconductor ATE vendors, the development matters because it changes a measurable tester demand, product capability, utilization, test methodology or application condition and therefore affects equipment revenue or installed-base expansion.

Europe’s ATE market is value dense rather than volume led. Automotive and aerospace qualification can justify complex tester configurations and long support contracts that protect supplier relationships. Through 2034, suppliers that connect design-for-test workflows with scalable high-volume hardware can capture more value as AI, HBM and heterogeneous integration add test insertions and pattern complexity.

South America NASCENT MATURE-NODE MARKET

What limits South American ATE growth?

The source page describes the region as nascent because local semiconductor manufacturing infrastructure is limited and electronics are largely imported. Brazil and Argentina offer gradual growth through automotive and consumer electronics, but leading-edge ATE demand remains tied to actual local wafer or package-test investment rather than end-device consumption. The market implication is that hardware shipment capacity alone does not guarantee revenue because each advanced device needs test-program development, interface engineering and production correlation before equipment can be fully utilized.

Market positionNascent
Growth outlookLow to moderate
Demand profileMature-node and electronics manufacturing-led
Market access gateLocal test operations and equipment cost
Country / subregion Position Demand mechanism
Brazil Largest regional opportunity Semiconductor packaging, electronics and automotive manufacturing can support mature-node and package-test equipment. New ATE purchases depend on local production programs rather than broad consumer chip demand.
Argentina Small electronics market Economic volatility and limited semiconductor infrastructure constrain capital investment. Test demand is more likely in repair, characterization and electronics manufacturing than advanced production.
Rest of Region Project-based demand Research and specialty electronics can use flexible lower-volume ATE, but most advanced chips are tested before import and do not create local production tester demand.

Market instances

  • The source page specifically warns that South American market expansion is likely to focus on mature technologies and repair rather than leading-edge production. This distinction is important because electronic-device consumption alone does not create ATE demand if semiconductor test occurs overseas. For semiconductor ATE vendors, the development matters because it changes a measurable tester demand, product capability, utilization, test methodology or application condition and therefore affects equipment revenue or installed-base expansion.
  • Brazil provides the most credible regional opportunity through existing electronics, automotive and semiconductor-backend activity. Suppliers that can offer refurbished, modular or mid-range systems may address cost-sensitive production better than high-end AI platforms designed for Asian or U.S. fabs. For semiconductor ATE vendors, the development matters because it changes a measurable tester demand, product capability, utilization, test methodology or application condition and therefore affects equipment revenue or installed-base expansion.
  • Service economics are challenging because a small installed base raises spare-parts and engineering costs. Regional distributors and remote diagnostics therefore become more important to commercial viability than in dense semiconductor clusters where vendor field teams can support many testers. For semiconductor ATE vendors, the development matters because it changes a measurable tester demand, product capability, utilization, test methodology or application condition and therefore affects equipment revenue or installed-base expansion.

South America remains an opportunistic ATE market. Growth should be tied to verified local semiconductor test capacity rather than inferred from automotive or consumer-electronics sales. For ATE suppliers, the commercial consequence is that test coverage, parallelism, software readiness, installed-base utilization and customer qualification determine revenue quality much more directly than broad semiconductor unit shipments.

Middle East & Africa LONG-HORIZON SEMICONDUCTOR OPPORTUNITY

What could create an ATE market in MEA?

The source page describes the region as underdeveloped for semiconductor ATE because most chips are fabricated and tested elsewhere. UAE and Saudi technology-diversification programs create long-term potential, but meaningful ATE demand requires actual wafer fabs, packaging plants or semiconductor R&D infrastructure rather than data-center construction alone. This distinction matters because SoC, memory and power-device test use different instruments and interface hardware, so AI growth can create sharply different demand across tester platforms and customer production stages.

Market positionEarly-stage
Growth outlookLow from small base
Demand profileFuture semiconductor projects-led
Market access gateActual fab/test investment and technical support
Country / subregion Position Demand mechanism
UAE & Saudi Arabia Strategic investment markets Government technology programs may create future semiconductor design, packaging or manufacturing capability. ATE demand follows only when local test operations are installed.
Israel Existing semiconductor and R&D niche Established semiconductor design and manufacturing create direct characterization and production-test requirements, making Israel more mature than most of the broader region.
South Africa & Rest of Africa Research and electronics niche Industrial, telecom and research systems use imported chips and may require limited component or board test, but large-scale semiconductor ATE remains rare.

Market instances

  • The source page correctly distinguishes electronics demand from semiconductor-manufacturing demand in MEA. Data centers consume tested chips but do not themselves require wafer or final-test ATE, so local tester growth depends on future fab, OSAT or R&D projects. For semiconductor ATE vendors, the development matters because it changes a measurable tester demand, product capability, utilization, test methodology or application condition and therefore affects equipment revenue or installed-base expansion.
  • Israel’s existing semiconductor ecosystem can support specialized ATE and characterization needs through global vendor platforms. The remainder of the region has much less production infrastructure, making market development highly project specific. For semiconductor ATE vendors, the development matters because it changes a measurable tester demand, product capability, utilization, test methodology or application condition and therefore affects equipment revenue or installed-base expansion.
  • If Gulf industrial policy expands into advanced packaging or semiconductor manufacturing, test equipment will become a necessary part of the ecosystem. Vendors with scalable service and training models could enter early, but near-term volume remains small. For semiconductor ATE vendors, the development matters because it changes a measurable tester demand, product capability, utilization, test methodology or application condition and therefore affects equipment revenue or installed-base expansion.

MEA is a strategic option value rather than a current large ATE market. Equipment demand should be recognized only when semiconductor production or packaging projects move from policy discussion into installed capacity. Buyers therefore evaluate seconds of test, multisite efficiency, uptime, correlation, software ecosystem, local service and reuse of existing instrumentation before committing to a new production tester.

Competitive Landscape

The source page profiles thirteen companies: Advantest, Teradyne, Cohu, Tokyo Seimitsu, Tokyo Electron, Hangzhou Changchuan Technology, Beijing Huafeng Test & Control Technology, Chroma ATE, Hon Precision Industry, SPEA, Shibasoku, Macrotest and PowerTECH Technology. It states the top five held 85.99% of 2023 revenue, indicating high concentration, although several listed companies participate in adjacent test, prober or backend roles rather than identical ATE platforms.

Advantest and Teradyne are the clear scale leaders in semiconductor ATE. Advantest’s Q1 FY2026 Test System sales reached JPY 333.6 billion, while Teradyne generated USD 2.233 billion of Semiconductor Test revenue in the first six months of 2026. Their scale supports large software ecosystems, global applications engineering and rapid investment in AI, HBM and advanced SoC test resources.

Cohu is smaller but combines ATE with handlers, contactors, inspection and analytics, allowing it to address the complete test cell. Its 2026 GaN orders and improving utilization illustrate specialization in power and mixed-signal applications. Chroma and SPEA also compete in power and specialty test, while Changchuan and Huafeng benefit from China localization and cost-sensitive domestic demand.

Tokyo Seimitsu is better known for probers and metrology and Tokyo Electron is a broad semiconductor-equipment leader rather than a pure ATE vendor. PowerTECH Technology is also associated with backend semiconductor services. These source-page names are preserved for fidelity, but the competitive tiering distinguishes core ATE suppliers from adjacent equipment or service roles instead of presenting all thirteen as equivalent tester OEMs.

Competitive tier Companies Why they matter
Global ATE scale leaders Advantest Corporation; Teradyne, Inc. These two vendors dominate advanced SoC and memory test and have the broadest global support, software and instrumentation ecosystems. Their 2026 results show unusually strong AI-driven growth and large installed-base leverage.
Diversified / specialty test suppliers Cohu, Inc.; Chroma ATE Inc.; SPEA S.p.A.; Shibasoku Co., Ltd.; Hangzhou Changchuan Technology; Beijing Huafeng Test & Control Technology These vendors compete through power-device, analog, mixed-signal, handler/test-cell integration or regional cost advantages. China-based suppliers can gain share where domestic sourcing and mid-range pricing matter.
Adjacent source-profile participants Tokyo Seimitsu (ACCRETECH); Tokyo Electron Limited; Hon Precision Industry; Macrotest Inc.; PowerTECH Technology Inc. These source-listed companies participate in probers, broader semiconductor equipment, backend test or related production activities. They remain in the formal scope but should not be treated as directly interchangeable full-line ATE suppliers.

Companies profiled in the report

The source page profiles Advantest Corporation (Japan); Teradyne, Inc. (U.S.); Cohu, Inc. (U.S.); Tokyo Seimitsu (ACCRETECH) (Japan); Tokyo Electron Limited (TEL) (Japan); Hangzhou Changchuan Technology Co., Ltd. (China); Beijing Huafeng Test & Control Technology Co., Ltd. (China); Chroma ATE Inc. (Taiwan); Hon Precision Industry Co., Ltd. (Taiwan); SPEA S.p.A. (Italy); Shibasoku Co., Ltd. (Japan); Macrotest Inc. (Taiwan); and PowerTECH Technology Inc. (Taiwan).

Production Capacity Analysis

ATE production capacity is constrained by high-speed instrumentation, custom ASICs, precision analog hardware, system integration, calibration, burn-in and software engineering rather than simple metal fabrication. Vendors must also build application engineering capacity because every advanced customer requires test-program development, correlation and debug. The 2026 AI surge therefore stresses both hardware supply and engineering throughput.

Advantest and Teradyne demonstrate the scale of current effective capacity through revenue rather than published system units. Advantest’s Test System business generated JPY 333.6 billion in one quarter, while Teradyne’s Semiconductor Test segment generated USD 1.122 billion in Q2 2026. These values imply large volumes of high-end configured systems, upgrades and instrumentation serving complex AI and memory production.

Test-system capacity also depends on semiconductor components inside the tester. High-speed pin electronics, converters, power supplies and custom processors can become bottlenecks during industry upcycles. Because customers expect precise calibration and long service life, ATE vendors cannot substitute components freely without validation. This makes supply-chain management and internal ASIC design important to shipment capability.

Field applications engineering is another capacity layer. AI and HBM customers need DFT correlation, vector debug, thermal management, multisite optimization and rapid yield analysis. Advantest’s July 2026 SiConic expansion into DFT engineering shows suppliers moving more development work upstream so production-ready test content can be created before high-volume manufacturing begins.

Market Dynamics

The ATE market is driven by AI/HBM, advanced SoC complexity, more test insertions and semiconductor regionalization, but it faces customer concentration, long development cycles, cyclical capital spending and rapidly rising test cost. The key supplier challenge is to increase coverage and parallelism faster than device complexity increases seconds of test per die.

Market Drivers

Driver Directional impact* Commercial mechanism
AI compute & HBM High AI devices have more transistors, higher power, larger pattern volumes and more expensive packaging, making advanced SoC and memory test economically essential.
Heterogeneous integration High Chiplets and advanced packages require known-good-die screening and more wafer, final and system-level test insertions.
Automotive reliability Medium to High ADAS and power devices require extended-temperature and zero-defect-oriented testing, supporting specialized instrumentation and handlers.
Semiconductor regionalization Medium to High New fabs and OSAT sites require local tester installations, applications engineering and service even when the equipment technology is global.

AI changes test intensity faster than unit volume

An advanced accelerator can contain far more transistors, scan patterns, interfaces and power domains than a mainstream IC. It also enters an expensive package with HBM, making early defect detection more valuable. Teradyne and Advantest’s 2026 results show that test revenue can grow much faster than semiconductor unit shipments when complexity rises.

HBM creates multiple valuable test points

HBM combines many DRAM dies into a stack and must deliver extreme bandwidth. Wafer-level die screening, stack-related test and final memory test all become critical because one defective die can compromise a high-value package. Memory tester revenue therefore benefits from both higher volume and more stringent coverage. Through 2034, suppliers that connect design-for-test workflows with scalable high-volume hardware can capture more value as AI, HBM and heterogeneous integration add test insertions and pattern complexity.

Chiplets expand known-good-die requirements

Heterogeneous packages combine logic, memory and I/O dies from different processes. Test must identify good dies before assembly and often verify the completed package at additional stages. This adds insertion points and encourages system-level test, increasing equipment utilization per finished semiconductor. The market implication is that hardware shipment capacity alone does not guarantee revenue because each advanced device needs test-program development, interface engineering and production correlation before equipment can be fully utilized.

Automotive electronics raise reliability requirements

Power devices, radar, ADAS processors and vehicle controllers must operate across wide temperature and voltage ranges. The cost of field failure is high, so customers accept longer test time and more instrumentation than in commodity consumer devices, supporting specialized ATE and handler configurations. For ATE suppliers, the commercial consequence is that test coverage, parallelism, software readiness, installed-base utilization and customer qualification determine revenue quality much more directly than broad semiconductor unit shipments.

Market Restraints

Restraint Directional impact* Commercial mechanism
Customer concentration High A few large semiconductor customers can drive major portions of ATE demand, making supplier revenue sensitive to individual platform and capex decisions.
Cyclical semiconductor capex High ATE orders can rise or fall sharply with utilization and new-device ramps, creating difficult factory and workforce planning.
Rising cost of test Medium to High More patterns and test insertions can increase seconds per die; customers resist cost growth and demand greater parallelism and software optimization.
Long qualification / software development Medium Advanced ATE requires months of correlation, DFT, interface and production-program work before high-volume revenue is realized.

The customer base is highly concentrated

Teradyne explicitly notes that a limited number of significant customers account for a substantial portion of test-equipment purchases. When one hyperscaler, memory maker or handset platform changes timing, supplier revenue can move materially. This concentration increases forecasting risk even when long-term semiconductor complexity remains favorable. This distinction matters because SoC, memory and power-device test use different instruments and interface hardware, so AI growth can create sharply different demand across tester platforms and customer production stages.

ATE remains a cyclical capital-equipment market

Customers can extend use of installed testers during utilization downturns and then place large orders when new architectures ramp. Vendor factories and engineering teams therefore face uneven demand. The 2025–2026 AI surge illustrates the upside, but the same operating leverage can reverse when major programs pause. Buyers therefore evaluate seconds of test, multisite efficiency, uptime, correlation, software ecosystem, local service and reuse of existing instrumentation before committing to a new production tester.

Test cost must be controlled as complexity rises

More vectors, more pins and more test stages can increase seconds per device and reduce throughput. Semiconductor manufacturers therefore push ATE vendors to improve multisite parallelism, instrument density and adaptive test software so quality improves without an unsustainable rise in cost per good die. Through 2034, suppliers that connect design-for-test workflows with scalable high-volume hardware can capture more value as AI, HBM and heterogeneous integration add test insertions and pattern complexity.

Software and correlation delay hardware monetization

A production tester is not useful until test programs, load boards, probe cards, handlers and device models are correlated. Advanced AI and mixed-signal devices can require long debug cycles. Suppliers are therefore investing in design-to-test software and DFT environments to move work earlier in the product lifecycle. The market implication is that hardware shipment capacity alone does not guarantee revenue because each advanced device needs test-program development, interface engineering and production correlation before equipment can be fully utilized.

Market Opportunities

HBM4 and advanced memory test

HBM generations increase bandwidth, stack complexity and package value. Memory ATE vendors can capture more wafer, final and system test while developing high-current and high-speed interfaces for new generations. For ATE suppliers, the commercial consequence is that test coverage, parallelism, software readiness, installed-base utilization and customer qualification determine revenue quality much more directly than broad semiconductor unit shipments.

Design-to-test automation

Advantest’s SiConic DFT expansion shows an opportunity to connect semiconductor design, test-program development and production ATE. Moving debug earlier can shorten customer ramps and create software or ecosystem differentiation beyond hardware channels. This distinction matters because SoC, memory and power-device test use different instruments and interface hardware, so AI growth can create sharply different demand across tester platforms and customer production stages.

Silicon photonics production test

Advantest’s OpenLight collaboration targets silicon-photonics test solutions for high-volume manufacturing. Co-packaged optics and photonic integrated circuits create optical alignment and electro-optic measurement needs that conventional SoC testers do not fully address. Buyers therefore evaluate seconds of test, multisite efficiency, uptime, correlation, software ecosystem, local service and reuse of existing instrumentation before committing to a new production tester.

GaN and SiC power-device test

Cohu’s 2026 GaN orders demonstrate rising demand for high-voltage dynamic testing. EVs, AI power supplies and energy infrastructure can create a specialized test segment with attractive ASPs and less direct competition from commodity SoC platforms. Through 2034, suppliers that connect design-for-test workflows with scalable high-volume hardware can capture more value as AI, HBM and heterogeneous integration add test insertions and pattern complexity.

Supply Chain Analysis

Stage 1
High-speed instruments & tester electronics
Stage 2
System assembly, calibration & software integration
Stage 3
Device interface engineering
Stage 4
Customer program development & production support

High-speed instruments & tester electronics

ATE vendors design custom pin electronics, timing generators, converters, power supplies and controller boards. Semiconductor component availability and calibration accuracy determine tester performance and shipment capacity. The market implication is that hardware shipment capacity alone does not guarantee revenue because each advanced device needs test-program development, interface engineering and production correlation before equipment can be fully utilized.

System assembly, calibration & software integration

Chassis, instruments and cooling are assembled and calibrated, then integrated with operating software, device-specific tools and diagnostics. Advanced systems must maintain timing and analog accuracy across thousands of channels. For ATE suppliers, the commercial consequence is that test coverage, parallelism, software readiness, installed-base utilization and customer qualification determine revenue quality much more directly than broad semiconductor unit shipments.

Device interface engineering

Load boards, probe cards, sockets, handlers and probers physically connect the tester to the device. Interface parasitics and contact reliability can limit test performance, making ecosystem partners integral to the final solution. This distinction matters because SoC, memory and power-device test use different instruments and interface hardware, so AI growth can create sharply different demand across tester platforms and customer production stages.

Customer program development & production support

DFT teams and applications engineers develop patterns, correlate engineering and production testers, optimize multisite test and support yield ramp. Recurring service, upgrades and software add revenue throughout the tester lifecycle. Buyers therefore evaluate seconds of test, multisite efficiency, uptime, correlation, software ecosystem, local service and reuse of existing instrumentation before committing to a new production tester.

Recent Developments

Recent primary-source developments show the ATE upcycle broadening across AI compute, HBM, GaN power devices, silicon photonics and design-to-test software. The source page’s older 2024–2032 revenue anchors are retained for the report series even though the 2026 industry cycle is materially stronger than that forecast suggests. Through 2034, suppliers that connect design-for-test workflows with scalable high-volume hardware can capture more value as AI, HBM and heterogeneous integration add test insertions and pattern complexity.

July 30, 2026 — Cohu reported Q2 2026 sales up 38% year over year

Cohu reported second-quarter net sales of USD 149.0 million, up 38% year over year, and estimated semiconductor test-cell utilization at 80% at the end of June. The company also raised its annual AI-driven compute opportunity pipeline, showing improving demand beyond the two largest semiconductor ATE vendors. The market implication is that hardware shipment capacity alone does not guarantee revenue because each advanced device needs test-program development, interface engineering and production correlation before equipment can be fully utilized.

Source

July 29, 2026 — Advantest reported Q1 FY2026 Test System sales of JPY 333.6 billion

Advantest reported Test System net sales of JPY 333.6 billion, up 38.7% year over year, with SoC tester demand increasing significantly as production volumes of increasingly complex AI and HPC semiconductors grew. Segment income increased 50.3% to JPY 190.7 billion. For ATE suppliers, the commercial consequence is that test coverage, parallelism, software readiness, installed-base utilization and customer qualification determine revenue quality much more directly than broad semiconductor unit shipments.

Source

July 28, 2026 — Teradyne reported record Q2 Semiconductor Test revenue

Teradyne reported Q2 2026 Semiconductor Test revenue of USD 1.122 billion, with total company revenue of USD 1.329 billion. The company cited sustained AI demand across compute and memory, record memory revenue and renewed NAND final-test strength, marking a second consecutive quarter of record semiconductor-test results. This distinction matters because SoC, memory and power-device test use different instruments and interface hardware, so AI growth can create sharply different demand across tester platforms and customer production stages.

Source

July 16, 2026 — Advantest expanded SiConic into DFT engineering

Advantest extended the SiConic ecosystem into a Design-for-Test engineering environment that allows engineers to execute, debug and validate test content in a V93000-compatible workflow before production deployment. The product addresses larger pattern volumes and more sophisticated DFT methods for advanced SoCs, AI accelerators and chiplets. Buyers therefore evaluate seconds of test, multisite efficiency, uptime, correlation, software ecosystem, local service and reuse of existing instrumentation before committing to a new production tester.

Source

June 23, 2026 — Advantest and OpenLight partnered on silicon-photonics test

Advantest announced a partnership with OpenLight to develop silicon-photonics test solutions for high-volume manufacturing. The collaboration reflects the emergence of photonic integrated circuits and co-packaged optics as new ATE workloads requiring combined optical and electrical production test. Through 2034, suppliers that connect design-for-test workflows with scalable high-volume hardware can capture more value as AI, HBM and heterogeneous integration add test insertions and pattern complexity.

Source

May 12, 2026 — Cohu received multiple orders for next-generation GaN power-device testing

Cohu announced multiple orders totaling approximately USD 5 million from a leading semiconductor manufacturer for testing next-generation GaN power devices used in AI data centers. The orders validate specialized high-voltage test as a growing opportunity alongside mainstream SoC and memory ATE. The market implication is that hardware shipment capacity alone does not guarantee revenue because each advanced device needs test-program development, interface engineering and production correlation before equipment can be fully utilized.

Source

Report Scope & Segmentation

Attribute Coverage
Market Semiconductor Automated Test Equipment (ATE)
Base Year 2025
Estimated Year 2026
Forecast Period 2026–2034
2025 Market Size USD 5.85 billion
2034 Forecast Size USD 10.66 billion
CAGR 6.9% (2026–2034)
Largest Market in 2025 Asia Pacific
By Type SoC Testers; Memory Testers; Discrete Device Testers
By Application Automotive; Consumer Electronics; Defense and Aerospace; IT & Telecommunications; Others
By End User Integrated Device Manufacturers (IDMs); Foundries; Outsourced Semiconductor Assembly and Test (OSAT) Providers; Research and Development Institutions
By Test Type Wafer Test; Package Test; System Level Test
Regions Asia Pacific; North America; Europe; South America; Middle East & Africa
Companies Profiled Advantest Corporation; Teradyne, Inc.; Cohu, Inc.; Tokyo Seimitsu (ACCRETECH); Tokyo Electron Limited (TEL); Hangzhou Changchuan Technology Co., Ltd.; Beijing Huafeng Test & Control Technology Co., Ltd.; Chroma ATE Inc.; Hon Precision Industry Co., Ltd.; SPEA S.p.A.; Shibasoku Co., Ltd.; Macrotest Inc.; PowerTECH Technology Inc.

Frequently Asked Questions

What is the Semiconductor Automated Test Equipment market size in 2025?

The source page publishes USD 5.475 billion in 2024 and USD 9.331 billion in 2032. Those anchors imply a 2025 market size of approximately USD 5.85 billion. Applying the same compound factor gives an estimated USD 6.26 billion in 2026 and approximately USD 10.66 billion in 2034. For ATE suppliers, the commercial consequence is that test coverage, parallelism, software readiness, installed-base utilization and customer qualification determine revenue quality much more directly than broad semiconductor unit shipments.

What is the projected ATE market size by 2034?

The rebased 2034 Semiconductor ATE market is approximately USD 10.66 billion. This extends the source page’s 2024–2032 market-size series using the annual compound rate implied by the two published endpoints while maintaining the requested 2025 base and 2026 estimate. This distinction matters because SoC, memory and power-device test use different instruments and interface hardware, so AI growth can create sharply different demand across tester platforms and customer production stages.

Why is the CAGR 6.9% instead of the page’s 8.1%?

USD 5.475 billion in 2024 and USD 9.331 billion in 2032 imply approximately 6.89% compound annual growth over eight years. Because the printed 8.1% does not reconcile with those endpoints, the batch methodology uses the published size anchors as the controlling figures. Buyers therefore evaluate seconds of test, multisite efficiency, uptime, correlation, software ecosystem, local service and reuse of existing instrumentation before committing to a new production tester.

Which ATE type leads the market?

The source page identifies SoC Testers as the dominant type because AI, HPC, networking and complex mixed-signal ICs require large pattern volumes and flexible high-speed instrumentation. Memory testers are also growing strongly with HBM and DRAM demand. Through 2034, suppliers that connect design-for-test workflows with scalable high-volume hardware can capture more value as AI, HBM and heterogeneous integration add test insertions and pattern complexity.

Which application is largest?

IT & Telecommunications leads the source-page application segmentation due to data-center expansion, AI compute, 5G and networking. Current Teradyne and Advantest results reinforce this position because AI-related SoC and memory test are driving record or near-record 2026 revenue. The market implication is that hardware shipment capacity alone does not guarantee revenue because each advanced device needs test-program development, interface engineering and production correlation before equipment can be fully utilized.

Which region dominates the ATE market?

Asia Pacific is the clear source-page leader by both volume and value. The page estimates a combined China plus ex-China Asia-Pacific market of approximately USD 4.79 billion in 2024 and nearly USD 7.35 billion by 2030, with China alone at USD 1.63 billion in 2024. For ATE suppliers, the commercial consequence is that test coverage, parallelism, software readiness, installed-base utilization and customer qualification determine revenue quality much more directly than broad semiconductor unit shipments.

How is AI changing ATE demand?

AI devices require more test patterns, high-speed channels, high-current power delivery and expensive packaging. Teradyne’s Q2 2026 Semiconductor Test revenue more than doubled year over year, and Advantest’s Q1 FY2026 Test System sales rose 38.7%, showing that test intensity is increasing rapidly. This distinction matters because SoC, memory and power-device test use different instruments and interface hardware, so AI growth can create sharply different demand across tester platforms and customer production stages.

Why is HBM important for test equipment?

HBM contains multiple DRAM dies that must operate together at very high bandwidth. Wafer-level screening and final memory test become more valuable because one defective die can compromise an expensive stack. Teradyne reported memory revenue above USD 200 million for a third consecutive quarter in Q2 2026. Buyers therefore evaluate seconds of test, multisite efficiency, uptime, correlation, software ecosystem, local service and reuse of existing instrumentation before committing to a new production tester.

Who are the companies profiled on the source page?

The source page profiles Advantest, Teradyne, Cohu, Tokyo Seimitsu, Tokyo Electron, Hangzhou Changchuan Technology, Beijing Huafeng Test & Control Technology, Chroma ATE, Hon Precision Industry, SPEA, Shibasoku, Macrotest and PowerTECH Technology. Through 2034, suppliers that connect design-for-test workflows with scalable high-volume hardware can capture more value as AI, HBM and heterogeneous integration add test insertions and pattern complexity.

What is the main strategic risk through 2034?

The main risk is customer and cycle concentration. A small number of major AI, memory and mobile customers can drive large tester orders, so suppliers must scale capacity during booms without being overexposed when product ramps or semiconductor capital spending slow. The market implication is that hardware shipment capacity alone does not guarantee revenue because each advanced device needs test-program development, interface engineering and production correlation before equipment can be fully utilized.

Semiconductor Automated Test Equipment (ATE) Market, Trends, Business Strategies 2026-2034

Get Sample Report PDF for Exclusive Insights

Report Sample Includes

  • Table of Contents
  • List of Tables & Figures
  • Charts, Research Methodology, and more...
Download Sample Report PDF

Download Sample Report

Table of Content

1 Introduction to Research & Analysis Reports
1.1 Semiconductor Automated Test Equipment (ATE) Market Definition
1.2 Market Segments
1.2.1 Segment by Type
1.2.2 Segment by Application
1.3 Global Semiconductor Automated Test Equipment (ATE) Market Overview
1.4 Features & Benefits of This Report
1.5 Methodology & Sources of Information
1.5.1 Research Methodology
1.5.2 Research Process
1.5.3 Base Year
1.5.4 Report Assumptions & Caveats
2 Global Semiconductor Automated Test Equipment (ATE) Overall Market Size
2.1 Global Semiconductor Automated Test Equipment (ATE) Market Size: 2024 VS 2032
2.2 Global Semiconductor Automated Test Equipment (ATE) Market Size, Prospects & Forecasts: 2020-2032
2.3 Global Semiconductor Automated Test Equipment (ATE) Sales: 2020-2032
3 Company Landscape
3.1 Top Semiconductor Automated Test Equipment (ATE) Players in Global Market
3.2 Top Global Semiconductor Automated Test Equipment (ATE) Companies Ranked by Revenue
3.3 Global Semiconductor Automated Test Equipment (ATE) Revenue by Companies
3.4 Global Semiconductor Automated Test Equipment (ATE) Sales by Companies
3.5 Global Semiconductor Automated Test Equipment (ATE) Price by Manufacturer (2020-2025)
3.6 Top 3 and Top 5 Semiconductor Automated Test Equipment (ATE) Companies in Global Market, by Revenue in 2024
3.7 Global Manufacturers Semiconductor Automated Test Equipment (ATE) Product Type
3.8 Tier 1, Tier 2, and Tier 3 Semiconductor Automated Test Equipment (ATE) Players in Global Market
3.8.1 List of Global Tier 1 Semiconductor Automated Test Equipment (ATE) Companies
3.8.2 List of Global Tier 2 and Tier 3 Semiconductor Automated Test Equipment (ATE) Companies
4 Sights by Product
4.1 Overview
4.1.1 Segment by Type – Global Semiconductor Automated Test Equipment (ATE) Market Size Markets, 2024 & 2032
4.1.2 SoC Testers
4.1.3 Memory Testers
4.1.4 Discrete Device Testers
4.2 Segment by Type – Global Semiconductor Automated Test Equipment (ATE) Revenue & Forecasts
4.2.1 Segment by Type – Global Semiconductor Automated Test Equipment (ATE) Revenue, 2020-2025
4.2.2 Segment by Type – Global Semiconductor Automated Test Equipment (ATE) Revenue, 2026-2032
4.2.3 Segment by Type – Global Semiconductor Automated Test Equipment (ATE) Revenue Market Share, 2020-2032
4.3 Segment by Type – Global Semiconductor Automated Test Equipment (ATE) Sales & Forecasts
4.3.1 Segment by Type – Global Semiconductor Automated Test Equipment (ATE) Sales, 2020-2025
4.3.2 Segment by Type – Global Semiconductor Automated Test Equipment (ATE) Sales, 2026-2032
4.3.3 Segment by Type – Global Semiconductor Automated Test Equipment (ATE) Sales Market Share, 2020-2032
4.4 Segment by Type – Global Semiconductor Automated Test Equipment (ATE) Price (Manufacturers Selling Prices), 2020-2032
5 Sights by Application
5.1 Overview
5.1.1 Segment by Application – Global Semiconductor Automated Test Equipment (ATE) Market Size, 2024 & 2032
5.1.2 Automotive
5.1.3 Consumer
5.1.4 Defense
5.1.5 IT& Telecommunications
5.1.6 Others
5.2 Segment by Application – Global Semiconductor Automated Test Equipment (ATE) Revenue & Forecasts
5.2.1 Segment by Application – Global Semiconductor Automated Test Equipment (ATE) Revenue, 2020-2025
5.2.2 Segment by Application – Global Semiconductor Automated Test Equipment (ATE) Revenue, 2026-2032
5.2.3 Segment by Application – Global Semiconductor Automated Test Equipment (ATE) Revenue Market Share, 2020-2032
5.3 Segment by Application – Global Semiconductor Automated Test Equipment (ATE) Sales & Forecasts
5.3.1 Segment by Application – Global Semiconductor Automated Test Equipment (ATE) Sales, 2020-2025
5.3.2 Segment by Application – Global Semiconductor Automated Test Equipment (ATE) Sales, 2026-2032
5.3.3 Segment by Application – Global Semiconductor Automated Test Equipment (ATE) Sales Market Share, 2020-2032
5.4 Segment by Application – Global Semiconductor Automated Test Equipment (ATE) Price (Manufacturers Selling Prices), 2020-2032
6 Sights by Region
6.1 By Region – Global Semiconductor Automated Test Equipment (ATE) Market Size, 2024 & 2032
6.2 By Region – Global Semiconductor Automated Test Equipment (ATE) Revenue & Forecasts
6.2.1 By Region – Global Semiconductor Automated Test Equipment (ATE) Revenue, 2020-2025
6.2.2 By Region – Global Semiconductor Automated Test Equipment (ATE) Revenue, 2026-2032
6.2.3 By Region – Global Semiconductor Automated Test Equipment (ATE) Revenue Market Share, 2020-2032
6.3 By Region – Global Semiconductor Automated Test Equipment (ATE) Sales & Forecasts
6.3.1 By Region – Global Semiconductor Automated Test Equipment (ATE) Sales, 2020-2025
6.3.2 By Region – Global Semiconductor Automated Test Equipment (ATE) Sales, 2026-2032
6.3.3 By Region – Global Semiconductor Automated Test Equipment (ATE) Sales Market Share, 2020-2032
6.4 North America
6.4.1 By Country – North America Semiconductor Automated Test Equipment (ATE) Revenue, 2020-2032
6.4.2 By Country – North America Semiconductor Automated Test Equipment (ATE) Sales, 2020-2032
6.4.3 United States Semiconductor Automated Test Equipment (ATE) Market Size, 2020-2032
6.4.4 Canada Semiconductor Automated Test Equipment (ATE) Market Size, 2020-2032
6.4.5 Mexico Semiconductor Automated Test Equipment (ATE) Market Size, 2020-2032
6.5 Europe
6.5.1 By Country – Europe Semiconductor Automated Test Equipment (ATE) Revenue, 2020-2032
6.5.2 By Country – Europe Semiconductor Automated Test Equipment (ATE) Sales, 2020-2032
6.5.3 Germany Semiconductor Automated Test Equipment (ATE) Market Size, 2020-2032
6.5.4 France Semiconductor Automated Test Equipment (ATE) Market Size, 2020-2032
6.5.5 U.K. Semiconductor Automated Test Equipment (ATE) Market Size, 2020-2032
6.5.6 Italy Semiconductor Automated Test Equipment (ATE) Market Size, 2020-2032
6.5.7 Russia Semiconductor Automated Test Equipment (ATE) Market Size, 2020-2032
6.5.8 Nordic Countries Semiconductor Automated Test Equipment (ATE) Market Size, 2020-2032
6.5.9 Benelux Semiconductor Automated Test Equipment (ATE) Market Size, 2020-2032
6.6 Asia
6.6.1 By Region – Asia Semiconductor Automated Test Equipment (ATE) Revenue, 2020-2032
6.6.2 By Region – Asia Semiconductor Automated Test Equipment (ATE) Sales, 2020-2032
6.6.3 China Semiconductor Automated Test Equipment (ATE) Market Size, 2020-2032
6.6.4 Japan Semiconductor Automated Test Equipment (ATE) Market Size, 2020-2032
6.6.5 South Korea Semiconductor Automated Test Equipment (ATE) Market Size, 2020-2032
6.6.6 Southeast Asia Semiconductor Automated Test Equipment (ATE) Market Size, 2020-2032
6.6.7 India Semiconductor Automated Test Equipment (ATE) Market Size, 2020-2032
6.7 South America
6.7.1 By Country – South America Semiconductor Automated Test Equipment (ATE) Revenue, 2020-2032
6.7.2 By Country – South America Semiconductor Automated Test Equipment (ATE) Sales, 2020-2032
6.7.3 Brazil Semiconductor Automated Test Equipment (ATE) Market Size, 2020-2032
6.7.4 Argentina Semiconductor Automated Test Equipment (ATE) Market Size, 2020-2032
6.8 Middle East & Africa
6.8.1 By Country – Middle East & Africa Semiconductor Automated Test Equipment (ATE) Revenue, 2020-2032
6.8.2 By Country – Middle East & Africa Semiconductor Automated Test Equipment (ATE) Sales, 2020-2032
6.8.3 Turkey Semiconductor Automated Test Equipment (ATE) Market Size, 2020-2032
6.8.4 Israel Semiconductor Automated Test Equipment (ATE) Market Size, 2020-2032
6.8.5 Saudi Arabia Semiconductor Automated Test Equipment (ATE) Market Size, 2020-2032
6.8.6 UAE Semiconductor Automated Test Equipment (ATE) Market Size, 2020-2032
7 Manufacturers & Brands Profiles
7.1 Advantest
7.1.1 Advantest Company Summary
7.1.2 Advantest Business Overview
7.1.3 Advantest Semiconductor Automated Test Equipment (ATE) Major Product Offerings
7.1.4 Advantest Semiconductor Automated Test Equipment (ATE) Sales and Revenue in Global (2020-2025)
7.1.5 Advantest Key News & Latest Developments
7.2 Teradyne
7.2.1 Teradyne Company Summary
7.2.2 Teradyne Business Overview
7.2.3 Teradyne Semiconductor Automated Test Equipment (ATE) Major Product Offerings
7.2.4 Teradyne Semiconductor Automated Test Equipment (ATE) Sales and Revenue in Global (2020-2025)
7.2.5 Teradyne Key News & Latest Developments
7.3 Cohu
7.3.1 Cohu Company Summary
7.3.2 Cohu Business Overview
7.3.3 Cohu Semiconductor Automated Test Equipment (ATE) Major Product Offerings
7.3.4 Cohu Semiconductor Automated Test Equipment (ATE) Sales and Revenue in Global (2020-2025)
7.3.5 Cohu Key News & Latest Developments
7.4 Tokyo Seimitsu
7.4.1 Tokyo Seimitsu Company Summary
7.4.2 Tokyo Seimitsu Business Overview
7.4.3 Tokyo Seimitsu Semiconductor Automated Test Equipment (ATE) Major Product Offerings
7.4.4 Tokyo Seimitsu Semiconductor Automated Test Equipment (ATE) Sales and Revenue in Global (2020-2025)
7.4.5 Tokyo Seimitsu Key News & Latest Developments
7.5 TEL
7.5.1 TEL Company Summary
7.5.2 TEL Business Overview
7.5.3 TEL Semiconductor Automated Test Equipment (ATE) Major Product Offerings
7.5.4 TEL Semiconductor Automated Test Equipment (ATE) Sales and Revenue in Global (2020-2025)
7.5.5 TEL Key News & Latest Developments
7.6 Hangzhou Changchuan Technology
7.6.1 Hangzhou Changchuan Technology Company Summary
7.6.2 Hangzhou Changchuan Technology Business Overview
7.6.3 Hangzhou Changchuan Technology Semiconductor Automated Test Equipment (ATE) Major Product Offerings
7.6.4 Hangzhou Changchuan Technology Semiconductor Automated Test Equipment (ATE) Sales and Revenue in Global (2020-2025)
7.6.5 Hangzhou Changchuan Technology Key News & Latest Developments
7.7 YC
7.7.1 YC Company Summary
7.7.2 YC Business Overview
7.7.3 YC Semiconductor Automated Test Equipment (ATE) Major Product Offerings
7.7.4 YC Semiconductor Automated Test Equipment (ATE) Sales and Revenue in Global (2020-2025)
7.7.5 YC Key News & Latest Developments
7.8 Beijing Huafeng Test & Control Technology
7.8.1 Beijing Huafeng Test & Control Technology Company Summary
7.8.2 Beijing Huafeng Test & Control Technology Business Overview
7.8.3 Beijing Huafeng Test & Control Technology Semiconductor Automated Test Equipment (ATE) Major Product Offerings
7.8.4 Beijing Huafeng Test & Control Technology Semiconductor Automated Test Equipment (ATE) Sales and Revenue in Global (2020-2025)
7.8.5 Beijing Huafeng Test & Control Technology Key News & Latest Developments
7.9 Chroma
7.9.1 Chroma Company Summary
7.9.2 Chroma Business Overview
7.9.3 Chroma Semiconductor Automated Test Equipment (ATE) Major Product Offerings
7.9.4 Chroma Semiconductor Automated Test Equipment (ATE) Sales and Revenue in Global (2020-2025)
7.9.5 Chroma Key News & Latest Developments
7.10 Hon Precision
7.10.1 Hon Precision Company Summary
7.10.2 Hon Precision Business Overview
7.10.3 Hon Precision Semiconductor Automated Test Equipment (ATE) Major Product Offerings
7.10.4 Hon Precision Semiconductor Automated Test Equipment (ATE) Sales and Revenue in Global (2020-2025)
7.10.5 Hon Precision Key News & Latest Developments
7.11 SPEA
7.11.1 SPEA Company Summary
7.11.2 SPEA Business Overview
7.11.3 SPEA Semiconductor Automated Test Equipment (ATE) Major Product Offerings
7.11.4 SPEA Semiconductor Automated Test Equipment (ATE) Sales and Revenue in Global (2020-2025)
7.11.5 SPEA Key News & Latest Developments
7.12 Shibasoku
7.12.1 Shibasoku Company Summary
7.12.2 Shibasoku Business Overview
7.12.3 Shibasoku Semiconductor Automated Test Equipment (ATE) Major Product Offerings
7.12.4 Shibasoku Semiconductor Automated Test Equipment (ATE) Sales and Revenue in Global (2020-2025)
7.12.5 Shibasoku Key News & Latest Developments
7.13 Macrotest
7.13.1 Macrotest Company Summary
7.13.2 Macrotest Business Overview
7.13.3 Macrotest Semiconductor Automated Test Equipment (ATE) Major Product Offerings
7.13.4 Macrotest Semiconductor Automated Test Equipment (ATE) Sales and Revenue in Global (2020-2025)
7.13.5 Macrotest Key News & Latest Developments
7.14 PowerTECH
7.14.1 PowerTECH Company Summary
7.14.2 PowerTECH Business Overview
7.14.3 PowerTECH Semiconductor Automated Test Equipment (ATE) Major Product Offerings
7.14.4 PowerTECH Semiconductor Automated Test Equipment (ATE) Sales and Revenue in Global (2020-2025)
7.14.5 PowerTECH Key News & Latest Developments
8 Global Semiconductor Automated Test Equipment (ATE) Production Capacity, Analysis
8.1 Global Semiconductor Automated Test Equipment (ATE) Production Capacity, 2020-2032
8.2 Semiconductor Automated Test Equipment (ATE) Production Capacity of Key Manufacturers in Global Market
8.3 Global Semiconductor Automated Test Equipment (ATE) Production by Region
9 Key Market Trends, Opportunity, Drivers and Restraints
9.1 Market Opportunities & Trends
9.2 Market Drivers
9.3 Market Restraints
10 Semiconductor Automated Test Equipment (ATE) Supply Chain Analysis
10.1 Semiconductor Automated Test Equipment (ATE) Industry Value Chain
10.2 Semiconductor Automated Test Equipment (ATE) Upstream Market
10.3 Semiconductor Automated Test Equipment (ATE) Downstream and Clients
10.4 Marketing Channels Analysis
10.4.1 Marketing Channels
10.4.2 Semiconductor Automated Test Equipment (ATE) Distributors and Sales Agents in Global
11 Conclusion
12 Appendix
12.1 Note
12.2 Examples of Clients
12.3 DisclaimerList of Tables
Table 1. Key Players of Semiconductor Automated Test Equipment (ATE) in Global Market
Table 2. Top Semiconductor Automated Test Equipment (ATE) Players in Global Market, Ranking by Revenue (2024)
Table 3. Global Semiconductor Automated Test Equipment (ATE) Revenue by Companies, (US$, Mn), 2020-2025
Table 4. Global Semiconductor Automated Test Equipment (ATE) Revenue Share by Companies, 2020-2025
Table 5. Global Semiconductor Automated Test Equipment (ATE) Sales by Companies, (Units), 2020-2025
Table 6. Global Semiconductor Automated Test Equipment (ATE) Sales Share by Companies, 2020-2025
Table 7. Key Manufacturers Semiconductor Automated Test Equipment (ATE) Price (2020-2025) & (K US$/Unit)
Table 8. Global Manufacturers Semiconductor Automated Test Equipment (ATE) Product Type
Table 9. List of Global Tier 1 Semiconductor Automated Test Equipment (ATE) Companies, Revenue (US$, Mn) in 2024 and Market Share
Table 10. List of Global Tier 2 and Tier 3 Semiconductor Automated Test Equipment (ATE) Companies, Revenue (US$, Mn) in 2024 and Market Share
Table 11. Segment by Type – Global Semiconductor Automated Test Equipment (ATE) Revenue, (US$, Mn), 2024 & 2032
Table 12. Segment by Type – Global Semiconductor Automated Test Equipment (ATE) Revenue (US$, Mn), 2020-2025
Table 13. Segment by Type – Global Semiconductor Automated Test Equipment (ATE) Revenue (US$, Mn), 2026-2032
Table 14. Segment by Type – Global Semiconductor Automated Test Equipment (ATE) Sales (Units), 2020-2025
Table 15. Segment by Type – Global Semiconductor Automated Test Equipment (ATE) Sales (Units), 2026-2032
Table 16. Segment by Application – Global Semiconductor Automated Test Equipment (ATE) Revenue, (US$, Mn), 2024 & 2032
Table 17. Segment by Application – Global Semiconductor Automated Test Equipment (ATE) Revenue, (US$, Mn), 2020-2025
Table 18. Segment by Application – Global Semiconductor Automated Test Equipment (ATE) Revenue, (US$, Mn), 2026-2032
Table 19. Segment by Application – Global Semiconductor Automated Test Equipment (ATE) Sales, (Units), 2020-2025
Table 20. Segment by Application – Global Semiconductor Automated Test Equipment (ATE) Sales, (Units), 2026-2032
Table 21. By Region – Global Semiconductor Automated Test Equipment (ATE) Revenue, (US$, Mn), 2025-2032
Table 22. By Region – Global Semiconductor Automated Test Equipment (ATE) Revenue, (US$, Mn), 2020-2025
Table 23. By Region – Global Semiconductor Automated Test Equipment (ATE) Revenue, (US$, Mn), 2026-2032
Table 24. By Region – Global Semiconductor Automated Test Equipment (ATE) Sales, (Units), 2020-2025
Table 25. By Region – Global Semiconductor Automated Test Equipment (ATE) Sales, (Units), 2026-2032
Table 26. By Country – North America Semiconductor Automated Test Equipment (ATE) Revenue, (US$, Mn), 2020-2025
Table 27. By Country – North America Semiconductor Automated Test Equipment (ATE) Revenue, (US$, Mn), 2026-2032
Table 28. By Country – North America Semiconductor Automated Test Equipment (ATE) Sales, (Units), 2020-2025
Table 29. By Country – North America Semiconductor Automated Test Equipment (ATE) Sales, (Units), 2026-2032
Table 30. By Country – Europe Semiconductor Automated Test Equipment (ATE) Revenue, (US$, Mn), 2020-2025
Table 31. By Country – Europe Semiconductor Automated Test Equipment (ATE) Revenue, (US$, Mn), 2026-2032
Table 32. By Country – Europe Semiconductor Automated Test Equipment (ATE) Sales, (Units), 2020-2025
Table 33. By Country – Europe Semiconductor Automated Test Equipment (ATE) Sales, (Units), 2026-2032
Table 34. By Region – Asia Semiconductor Automated Test Equipment (ATE) Revenue, (US$, Mn), 2020-2025
Table 35. By Region – Asia Semiconductor Automated Test Equipment (ATE) Revenue, (US$, Mn), 2026-2032
Table 36. By Region – Asia Semiconductor Automated Test Equipment (ATE) Sales, (Units), 2020-2025
Table 37. By Region – Asia Semiconductor Automated Test Equipment (ATE) Sales, (Units), 2026-2032
Table 38. By Country – South America Semiconductor Automated Test Equipment (ATE) Revenue, (US$, Mn), 2020-2025
Table 39. By Country – South America Semiconductor Automated Test Equipment (ATE) Revenue, (US$, Mn), 2026-2032
Table 40. By Country – South America Semiconductor Automated Test Equipment (ATE) Sales, (Units), 2020-2025
Table 41. By Country – South America Semiconductor Automated Test Equipment (ATE) Sales, (Units), 2026-2032
Table 42. By Country – Middle East & Africa Semiconductor Automated Test Equipment (ATE) Revenue, (US$, Mn), 2020-2025
Table 43. By Country – Middle East & Africa Semiconductor Automated Test Equipment (ATE) Revenue, (US$, Mn), 2026-2032
Table 44. By Country – Middle East & Africa Semiconductor Automated Test Equipment (ATE) Sales, (Units), 2020-2025
Table 45. By Country – Middle East & Africa Semiconductor Automated Test Equipment (ATE) Sales, (Units), 2026-2032
Table 46. Advantest Company Summary
Table 47. Advantest Semiconductor Automated Test Equipment (ATE) Product Offerings
Table 48. Advantest Semiconductor Automated Test Equipment (ATE) Sales (Units), Revenue (US$, Mn) and Average Price (K US$/Unit) & (2020-2025)
Table 49. Advantest Key News & Latest Developments
Table 50. Teradyne Company Summary
Table 51. Teradyne Semiconductor Automated Test Equipment (ATE) Product Offerings
Table 52. Teradyne Semiconductor Automated Test Equipment (ATE) Sales (Units), Revenue (US$, Mn) and Average Price (K US$/Unit) & (2020-2025)
Table 53. Teradyne Key News & Latest Developments
Table 54. Cohu Company Summary
Table 55. Cohu Semiconductor Automated Test Equipment (ATE) Product Offerings
Table 56. Cohu Semiconductor Automated Test Equipment (ATE) Sales (Units), Revenue (US$, Mn) and Average Price (K US$/Unit) & (2020-2025)
Table 57. Cohu Key News & Latest Developments
Table 58. Tokyo Seimitsu Company Summary
Table 59. Tokyo Seimitsu Semiconductor Automated Test Equipment (ATE) Product Offerings
Table 60. Tokyo Seimitsu Semiconductor Automated Test Equipment (ATE) Sales (Units), Revenue (US$, Mn) and Average Price (K US$/Unit) & (2020-2025)
Table 61. Tokyo Seimitsu Key News & Latest Developments
Table 62. TEL Company Summary
Table 63. TEL Semiconductor Automated Test Equipment (ATE) Product Offerings
Table 64. TEL Semiconductor Automated Test Equipment (ATE) Sales (Units), Revenue (US$, Mn) and Average Price (K US$/Unit) & (2020-2025)
Table 65. TEL Key News & Latest Developments
Table 66. Hangzhou Changchuan Technology Company Summary
Table 67. Hangzhou Changchuan Technology Semiconductor Automated Test Equipment (ATE) Product Offerings
Table 68. Hangzhou Changchuan Technology Semiconductor Automated Test Equipment (ATE) Sales (Units), Revenue (US$, Mn) and Average Price (K US$/Unit) & (2020-2025)
Table 69. Hangzhou Changchuan Technology Key News & Latest Developments
Table 70. YC Company Summary
Table 71. YC Semiconductor Automated Test Equipment (ATE) Product Offerings
Table 72. YC Semiconductor Automated Test Equipment (ATE) Sales (Units), Revenue (US$, Mn) and Average Price (K US$/Unit) & (2020-2025)
Table 73. YC Key News & Latest Developments
Table 74. Beijing Huafeng Test & Control Technology Company Summary
Table 75. Beijing Huafeng Test & Control Technology Semiconductor Automated Test Equipment (ATE) Product Offerings
Table 76. Beijing Huafeng Test & Control Technology Semiconductor Automated Test Equipment (ATE) Sales (Units), Revenue (US$, Mn) and Average Price (K US$/Unit) & (2020-2025)
Table 77. Beijing Huafeng Test & Control Technology Key News & Latest Developments
Table 78. Chroma Company Summary
Table 79. Chroma Semiconductor Automated Test Equipment (ATE) Product Offerings
Table 80. Chroma Semiconductor Automated Test Equipment (ATE) Sales (Units), Revenue (US$, Mn) and Average Price (K US$/Unit) & (2020-2025)
Table 81. Chroma Key News & Latest Developments
Table 82. Hon Precision Company Summary
Table 83. Hon Precision Semiconductor Automated Test Equipment (ATE) Product Offerings
Table 84. Hon Precision Semiconductor Automated Test Equipment (ATE) Sales (Units), Revenue (US$, Mn) and Average Price (K US$/Unit) & (2020-2025)
Table 85. Hon Precision Key News & Latest Developments
Table 86. SPEA Company Summary
Table 87. SPEA Semiconductor Automated Test Equipment (ATE) Product Offerings
Table 88. SPEA Semiconductor Automated Test Equipment (ATE) Sales (Units), Revenue (US$, Mn) and Average Price (K US$/Unit) & (2020-2025)
Table 89. SPEA Key News & Latest Developments
Table 90. Shibasoku Company Summary
Table 91. Shibasoku Semiconductor Automated Test Equipment (ATE) Product Offerings
Table 92. Shibasoku Semiconductor Automated Test Equipment (ATE) Sales (Units), Revenue (US$, Mn) and Average Price (K US$/Unit) & (2020-2025)
Table 93. Shibasoku Key News & Latest Developments
Table 94. Macrotest Company Summary
Table 95. Macrotest Semiconductor Automated Test Equipment (ATE) Product Offerings
Table 96. Macrotest Semiconductor Automated Test Equipment (ATE) Sales (Units), Revenue (US$, Mn) and Average Price (K US$/Unit) & (2020-2025)
Table 97. Macrotest Key News & Latest Developments
Table 98. PowerTECH Company Summary
Table 99. PowerTECH Semiconductor Automated Test Equipment (ATE) Product Offerings
Table 100. PowerTECH Semiconductor Automated Test Equipment (ATE) Sales (Units), Revenue (US$, Mn) and Average Price (K US$/Unit) & (2020-2025)
Table 101. PowerTECH Key News & Latest Developments
Table 102. Semiconductor Automated Test Equipment (ATE) Capacity of Key Manufacturers in Global Market, 2023-2025 (Units)
Table 103. Global Semiconductor Automated Test Equipment (ATE) Capacity Market Share of Key Manufacturers, 2023-2025
Table 104. Global Semiconductor Automated Test Equipment (ATE) Production by Region, 2020-2025 (Units)
Table 105. Global Semiconductor Automated Test Equipment (ATE) Production by Region, 2026-2032 (Units)
Table 106. Semiconductor Automated Test Equipment (ATE) Market Opportunities & Trends in Global Market
Table 107. Semiconductor Automated Test Equipment (ATE) Market Drivers in Global Market
Table 108. Semiconductor Automated Test Equipment (ATE) Market Restraints in Global Market
Table 109. Semiconductor Automated Test Equipment (ATE) Raw Materials
Table 110. Semiconductor Automated Test Equipment (ATE) Raw Materials Suppliers in Global Market
Table 111. Typical Semiconductor Automated Test Equipment (ATE) Downstream
Table 112. Semiconductor Automated Test Equipment (ATE) Downstream Clients in Global Market
Table 113. Semiconductor Automated Test Equipment (ATE) Distributors and Sales Agents in Global Market

List of Figures
Figure 1. Semiconductor Automated Test Equipment (ATE) Product Picture
Figure 2. Semiconductor Automated Test Equipment (ATE) Segment by Type in 2024
Figure 3. Semiconductor Automated Test Equipment (ATE) Segment by Application in 2024
Figure 4. Global Semiconductor Automated Test Equipment (ATE) Market Overview: 2024
Figure 5. Key Caveats
Figure 6. Global Semiconductor Automated Test Equipment (ATE) Market Size: 2024 VS 2032 (US$, Mn)
Figure 7. Global Semiconductor Automated Test Equipment (ATE) Revenue: 2020-2032 (US$, Mn)
Figure 8. Semiconductor Automated Test Equipment (ATE) Sales in Global Market: 2020-2032 (Units)
Figure 9. The Top 3 and 5 Players Market Share by Semiconductor Automated Test Equipment (ATE) Revenue in 2024
Figure 10. Segment by Type – Global Semiconductor Automated Test Equipment (ATE) Revenue, (US$, Mn), 2024 & 2032
Figure 11. Segment by Type – Global Semiconductor Automated Test Equipment (ATE) Revenue Market Share, 2020-2032
Figure 12. Segment by Type – Global Semiconductor Automated Test Equipment (ATE) Sales Market Share, 2020-2032
Figure 13. Segment by Type – Global Semiconductor Automated Test Equipment (ATE) Price (K US$/Unit), 2020-2032
Figure 14. Segment by Application – Global Semiconductor Automated Test Equipment (ATE) Revenue, (US$, Mn), 2024 & 2032
Figure 15. Segment by Application – Global Semiconductor Automated Test Equipment (ATE) Revenue Market Share, 2020-2032
Figure 16. Segment by Application – Global Semiconductor Automated Test Equipment (ATE) Sales Market Share, 2020-2032
Figure 17. Segment by Application -Global Semiconductor Automated Test Equipment (ATE) Price (K US$/Unit), 2020-2032
Figure 18. By Region – Global Semiconductor Automated Test Equipment (ATE) Revenue, (US$, Mn), 2025 & 2032
Figure 19. By Region – Global Semiconductor Automated Test Equipment (ATE) Revenue Market Share, 2020 VS 2024 VS 2032
Figure 20. By Region – Global Semiconductor Automated Test Equipment (ATE) Revenue Market Share, 2020-2032
Figure 21. By Region – Global Semiconductor Automated Test Equipment (ATE) Sales Market Share, 2020-2032
Figure 22. By Country – North America Semiconductor Automated Test Equipment (ATE) Revenue Market Share, 2020-2032
Figure 23. By Country – North America Semiconductor Automated Test Equipment (ATE) Sales Market Share, 2020-2032
Figure 24. United States Semiconductor Automated Test Equipment (ATE) Revenue, (US$, Mn), 2020-2032
Figure 25. Canada Semiconductor Automated Test Equipment (ATE) Revenue, (US$, Mn), 2020-2032
Figure 26. Mexico Semiconductor Automated Test Equipment (ATE) Revenue, (US$, Mn), 2020-2032
Figure 27. By Country – Europe Semiconductor Automated Test Equipment (ATE) Revenue Market Share, 2020-2032
Figure 28. By Country – Europe Semiconductor Automated Test Equipment (ATE) Sales Market Share, 2020-2032
Figure 29. Germany Semiconductor Automated Test Equipment (ATE) Revenue, (US$, Mn), 2020-2032
Figure 30. France Semiconductor Automated Test Equipment (ATE) Revenue, (US$, Mn), 2020-2032
Figure 31. U.K. Semiconductor Automated Test Equipment (ATE) Revenue, (US$, Mn), 2020-2032
Figure 32. Italy Semiconductor Automated Test Equipment (ATE) Revenue, (US$, Mn), 2020-2032
Figure 33. Russia Semiconductor Automated Test Equipment (ATE) Revenue, (US$, Mn), 2020-2032
Figure 34. Nordic Countries Semiconductor Automated Test Equipment (ATE) Revenue, (US$, Mn), 2020-2032
Figure 35. Benelux Semiconductor Automated Test Equipment (ATE) Revenue, (US$, Mn), 2020-2032
Figure 36. By Region – Asia Semiconductor Automated Test Equipment (ATE) Revenue Market Share, 2020-2032
Figure 37. By Region – Asia Semiconductor Automated Test Equipment (ATE) Sales Market Share, 2020-2032
Figure 38. China Semiconductor Automated Test Equipment (ATE) Revenue, (US$, Mn), 2020-2032
Figure 39. Japan Semiconductor Automated Test Equipment (ATE) Revenue, (US$, Mn), 2020-2032
Figure 40. South Korea Semiconductor Automated Test Equipment (ATE) Revenue, (US$, Mn), 2020-2032
Figure 41. Southeast Asia Semiconductor Automated Test Equipment (ATE) Revenue, (US$, Mn), 2020-2032
Figure 42. India Semiconductor Automated Test Equipment (ATE) Revenue, (US$, Mn), 2020-2032
Figure 43. By Country – South America Semiconductor Automated Test Equipment (ATE) Revenue Market Share, 2020-2032
Figure 44. By Country – South America Semiconductor Automated Test Equipment (ATE) Sales, Market Share, 2020-2032
Figure 45. Brazil Semiconductor Automated Test Equipment (ATE) Revenue, (US$, Mn), 2020-2032
Figure 46. Argentina Semiconductor Automated Test Equipment (ATE) Revenue, (US$, Mn), 2020-2032
Figure 47. By Country – Middle East & Africa Semiconductor Automated Test Equipment (ATE) Revenue, Market Share, 2020-2032
Figure 48. By Country – Middle East & Africa Semiconductor Automated Test Equipment (ATE) Sales, Market Share, 2020-2032
Figure 49. Turkey Semiconductor Automated Test Equipment (ATE) Revenue, (US$, Mn), 2020-2032
Figure 50. Israel Semiconductor Automated Test Equipment (ATE) Revenue, (US$, Mn), 2020-2032
Figure 51. Saudi Arabia Semiconductor Automated Test Equipment (ATE) Revenue, (US$, Mn), 2020-2032
Figure 52. UAE Semiconductor Automated Test Equipment (ATE) Revenue, (US$, Mn), 2020-2032
Figure 53. Global Semiconductor Automated Test Equipment (ATE) Production Capacity (Units), 2020-2032
Figure 54. The Percentage of Production Semiconductor Automated Test Equipment (ATE) by Region, 2024 VS 2032
Figure 55. Semiconductor Automated Test Equipment (ATE) Industry Value Chain
Figure 56. Marketing Channels