SEMICONDUCTOR INSIGHT
MARKET RESEARCH REPORT

Silicon Carbide (SiC) Substrates for Base Station Market

2026 to 2034
MARKET INTELLIGENCE
ACROSS KEY REGIONS
2026 EDITION
SEMICONDUCTOR MATERIALS Semiconductor Market Research

Silicon Carbide (SiC) Substrates for Base Station Market

◷
UPDATED 27 October 2026
▤
REPORT LENGTH Detailed Report
▣
REPORT CODE 10e6d9c96529
▯
FORMATS PDF

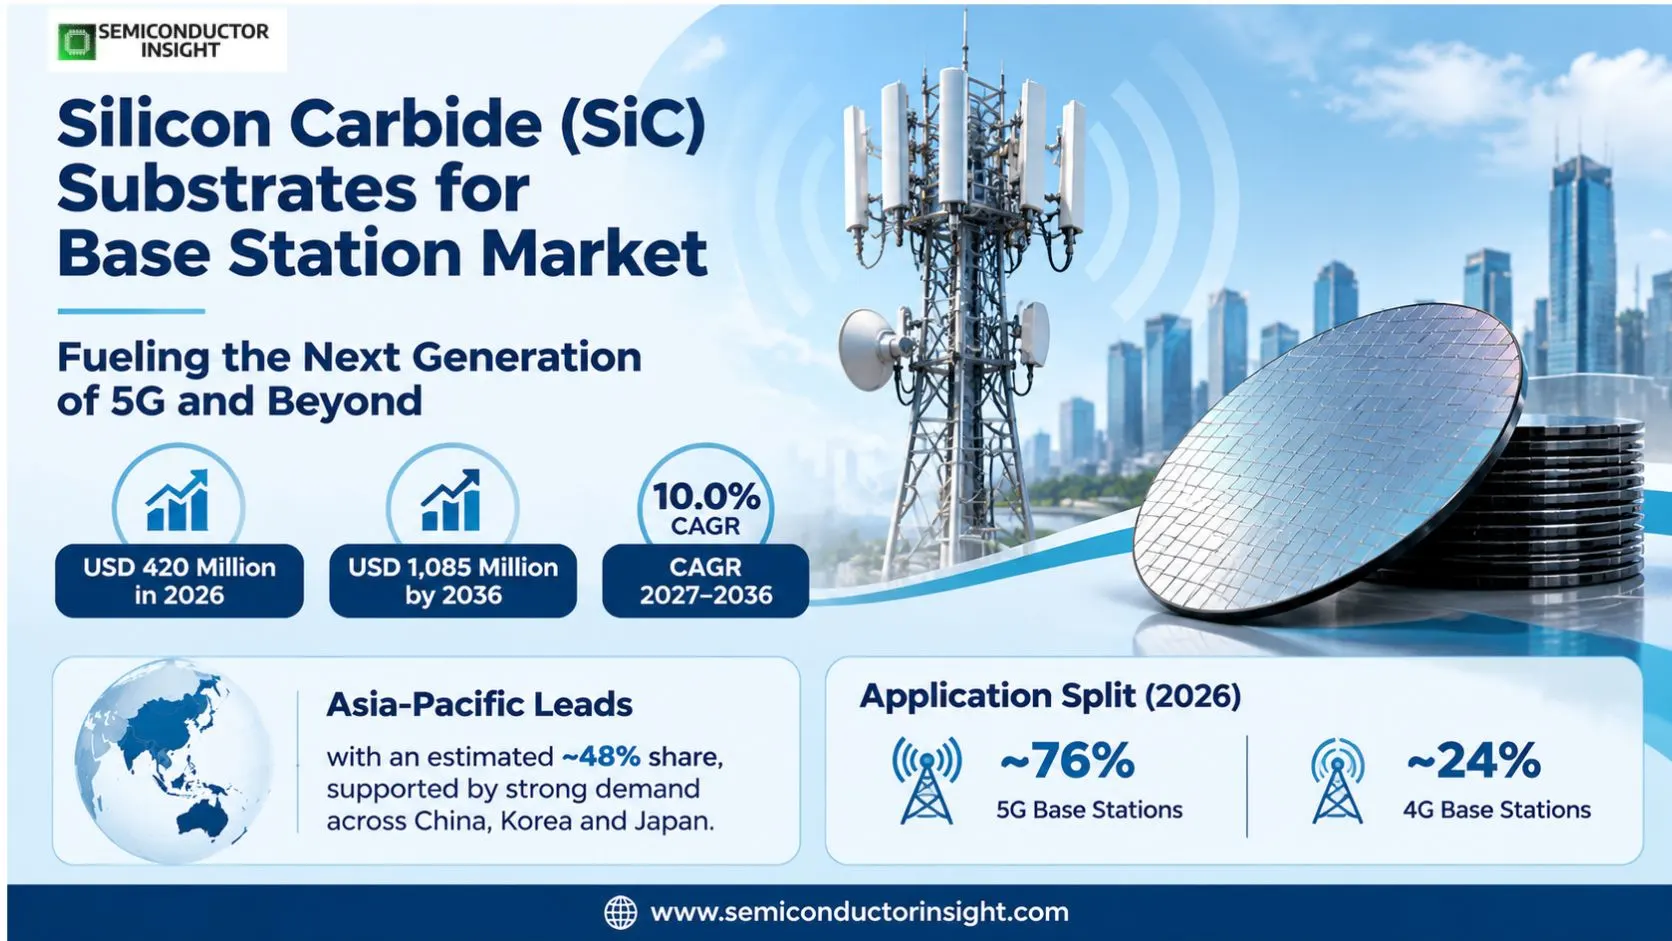
Silicon carbide substrates for base stations market reached an estimated USD 420 million in 2026 and is projected at USD 1,085 million by 2036, representing a 10.0% CAGR over 2027–2036. Asia-Pacific leads with an estimated ~48% share as RF wafer purchases support equipment supply chains serving China, Korea, Japan and other high-density radio markets.


Get the sample PDF with study scope, segmentation and methodology details.

Key Statistics

2026 Market Size
USD 420 million
2036 Projected Size
USD 1,085 million
CAGR (2027–2036)
10.0%
Largest Market in 2026
Asia-Pacific (~48%)

Key Takeaways

  • Market trajectory: RF-grade silicon carbide substrates supplied into wireless base-station device fabrication represent a modeled USD 420 million in 2026, increasing to USD 1,085 million in 2036 at a 10.0% CAGR, as 5G radio capacity and higher-efficiency GaN-on-SiC amplifiers expand the addressable materials requirement.
  • Diameter mix: The 6-inch class is the modeled volume-value leader at ~56% of 2026 sales; 4-inch material remains qualified in established lines, while 8-inch semi-insulating offerings remain more concentrated in supplier qualification and scale-up than the mature 150 mm production platform.
  • Wireless generation: 5G base stations account for an estimated ~76% of the addressable RF-substrate demand in 2026, versus ~24% for 4G replacement and infill, reflecting greater multi-band radio density and the use of GaN HEMT power amplifiers in demanding radio-frequency chains.
  • Regional position: Asia-Pacific holds a modeled ~48% of 2026 demand, followed by North America at ~24% and Europe at ~18%; the regional mix refers to RF-substrate sales into equipment supply chains, not to all SiC wafers produced or consumed for electric-vehicle power electronics.
  • Qualification and substitution: High-purity semi-insulating 4H-SiC and vanadium-doped 6H-SiC require different process qualifications, and alternative GaN-on-silicon or silicon LDMOS solutions constrain achievable wafer pricing even as 5G radio traffic and standalone deployments continue to expand.

Silicon Carbide (SiC) Substrates for Base Station Market Overview

Silicon carbide substrates for base stations market reached an estimated USD 420 million in 2026 and is projected at USD 1,085 million by 2036, representing a 10.0% CAGR over 2027–2036. Asia-Pacific leads with an estimated ~48% share as RF wafer purchases support equipment supply chains serving China, Korea, Japan and other high-density radio markets.

Base year: 2026 · Estimated year: 2027 · Forecast period: 2027–2036 · Historical period: 2021–2025 · Currency: USD million

The product boundary is the separately sold, semi-insulating, single-crystal silicon carbide substrate used as the foundation for gallium nitride radio-frequency devices serving 4G and 5G base stations. High resistivity suppresses parasitic conduction under high-frequency transistors, while the thermal conductivity of SiC helps remove heat from high-power radio amplifiers. The revenue boundary excludes conductive n-type power-device wafers, finished GaN amplifiers, radio units, telecom towers, and epitaxial processing invoiced as a separate product.

Two manufacturer catalogues establish a commercial RF-specific substrate category. Wolfspeed lists high-purity semi-insulating 4H-SiC products at 100 mm and 150 mm, including a 150 mm production-grade wafer with resistance at or above 10^8 ohm-centimetres. Coherent offers semi-insulating 6H-SiC RF substrates, including diameters up to 200 mm, and identifies GaN-on-SiC radio amplifiers as an intended application. These are materially different products from the conductive substrates used for automotive SiC MOSFETs.

The market growth bridge is anchored to the published 2024 value of USD 347 million and 2032 value of USD 742 million. Those endpoints mathematically imply an annual expansion rate close to ten percent, rather than the separately printed 10.3%. The 2026 and 2036 values are constant-rate extensions of those endpoints; the 2036 amount lies four years beyond the original published horizon and should be treated as a projection rather than as audited semiconductor-material sales.

RF substrate economics depend on crystal polytype, purity, micropipe and dislocation specifications, surface polish, bow and warp, and wafer diameter. A 150 mm wafer provides more potential die area than a 100 mm wafer, but only if epitaxy uniformity, lithographic yield and amplifier reliability meet the radio customer’s acceptance criteria. Wolfspeed identifies 100 mm and 150 mm high-purity semi-insulating part numbers, while Coherent documents a separate 200 mm semi-insulating material offering; those catalogue facts do not establish an industry-wide diameter mix.

Downstream wireless deployment remains an important demand indicator without being equivalent to substrate revenue. Ericsson counted 3.1 billion global 5G subscriptions in the first quarter of 2026 and 390 commercial 5G operators by June, while the European Commission reported 94.3% household 5G coverage across the EU at the end of 2024. Radio traffic, power-amplifier architecture, inventory cycles and sourcing choices mediate how this network activity becomes actual RF-grade wafer orders.

Segment Analysis: By Type

By type, this RF substrate market is divided into 4-inch, 6-inch and 8-inch single-crystal wafers. The 6-inch category is modeled at ~56% of 2026 revenue, 4-inch at ~34% and 8-inch at ~10%. Differences reflect device-fab tool availability, qualification history and the relative economics of 100 mm, 150 mm and 200 mm high-resistivity crystal growth.

Type Product role Market position
4 Inch 100 mm legacy production and selected high-purity semi-insulating material grades remain useful in qualified GaN radio-frequency wafer lines. The smaller format can support established process recipes and lower retooling expense when an amplifier design is already validated at a fixed diameter. An estimated ~34% of 2026 value is associated with 4-inch RF substrate purchases. Replacement orders for 4G radios and smaller GaN wafer lines sustain this format, but its modeled share declines as customers migrate to 150 mm equipment. The published 2032 4-inch revenue anchor provides an external directional check, not an audited 2026 mix.
6 Inch 150 mm high-purity semi-insulating 4H-SiC is explicitly offered in Wolfspeed RF materials catalogues. The format supports higher device output per processed wafer and has become a practical bridge between established 100 mm production and emerging 200 mm development. Radio amplifier makers still require epitaxial and RF reliability qualification before transferring a design. The 6-inch class accounts for an estimated ~56% of 2026 sales, making it the modeled market leader. Procurement teams value its balance of process maturity, defect control and usable die area, especially for GaN HEMT base-station power amplifiers. A larger substrate does not automatically produce lower device cost if the epitaxial yield or wafer handling infrastructure is inadequate.
8 Inch 200 mm semi-insulating substrates are identified in Coherent RF materials specifications, although commercial scale and individual customer acceptance are not disclosed for the full supplier set. The 8-inch class potentially reduces processing cost per die when deposition, lithography and packaging yield scale appropriately. It is not interchangeable with the more widely publicized 200 mm conductive n-type power substrates. An estimated ~10% of 2026 RF-substrate value is assigned to 8-inch material, with the fastest modeled growth from a relatively small base. The share is a scenario allocation rather than an audited shipment measure. Larger wafers face additional crystal-growth, stress and bow requirements, so near-term demand is limited by qualified radio device fabrication lines rather than by nominal wafer diameter alone.

4-inch RF Substrate Outlook

The 100 mm format remains a practical choice for radio devices that have already passed long-duration reliability testing on established GaN-on-SiC production tools. Migrating these products to 150 mm would require revalidation of epitaxy, device electrical characteristics and package thermal behavior. The estimated ~34% 2026 share reflects a legacy and specialty production role, not a claim that all 4G radio power amplifiers use SiC.

6-inch RF Substrate Outlook

The 150 mm wafer combines an explicitly documented high-purity semi-insulating product specification with more potential device area than the 100 mm generation. Manufacturers must still verify on-axis orientation, resistivity, surface damage and layer uniformity at the amplifier fabrication stage. An estimated ~56% revenue position in 2026 represents the central qualified production platform in the scenario, while its growth is constrained by customer redesign cycles and alternative RF materials.

8-inch RF Substrate Outlook

The 200 mm RF category is technologically distinct from the much more publicized 200 mm conductive SiC substrate launches for power electronics. Coherent lists semi-insulating RF material up to this diameter, yet customer-specific GaN-on-SiC production yields and annual merchant shipments are not publicly audited. The estimated ~10% 2026 allocation therefore reflects early qualified and higher-value orders rather than a claim of universal high-volume 8-inch radio-wafer manufacturing.

Segment Analysis: By Application

The application boundary distinguishes substrates used in 4G radio base-station power amplifiers from substrates sold for 5G base-station equipment. In 2026, 5G carries an estimated ~76% share and 4G accounts for ~24%; the split is based on radio capacity additions, high-frequency amplifier demand and the continuing maintenance burden of existing LTE networks.

Application Demand characteristics
4G Base Station An estimated ~24% of 2026 RF substrate revenue supports LTE radio systems, installed-site maintenance, network densification and replacement of aging power-amplifier chains. Older 100 mm and qualified 150 mm device lines can remain economical when output specifications and total ownership costs matter more than migrating to the latest radio architecture. Not every 4G base station uses GaN-on-SiC, because silicon LDMOS remains an alternative.
5G Base Station An estimated ~76% of 2026 RF substrate demand is linked to 5G radio power amplifiers and associated GaN-on-SiC HEMT devices. Higher antenna-element counts, massive-MIMO systems and operation across additional bands raise the value of high-efficiency RF devices, although 5G coverage alone cannot be translated into wafer sales without amplifier design, die area, yield and inventory assumptions.

A single 5G network may contain macro-cell radios, small cells, distributed antenna units and fixed-wireless-access sites with very different amplifier powers. Semi-insulating SiC is most compelling where RF efficiency, power density and thermal management justify its cost. Operators may also deploy silicon LDMOS or GaN-on-silicon for selected bands and output classes, making application penetration a device-design question rather than a simple count of 5G sites.

The 4G installed base creates a replacement stream even when new LTE site construction slows. Radio vendors maintain qualified amplifier platforms for years because field replacement must match existing band plans and reliability specifications. A supplier with stable 100 mm crystal quality may therefore retain business without matching the fastest-growing 8-inch technology, particularly in regions with long telecom asset lives.

5G standalone, spectrum refarming and network densification create additional RF load, but purchasing often occurs through a chain of substrate supplier, GaN epitaxy provider, device fab, amplifier integrator and radio equipment maker. Each stage can hold inventory or source from more than one country. Demand attributed to 5G should therefore be recognized when the merchant RF substrate changes hands, not when an operator books an infrastructure capital expense.
Regional Analysis

Regional allocation uses the location of merchant RF-substrate demand through radio semiconductor supply chains rather than counting all semiconductor wafers or finished base stations. Asia-Pacific leads at an estimated ~48% in 2026, North America follows at ~24%, Europe at ~18%, and South America and the Middle East & Africa each at ~5%. These shares are modeled allocations, not manufacturer-reported geographic revenue.

Which regions purchase the most RF-grade SiC substrates for base stations?

Asia-Pacific has the largest modeled share because multiple radio equipment and semiconductor fabrication chains converge around China, South Korea, Japan and neighboring countries. The regional value mix can shift when a substrate is invoiced to a GaN foundry in one country but ultimately appears in an amplifier or radio sold elsewhere. Buyer location, not network subscriber location, is the consistent accounting convention for this market.

North America and Europe contribute material technology, design activity and 5G radio demand but also depend on globally distributed epitaxial and device fabrication. Ericsson reported 3.1 billion 5G subscriptions worldwide in early 2026; that figure is useful for the telecom growth backdrop but cannot validate RF substrate regional shares. Qualifying a wafer grade can take longer than adding a network site, producing temporary divergence between telecom and material shipments.

Region Position Growth outlook Demand profile What decides supplier selection
Asia-Pacific Estimated ~48% in 2026 ~10.8% CAGR China, Japan, South Korea, India, Southeast Asia; qualified RF device supply-chain purchases. Asia-Pacific RF resistivity, 100/150/200 mm wafer quality, radio amplifier yield and stable multi-year sourcing.
North America Estimated ~24% in 2026 ~9.6% CAGR United States, Canada, Mexico; qualified RF device supply-chain purchases. North America RF resistivity, 100/150/200 mm wafer quality, radio amplifier yield and stable multi-year sourcing.
Europe Estimated ~18% in 2026 ~9.0% CAGR Germany, France, United Kingdom, Italy, Nordic countries; qualified RF device supply-chain purchases. Europe RF resistivity, 100/150/200 mm wafer quality, radio amplifier yield and stable multi-year sourcing.
South America Estimated ~5% in 2026 ~8.8% CAGR Brazil, Argentina, Chile, Colombia; qualified RF device supply-chain purchases. South America RF resistivity, 100/150/200 mm wafer quality, radio amplifier yield and stable multi-year sourcing.
Middle East & Africa Estimated ~5% in 2026 ~7.7% CAGR Saudi Arabia, UAE, Türkiye, South Africa; qualified RF device supply-chain purchases. Middle East & Africa RF resistivity, 100/150/200 mm wafer quality, radio amplifier yield and stable multi-year sourcing.

Asia-Pacific ~48% share · modeled

What supports the Asia-Pacific RF substrate market?

Asia-Pacific accounts for an estimated ~48% of 2026 RF-substrate revenue and expands at a modeled ~10.8% CAGR through 2036. China and South Korea lead radio hardware ecosystems, Japan contributes materials engineering, and India provides network-expansion demand. RF device manufacturing and radio procurement are not necessarily in the same country, making regional allocations sensitive to whether the buyer is a wafer foundry or a radio-equipment integrator. Asia-Pacific market shares measure commercial RF-grade substrate purchases associated with this regional supply chain, not the total value of semiconductor devices or base-station infrastructure installed in the territory.

Market position~48% modeled 2026 share
Growth outlook~10.8% modeled CAGR
Demand profile4G/5G GaN RF amplifier chain
Market access gate100/150/200 mm RF qualification
Country Position in region What drives demand
China Core China influences the RF substrate chain through local network requirements, equipment procurement and cross-border device fabrication. The modeled Asia-Pacific regional share of ~48% is not assigned to China as an audited sales figure. China radio design choices, thermal management and supplier qualification determine how much of the network opportunity ultimately uses semi-insulating SiC rather than alternative RF substrates.
Japan Supporting Japan illustrates how a 4G-to-5G transition can change the mix of 100 mm and 150 mm wafer orders without a direct one-for-one link to the number of radio towers. Japan material acceptance depends on substrate resistivity, surface polish, GaN epitaxy yield and amplifier reliability, and material shipments may be invoiced through an offshore semiconductor supply chain.
South Korea Emerging South Korea is relevant to procurement planning because local spectrum deployment, operator capex and import logistics affect the cadence of new radio orders. The 2026 modeled ~48% Asia-Pacific allocation covers multiple countries and should not be mistaken for a South Korea shipment statistic. For South Korea, RF-grade wafer demand can lag radio launches as vendors consume existing die and amplifier inventories.

Market instances

  • Asia-Pacific RF supply-chain instance: Asia-Pacific equipment supply contracts often involve multi-country qualification, wafer shipments and radio-system integration rather than a single domestic production line. In the 2026–2036 scenario, Asia-Pacific begins at an estimated ~48% of worldwide RF substrate sales, with 100 mm, 150 mm and 200 mm RF material qualifications changing at different rates. For Asia-Pacific, this modeled allocation should not be confused with local base-station capital spending or an audited semiconductor supplier revenue series.
In the full report: In Asia-Pacific, country-level demand, 4G/5G radio equipment sourcing, 100 mm versus 150 mm qualification, supplier exposure and modeled ~10.8% regional growth assumptions are evaluated separately from conductive SiC power-wafer sales.

North America ~24% share · modeled

What supports the North America RF substrate market?

North America accounts for an estimated ~24% of 2026 RF-substrate revenue and expands at a modeled ~9.6% CAGR through 2036. The United States combines radio semiconductor design, RF materials suppliers and a broad installed 5G base. Equipment upgrades and fixed-wireless access support demand, but network densification differs sharply by geography. US substrate production can be exported into Asian device fabs, so country production should not be mistaken for local end-market consumption. North America market shares measure commercial RF-grade substrate purchases associated with this regional supply chain, not the total value of semiconductor devices or base-station infrastructure installed in the territory.

Market position~24% modeled 2026 share
Growth outlook~9.6% modeled CAGR
Demand profile4G/5G GaN RF amplifier chain
Market access gate100/150/200 mm RF qualification
Country Position in region What drives demand
United States Core United States influences the RF substrate chain through local network requirements, equipment procurement and cross-border device fabrication. The modeled North America regional share of ~24% is not assigned to United States as an audited sales figure. United States radio design choices, thermal management and supplier qualification determine how much of the network opportunity ultimately uses semi-insulating SiC rather than alternative RF substrates.
Canada Supporting Canada illustrates how a 4G-to-5G transition can change the mix of 100 mm and 150 mm wafer orders without a direct one-for-one link to the number of radio towers. Canada material acceptance depends on substrate resistivity, surface polish, GaN epitaxy yield and amplifier reliability, and material shipments may be invoiced through an offshore semiconductor supply chain.
Mexico Emerging Mexico is relevant to procurement planning because local spectrum deployment, operator capex and import logistics affect the cadence of new radio orders. The 2026 modeled ~24% North America allocation covers multiple countries and should not be mistaken for a Mexico shipment statistic. For Mexico, RF-grade wafer demand can lag radio launches as vendors consume existing die and amplifier inventories.

Market instances

  • North America RF supply-chain instance: North America equipment supply contracts often involve multi-country qualification, wafer shipments and radio-system integration rather than a single domestic production line. In the 2026–2036 scenario, North America begins at an estimated ~24% of worldwide RF substrate sales, with 100 mm, 150 mm and 200 mm RF material qualifications changing at different rates. For North America, this modeled allocation should not be confused with local base-station capital spending or an audited semiconductor supplier revenue series.
In the full report: In North America, country-level demand, 4G/5G radio equipment sourcing, 100 mm versus 150 mm qualification, supplier exposure and modeled ~9.6% regional growth assumptions are evaluated separately from conductive SiC power-wafer sales.

Europe ~18% share · modeled

What supports the Europe RF substrate market?

Europe accounts for an estimated ~18% of 2026 RF-substrate revenue and expands at a modeled ~9.0% CAGR through 2036. European operators continue 5G standalone upgrades and selected radio-site densification, while semiconductor companies contribute substrate and epitaxial know-how. The European Commission reported 94.3% EU household 5G coverage at end-2024, but that metric includes multiple radio technologies and does not measure GaN-on-SiC penetration or substrate purchases. Europe market shares measure commercial RF-grade substrate purchases associated with this regional supply chain, not the total value of semiconductor devices or base-station infrastructure installed in the territory.

Market position~18% modeled 2026 share
Growth outlook~9.0% modeled CAGR
Demand profile4G/5G GaN RF amplifier chain
Market access gate100/150/200 mm RF qualification
Country Position in region What drives demand
Germany Core Germany influences the RF substrate chain through local network requirements, equipment procurement and cross-border device fabrication. The modeled Europe regional share of ~18% is not assigned to Germany as an audited sales figure. Germany radio design choices, thermal management and supplier qualification determine how much of the network opportunity ultimately uses semi-insulating SiC rather than alternative RF substrates.
France Supporting France illustrates how a 4G-to-5G transition can change the mix of 100 mm and 150 mm wafer orders without a direct one-for-one link to the number of radio towers. France material acceptance depends on substrate resistivity, surface polish, GaN epitaxy yield and amplifier reliability, and material shipments may be invoiced through an offshore semiconductor supply chain.
United Kingdom Emerging United Kingdom is relevant to procurement planning because local spectrum deployment, operator capex and import logistics affect the cadence of new radio orders. The 2026 modeled ~18% Europe allocation covers multiple countries and should not be mistaken for a United Kingdom shipment statistic. For United Kingdom, RF-grade wafer demand can lag radio launches as vendors consume existing die and amplifier inventories.

Market instances

  • Europe RF supply-chain instance: Europe equipment supply contracts often involve multi-country qualification, wafer shipments and radio-system integration rather than a single domestic production line. In the 2026–2036 scenario, Europe begins at an estimated ~18% of worldwide RF substrate sales, with 100 mm, 150 mm and 200 mm RF material qualifications changing at different rates. For Europe, this modeled allocation should not be confused with local base-station capital spending or an audited semiconductor supplier revenue series.
In the full report: In Europe, country-level demand, 4G/5G radio equipment sourcing, 100 mm versus 150 mm qualification, supplier exposure and modeled ~9.0% regional growth assumptions are evaluated separately from conductive SiC power-wafer sales.

South America ~5% share · modeled

What supports the South America RF substrate market?

South America accounts for an estimated ~5% of 2026 RF-substrate revenue and expands at a modeled ~8.8% CAGR through 2036. Brazil drives the largest part of the region’s modeled demand through urban 5G rollout, while Argentina and neighboring markets add smaller equipment replacement opportunities. Currency movements, spectrum conditions and import logistics affect the pace of radio deployment. The substrate purchase may occur in a foreign foundry even when the ultimate radio operates in South America. South America market shares measure commercial RF-grade substrate purchases associated with this regional supply chain, not the total value of semiconductor devices or base-station infrastructure installed in the territory.

Market position~5% modeled 2026 share
Growth outlook~8.8% modeled CAGR
Demand profile4G/5G GaN RF amplifier chain
Market access gate100/150/200 mm RF qualification
Country Position in region What drives demand
Brazil Core Brazil influences the RF substrate chain through local network requirements, equipment procurement and cross-border device fabrication. The modeled South America regional share of ~5% is not assigned to Brazil as an audited sales figure. Brazil radio design choices, thermal management and supplier qualification determine how much of the network opportunity ultimately uses semi-insulating SiC rather than alternative RF substrates.
Argentina Supporting Argentina illustrates how a 4G-to-5G transition can change the mix of 100 mm and 150 mm wafer orders without a direct one-for-one link to the number of radio towers. Argentina material acceptance depends on substrate resistivity, surface polish, GaN epitaxy yield and amplifier reliability, and material shipments may be invoiced through an offshore semiconductor supply chain.
Chile Emerging Chile is relevant to procurement planning because local spectrum deployment, operator capex and import logistics affect the cadence of new radio orders. The 2026 modeled ~5% South America allocation covers multiple countries and should not be mistaken for a Chile shipment statistic. For Chile, RF-grade wafer demand can lag radio launches as vendors consume existing die and amplifier inventories.

Market instances

  • South America RF supply-chain instance: South America equipment supply contracts often involve multi-country qualification, wafer shipments and radio-system integration rather than a single domestic production line. In the 2026–2036 scenario, South America begins at an estimated ~5% of worldwide RF substrate sales, with 100 mm, 150 mm and 200 mm RF material qualifications changing at different rates. For South America, this modeled allocation should not be confused with local base-station capital spending or an audited semiconductor supplier revenue series.
In the full report: In South America, country-level demand, 4G/5G radio equipment sourcing, 100 mm versus 150 mm qualification, supplier exposure and modeled ~8.8% regional growth assumptions are evaluated separately from conductive SiC power-wafer sales.

Middle East & Africa ~5% share · modeled

What supports the Middle East & Africa RF substrate market?

Middle East & Africa accounts for an estimated ~5% of 2026 RF-substrate revenue and expands at a modeled ~7.7% CAGR through 2036. Gulf operators emphasize high-capacity 5G sites and fixed wireless access, while parts of Africa remain at earlier coverage stages. The demand mix depends on spectrum allocation, tower backhaul and network financing rather than wafer supply alone. RF substrates generally enter through international device and equipment supply chains, with local radio assembly not necessarily indicating local crystal production. Middle East & Africa market shares measure commercial RF-grade substrate purchases associated with this regional supply chain, not the total value of semiconductor devices or base-station infrastructure installed in the territory.

Market position~5% modeled 2026 share
Growth outlook~7.7% modeled CAGR
Demand profile4G/5G GaN RF amplifier chain
Market access gate100/150/200 mm RF qualification
Country Position in region What drives demand
Saudi Arabia Core Saudi Arabia influences the RF substrate chain through local network requirements, equipment procurement and cross-border device fabrication. The modeled Middle East & Africa regional share of ~5% is not assigned to Saudi Arabia as an audited sales figure. Saudi Arabia radio design choices, thermal management and supplier qualification determine how much of the network opportunity ultimately uses semi-insulating SiC rather than alternative RF substrates.
UAE Supporting UAE illustrates how a 4G-to-5G transition can change the mix of 100 mm and 150 mm wafer orders without a direct one-for-one link to the number of radio towers. UAE material acceptance depends on substrate resistivity, surface polish, GaN epitaxy yield and amplifier reliability, and material shipments may be invoiced through an offshore semiconductor supply chain.
Türkiye Emerging Türkiye is relevant to procurement planning because local spectrum deployment, operator capex and import logistics affect the cadence of new radio orders. The 2026 modeled ~5% Middle East & Africa allocation covers multiple countries and should not be mistaken for a Türkiye shipment statistic. For Türkiye, RF-grade wafer demand can lag radio launches as vendors consume existing die and amplifier inventories.

Market instances

  • Middle East & Africa RF supply-chain instance: Middle East & Africa equipment supply contracts often involve multi-country qualification, wafer shipments and radio-system integration rather than a single domestic production line. In the 2026–2036 scenario, Middle East & Africa begins at an estimated ~5% of worldwide RF substrate sales, with 100 mm, 150 mm and 200 mm RF material qualifications changing at different rates. For Middle East & Africa, this modeled allocation should not be confused with local base-station capital spending or an audited semiconductor supplier revenue series.
In the full report: In Middle East & Africa, country-level demand, 4G/5G radio equipment sourcing, 100 mm versus 150 mm qualification, supplier exposure and modeled ~7.7% regional growth assumptions are evaluated separately from conductive SiC power-wafer sales.

Competitive Landscape

The merchant RF substrate market has a smaller confirmed direct-fit supplier group than a general SiC power-substrate roster. Coherent and Wolfspeed explicitly advertise semi-insulating SiC materials for GaN-on-SiC RF applications, while several other companies on the original industry roster are known primarily for conductive power wafers. Supplier position should be judged by current RF-grade catalogues and customer qualifications, not broad corporate SiC revenue.

Wolfspeed lists high-purity semi-insulating 4H-SiC wafers at 100 mm and 150 mm, together with GaN epitaxy on SiC. Its published part descriptions specify production-grade on-axis substrates and minimum resistivity. Coherent lists semi-insulating 6H-SiC RF substrates up to 200 mm, with vanadium-doped material properties. The two catalogues illustrate why high-resistivity RF material is a distinct qualification market from conductive n-type SiC wafers used for power MOSFETs.

The broader roster includes ROHM and its SiCrystal activities, STMicroelectronics and the former Norstel business, Resonac, SK Siltron, SICC and TanKeBlue. Official procurement and development announcements document SiC material capability, but many of those disclosures concern 150 mm or 200 mm conductive power substrates. They are adjacent participants rather than confirmed direct-fit current merchant suppliers of semi-insulating wafers for base-station RF devices.

Supplier competition centers on crystal resistivity, micropipe density, dislocation control, surface preparation, usable wafer area, epitaxy compatibility and delivery consistency. A radio amplifier fab may qualify more than one supplier but cannot instantly substitute different polytypes or doping technologies. Commercial contracts are therefore influenced by long device life cycles, multi-year customer audits and the cost of requalifying a power-amplifier design.

The estimated regional and segment shares describe the addressable market rather than company rankings. Public sources inspected for this study do not disclose audited RF-base-station-only substrate revenue by manufacturer. A materials company with substantial electric-vehicle SiC business should not automatically be ranked first in semi-insulating RF substrates, and a company that only sells finished amplifiers is not a merchant wafer supplier.

Tier structure

Tier Companies Basis of competition
Direct RF material specialists Wolfspeed; Coherent Explicit manufacturer catalogues for semi-insulating SiC substrates and GaN-on-SiC RF fabrication; 100 mm, 150 mm and up-to-200 mm offerings differ by vendor and grade.
Adjacent SiC substrate groups ROHM / SiCrystal; STMicroelectronics / Norstel; SICC; TanKeBlue; Resonac; SK Siltron Verified SiC crystal or substrate capability in official releases, frequently for conductive power applications; RF-specific commercial availability is not assumed.
RF device and ecosystem buyers GaN RF epitaxy providers; RF semiconductor fabs; integrated radio device manufacturers These firms may purchase or process semi-insulating substrates but should not be counted as independent merchant SiC crystal suppliers without product-level evidence.

Key companies profiled

  • Wolfspeed
  • Coherent
  • ROHM / SiCrystal
  • STMicroelectronics / Norstel
  • SICC Materials
  • TanKeBlue Semiconductor
  • Resonac
  • SK Siltron
  • Other qualified RF epitaxy partners

Production, Qualification and Technology Outlook

High-resistivity single-crystal SiC substrates are produced through crystal growth, wafer slicing, grinding, polishing and RF-grade qualification before GaN epitaxy. Their commercial value is determined less by nominal crystal output than by the proportion of wafers meeting RF device fabrication specifications, including resistivity, surface finish and defect limits. Acceptance by the RF semiconductor foundry is required before a substrate shipment can support an amplifier production run.

A manufacturer can sell conductive SiC for high-voltage power switches and semi-insulating SiC for RF transistors, but the products have different dopant and resistivity specifications. Coherent describes a vanadium-doped 6H-SiC semi-insulating grade, whereas Wolfspeed lists high-purity 4H-SiC semi-insulating wafers without vanadium doping. Treating all SiC substrate production as interchangeable would inflate the radio-frequency opportunity and conceal the cost of separate crystal-growth process controls.

Diameter migration affects output only after the GaN-on-SiC process flow is qualified. A nominal 200 mm wafer has roughly 1.78 times the geometric area of a 150 mm wafer, but the realized economic benefit depends on edge exclusion, wafer bow, epitaxial uniformity and functional amplifier die yield. Coherent advertises RF substrates up to 200 mm; Wolfspeed currently lists specific 100 mm and 150 mm HPSI part numbers on its RF product page.

Network traffic indicators influence demand with a lag. Ericsson measured 162 million new 5G subscriptions in the first quarter of 2026 and 390 operators with commercial 5G services by June. Radio vendors first translate capacity needs into amplifier designs, then device fabs place epitaxial and substrate orders. Inventories at these intermediate stages mean quarterly network construction cannot be multiplied directly by wafer price to produce a reliable RF substrate revenue series.

Market Dynamics, Drivers and Restraints

RF-grade SiC demand responds to high-frequency amplifier adoption, network capacity and supplier qualification, while crystal cost, alternative transistor platforms and inventory volatility restrain growth. The six-column impact model allocates positive and negative contributions to the reconciled ten-percent annual market expansion across the 2027–2036 horizon. These factor weights represent a scenario allocation, not separate audited causal measurements of annual wafer revenue.

MARKET DRIVERS

Drivers Impact Analysis

Market Drivers Impact Rank CAGR Contribution (%) 2027–2029 2030–2032 2033–2036
5G radio capacity and GaN amplifier design wins High +6.10% High High Medium
150 mm HPSI process maturity and wafer yield High +3.70% High Medium Medium
200 mm RF substrate qualification and area efficiency Medium-High +2.60% Low Medium High
Multi-band radio upgrades and 5G standalone expansion Medium +1.80% Medium High Medium
Others (RF thermal density and supplier localization) Low +1.50% Medium Medium Medium

5G radio amplifier requirements

Massive-MIMO radios, higher antenna-element counts and greater traffic concentration increase the importance of RF power efficiency and heat dissipation. GaN-on-SiC HEMTs can serve these demands where output power and frequency justify a semi-insulating substrate. Ericsson reported 3.1 billion 5G subscriptions by the first quarter of 2026, but substrate revenue materializes only when a qualified device maker orders RF-grade wafers.

150 mm production readiness

Wolfspeed identifies a 150 mm production-grade HPSI 4H-SiC part with on-axis orientation and a resistivity specification at or above 10^8 ohm-centimetres. Existing fabrication equipment and qualified GaN epitaxy processes make this diameter commercially relevant. Wider adoption depends on maintaining defect, bow and polishing tolerances rather than simply increasing the number of wafers grown per crystal run.

200 mm RF-grade substrate development

Coherent identifies semi-insulating SiC RF substrates up to 200 mm, providing a path toward larger die output when device processing can scale. The theoretical wafer-area advantage over 150 mm is close to 78%, but realized value is constrained by epitaxial uniformity and radio amplifier qualification. Public 200 mm announcements for conductive power substrates should not be treated as evidence of equal RF-grade shipment volume.

Network modernization and spectrum refarming

European 5G household coverage reached 94.3% by the end of 2024, according to the European Commission, yet coverage alone does not determine high-power radio content. Network modernization changes amplifier requirements through spectrum combinations, carrier aggregation and site density. Material demand grows when these engineering choices result in new GaN-on-SiC RF power stages rather than alternative semiconductor architectures.

Others (heat density and sourcing resilience)

Base-station radios must operate outdoors with constrained cooling and long service lives, so semiconductor junction temperature and reliability are important design parameters. High-thermal-conductivity SiC substrates support power-density requirements in suitable GaN amplifiers. Regional sourcing diversification can also encourage dual qualification, but parallel qualification programmes increase engineering expense before any additional merchant wafer sale is recognized.

MARKET RESTRAINTS

Restraints Impact Analysis

Market Restraints Impact Rank CAGR Contribution (%) 2027–2029 2030–2032 2033–2036
Crystal defect control and high RF wafer cost High -2.50% High Medium Medium
GaN-on-silicon and silicon LDMOS competition Medium-High -1.70% Medium High High
RF fab qualification lead times and inventory cycles Medium -1.00% High Medium Low
Others (telecom capex and spectrum timing) Low -0.50% Medium Medium Low

High RF-grade crystal and polishing cost

Semi-insulating SiC requires tight resistivity and defect control, while radio-frequency devices demand polished surfaces compatible with demanding epitaxial processes. Yield losses at crystal growth, slicing or final qualification can outweigh the geometric advantage of larger diameters. Buyers therefore compare the total cost per good amplifier die, not the catalogue price per substrate, when deciding whether to adopt a new wafer size.

Alternative RF semiconductor platforms

Silicon LDMOS remains relevant for some cellular amplifier classes, while GaN-on-silicon may be attractive where substrate economics and process integration outweigh the thermal benefits of GaN-on-SiC. STMicroelectronics documents advanced RF-SOI solutions for other front-end functions, illustrating the broader RF architecture competition. None of these technologies is a direct one-for-one substitute across every output-power and frequency requirement.

Long device qualification cycles

Radio infrastructure equipment is expected to operate reliably for many years, and changes in wafer diameter, crystal polytype or dopant strategy can alter device characteristics. A supplier must satisfy material and epitaxial specifications before the RF semiconductor fab qualifies finished transistors. This introduces a lag between announcing a new substrate product and recording stable commercial orders for 5G base-station production.

Others (carrier spending cycles)

Telecom infrastructure purchases fluctuate with spectrum auctions, financing conditions, inventory digestion and the timing of network upgrades. Ericsson reported expanding 5G subscriptions in 2026, but subscriptions can rise even when operators defer new macro sites. The market therefore remains exposed to differences between traffic demand, equipment shipments and actual wafer consumption at semiconductor fabrication facilities.

MARKET OPPORTUNITIES

Higher-yield GaN-on-SiC integration

Improved surface preparation, defect mapping and epitaxial uniformity could raise the proportion of RF amplifier die passing qualification on 150 mm and 200 mm wafers. Because merchant substrate sales are recognized upstream, better yield can influence both customer willingness to pay and wafer volumes. The opportunity is strongest when crystal suppliers collaborate directly with GaN foundries on repeatable, high-volume RF process windows.

Regional supplier diversification

Equipment makers may seek additional qualified sources of high-resistivity SiC to reduce geographic concentration and supply interruptions. A second source is valuable only if crystal orientation, resistivity, polish and GaN epitaxy compatibility match the established device design. Supplier development contracts could broaden participation without implying that every SiC power-wafer producer is already a commercial RF-grade merchant vendor.

5G-Advanced and future radio bands

Rising bandwidth, uplink traffic and antenna integration can create new requirements for efficient radio-frequency amplification. Ericsson found uplink growth faster than downlink at 43 of 55 surveyed operators, supporting the need for continued radio performance improvements. The opportunity for semi-insulating SiC depends on which bands and power classes adopt GaN-on-SiC instead of silicon LDMOS or other alternatives.

Value Chain and Purchasing Economics

The RF substrate value chain moves from high-resistivity SiC crystal growth to wafer preparation, GaN epitaxy, RF device fabrication, power-amplifier integration and radio-equipment deployment. Only the separately invoiced merchant SiC substrate is counted in this market, preventing double counting with epitaxial wafers, finished transistors and base-station hardware. Supplier contracts and the transfer of ownership establish the relevant commercial transaction.

Crystal growthHigh-resistivity 4H or 6H single-crystal SiC with controlled defects and electrical isolation.
Wafer preparation100, 150 or 200 mm slicing, grinding, polishing, resistivity and defect qualification.
RF semiconductorGaN epitaxy, HEMT device processing, power-amplifier qualification and packaging.
Network equipmentRadio-unit assembly, multi-band antenna integration and 4G/5G base-station deployment.

Upstream material. High-purity and doped semi-insulating SiC follow different crystal-control strategies. Wolfspeed publishes HPSI 4H-SiC RF specifications, while Coherent publishes vanadium-doped 6H-SiC RF material properties. Supplier revenue belongs to this market when the prepared RF substrate is sold to an independent buyer, not when a captive wafer is transferred internally without a separately priced transaction.

Wafer finishing. Mechanical and chemical polishing determine whether the silicon face is suitable for GaN epitaxy and RF device fabrication. The published Wolfspeed 100 mm and 150 mm RF products specify double-sided polish and epitaxy-ready preparation. Reject rates, surface scratches and wafer bow can affect the cost of each qualified die, which is why RF customers purchase to detailed material specifications rather than nominal diameter alone.

Epitaxy and device fabrication. The semi-insulating substrate becomes the base for GaN and AlGaN layers that form high-electron-mobility transistors. Wolfspeed lists GaN epitaxy structures on SiC and material characteristics used for RF device qualification. When an epitaxy supplier buys a bare substrate and later sells a finished epitaxial wafer, the substrate value should be counted once; the additional epitaxy processing value is outside the defined merchant bare-substrate boundary.

Radio equipment integration. Finished RF transistors and amplifiers enter radio units, then become part of operator network deployments. Ericsson and European Commission 5G statistics illuminate downstream demand, but do not reveal the RF substrate content per radio. The connection from base-station capital spending to merchant wafer revenue depends on amplifier topology, frequency bands, die area, fabrication yield and inventories held across several companies.

Recent Developments

  • 15 October 2026 Adjacent SiC supply
    Infineon announced an expanded 200 mm SiC wafer supply relationship with Wolfspeed, supporting broader wafer manufacturing capability. The agreement concerns power semiconductor material and is not evidence that 200 mm semi-insulating RF substrates were purchased for base stations. Its relevance is the shared industrial challenge of larger-diameter crystal quality, multi-source procurement and the capital intensity of SiC material capacity. Source
  • 27 September 2026 Adjacent material
    Wolfspeed launched a premium 200 mm n-type SiC substrate with lower reported micropipe density for power semiconductor customers. This is a conductive power-wafer product, not a verified semi-insulating RF base-station substrate shipment. The development illustrates the importance of defect mapping and wafer-shape stability, while the separate RF product catalogue remains the appropriate source for high-purity semi-insulating offerings. Source
  • 16 June 2026 Wireless demand
    Ericsson reported 3.1 billion 5G subscriptions during the first quarter of 2026 and projected 6.4 billion by 2031. Its report also noted that uplink growth exceeded downlink growth for many measured networks. These indicators support continued radio capacity investment but do not measure RF-grade SiC substrate shipments or the fraction of 5G amplifiers manufactured on GaN-on-SiC. Source
  • 10 September 2025 Adjacent wafer scale
    Wolfspeed announced commercial availability of 200 mm SiC materials for power electronics and separate epitaxial qualification. The release explicitly focuses on power-device manufacturing and should not be presented as an RF HPSI wafer launch. It nevertheless documents the industrial move toward larger substrate diameters, which influences capital equipment and process know-how across the wider SiC ecosystem. Source
  • 12 August 2025 Network context
    The European Commission updated its 5G Observatory findings, reporting 94.3% EU household 5G coverage at the end of 2024 and growing interest in standalone network services. This is a dated policy and deployment indicator, not a silicon carbide product launch. Its relevance is to the future radio equipment installed base that may adopt qualified high-power GaN-on-SiC amplifier architectures. Source
  • 26 September 2024 Adjacent wafer production
    Coherent announced shipments of 200 mm n-type SiC substrates and epitaxial wafers for power semiconductors, including 350-micron and 500-micron formats. The announcement is distinct from its separate semi-insulating RF substrate catalogue. It demonstrates manufacturing scale-up experience but cannot be used to assert RF-grade 200 mm sales volumes or base-station-specific revenue. Source
  • 22 February 2024 Adjacent capacity
    SK announced that SK Siltron CSS had secured a conditional US Department of Energy loan commitment of up to USD 544 million for SiC wafer manufacturing expansion in Michigan. The announced facility programme relates primarily to power semiconductor substrates rather than audited RF HPSI base-station sales. It illustrates capital requirements for crystal capacity and the need to distinguish announced financing from realized shipments. Source
  • 3 May 2023 Adjacent supplier agreements
    Infineon announced SiC material supply relationships involving SICC and TanKeBlue for power semiconductor manufacturing. Those releases support the existence of qualified commercial SiC substrate suppliers, but do not establish that the same firms sell semi-insulating RF wafers to GaN-on-SiC base-station device fabs. RF-specific company inclusion therefore requires a current high-resistivity product catalogue or customer qualification. Source

REPORT SCOPE & SEGMENTATION

Attribute Details
Report Title Silicon Carbide (SiC) Substrates for Base Station Market
2026 Market Size USD 420 million
2027 Estimated Size USD 461 million
2036 Forecast Size USD 1,085 million
CAGR (2027–2036) 10.0%
Historical Period 2021–2025
Base / Estimate / Forecast 2026 / 2027 / 2036
Revenue Boundary Merchant high-resistivity semi-insulating single-crystal SiC substrates sold for GaN-on-SiC base-station RF device fabrication; no conductive power wafers, full radios or separately priced epitaxy.
By Region Asia-Pacific · North America · Europe · South America · Middle East & Africa
By Type 4 Inch · 6 Inch · 8 Inch
By Application 4G Base Station · 5G Base Station
By Insulation Technology High-Purity Semi-Insulating 4H-SiC · Vanadium-Doped Semi-Insulating 6H-SiC
By Buyer Channel RF Epitaxy & Device Foundries · Integrated RF Device Manufacturers
By Region Five modeled regions, by Type, Application, Insulation Technology and Buyer Channel
Asia-PacificChina, Japan, South Korea, India, Southeast Asia
North AmericaUnited States, Canada, Mexico
EuropeGermany, France, United Kingdom, Italy, Nordic countries
South AmericaBrazil, Argentina, Chile, Colombia
Middle East & AfricaSaudi Arabia, UAE, Türkiye, South Africa
Key Companies Profiled Wolfspeed; Coherent; ROHM / SiCrystal; STMicroelectronics / Norstel; SICC Materials; TanKeBlue Semiconductor; Resonac; SK Siltron; RF epitaxy and device-fabrication partners
Customization Scope Custom regional RF-grade qualification, buyer-channel segmentation, 100/150/200 mm substrate scenarios and the separation of merchant substrate revenue from finished RF amplifier and conductive power-wafer markets.

Frequently Asked Questions

How large is the SiC substrates for base station market?

The market stands at an estimated USD 420 million in 2026 and reaches USD 1,085 million in the 2036 projection, a 10.0% annual increase over 2027–2036. The revenue object is separately sold semi-insulating SiC substrate material for GaN-on-SiC radio devices, not full base stations, power electronics, or the total value of RF amplifiers.

What is a semi-insulating SiC RF substrate?

It is a high-resistivity single-crystal silicon carbide wafer used beneath gallium nitride transistor layers in radio-frequency power devices. Electrical isolation limits unwanted substrate conduction, and thermal conductivity helps dissipate heat from high-power amplifiers. Wolfspeed offers high-purity 4H-SiC at 100 mm and 150 mm, while Coherent documents vanadium-doped 6H-SiC offerings for RF applications.

Which wafer diameter is largest in 2026?

The 6-inch class has an estimated ~56% share of 2026 RF substrate sales, followed by 4-inch at ~34% and 8-inch at ~10%. This is a modeled revenue allocation based on qualified fabrication capacity, catalogue availability and the economics of 150 mm GaN-on-SiC device production. The 8-inch share remains more sensitive to qualification and manufacturing scale-up.

Does 5G dominate the addressable application mix?

Yes, 5G base stations account for an estimated ~76% of 2026 demand, compared with ~24% for 4G. High-power radio amplification, multi-band operation and massive-MIMO equipment support GaN-on-SiC opportunities. However, not every 5G radio uses this technology; silicon LDMOS and other RF platforms compete, so subscriber growth does not directly equal wafer shipment growth.

Which region leads RF-grade SiC substrate demand?

Asia-Pacific is the modeled leader at ~48% of 2026 sales, reflecting radio-equipment manufacturing and device supply chains linked to China, Korea, Japan and surrounding markets. North America accounts for an estimated ~24%, Europe ~18%, South America ~5% and Middle East & Africa ~5%. These are modeled merchant substrate purchasing allocations rather than audited company geographic revenue.

Which manufacturers directly document RF substrate products?

Wolfspeed and Coherent have current official catalogues explicitly describing semi-insulating SiC substrates for GaN-on-SiC RF applications. Other large SiC materials groups may participate in related power-wafer or semiconductor supply chains, but their general SiC announcements do not independently confirm current RF-grade merchant offerings. Company rankings based on broad SiC sales are therefore inappropriate for this narrower market.

Why are 4H and 6H SiC material grades different?

High-purity 4H-SiC and vanadium-doped 6H-SiC use different crystal and insulation strategies, so they require distinct epitaxy and device process qualification. Wolfspeed specifies vanadium-free HPSI 4H material, whereas Coherent lists vanadium-doped semi-insulating 6H material. Their commercial relevance depends on RF amplifier design, defect control and thermal properties rather than a universal performance ranking.

What limits the growth of this market?

RF-grade crystal defects, polishing cost, GaN epitaxy yield, long telecom device qualification and competing amplifier platforms all constrain demand. A larger substrate offers geometric area advantages but can lose them through bow, edge exclusion or device-yield penalties. Network operators also change capital spending with spectrum and financing cycles, which creates inventory volatility throughout the materials supply chain.

How is the market different from SiC power wafers?

This market counts only semi-insulating substrates sold for radio-frequency GaN-on-SiC devices used in base stations. Conductive n-type SiC wafers for EV inverters, solar converters and industrial MOSFETs are outside scope. Separately invoiced GaN epitaxy, finished RF amplifiers and entire radio units are also excluded, preventing the same semiconductor material from being counted at several production stages.

What years and segments are included in the study?

The study uses 2026 as base year, 2027 as the estimate year and 2036 as the forecast year, with 2021–2025 historical context. It examines 4-inch, 6-inch and 8-inch types; 4G and 5G applications; insulation technology; buyer channel; and five global regions. Market-share allocations are analyst models and should not be represented as audited supplier disclosures.

Research Sources & Evidence Base
View research sources used for this overview
  1. Coherent. SiC for RF Electronics, Official semi-insulating 6H-SiC RF substrate product catalogue, up to 200 mm, GaN-on-SiC amplifier application.
  2. Wolfspeed. SiC for RF Devices, Official 100 mm and 150 mm high-purity semi-insulating 4H-SiC product specifications and GaN epitaxy options.
  3. Wolfspeed. Materials Applications, RF HEMT fabrication on HPSI SiC and base-station/telecom material application context.
  4. Wolfspeed. Materials Products, Explicit distinction between conductive power substrates and RF semi-insulating substrates.
  5. Coherent / II-VI. Silicon Carbide investor presentation, May 2020, Official distinction between semi-insulating SiC for RF wireless base stations and conductive SiC for power devices.
  6. Coherent. SiC Substrates & Epitaxy, Company product portfolio separation between RF materials and power semiconductor wafers.
  7. Ericsson. Ericsson Mobility Report June 2026 release, 5G subscription, standalone and mobile data traffic demand context, 16 June 2026.
  8. European Commission. European 5G Observatory 2025, EU and international 5G coverage statistics and spectrum policy, updated 12 August 2025.
  9. Coherent. Coherent Expands SiC 200 mm n-Type Epitaxial Wafer Production, 26 September 2024 adjacent conductive power-wafer manufacturing scale-up; not RF-grade shipments.
  10. Wolfspeed. Commercial Launch of 200 mm SiC Materials, 10 September 2025 adjacent power materials qualification and wafer scale-up.
  11. Wolfspeed. Premium 200 mm Power Substrates, 27 September 2026 adjacent n-type power-wafer quality launch, excluded from RF substrate totals.
  12. Infineon. Infineon SiC supply with SICC, 3 May 2023 adjacent power-material supplier agreement, not proof of RF semi-insulating product.
  13. Infineon. Infineon SiC supply with TanKeBlue, 3 May 2023 adjacent 150 mm power-wafer supply context, not direct RF supplier verification.
  14. Infineon. Infineon and Resonac SiC supply agreement, 12 January 2023 adjacent material capacity context for power devices.
  15. Infineon. Infineon multi-source SiC supply strategy, 10 January 2024 adjacent substrate procurement and qualification context.
  16. Infineon. Infineon and Wolfspeed 200 mm SiC supply, 15 October 2026 adjacent power-wafer sourcing expansion, not RF base-station substrate sales.
  17. SK. SK Siltron CSS DOE Loan Commitment, 22 February 2024 adjacent SiC manufacturing capital intensity, not RF merchant sales.
  18. STMicroelectronics. RF-SOI Technology, Alternative RF front-end semiconductor architecture for 4G/5G infrastructure.
Silicon Carbide (SiC) Substrates for Base Station Market

Get Sample Report PDF for Exclusive Insights

Report Sample Includes

  • Table of Contents
  • List of Tables & Figures
  • Charts, Research Methodology, and more...

PDF Icon Download Sample Report PDF

Download Sample Report

Table of Content

1 Semiconductor Materials for High Temperature Market Overview
1.1 Product Overview and Scope of Semiconductor Materials for High Temperature
1.2 Semiconductor Materials for High Temperature Segment by Type
1.2.1 Global Semiconductor Materials for High Temperature Market Size Growth Rate Analysis by Type 2025 VS 2032
1.2.2 Gallium Nitride
1.2.3 Silicon Carbide
1.2.4 Gallium Arsenide
1.2.5 Diamond
1.3 Semiconductor Materials for High Temperature Segment by Application
1.3.1 Global Semiconductor Materials for High Temperature Consumption Comparison by Application: 2025 VS 2032
1.3.2 Automotive
1.3.3 Consumer Electronics
1.3.4 Defense and Aerospace
1.3.5 Industrial and Medical
1.3.6 Other
1.4 Global Market Growth Prospects
1.4.1 Global Semiconductor Materials for High Temperature Revenue Estimates and Forecasts (2026-2034)
1.4.2 Global Semiconductor Materials for High Temperature Production Estimates and Forecasts (2026-2034)
1.5 Global Market Size by Region
1.5.1 Global Semiconductor Materials for High Temperature Market Size Estimates and Forecasts by Region: 2020 VS 2024 VS 2032
1.5.2 North America Semiconductor Materials for High Temperature Estimates and Forecasts (2026-2034)
1.5.3 Europe Semiconductor Materials for High Temperature Estimates and Forecasts (2026-2034)
1.5.4 China Semiconductor Materials for High Temperature Estimates and Forecasts (2026-2034)
1.5.5 Japan Semiconductor Materials for High Temperature Estimates and Forecasts (2026-2034)
1.5.6 South Korea Semiconductor Materials for High Temperature Estimates and Forecasts (2026-2034)
2 Market Competition by Manufacturers
2.1 Global Semiconductor Materials for High Temperature Production Market Share by Manufacturers (2020-2025)
2.2 Global Semiconductor Materials for High Temperature Revenue Market Share by Manufacturers (2020-2025)
2.3 Semiconductor Materials for High Temperature Market Share by Company Type (Tier 1, Tier 2 and Tier 3)
2.4 Global Semiconductor Materials for High Temperature Average Price by Manufacturers (2020-2025)
2.5 Manufacturers Semiconductor Materials for High Temperature Production Sites, Area Served, Product Types
2.6 Semiconductor Materials for High Temperature Market Competitive Situation and Trends
2.6.1 Semiconductor Materials for High Temperature Market Concentration Rate
2.6.2 Global 5 and 10 Largest Semiconductor Materials for High Temperature Players Market Share by Revenue
2.6.3 Mergers & Acquisitions, Expansion
3 Production by Region
3.1 Global Production of Semiconductor Materials for High Temperature Market Share by Region (2020-2025)
3.2 Global Semiconductor Materials for High Temperature Revenue Market Share by Region (2020-2025)
3.3 Global Semiconductor Materials for High Temperature Production, Revenue, Price and Gross Margin (2020-2025)
3.4 North America Semiconductor Materials for High Temperature Production
3.4.1 North America Semiconductor Materials for High Temperature Production Growth Rate (2020-2025)
3.4.2 North America Semiconductor Materials for High Temperature Production, Revenue, Price and Gross Margin (2020-2025)
3.5 Europe Semiconductor Materials for High Temperature Production
3.5.1 Europe Semiconductor Materials for High Temperature Production Growth Rate (2020-2025)
3.5.2 Europe Semiconductor Materials for High Temperature Production, Revenue, Price and Gross Margin (2020-2025)
3.6 China Semiconductor Materials for High Temperature Production
3.6.1 China Semiconductor Materials for High Temperature Production Growth Rate (2020-2025)
3.6.2 China Semiconductor Materials for High Temperature Production, Revenue, Price and Gross Margin (2020-2025)
3.7 Japan Semiconductor Materials for High Temperature Production
3.7.1 Japan Semiconductor Materials for High Temperature Production Growth Rate (2020-2025)
3.7.2 Japan Semiconductor Materials for High Temperature Production, Revenue, Price and Gross Margin (2020-2025)
3.8 South Korea Semiconductor Materials for High Temperature Production
3.8.1 South Korea Semiconductor Materials for High Temperature Production Growth Rate (2020-2025)
3.8.2 South Korea Semiconductor Materials for High Temperature Production, Revenue, Price and Gross Margin (2020-2025)
4 Global Semiconductor Materials for High Temperature Consumption by Region
4.1 Global Semiconductor Materials for High Temperature Consumption by Region
4.1.1 Global Semiconductor Materials for High Temperature Consumption by Region
4.1.2 Global Semiconductor Materials for High Temperature Consumption Market Share by Region
4.2 North America
4.2.1 North America Semiconductor Materials for High Temperature Consumption by Country
4.2.2 U.S.
4.2.3 Canada
4.3 Europe
4.3.1 Europe Semiconductor Materials for High Temperature Consumption by Country
4.3.2 Germany
4.3.3 France
4.3.4 U.K.
4.3.5 Italy
4.3.6 Russia
4.4 Asia Pacific
4.4.1 Asia Pacific Semiconductor Materials for High Temperature Consumption by Region
4.4.2 China
4.4.3 Japan
4.4.4 South Korea
4.4.5 China Taiwan
4.4.6 Southeast Asia
4.4.7 India
4.4.8 Australia
4.5 Latin America
4.5.1 Latin America Semiconductor Materials for High Temperature Consumption by Country
4.5.2 Mexico
4.5.3 Brazil
5 Segment by Type
5.1 Global Semiconductor Materials for High Temperature Production Market Share by Type (2020-2025)
5.2 Global Semiconductor Materials for High Temperature Revenue Market Share by Type (2020-2025)
5.3 Global Semiconductor Materials for High Temperature Price by Type (2020-2025)
6 Segment by Application
6.1 Global Semiconductor Materials for High Temperature Production Market Share by Application (2020-2025)
6.2 Global Semiconductor Materials for High Temperature Revenue Market Share by Application (2020-2025)
6.3 Global Semiconductor Materials for High Temperature Price by Application (2020-2025)
7 Key Companies Profiled
7.1 Cree
7.1.1 Cree Semiconductor Materials for High Temperature Corporation Information
7.1.2 Cree Semiconductor Materials for High Temperature Product Portfolio
7.1.3 Cree Semiconductor Materials for High Temperature Production, Revenue, Price and Gross Margin (2020-2025)
7.1.4 Cree Main Business and Markets Served
7.1.5 Cree Recent Developments/Updates
7.2 Infineon Technologies
7.2.1 Infineon Technologies Semiconductor Materials for High Temperature Corporation Information
7.2.2 Infineon Technologies Semiconductor Materials for High Temperature Product Portfolio
7.2.3 Infineon Technologies Semiconductor Materials for High Temperature Production, Revenue, Price and Gross Margin (2020-2025)
7.2.4 Infineon Technologies Main Business and Markets Served
7.2.5 Infineon Technologies Recent Developments/Updates
7.3 Allegro Microsystems
7.3.1 Allegro Microsystems Semiconductor Materials for High Temperature Corporation Information
7.3.2 Allegro Microsystems Semiconductor Materials for High Temperature Product Portfolio
7.3.3 Allegro Microsystems Semiconductor Materials for High Temperature Production, Revenue, Price and Gross Margin (2020-2025)
7.3.4 Allegro Microsystems Main Business and Markets Served
7.3.5 Allegro Microsystems Recent Developments/Updates
7.4 Smart Modular Technologies
7.4.1 Smart Modular Technologies Semiconductor Materials for High Temperature Corporation Information
7.4.2 Smart Modular Technologies Semiconductor Materials for High Temperature Product Portfolio
7.4.3 Smart Modular Technologies Semiconductor Materials for High Temperature Production, Revenue, Price and Gross Margin (2020-2025)
7.4.4 Smart Modular Technologies Main Business and Markets Served
7.4.5 Smart Modular Technologies Recent Developments/Updates
7.5 Genesic Semiconductor
7.5.1 Genesic Semiconductor Semiconductor Materials for High Temperature Corporation Information
7.5.2 Genesic Semiconductor Semiconductor Materials for High Temperature Product Portfolio
7.5.3 Genesic Semiconductor Semiconductor Materials for High Temperature Production, Revenue, Price and Gross Margin (2020-2025)
7.5.4 Genesic Semiconductor Main Business and Markets Served
7.5.5 Genesic Semiconductor Recent Developments/Updates
7.6 The Dow Chemical
7.6.1 The Dow Chemical Semiconductor Materials for High Temperature Corporation Information
7.6.2 The Dow Chemical Semiconductor Materials for High Temperature Product Portfolio
7.6.3 The Dow Chemical Semiconductor Materials for High Temperature Production, Revenue, Price and Gross Margin (2020-2025)
7.6.4 The Dow Chemical Main Business and Markets Served
7.6.5 The Dow Chemical Recent Developments/Updates
7.7 United Silicon Carbide
7.7.1 United Silicon Carbide Semiconductor Materials for High Temperature Corporation Information
7.7.2 United Silicon Carbide Semiconductor Materials for High Temperature Product Portfolio
7.7.3 United Silicon Carbide Semiconductor Materials for High Temperature Production, Revenue, Price and Gross Margin (2020-2025)
7.7.4 United Silicon Carbide Main Business and Markets Served
7.7.5 United Silicon Carbide Recent Developments/Updates
8 Semiconductor Materials for High Temperature Manufacturing Cost Analysis
8.1 Semiconductor Materials for High Temperature Key Raw Materials Analysis
8.1.1 Key Raw Materials
8.1.2 Key Suppliers of Raw Materials
8.2 Proportion of Manufacturing Cost Structure
8.3 Manufacturing Process Analysis of Semiconductor Materials for High Temperature
8.4 Semiconductor Materials for High Temperature Industrial Chain Analysis
9 Marketing Channel, Distributors and Customers
9.1 Marketing Channel
9.2 Semiconductor Materials for High Temperature Distributors List
9.3 Semiconductor Materials for High Temperature Customers
10 Market Dynamics
10.1 Semiconductor Materials for High Temperature Industry Trends
10.2 Semiconductor Materials for High Temperature Market Drivers
10.3 Semiconductor Materials for High Temperature Market Challenges
10.4 Semiconductor Materials for High Temperature Market Restraints
11 Production and Supply Forecast
11.1 Global Forecasted Production of Semiconductor Materials for High Temperature by Region (2023-2032)
11.2 North America Semiconductor Materials for High Temperature Production, Revenue Forecast (2023-2032)
11.3 Europe Semiconductor Materials for High Temperature Production, Revenue Forecast (2023-2032)
11.4 China Semiconductor Materials for High Temperature Production, Revenue Forecast (2023-2032)
11.5 Japan Semiconductor Materials for High Temperature Production, Revenue Forecast (2023-2032)
11.6 South Korea Semiconductor Materials for High Temperature Production, Revenue Forecast (2023-2032)
12 Consumption and Demand Forecast
12.1 Global Forecasted Demand Analysis of Semiconductor Materials for High Temperature
12.2 North America Forecasted Consumption of Semiconductor Materials for High Temperature by Country
12.3 Europe Market Forecasted Consumption of Semiconductor Materials for High Temperature by Country
12.4 Asia Pacific Market Forecasted Consumption of Semiconductor Materials for High Temperature by Region
12.5 Latin America Forecasted Consumption of Semiconductor Materials for High Temperature by Country
13 Forecast by Type and by Application (2023-2032)
13.1 Global Production, Revenue and Price Forecast by Type (2023-2032)
13.1.1 Global Forecasted Production of Semiconductor Materials for High Temperature by Type (2023-2032)
13.1.2 Global Forecasted Revenue of Semiconductor Materials for High Temperature by Type (2023-2032)
13.1.3 Global Forecasted Price of Semiconductor Materials for High Temperature by Type (2023-2032)
13.2 Global Forecasted Consumption of Semiconductor Materials for High Temperature by Application (2023-2032)
13.2.1 Global Forecasted Production of Semiconductor Materials for High Temperature by Application (2023-2032)
13.2.2 Global Forecasted Revenue of Semiconductor Materials for High Temperature by Application (2023-2032)
13.2.3 Global Forecasted Price of Semiconductor Materials for High Temperature by Application (2023-2032)
14 Research Finding and Conclusion
15 Methodology and Data Source
15.1 Methodology/Research Approach
15.1.1 Research Programs/Design
15.1.2 Market Size Estimation
15.1.3 Market Breakdown and Data Triangulation
15.2 Data Source
15.2.1 Secondary Sources
15.2.2 Primary Sources
15.3 Author List
15.4 DisclaimerList of Tables
Table 1. Global Semiconductor Materials for High Temperature Market Size by Type (K Units) & (US$ Million) (2025 VS 2032)
Table 2. Global Semiconductor Materials for High Temperature Market Size by Application (K Units) & (US$ Million) (2025 VS 2032)
Table 3. Semiconductor Materials for High Temperature Market Size Comparison by Region: 2020 VS 2024 VS 2032
Table 4. Global Semiconductor Materials for High Temperature Production by Manufacturers (2020-2025) & (K Units)
Table 5. Global Semiconductor Materials for High Temperature Production (K Units) by Manufacturers (2020-2025)
Table 6. Global Semiconductor Materials for High Temperature Production Market Share by Manufacturers (2020-2025)
Table 7. Global Semiconductor Materials for High Temperature Revenue by Manufacturers (2020-2025) & (US$ Million)
Table 8. Global Semiconductor Materials for High Temperature Revenue Share by Manufacturers (2020-2025)
Table 9. Company Type (Tier 1, Tier 2 and Tier 3) & (based on the Revenue in Semiconductor Materials for High Temperature as of 2024)
Table 10. Global Market Semiconductor Materials for High Temperature Average Price (USD/Unit) of Key Manufacturers (2020-2025)
Table 11. Manufacturers Semiconductor Materials for High Temperature Production Sites and Area Served
Table 12. Manufacturers Semiconductor Materials for High Temperature Product Types
Table 13. Global Semiconductor Materials for High Temperature Manufacturers Market Concentration Ratio (CR5 and HHI)
Table 14. Mergers & Acquisitions, Expansion
Table 15. Global Semiconductor Materials for High Temperature Production (K Units) by Region (2020-2025)
Table 16. Global Semiconductor Materials for High Temperature Revenue (US$ Million) by Region (2020-2025)
Table 17. Global Semiconductor Materials for High Temperature Revenue Market Share by Region (2020-2025)
Table 18. Global Semiconductor Materials for High Temperature Production (K Units), Revenue (US$ Million), Price (USD/Unit) and Gross Margin (2020-2025)
Table 19. North America Semiconductor Materials for High Temperature Production (K Units), Revenue (US$ Million), Price (USD/Unit) and Gross Margin (2020-2025)
Table 20. Europe Semiconductor Materials for High Temperature Production (K Units), Revenue (US$ Million), Price (USD/Unit) and Gross Margin (2020-2025)
Table 21. China Semiconductor Materials for High Temperature Production (K Units), Revenue (US$ Million), Price (USD/Unit) and Gross Margin (2020-2025)
Table 22. Japan Semiconductor Materials for High Temperature Production (K Units), Revenue (US$ Million), Price (USD/Unit) and Gross Margin (2020-2025)
Table 23. South Korea Semiconductor Materials for High Temperature Production (K Units), Revenue (US$ Million), Price (USD/Unit) and Gross Margin (2020-2025)
Table 24. Global Semiconductor Materials for High Temperature Consumption Market by Region (2020-2025) & (K Units)
Table 25. Global Semiconductor Materials for High Temperature Consumption Market Share by Region (2020-2025)
Table 26. North America Semiconductor Materials for High Temperature Consumption by Country (2020-2025) & (K Units)
Table 27. Europe Semiconductor Materials for High Temperature Consumption by Country (2020-2025) & (K Units)
Table 28. Asia Pacific Semiconductor Materials for High Temperature Consumption by Region (2020-2025) & (K Units)
Table 29. Latin America Semiconductor Materials for High Temperature Consumption by Country (2020-2025) & (K Units)
Table 30. Global Semiconductor Materials for High Temperature Production (K Units) by Type (2020-2025)
Table 31. Global Semiconductor Materials for High Temperature Production Market Share by Type (2020-2025)
Table 32. Global Semiconductor Materials for High Temperature Revenue (US$ Million) by Type (2020-2025)
Table 33. Global Semiconductor Materials for High Temperature Revenue Share by Type (2020-2025)
Table 34. Global Semiconductor Materials for High Temperature Price (USD/Unit) by Type (2020-2025)
Table 35. Global Semiconductor Materials for High Temperature Production by Application (2020-2025) & (K Units)
Table 36. Global Semiconductor Materials for High Temperature Production Market Share by Application (2020-2025)
Table 37. Global Semiconductor Materials for High Temperature Revenue (US$ Million) by Application (2020-2025)
Table 38. Global Semiconductor Materials for High Temperature Revenue Share by Application (2020-2025)
Table 39. Global Semiconductor Materials for High Temperature Price (USD/Unit) by Application (2020-2025)
Table 40. Cree Semiconductor Materials for High Temperature Corporation Information
Table 41. Cree Specification and Application
Table 42. Cree Semiconductor Materials for High Temperature Production (K Units), Revenue (US$ Million), Price (USD/Unit) and Gross Margin (2020-2025)
Table 43. Cree Main Business and Markets Served
Table 44. Cree Recent Developments/Updates
Table 45. Infineon Technologies Semiconductor Materials for High Temperature Corporation Information
Table 46. Infineon Technologies Specification and Application
Table 47. Infineon Technologies Semiconductor Materials for High Temperature Production (K Units), Revenue (US$ Million), Price (USD/Unit) and Gross Margin (2020-2025)
Table 48. Infineon Technologies Main Business and Markets Served
Table 49. Infineon Technologies Recent Developments/Updates
Table 50. Allegro Microsystems Semiconductor Materials for High Temperature Corporation Information
Table 51. Allegro Microsystems Specification and Application
Table 52. Allegro Microsystems Semiconductor Materials for High Temperature Production (K Units), Revenue (US$ Million), Price (USD/Unit) and Gross Margin (2020-2025)
Table 53. Allegro Microsystems Main Business and Markets Served
Table 54. Allegro Microsystems Recent Developments/Updates
Table 55. Smart Modular Technologies Semiconductor Materials for High Temperature Corporation Information
Table 56. Smart Modular Technologies Specification and Application
Table 57. Smart Modular Technologies Semiconductor Materials for High Temperature Production (K Units), Revenue (US$ Million), Price (USD/Unit) and Gross Margin (2020-2025)
Table 58. Smart Modular Technologies Main Business and Markets Served
Table 59. Smart Modular Technologies Recent Developments/Updates
Table 60. Genesic Semiconductor Semiconductor Materials for High Temperature Corporation Information
Table 61. Genesic Semiconductor Specification and Application
Table 62. Genesic Semiconductor Semiconductor Materials for High Temperature Production (K Units), Revenue (US$ Million), Price (USD/Unit) and Gross Margin (2020-2025)
Table 63. Genesic Semiconductor Main Business and Markets Served
Table 64. Genesic Semiconductor Recent Developments/Updates
Table 65. The Dow Chemical Semiconductor Materials for High Temperature Corporation Information
Table 66. The Dow Chemical Specification and Application
Table 67. The Dow Chemical Semiconductor Materials for High Temperature Production (K Units), Revenue (US$ Million), Price (USD/Unit) and Gross Margin (2020-2025)
Table 68. The Dow Chemical Main Business and Markets Served
Table 69. The Dow Chemical Recent Developments/Updates
Table 70. United Silicon Carbide Semiconductor Materials for High Temperature Corporation Information
Table 71. United Silicon Carbide Specification and Application
Table 72. United Silicon Carbide Semiconductor Materials for High Temperature Production (K Units), Revenue (US$ Million), Price (USD/Unit) and Gross Margin (2020-2025)
Table 73. United Silicon Carbide Main Business and Markets Served
Table 74. United Silicon Carbide Recent Developments/Updates
Table 75. Production Base and Market Concentration Rate of Raw Material
Table 76. Key Suppliers of Raw Materials
Table 77. Semiconductor Materials for High Temperature Distributors List
Table 78. Semiconductor Materials for High Temperature Customers List
Table 79. Semiconductor Materials for High Temperature Market Trends
Table 80. Semiconductor Materials for High Temperature Market Drivers
Table 81. Semiconductor Materials for High Temperature Market Challenges
Table 82. Semiconductor Materials for High Temperature Market Restraints
Table 83. Global Semiconductor Materials for High Temperature Production (K Units) Forecast by Region (2023-2032)
Table 84. North America Semiconductor Materials for High Temperature Consumption Forecast by Country (2023-2032) & (K Units)
Table 85. Europe Semiconductor Materials for High Temperature Consumption Forecast by Country (2023-2032) & (K Units)
Table 86. Asia Pacific Semiconductor Materials for High Temperature Consumption Forecast by Region (2023-2032) & (K Units)
Table 87. Latin America Semiconductor Materials for High Temperature Consumption Forecast by Country (2023-2032) & (K Units)
Table 88. Global Semiconductor Materials for High Temperature Production Forecast by Type (2023-2032) & (K Units)
Table 89. Global Semiconductor Materials for High Temperature Revenue Forecast by Type (2023-2032) & (US$ Million)
Table 90. Global Semiconductor Materials for High Temperature Price Forecast by Type (2023-2032) & (USD/Unit)
Table 91. Global Semiconductor Materials for High Temperature Production Forecast by Application (2023-2032) & (K Units)
Table 92. Global Semiconductor Materials for High Temperature Revenue Forecast by Application (2023-2032) & (US$ Million)
Table 93. Global Semiconductor Materials for High Temperature Price Forecast by Application (2023-2032) & (USD/Unit)
Table 94. Research Programs/Design for This Report
Table 95. Key Data Information from Secondary Sources
Table 96. Key Data Information from Primary Sources
List of Figures
Figure 1. Product Picture of Semiconductor Materials for High Temperature
Figure 2. Global Semiconductor Materials for High Temperature Market Share by Type: 2025 VS 2032
Figure 3. Gallium Nitride Product Picture
Figure 4. Silicon Carbide Product Picture
Figure 5. Gallium Arsenide Product Picture
Figure 6. Diamond Product Picture
Figure 7. Global Semiconductor Materials for High Temperature Market Share by Application: 2025 VS 2032
Figure 8. Automotive
Figure 9. Consumer Electronics
Figure 10. Defense and Aerospace
Figure 11. Industrial and Medical
Figure 12. Other
Figure 13. Global Semiconductor Materials for High Temperature Revenue (US$ Million), 2020 VS 2024 VS 2032
Figure 14. Global Semiconductor Materials for High Temperature Revenue (US$ Million) (2026-2034)
Figure 15. Global Semiconductor Materials for High Temperature Production (K Units) & (2026-2034)
Figure 16. North America Semiconductor Materials for High Temperature Revenue (US$ Million) and Growth Rate (2026-2034)
Figure 17. Europe Semiconductor Materials for High Temperature Revenue (US$ Million) and Growth Rate (2026-2034)
Figure 18. China Semiconductor Materials for High Temperature Revenue (US$ Million) and Growth Rate (2026-2034)
Figure 19. Japan Semiconductor Materials for High Temperature Revenue (US$ Million) and Growth Rate (2026-2034)
Figure 20. South Korea Semiconductor Materials for High Temperature Revenue (US$ Million) and Growth Rate (2026-2034)
Figure 21. Semiconductor Materials for High Temperature Production Share by Manufacturers in 2024
Figure 22. Global Semiconductor Materials for High Temperature Revenue Share by Manufacturers in 2024
Figure 23. Semiconductor Materials for High Temperature Market Share by Company Type (Tier 1, Tier 2 and Tier 3): 2020 VS 2024
Figure 24. Global Market Semiconductor Materials for High Temperature Average Price (USD/Unit) of Key Manufacturers in 2024
Figure 25. The Global 5 and 10 Largest Players: Market Share by Semiconductor Materials for High Temperature Revenue in 2024
Figure 26. Global Semiconductor Materials for High Temperature Production Market Share by Region (2020-2025)
Figure 27. North America Semiconductor Materials for High Temperature Production (K Units) Growth Rate (2020-2025)
Figure 28. Europe Semiconductor Materials for High Temperature Production (K Units) Growth Rate (2020-2025)
Figure 29. China Semiconductor Materials for High Temperature Production (K Units) Growth Rate (2020-2025)
Figure 30. Japan Semiconductor Materials for High Temperature Production (K Units) Growth Rate (2020-2025)
Figure 31. South Korea Semiconductor Materials for High Temperature Production (K Units) Growth Rate (2020-2025)
Figure 32. Global Semiconductor Materials for High Temperature Consumption Market Share by Region (2020-2025)
Figure 33. North America Semiconductor Materials for High Temperature Consumption and Growth Rate (2020-2025) & (K Units)
Figure 34. North America Semiconductor Materials for High Temperature Consumption Market Share by Country in 2024
Figure 35. Canada Semiconductor Materials for High Temperature Consumption Growth Rate (2020-2025) & (K Units)
Figure 36. U.S. Semiconductor Materials for High Temperature Consumption Growth Rate (2020-2025) & (K Units)
Figure 37. Europe Semiconductor Materials for High Temperature Consumption Growth Rate (2020-2025) & (K Units)
Figure 38. Europe Semiconductor Materials for High Temperature Consumption Market Share by Country in 2024
Figure 39. Germany Semiconductor Materials for High Temperature Consumption and Growth Rate (2020-2025) & (K Units)
Figure 40. France Semiconductor Materials for High Temperature Consumption and Growth Rate (2020-2025) & (K Units)
Figure 41. U.K. Semiconductor Materials for High Temperature Consumption and Growth Rate (2020-2025) & (K Units)
Figure 42. Italy Semiconductor Materials for High Temperature Consumption and Growth Rate (2020-2025) & (K Units)
Figure 43. Russia Semiconductor Materials for High Temperature Consumption and Growth Rate (2020-2025) & (K Units)
Figure 44. Asia Pacific Semiconductor Materials for High Temperature Consumption and Growth Rate (2020-2025) & (K Units)
Figure 45. Asia Pacific Semiconductor Materials for High Temperature Consumption Market Share by Regions in 2024
Figure 46. China Semiconductor Materials for High Temperature Consumption and Growth Rate (2020-2025) & (K Units)
Figure 47. Japan Semiconductor Materials for High Temperature Consumption and Growth Rate (2020-2025) & (K Units)
Figure 48. South Korea Semiconductor Materials for High Temperature Consumption and Growth Rate (2020-2025) & (K Units)
Figure 49. China Taiwan Semiconductor Materials for High Temperature Consumption and Growth Rate (2020-2025) & (K Units)
Figure 50. Southeast Asia Semiconductor Materials for High Temperature Consumption and Growth Rate (2020-2025) & (K Units)
Figure 51. India Semiconductor Materials for High Temperature Consumption and Growth Rate (2020-2025) & (K Units)
Figure 52. Australia Semiconductor Materials for High Temperature Consumption and Growth Rate (2020-2025) & (K Units)
Figure 53. Latin America Semiconductor Materials for High Temperature Consumption and Growth Rate (2020-2025) & (K Units)
Figure 54. Latin America Semiconductor Materials for High Temperature Consumption Market Share by Country in 2024
Figure 55. Mexico Semiconductor Materials for High Temperature Consumption and Growth Rate (2020-2025) & (K Units)
Figure 56. Brazil Semiconductor Materials for High Temperature Consumption and Growth Rate (2020-2025) & (K Units)
Figure 57. Production Market Share of Semiconductor Materials for High Temperature by Type (2020-2025)
Figure 58. Production Market Share of Semiconductor Materials for High Temperature by Type in 2024
Figure 59. Revenue Share of Semiconductor Materials for High Temperature by Type (2020-2025)
Figure 60. Revenue Market Share of Semiconductor Materials for High Temperature by Type in 2024
Figure 61. Production Market Share of Semiconductor Materials for High Temperature by Application (2020-2025)
Figure 62. Production Market Share of Semiconductor Materials for High Temperature by Application in 2024
Figure 63. Revenue Share of Semiconductor Materials for High Temperature by Application (2020-2025)
Figure 64. Revenue Market Share of Semiconductor Materials for High Temperature by Application in 2024
Figure 65. Manufacturing Cost Structure of Semiconductor Materials for High Temperature
Figure 66. Manufacturing Process Analysis of Semiconductor Materials for High Temperature
Figure 67. Semiconductor Materials for High Temperature Industrial Chain Analysis
Figure 68. Channels of Distribution
Figure 69. Distributors Profiles
Figure 70. Global Semiconductor Materials for High Temperature Production Market Share Forecast by Region (2023-2032)
Figure 71. North America Semiconductor Materials for High Temperature Production (K Units) Growth Rate Forecast (2023-2032)
Figure 72. Europe Semiconductor Materials for High Temperature Production (K Units) Growth Rate Forecast (2023-2032)
Figure 73. China Semiconductor Materials for High Temperature Production (K Units) Growth Rate Forecast (2023-2032)
Figure 74. Japan Semiconductor Materials for High Temperature Production (K Units) Growth Rate Forecast (2023-2032)
Figure 75. South Korea Semiconductor Materials for High Temperature Production (K Units) Growth Rate Forecast (2023-2032)
Figure 76. Global Forecasted Demand Analysis of Semiconductor Materials for High Temperature (2026-2034) & (K Units)
Figure 77. Global Semiconductor Materials for High Temperature Production Market Share Forecast by Type (2023-2032)
Figure 78. Global Semiconductor Materials for High Temperature Revenue Market Share Forecast by Type (2023-2032)
Figure 79. Global Semiconductor Materials for High Temperature Production Market Share Forecast by Application (2023-2032)
Figure 80. Global Semiconductor Materials for High Temperature Revenue Market Share Forecast by Application (2023-2032)
Figure 81. Bottom-up and Top-down Approaches for This Report
Figure 82. Data Triangulation