MARKET INSIGHTS
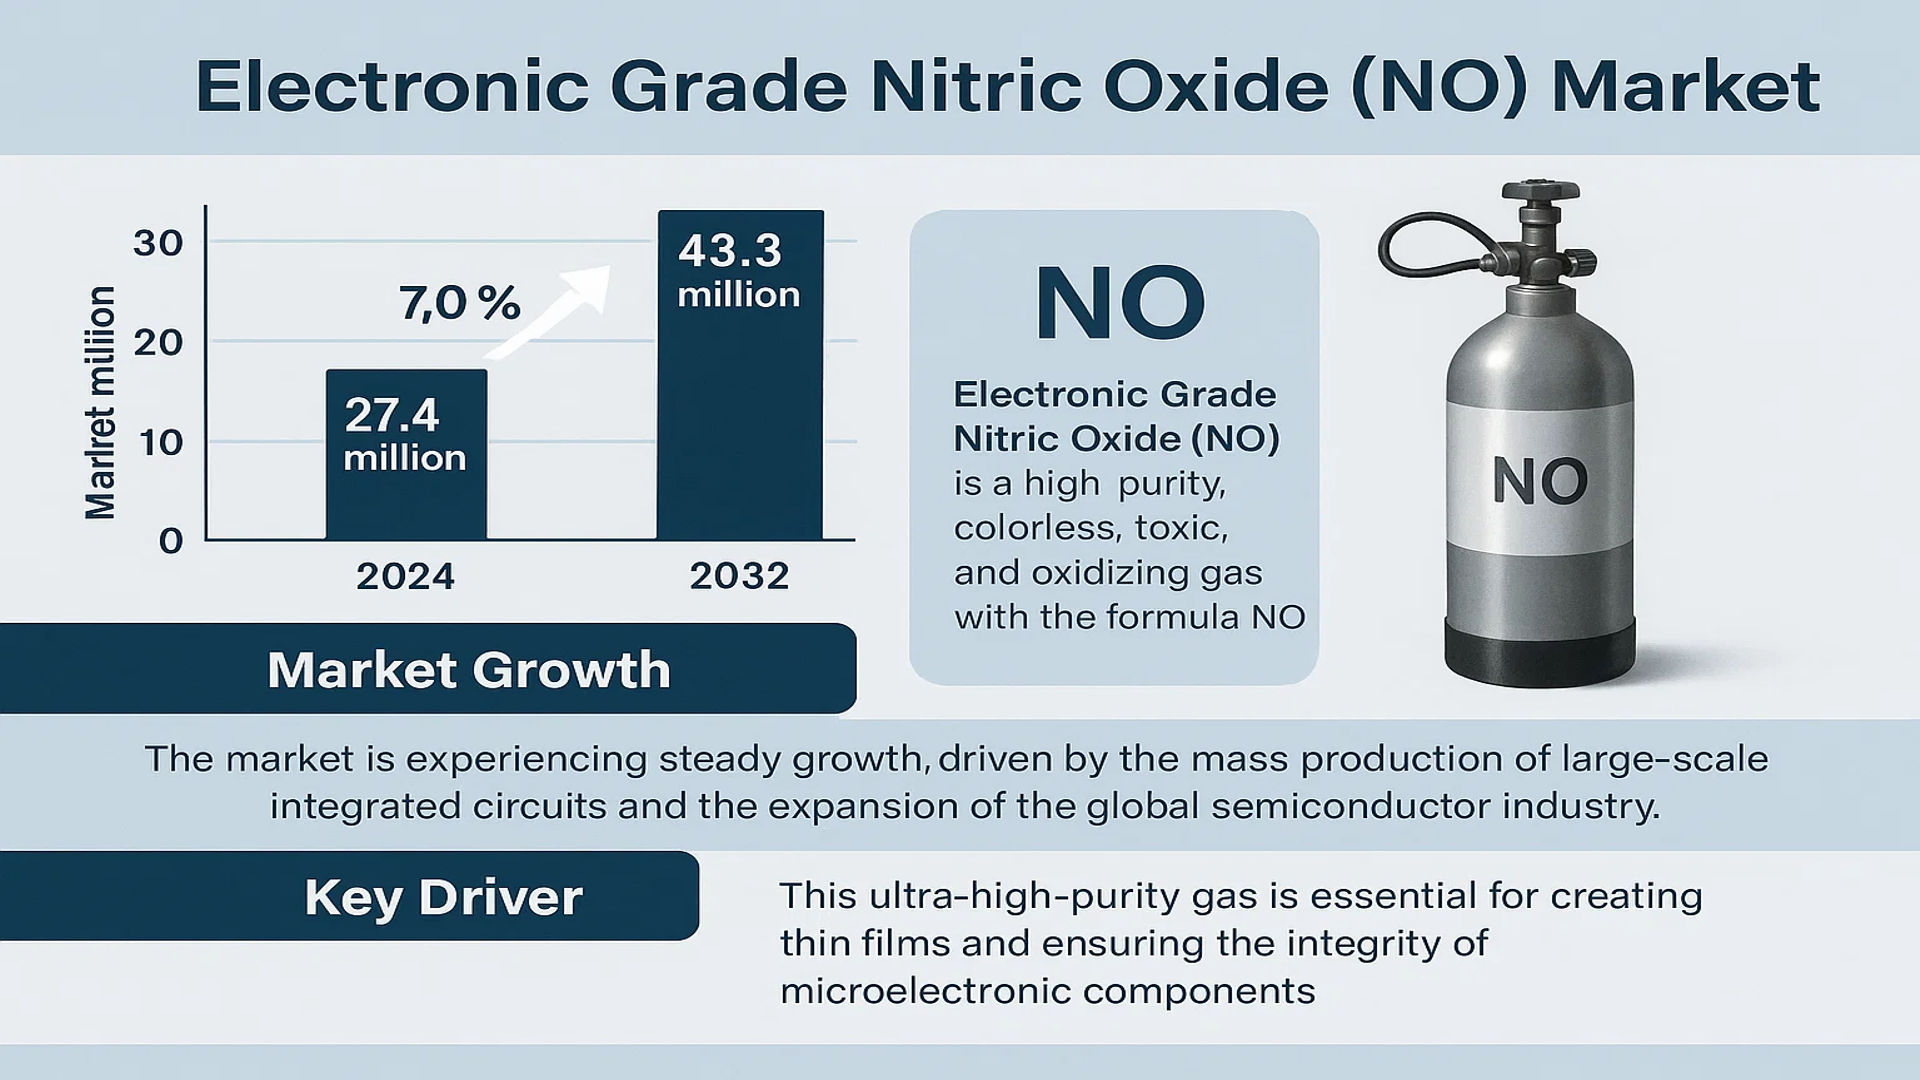
The global Electronic Grade Nitric Oxide (NO) Market was valued at 27.4 million in 2024 and is projected to reach US$ 43.3 million by 2032, at a CAGR of 7.0% during the forecast period.
Electronic Grade Nitric Oxide (NO) is a high-purity, colorless, toxic, and oxidizing gas with the formula NO. It is a critical specialty chemical used primarily in the semiconductor manufacturing industry for processes such as chemical vapor deposition (CVD) and chamber cleaning. This ultra-high-purity gas is essential for creating thin films and ensuring the integrity of microelectronic components.
The market is experiencing steady growth, driven by the mass production of large-scale integrated circuits and the expansion of the global semiconductor industry. Furthermore, advancements in communication technologies, including optical fiber, digital, and satellite communications, are fueling demand. The Asia-Pacific region, particularly China, is a major growth engine due to significant government investment in its domestic semiconductor sector. However, the market faces challenges, including the high technical barrier associated with gas purification to achieve the required purity levels (≥99.5% and ≥99.99%) and its highly concentrated, oligopolistic nature.
MARKET DYNAMICS
MARKET DRIVERS
Rapid Expansion of Semiconductor Manufacturing to Fuel Demand for Electronic Grade Nitric Oxide
The global semiconductor industry is experiencing unprecedented growth, driven by the proliferation of advanced electronics, IoT devices, and 5G infrastructure. Electronic grade nitric oxide plays a critical role in chemical vapor deposition processes essential for semiconductor fabrication. The semiconductor market is projected to reach over $1 trillion by 2030, creating substantial demand for high-purity specialty gases. This growth is particularly pronounced in Asia-Pacific, where semiconductor manufacturing capacity has increased by approximately 18% annually since 2020. The continuous miniaturization of semiconductor components requires increasingly sophisticated deposition processes, where nitric oxide’s properties enable precise thin-film formation at nanometer scales. This technological evolution directly correlates with the projected 7.0% CAGR for electronic grade nitric oxide through 2032.
Government Investments in Semiconductor Sovereignty to Accelerate Market Growth
National security concerns and supply chain vulnerabilities have prompted significant government initiatives worldwide to develop domestic semiconductor capabilities. The CHIPS and Science Act in the United States allocates approximately $52 billion for semiconductor research and manufacturing, while the European Chips Act commits over €43 billion toward semiconductor independence. These substantial investments are creating new manufacturing facilities that require electronic grade gases, including nitric oxide, for advanced chip production. China’s continued dominance in semiconductor expansion, with over 40 new fabrication facilities planned between 2024-2026, represents particularly strong growth potential. These government-backed initiatives ensure long-term demand stability for electronic grade nitric oxide as they focus on establishing complete domestic semiconductor ecosystems.
Advancements in Deposition Technologies to Drive Purity Requirements
Technological innovations in semiconductor manufacturing are continuously raising purity standards for process gases. The transition to 3nm and smaller process nodes requires electronic grade nitric oxide with impurity levels below 1 part per billion for critical applications. This evolution has created demand for higher purity grades, particularly the ≥99.99% purity segment which is growing approximately 30% faster than standard grades. Recent developments in atomic layer deposition and plasma-enhanced chemical vapor deposition techniques have further increased nitric oxide consumption per wafer by approximately 15-20% compared to traditional processes. These technical advancements are driving both volume growth and value expansion within the electronic grade nitric oxide market as manufacturers seek to meet increasingly stringent purity specifications.
MARKET RESTRAINTS
Stringent Purity Requirements and Technical Complexities to Limit Market Penetration
The production of electronic grade nitric oxide faces significant technical barriers due to extremely stringent purity requirements. Achieving and maintaining ≥99.99% purity necessitates sophisticated purification systems that can detect and remove impurities at parts-per-billion levels. The capital investment for such purification infrastructure typically exceeds $50 million for world-scale production facilities, creating substantial entry barriers. Additionally, maintaining purity throughout storage and delivery requires specialized equipment and handling protocols that add approximately 25-30% to total production costs. These technical challenges are particularly pronounced for new market entrants, as established players have developed proprietary purification technologies over decades. The complexity of ensuring consistent purity across production batches further constrains market expansion, especially in regions with less developed technical infrastructure.
Oligopolistic Market Structure to Constrain Competitive Development
The electronic grade nitric oxide market is characterized by high concentration among a few global players who control approximately 85% of production capacity. This oligopolistic structure creates significant barriers for new entrants and limits customer choice. The top three manufacturers maintain extensive patent portfolios covering purification methods and delivery systems, effectively preventing competition through intellectual property protection. Furthermore, long-term supply agreements between major gas producers and semiconductor manufacturers, often spanning 5-10 years, lock in market share and make it difficult for emerging companies to gain traction. This concentration of market power enables established players to maintain premium pricing, with electronic grade nitric oxide typically commanding 200-300% price premiums over industrial grade equivalents. The lack of competitive pressure reduces innovation incentives and slows technological advancement across the industry.
Logistical Challenges and Storage Limitations to Hinder Market Expansion
Electronic grade nitric oxide presents significant logistical challenges due to its highly toxic and reactive nature. Transportation requires specialized containment systems that maintain ultra-high purity while ensuring safety, adding approximately 15-20% to delivered costs. The gas rapidly degrades when exposed to moisture or oxygen, necessitating sophisticated on-site purification systems at semiconductor fabrication facilities. Storage limitations further complicate supply chain management, as nitric oxide cannot be stockpiled for extended periods without purity degradation. These logistical constraints particularly affect emerging semiconductor regions that lack established specialty gas infrastructure, creating additional barriers to market growth. The complexity of handling and storing electronic grade nitric oxide effectively limits its use to large-scale semiconductor manufacturers with sophisticated gas management capabilities.
MARKET CHALLENGES
High Production Costs and Capital Intensity to Challenge Market Accessibility
The electronic grade nitric oxide market faces significant economic challenges due to the substantial capital investment required for production facilities. Establishing a world-scale production plant requires approximately $100-150 million in initial investment, with purification systems accounting for nearly 60% of this cost. Operational expenses are further elevated by the need for continuous monitoring and maintenance of purity standards, adding approximately 35% to production costs compared to industrial grade equivalents. These high costs create particular challenges for price-sensitive markets and smaller semiconductor manufacturers who cannot achieve economies of scale. The capital-intensive nature of production also makes market entry difficult for new players, limiting competition and innovation. Furthermore, the need for ongoing research and development investment to meet evolving purity requirements adds additional financial pressure on manufacturers.
Other Challenges
Regulatory Compliance Burden
Stringent regulatory requirements governing toxic gas production and transportation create substantial compliance costs. Manufacturers must adhere to multiple international standards and regional regulations, requiring dedicated compliance teams and continuous monitoring systems. The certification process for electronic grade gases typically takes 18-24 months and costs approximately $2-3 million per production facility, creating significant barriers to market entry and expansion.
Technical Expertise Shortage
The specialized nature of electronic gas production has created a shortage of qualified technical professionals. The industry requires experts in gas purification, analytical chemistry, and semiconductor processes, with an estimated global shortage of approximately 3,000 qualified professionals. This skills gap particularly affects emerging semiconductor regions and slows technology transfer and market development.
MARKET OPPORTUNITIES
Emerging Applications in Advanced Semiconductor Technologies to Create New Growth Avenues
The development of next-generation semiconductor technologies is creating substantial opportunities for electronic grade nitric oxide expansion. The transition to three-dimensional chip architectures and advanced memory technologies requires novel deposition processes that utilize nitric oxide for selective oxidation and interface engineering. The emerging field of gallium nitride and silicon carbide semiconductors for power electronics represents particularly promising applications, with these markets growing at approximately 25% annually. Additionally, the development of quantum computing components and advanced sensor technologies requires ultra-pure nitric oxide for precise material synthesis. These technological advancements are expected to create new application segments that could account for approximately 20-25% of market growth through 2032. The diversification of semiconductor applications beyond traditional computing into automotive, medical, and communications fields further expands potential market opportunities.
Geographic Expansion of Semiconductor Manufacturing to Drive Regional Market Development
The global redistribution of semiconductor manufacturing capacity presents significant growth opportunities for electronic grade nitric oxide suppliers. While traditional manufacturing centers in Taiwan, South Korea, and China continue to expand, new regions are emerging as significant semiconductor hubs. The United States and European Union’s initiatives to rebuild domestic semiconductor capabilities are expected to create approximately 40 new fabrication facilities by 2030, requiring substantial electronic gas infrastructure. Southeast Asian countries, particularly Vietnam and Malaysia, are also attracting significant semiconductor investment, with projected capacity growth exceeding 30% annually. This geographic diversification reduces supply chain risks and creates opportunities for regional electronic grade nitric oxide production. Local content requirements in many of these new manufacturing regions further encourage domestic gas production, potentially reshaping the global market structure.
Technological Innovations in Purification and Delivery to Enable Market Expansion
Advances in purification technology and gas delivery systems are creating opportunities to reduce costs and expand market access. New membrane separation technologies and adsorption materials have improved purification efficiency by approximately 40% compared to traditional methods, potentially reducing production costs. Developments in on-site generation systems allow semiconductor manufacturers to produce electronic grade nitric oxide directly at fabrication facilities, eliminating transportation and storage challenges. These systems particularly benefit smaller manufacturers and emerging regions without established gas infrastructure. Additionally, digital monitoring and control systems enable real-time purity verification, reducing quality control costs and improving reliability. These technological innovations are lowering barriers to market entry and enabling more flexible supply models that can better serve the evolving needs of the semiconductor industry.
ELECTRONIC GRADE NITRIC OXIDE (NO) MARKET TRENDS
Semiconductor Industry Expansion Driving Market Growth
The global electronic grade nitric oxide market is experiencing robust growth primarily driven by the exponential expansion of the semiconductor industry. With the market valued at $27.4 million in 2024 and projected to reach $43.3 million by 2032, this represents a compound annual growth rate of 7.0% during the forecast period. This growth trajectory is fundamentally linked to the increasing demand for advanced semiconductor devices across multiple sectors including computing, telecommunications, and consumer electronics. The mass production and utilization of large-scale integrated circuits have created unprecedented demand for high-purity electronic gases, with nitric oxide playing a critical role in chemical vapor deposition processes. The semiconductor industry’s transition to smaller node sizes, particularly below 10 nanometers, has significantly increased the purity requirements for process gases, creating both opportunities and challenges for nitric oxide suppliers. Furthermore, the rise of emerging technologies such as 5G infrastructure, Internet of Things devices, and artificial intelligence computing has accelerated semiconductor production volumes, thereby driving consistent demand for electronic grade nitric oxide throughout the value chain.
Other Trends
Technological Advancements in Purification Processes
The electronic grade nitric oxide market is witnessing significant technological innovations in purification and quality control processes. As semiconductor manufacturing processes advance to more sophisticated nodes, the requirement for ultra-high purity gases has become increasingly stringent. Current industry standards demand purity levels exceeding 99.99%, with stringent limits on impurities such as moisture, oxygen, and metallic contaminants that can adversely affect semiconductor yield and performance. Manufacturers are investing heavily in advanced purification technologies including cryogenic distillation, membrane separation, and getter-based purification systems to meet these demanding specifications. The development of real-time monitoring and analytical techniques has enabled suppliers to maintain consistent quality levels, with some leading providers achieving impurity levels below 1 part per billion for critical contaminants. These technological advancements are essential for supporting the semiconductor industry’s continued progression toward smaller feature sizes and more complex device architectures.
Regional Market Dynamics and Supply Chain Evolution
The geographic distribution of electronic grade nitric oxide demand is undergoing significant transformation, largely influenced by semiconductor manufacturing capacity shifts and regional industrial policies. While the market remains global in nature, Asia-Pacific has emerged as the dominant consumption region, accounting for approximately 65% of global electronic grade nitric oxide demand, driven primarily by China’s massive semiconductor industry investments. The Chinese government’s substantial financial support for domestic semiconductor production, estimated at over $150 billion in recent initiatives, has positioned the country as the world’s fastest-growing market for electronic specialty gases. This regional concentration has prompted global suppliers to establish local production facilities and strengthen distribution networks within Asia. However, recent geopolitical developments and supply chain resilience concerns have also stimulated investment in semiconductor manufacturing capacity in other regions, including North America and Europe, which may alter future regional demand patterns. The market structure remains highly concentrated among a few specialized suppliers, creating an oligopolistic competitive environment where technological capability and supply reliability are critical success factors.
COMPETITIVE LANDSCAPE
Key Industry Players
Technological Purity and Global Supply Chain Capabilities Define Market Leadership
The global electronic grade nitric oxide market is characterized by a highly concentrated and oligopolistic structure, dominated by a few major industrial gas and specialty chemical companies that possess the advanced purification technologies required for semiconductor manufacturing. This market concentration is primarily due to the significant technical barriers associated with producing and handling ultra-high purity (UHP) nitric oxide, a highly toxic and reactive gas essential for advanced chemical vapor deposition (CVD) processes. Linde plc and Air Liquide collectively command a substantial portion of the global market share, leveraging their extensive gas production infrastructure, global distribution networks, and long-standing relationships with leading semiconductor fabrication plants (fabs). Their dominance is further solidified by continuous investment in purification technologies to meet the escalating purity demands, often exceeding 99.99%, required for next-generation chip manufacturing nodes.
Sumitomo Seika Chemicals Company holds a particularly strong position, especially within the Asia-Pacific region, which is the largest consumer market for electronic gases. The company’s expertise in nitrogen-based compounds and its strategic location in Japan, a key semiconductor equipment and materials hub, have been critical to its success. Similarly, Merck KGaA, through its performance materials division, is a formidable player, focusing on high-value specialty gases and investing heavily in R&D to develop advanced delivery systems that ensure gas integrity from production to point-of-use inside the cleanroom.
Meanwhile, Chinese players like Guangdong Huate Gas Co., Ltd. and Linggas Ltd. are rapidly expanding their capabilities, supported by strong domestic policy initiatives aimed at achieving self-sufficiency in the semiconductor supply chain. These companies are focusing on capturing market share in the burgeoning Chinese semiconductor industry, which is experiencing unprecedented growth due to massive government and private investment. Their growth strategy involves not only capacity expansion but also technological upgrades to meet the stringent purity specifications of international and domestic foundries.
The competitive dynamics are further influenced by strategic long-term supply agreements with major semiconductor manufacturers. These contracts often include stringent quality assurance protocols and just-in-time delivery requirements, favoring larger players with robust logistical and technical support capabilities. Furthermore, the industry is witnessing increased merger and acquisition activity as companies seek to bolster their electronic specialty gas portfolios and enhance their geographic footprint to serve global customers more effectively.
List of Key Electronic Grade Nitric Oxide (NO) Companies Profiled
- Linde plc (Ireland)
- Air Liquide S.A. (France)
- Sumitomo Seika Chemicals Company, Ltd. (Japan)
- Merck KGaA (Germany)
- Guangdong Huate Gas Co., Ltd. (China)
- Linggas Ltd. (China)
Segment Analysis:
By Type
≥99.99% Purity Segment Dominates the Market Due to Critical Semiconductor Fabrication Requirements
The market is segmented based on purity level into:
- ≥99.5% Purity
- ≥99.99% Purity
By Application
Chemical Vapor Deposition Process Segment Leads Due to its Fundamental Role in Thin Film Deposition
The market is segmented based on application into:
- Chemical Vapor Deposition Process
- Others
By End User
Semiconductor Fabrication Facilities Segment Dominates Due to High Consumption in Chip Manufacturing
The market is segmented based on end user into:
- Semiconductor Fabrication Facilities
- Electronic Gas Suppliers
- Research and Development Centers
By Region
Asia-Pacific Region Leads Due to Concentration of Semiconductor Manufacturing and Strong Government Support
The market is segmented based on region into:
- Asia-Pacific
- North America
- Europe
- Rest of the World
Regional Analysis: Electronic Grade Nitric Oxide (NO) Market
Asia-Pacific
The Asia-Pacific region is the undisputed leader in the global Electronic Grade Nitric Oxide market, driven overwhelmingly by the semiconductor manufacturing powerhouse of China. The Chinese government’s strategic focus and substantial investment in achieving semiconductor self-sufficiency, exemplified by initiatives like the National Integrated Circuit Industry Investment Fund (The Big Fund), have created an unprecedented demand for high-purity electronic specialty gases. This massive domestic production of advanced integrated circuits and memory chips necessitates vast quantities of nitric oxide, primarily for critical Chemical Vapor Deposition (CVD) processes in thin-film deposition. While China dominates volume consumption, other key markets like Japan, South Korea, and Taiwan also contribute significantly due to their established, technologically advanced semiconductor fabrication facilities. The region’s growth is further fueled by the expansion of data centers, 5G infrastructure, and consumer electronics production. However, a key challenge remains the intense competition on price and the gradual, yet increasing, demand for even higher purity grades beyond 99.99%, pushing local and international suppliers to enhance their purification technologies and on-site support capabilities.
North America
North America represents a mature yet steadily growing market characterized by high-value, innovation-driven demand. The region, particularly the United States, is home to leading-edge semiconductor R&D facilities and fabs operated by major global players, which require ultra-high-purity Electronic Grade Nitric Oxide for developing next-generation chips with smaller nodes (e.g., below 7nm). Stringent safety protocols and environmental regulations governing the handling and emissions of toxic gases like NO shape the market dynamics, favoring established global suppliers with robust safety records and compliance expertise. Demand is closely tied to domestic investments in semiconductor manufacturing, recently bolstered by legislation such as the CHIPS and Science Act, which aims to onshore production. The market is less sensitive to price and more focused on supply chain reliability, consistent ultra-high purity (often >99.999%), and comprehensive technical support services, including safe delivery and abatement systems.
Europe
The European market for Electronic Grade Nitric Oxide is defined by a strong emphasis on regulatory compliance, environmental sustainability, and technological innovation. Strict regulations under the EU’s REACH and Seveso III directives govern the production, handling, and transportation of hazardous substances, creating a high barrier to entry and ensuring that only suppliers with exemplary safety and environmental management systems can operate effectively. Demand is concentrated in technological hubs within Germany, France, and the Benelux countries, where it supports the automotive semiconductor, industrial electronics, and research sectors. The market’s growth is stable, driven by the region’s focus on quality and precision engineering rather than mass volume production. European semiconductor fabs often require customized gas formulations and stringent purity specifications, making the market a niche for suppliers who can offer tailored solutions and demonstrate full regulatory compliance.
South America
The South American market for Electronic Grade Nitric Oxide is nascent and relatively underdeveloped. Current demand is minimal and primarily serves limited industrial electronics manufacturing and research applications, rather than large-scale semiconductor fabrication. The region lacks a significant domestic semiconductor production ecosystem, which is the primary driver for NO consumption globally. Economic volatility and inconsistent industrial policy have historically deterred major investments in the high-tech sector necessary to create substantial demand. Any consumption is typically met through imports from global suppliers, often at a higher cost due to logistics complexities. While long-term potential exists if regional economic stability improves and attracts technology investments, the market currently presents more of a future opportunity than a current significant contributor to global volumes.
Middle East & Africa
Similar to South America, the Middle East and Africa region represents an emerging market with potential for long-term growth rather than immediate volume. Current demand is exceptionally limited and is primarily focused on research institutions and small-scale electronics assembly. However, the market’s future trajectory is notably different due to strategic economic diversification initiatives underway in several Gulf Cooperation Council (GCC) nations, such as Saudi Arabia and the UAE. These countries are actively investing in technology hubs and smart city projects, which could eventually lead to the development of downstream electronics manufacturing and, consequently, create a new market for electronic specialty gases. For now, the market remains in its infancy, with progress contingent on the successful execution of these long-term economic visions and the development of the necessary supporting industrial infrastructure.
Report Scope
This market research report provides a comprehensive analysis of the global Electronic Grade Nitric Oxide (NO) market, covering the forecast period 2025–2032. It offers detailed insights into market dynamics, technological advancements, competitive landscape, and key trends shaping the industry.
Key focus areas of the report include:
- Market Size & Forecast: Historical data and future projections for revenue, unit shipments, and market value across major regions and segments.
- Segmentation Analysis: Detailed breakdown by purity level (≥99.5% and ≥99.99%), application (Chemical Vapor Deposition Process and Others), and end-user industry to identify high-growth segments and investment opportunities.
- Regional Outlook: Insights into market performance across North America, Europe, Asia-Pacific, Latin America, and the Middle East & Africa, including country-level analysis where relevant.
- Competitive Landscape: Profiles of leading market participants, including their product offerings, R&D focus, manufacturing capacity, pricing strategies, and recent developments such as mergers, acquisitions, and partnerships.
- Technology Trends & Innovation: Assessment of emerging purification technologies, fabrication techniques, and evolving industry standards for ultra-high purity gases.
- Market Drivers & Restraints: Evaluation of factors driving market growth along with challenges, supply chain constraints, regulatory issues, and market-entry barriers.
- Stakeholder Analysis: Insights for gas suppliers, semiconductor manufacturers, equipment OEMs, investors, and policymakers regarding the evolving ecosystem and strategic opportunities.
Primary and secondary research methods are employed, including interviews with industry experts, data from verified sources, and real-time market intelligence to ensure the accuracy and reliability of the insights presented.
FREQUENTLY ASKED QUESTIONS:
What is the current market size of Global Electronic Grade Nitric Oxide (NO) Market?
->Electronic Grade Nitric Oxide (NO) Market was valued at 27.4 million in 2024 and is projected to reach US$ 43.3 million by 2032, at a CAGR of 7.0% during the forecast period.
Which key companies operate in Global Electronic Grade Nitric Oxide (NO) Market?
-> Key players include Sumitomo Seika Chemicals Company, Linde plc, Air Liquide, Merck KGaA, Guangdong Huate Gas, and Linggas Ltd., among others.
What are the key growth drivers?
-> Key growth drivers include expansion of semiconductor manufacturing, government investments in chip production, particularly in China, and increasing demand for advanced electronic components.
Which region dominates the market?
-> Asia-Pacific is the dominant and fastest-growing region, driven primarily by China’s substantial semiconductor industry investments, while North America and Europe maintain significant market shares.
What are the emerging trends?
-> Emerging trends include increasing purity requirements for electronic gases, development of advanced purification technologies, and growing demand for customized gas solutions in semiconductor manufacturing processes.

Get Sample Report PDF for Exclusive Insights
Report Sample Includes
- Table of Contents
- List of Tables & Figures
- Charts, Research Methodology, and more...
 Download Sample Report PDF