Key Statistics
Key Takeaways
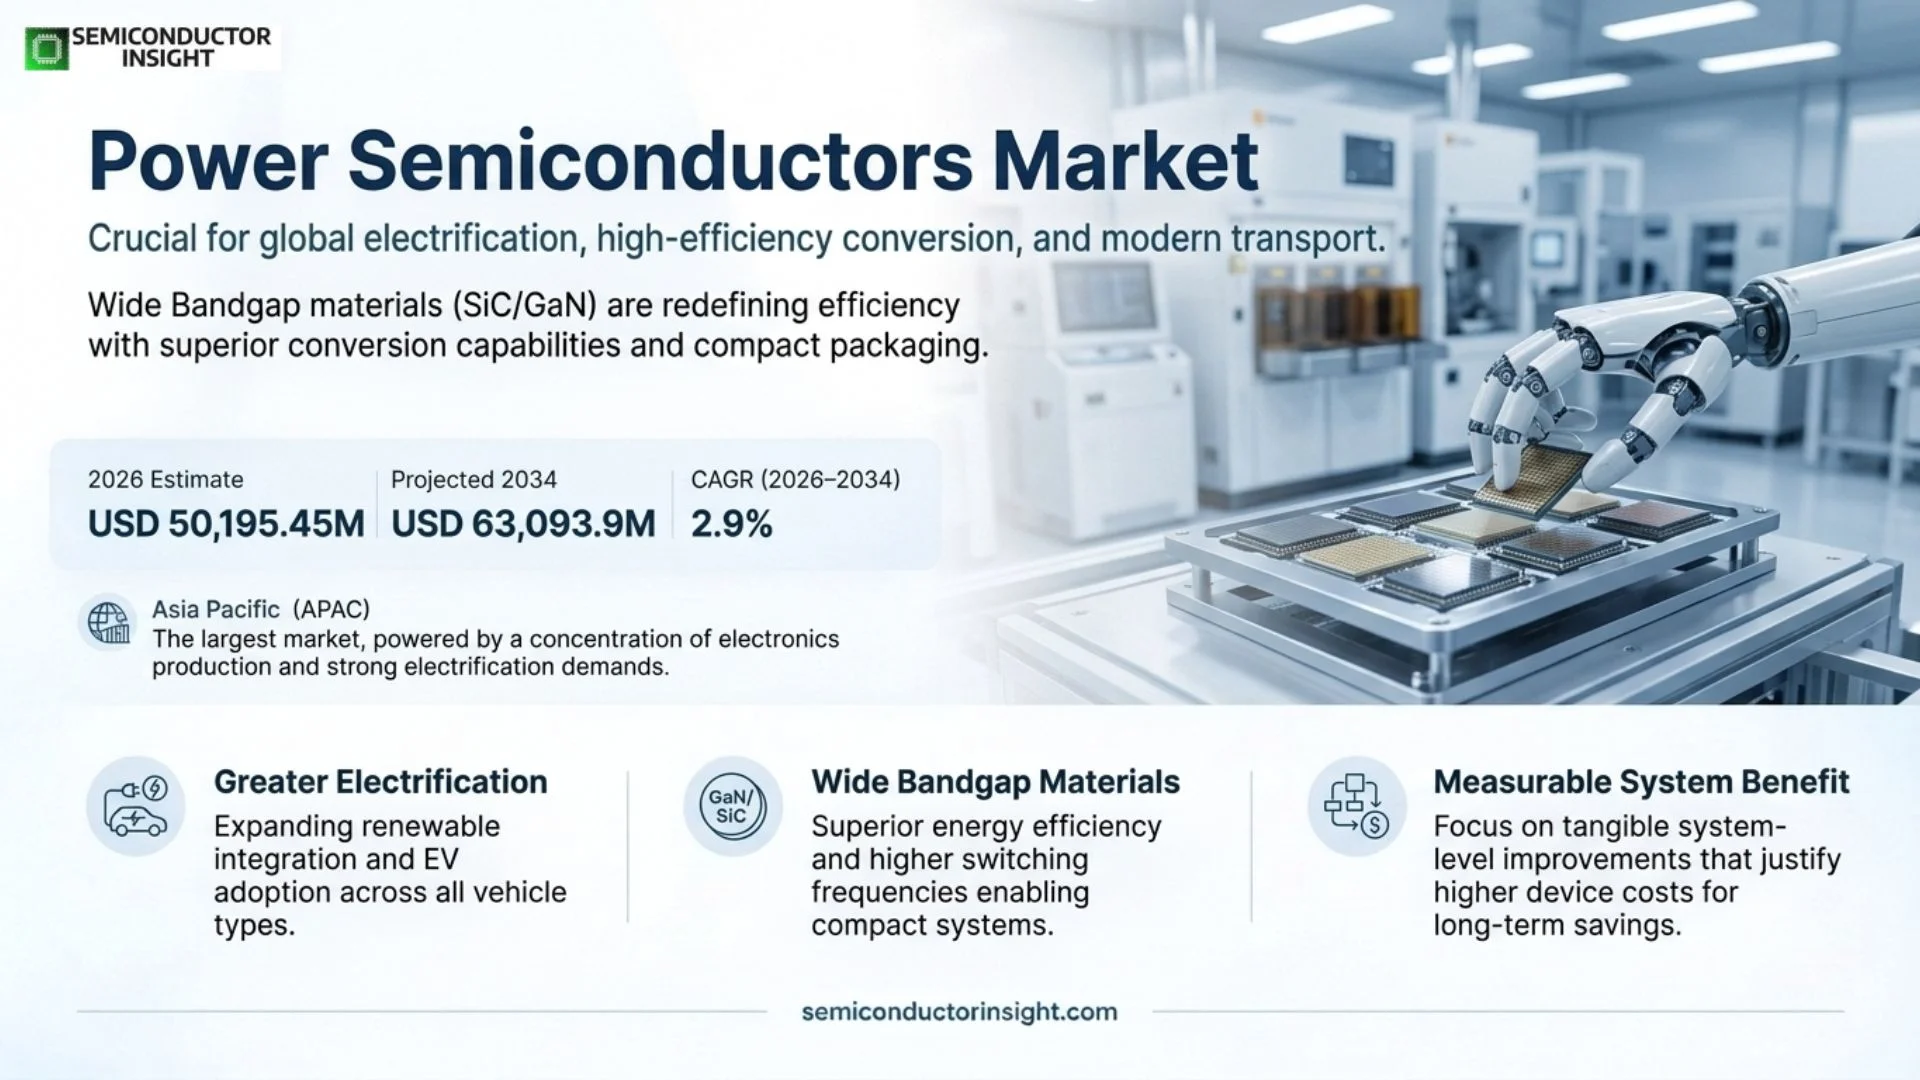
- The global Power Semiconductors market is estimated at USD 48,780.81 million in 2025 and USD 50,195.45 million in 2026, and is projected to reach USD 63,093.9 million by 2034, with a CAGR of 2.9% during 2026–2034.
- Silicon remains relevant across cost-sensitive and established designs, while silicon carbide and gallium nitride compete where efficiency, switching behaviour and system size justify their cost.
- Customers buy qualified electrical and thermal performance. A lower device price can be outweighed by cooling, passive-component or reliability costs elsewhere in the converter.
- Electric vehicles, renewable generation and data-center power systems create distinct demand pools with different qualification periods and operating requirements.
- Expansion of 200-millimeter SiC manufacturing offers a path to scale, but factory capacity and commercially usable, qualified output are different measures.
Power Semiconductors Market Overview
Power Semiconductors Market is estimated at USD 48,780.81 million in 2025 and USD 50,195.45 million in 2026, and is projected to reach USD 63,093.9 million by 2034, with a CAGR of 2.9% during 2026–2034. Asia Pacific is the largest market in this outlook, supported by the concentration of electronics production and electrification demand across the region.
Power semiconductors control and convert electrical energy in systems ranging from chargers to traction inverters and industrial drives. The device’s switching and conduction behaviour influences losses, cooling requirements and converter design. Buyers therefore evaluate the semiconductor within an electrical and thermal system. A component that improves efficiency can create value beyond its own selling price by reducing heat-management or passive-component requirements.
The market includes established silicon devices and wide-bandgap technologies that serve different performance and cost requirements. Silicon carbide can support demanding high-voltage conversion, while gallium nitride is attractive in selected fast-switching applications. These technologies do not replace every silicon device at the same rate. Commercial adoption depends on system design, available packaging, qualification evidence and the economics of the final product.
Segment Analysis: By Type
Diodes, switches, rectifiers and other devices perform distinct functions within a power-conversion circuit. Product selection depends on voltage, current, switching conditions and thermal requirements. The categories also require clear accounting boundaries because rectifiers and diodes can overlap in everyday terminology. Procurement comparisons should use the specified circuit function and product definition rather than adding loosely defined categories into an inflated market total.
| Type | Demand characteristics |
|---|---|
| Diodes | Unidirectional conduction supports freewheeling, protection and related functions. Reverse recovery, leakage and thermal behaviour affect converter losses. |
| Switches | MOSFET, IGBT and wide-bandgap switching devices control energy flow. Selection depends on operating voltage, switching frequency, drive requirements and reliability. |
| Rectifiers | Rectification products convert alternating input into a unidirectional output. Package and circuit-level definitions should avoid double-counting products also described as diodes. |
| Others | Additional power-control devices address specialised circuit functions, with application-specific electrical and qualification requirements. |
Segment Analysis: By Material
| Material | Commercial relevance |
|---|---|
| Silicon | Established manufacturing and broad product availability support economical solutions across many conversion requirements. |
| Silicon Carbide (SiC) | High-performance power conversion can justify the cost when device behaviour reduces system losses or thermal burden. |
| Gallium Nitride (GaN) | Fast-switching applications can benefit from compact converter designs when gate drive, layout and packaging are properly engineered. |
| Other semiconductor materials | Specialised technologies serve narrower functions and require application-specific assessment. |
Segment Analysis: By Packaging
| Packaging | Commercial relevance |
|---|---|
| Discrete Devices | Individual components allow flexible circuit design and sourcing, with board-level thermal and parasitic management. |
| Power Modules | Integrated power assemblies combine devices and interconnects to support higher-power system integration. |
| Integrated Power Solutions | Integration with drive or control functions can reduce design effort and improve repeatability in suitable applications. |
Segment Analysis: By Application
Automotive, consumer electronics, military and aerospace, wind and solar generation, and other applications have different purchasing triggers. A consumer charger may prioritise size and cost, while a traction or industrial system requires extensive reliability evidence. Suppliers need product families and support suited to each design cycle. Market growth therefore reflects changes in device content and technology mix as well as the number of end products shipped.
| Application | Demand characteristics |
|---|---|
| Automotive | Traction, charging and auxiliary conversion require qualified devices, predictable supply and integration with thermal and control systems. |
| Consumer Electronics | Chargers, adapters and appliance power stages balance efficiency, compactness and cost at high production volumes. |
| Military and Aerospace | Long service lives, traceability and demanding environmental requirements shape qualification and procurement. |
| Wind/Solar Power Generation | Inverters and conversion systems need efficient operation, reliability and serviceability under variable operating conditions. |
| Others | Industrial drives, data-center power and other conversion applications create diverse voltage, thermal and lifecycle requirements. |
Regional Analysis
Asia Pacific combines the largest electrification and electronics manufacturing base in this outlook with growing wide-bandgap production. Europe’s role is strongly linked to automotive and industrial design, while North America combines demanding power-system applications with changing end-market conditions. South America and the Middle East and Africa are more strongly influenced by renewable infrastructure, imported equipment and local assembly. Regional consumption should be distinguished from the origin of the semiconductor inside the finished system.
How do manufacturing location and end-system demand shape regional sales?
| Region | Position | Growth outlook | Demand profile | Access gate |
|---|---|---|---|---|
| Asia Pacific | Largest outlook | Electrification-led | EVs and electronics | Qualification and cost |
| Europe | Design-intensive | Application-led | Automotive and industry | Reliability evidence |
| North America | High-value applications | Mixed end markets | Vehicles and compute | Design-in timing |
| South America | Growing end demand | Project-sensitive | Transport and energy | Channels and service |
| Middle East & Africa | Project-led demand | Uneven deployment | Energy and data centers | Thermal reliability |
Competitive Landscape
Power-semiconductor competition is organised around applications and qualified product families rather than a single universal performance ranking. A supplier can be strong in industrial modules but less relevant to compact consumer adapters. Customers compare efficiency, reliability, packaging and design support under their actual operating conditions. Broad portfolios can simplify procurement, while specialised vendors can compete by solving a particular thermal or switching problem.
The covered supplier set includes Fuji Electric, Toshiba, Mitsubishi Electric, Littelfuse, Infineon, STMicroelectronics, Vishay, Semikron Danfoss, NXP, Renesas and onsemi. Their product scopes differ, and module businesses should be distinguished from discrete-device offerings. Infineon and Infineon Technologies identify the same company. Commercial comparisons should focus on verified application coverage rather than treating duplicate names as additional competitors.
Manufacturing investment can strengthen a supplier’s cost position, but capacity is valuable only when it delivers qualified devices at acceptable yield. Customers also consider supply continuity and the risk of changing a proven design. Technical support, reference designs and thermal modelling can therefore influence supplier selection before price negotiations begin. These capabilities help turn device performance into a customer’s manufacturable system.
Supplier roles and competitive positioning
| Participant group | Positioning |
|---|---|
| Broad power-device suppliers | Infineon, STMicroelectronics, onsemi, Toshiba and other diversified vendors compete across multiple electrical applications. |
| Modules and industrial integration | Fuji Electric, Mitsubishi Electric and Semikron Danfoss address power-system integration through relevant module and device portfolios. |
| Specialised and mixed-signal participants | Littelfuse, Vishay, NXP and Renesas have distinct product scopes that should be matched to the specific conversion requirement. |
Production Capacity Analysis
Power-device capacity depends on material, wafer diameter, process yield and packaging capability. Silicon, SiC and GaN cannot be treated as interchangeable production pools. Substrate quality and device qualification can constrain usable output even after factory construction is complete. Capacity analysis should therefore follow the specific product flow from material through fabrication, test and packaging, with attention to customer acceptance and utilisation.
Infineon’s Kulim opening and STMicroelectronics’ Catania plan show investment in 200-millimeter SiC production. The commercial objective is to improve scale and manufacturing economics, but larger wafers do not eliminate yield or demand risk. Suppliers must coordinate fabrication with module assembly and customer design schedules. A balanced expansion avoids creating expensive capacity that is mismatched with the timing of qualified programmes.
Market Dynamics
The market grows through greater electrification, more demanding conversion requirements and changes in material and packaging mix. These forces can support value growth even when individual end markets fluctuate. At the same time, price competition and manufacturing expansion can pressure margins. The relevant question is whether a device produces a measurable system benefit that customers will pay for across the product’s operating life.
Market Drivers
| Factor | Directional influence |
|---|---|
| Electrified transport | High positive |
| Renewable conversion | High positive |
| Data-center efficiency | Medium positive |
| Industrial lifecycle demand | Medium positive |
Electrified transport
Vehicle electrification creates requirements for traction inverters, charging and auxiliary conversion. Designers seek efficient devices that fit the vehicle’s voltage, cooling and reliability constraints. Suppliers respond with qualified discrete products and modules supported by application engineering. The market effect depends on platform design wins and production volumes, so electric-car sales alone do not determine the revenue available to each semiconductor technology.
Renewable conversion
Solar and wind systems need power electronics to convert and control variable electrical output. Device selection affects conversion losses, cooling and equipment reliability. Suppliers that support inverter designers with suitable packages and application guidance can capture value from renewable deployment. Orders follow the manufacture of electrical equipment and project schedules, creating a timing difference between policy targets and realised semiconductor demand.
Data-center efficiency
Computing infrastructure requires efficient conversion across multiple voltage levels while managing heat within constrained facilities. Power devices can help reduce losses and support denser electrical designs. Suppliers need to demonstrate benefits in the customer’s actual converter topology and operating range. This creates opportunities for high-performance products, but adoption still depends on qualification, system cost and dependable supply at scale.
Industrial lifecycle demand
Industrial drives and power supplies must operate reliably over long service periods. Customers value stable product availability, thermal performance and support for replacement designs. Suppliers can earn durable business by combining suitable devices with application knowledge and continuity commitments. The opportunity includes upgrades and redesigns of established equipment, where qualification costs may favour a proven platform over rapid technology substitution.
Market Restraints
| Factor | Directional influence |
|---|---|
| System cost trade-offs | High negative |
| Qualification and reliability | High negative |
| Capacity and demand mismatch | Medium negative |
System cost trade-offs
A technically superior device may not be economical in every converter. Customers compare the semiconductor premium with savings in cooling, passives, efficiency and assembly. If those benefits are small under the actual duty cycle, established silicon can remain preferable. This limits blanket assumptions about wide-bandgap substitution and makes system-level evidence essential to a successful commercial proposition.
Qualification and reliability
Changes in device material, package or manufacturing process can require extensive electrical and reliability work. Automotive and industrial customers may retain qualified designs for long periods. Suppliers therefore face a gap between introducing a new product and obtaining meaningful production revenue. Strong engineering support and controlled manufacturing changes can reduce friction, but they do not remove the customer’s validation obligations.
Capacity and demand mismatch
Fabrication investments are committed over long periods, while end-system demand and customer schedules can change quickly. Underutilised facilities increase cost pressure and can encourage aggressive pricing. Suppliers must coordinate expansion with credible design wins and packaging readiness. The commercial risk is particularly important when several manufacturers add capacity for the same material before the corresponding applications reach expected production levels.
Market Opportunities
Application-specific modules
Combining devices with suitable interconnects and thermal structures can simplify customer integration. Module suppliers can address the practical constraints of traction, industrial or renewable systems rather than selling semiconductor performance in isolation. The opportunity is strongest when the package reduces design effort or improves reliability. Customers still need clear qualification evidence and supply commitments for the complete assembly.
Efficient compact converters
Selected fast-switching applications can benefit from smaller passive components and reduced thermal burden. GaN and other suitable devices create opportunities when the complete converter is designed around their characteristics. Suppliers can support adoption through reference designs and layout guidance. The commercial value depends on achieving a practical system improvement without introducing unacceptable cost, electromagnetic or reliability trade-offs.
Manufacturing yield improvement
Better material quality, process control and test can increase the usable output of existing capacity. This offers an economic benefit without relying solely on new factory construction. Suppliers that improve yield can strengthen pricing flexibility and supply reliability. The opportunity spans substrates, fabrication and packaging, with the final benefit measured in qualified devices that meet customer specifications.
Design support and lifecycle services
Customers often need help selecting devices, managing thermal behaviour and qualifying a redesigned converter. Application engineering can reduce development effort and strengthen a supplier’s position before procurement begins. Long-term support also matters when products remain in service for many years. These services can improve retention and repeat design wins even in categories where component pricing is competitive.
Supply Chain Analysis
Substrates and materials
Material quality affects defect levels, process yield and the achievable performance of the finished device. Different semiconductor materials require different upstream capabilities. Manufacturers need reliable supply and consistent specifications to avoid disruption during qualification. The value of an upstream partner is therefore measured through usable production output and stability, rather than nominal wafer availability alone.
Wafer fabrication
Device fabrication translates material into structures with controlled electrical behaviour. Yield, process repeatability and equipment utilisation determine much of the production cost. Manufacturers must coordinate technology changes with customer qualification and test requirements. A larger factory creates commercial value only when it supports accepted products at sustainable operating efficiency, making process control central to capacity economics.
Packaging and test
Packaging controls electrical interconnects, thermal paths and mechanical reliability. Test verifies that devices meet the intended operating requirements. These stages can constrain output even when wafer supply is sufficient. Suppliers that integrate package design with device behaviour can help customers achieve better system performance, while disciplined quality control protects reliability and reduces the cost of field failures.
System integration and distribution
Devices reach end applications through equipment manufacturers, module integrators and distribution channels. Each route has different support and inventory requirements. Design-in work establishes the technical relationship, while supply execution sustains it through production and service. Vendors need to align product availability and change control with customer lifecycles, particularly where a replacement part cannot be introduced without renewed qualification.
Recent Developments
- 26 March 2025
IRENA reported 585 GW of renewable-capacity additions in 2024. The expansion supports the demand setting for power-conversion equipment, with semiconductor orders following inverter and system production. International Renewable Energy Agency - 8 August 2024
Infineon opened the first phase of its new 200-millimeter SiC fab in Kulim, creating a platform for increased qualified supply as production develops. Infineon Technologies - 31 May 2024
STMicroelectronics announced its integrated Catania SiC investment programme, linking substrates, device manufacturing and packaging within one planned campus. STMicroelectronics
Report Scope & Segmentation
| Attribute | Details |
|---|---|
| Base Year | 2025 |
| Estimated Year | 2026 |
| Forecast Period | 2026–2034 |
| 2025 Market Size | USD 48,780.81 million |
| 2026 Market Size | USD 50,195.45 million |
| 2034 Projected Size | USD 63,093.9 million |
| CAGR (2026–2034) | 2.9% |
| Unit | Revenue in USD million |
| Market boundary | Power-switching, rectification and related semiconductor devices; excludes complete vehicles, solar installations, battery systems and the value of finished power converters. |
| By Type | Diodes; Switches; Rectifiers; Others |
| By Application | Automotive; Consumer Electronics; Military and Aerospace; Wind/Solar Power Generation; Others |
| By Material | Silicon; Silicon Carbide (SiC); Gallium Nitride (GaN); Other semiconductor materials |
| By Packaging | Discrete Devices; Power Modules; Integrated Power Solutions |
| By Region | Asia Pacific; Europe; North America; South America; Middle East & Africa |
| Companies and organisations covered | Fuji Electric; Toshiba; Mitsubishi Electric; Littelfuse; Infineon Technologies; STMicroelectronics; Vishay; Semikron Danfoss; NXP Semiconductors; Renesas; onsemi |
Frequently Asked Questions
What is the market size and growth outlook?
The global Power Semiconductors market is estimated at USD 48,780.81 million in 2025 and USD 50,195.45 million in 2026, and is projected to reach USD 63,093.9 million by 2034, with a CAGR of 2.9% during 2026–2034.
What do power semiconductors do?
They switch, rectify and control electrical energy in converters, inverters, drives and power supplies. Their behaviour affects losses, cooling and system reliability.
Which product types are included?
The type categories are Diodes, Switches, Rectifiers and Others. Product accounting must distinguish overlapping terminology to avoid double-counting.
Which applications are covered?
Automotive, Consumer Electronics, Military and Aerospace, Wind/Solar Power Generation and Others are included. Industrial and data-center conversion sit within the broader application coverage.
Will SiC and GaN replace all silicon devices?
No. Material selection depends on voltage, switching conditions, system benefit, cost and qualification. Silicon remains suitable for many established and price-sensitive designs.
Which region leads the market?
Asia Pacific leads this outlook because of its electronics manufacturing scale and electrification demand. Its position reflects both component supply and the production of semiconductor-containing systems.
Why does packaging matter?
The package influences thermal paths, parasitic electrical behaviour and mechanical reliability. It can determine whether a device’s performance translates into a practical system benefit.
What does a new fab announcement mean?
It indicates planned or developing production capability. Qualified output also depends on process yield, packaging, customer acceptance and utilisation.
What is the main purchasing criterion?
Customers assess the complete converter’s performance, reliability and cost, rather than the semiconductor’s headline specification or unit price alone.
What are the principal risks?
Qualification delays, end-market fluctuations, manufacturing yield and capacity-demand mismatch can affect growth and supplier profitability.
Research Sources & Evidence Base
Get Sample Report PDF for Exclusive Insights
Report Sample Includes
- Table of Contents
- List of Tables & Figures
- Charts, Research Methodology, and more...
 Download Sample Report PDF