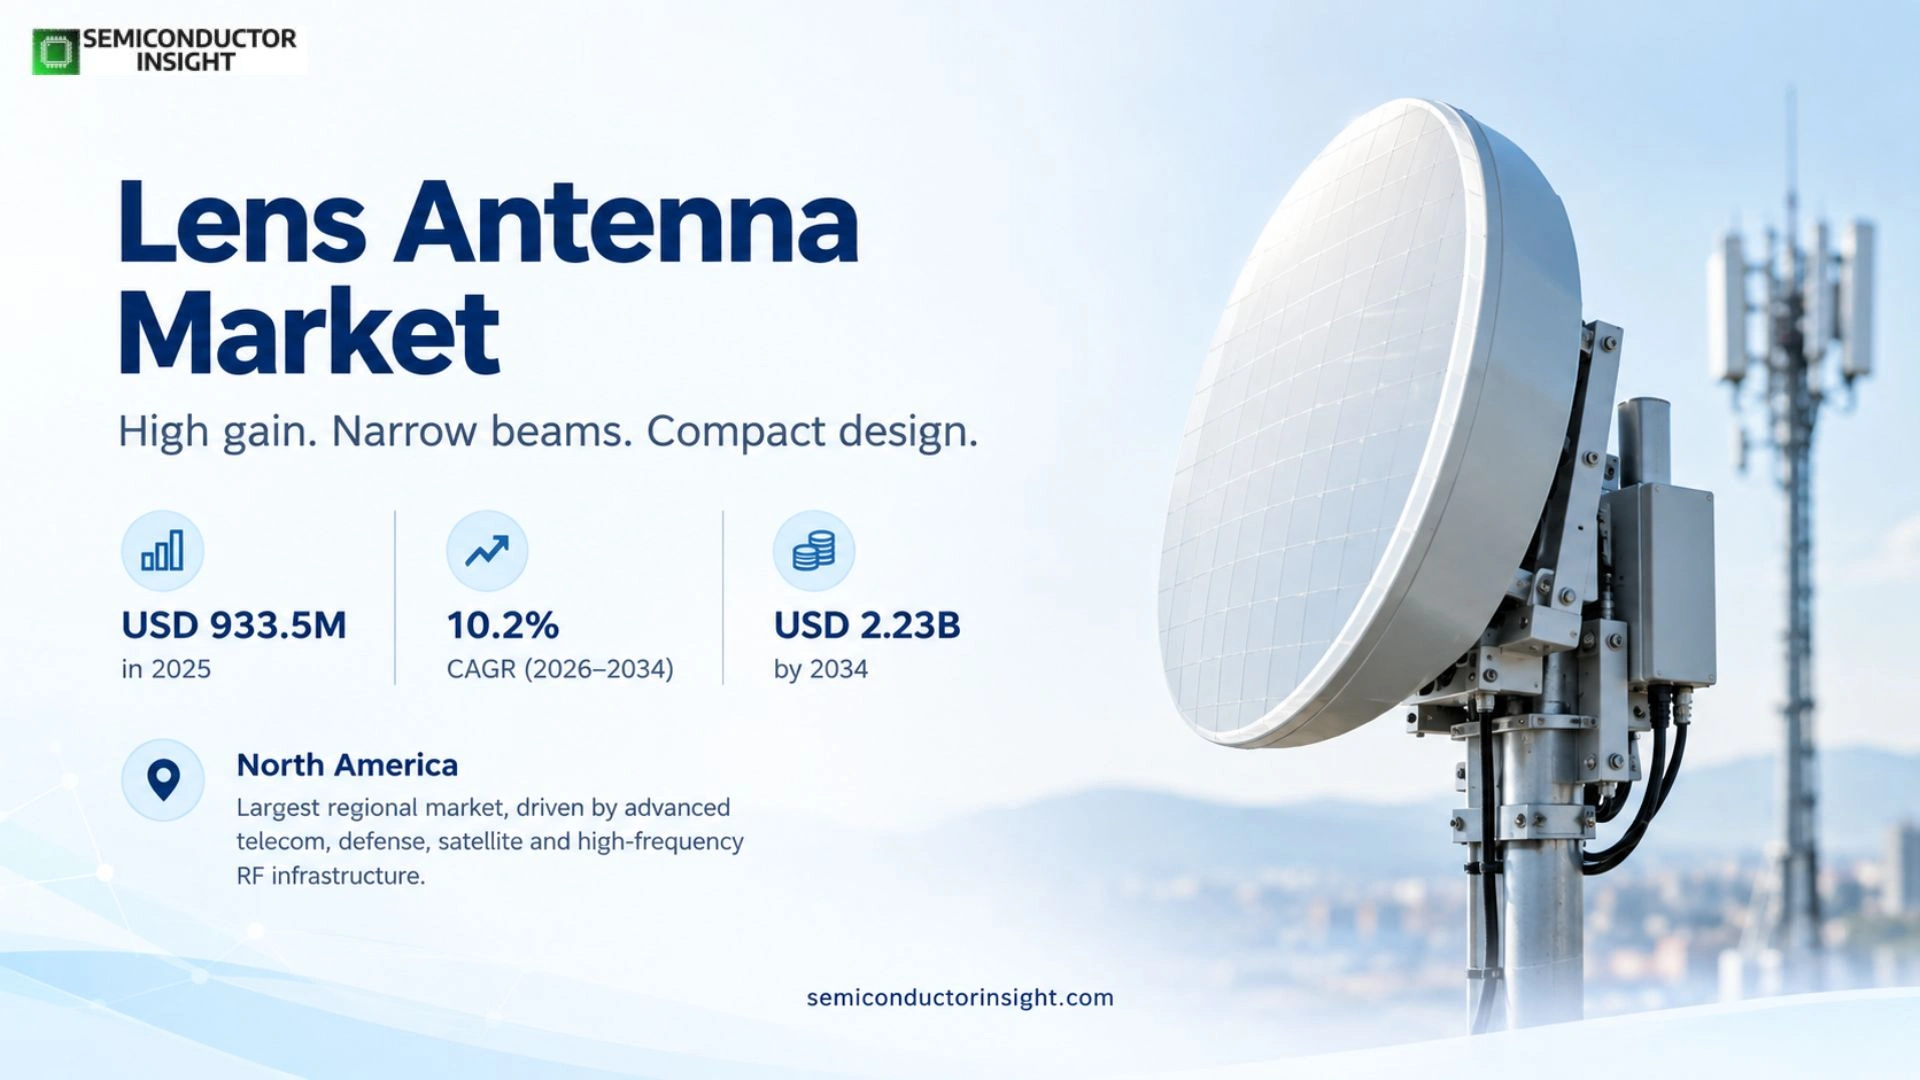
Global Lens Antenna Market Research Report 2026-2034

Lens Antenna market is projected to reach USD 2.23 billion by 2034, representing a 10.2% CAGR during 2026–2034. The 2026 estimated market size is USD 1.03 billion. North America is the largest current regional market, supported by advanced telecom, defense, satellite and high-frequency RF infrastructure.

PDF Icon Download Sample Report PDF
  • Quick Dispatch

    All Orders

  • Secure Payment

    100% Secure Payment

Price range: $1,500.00 through $4,250.00

Clear

Key Statistics

2025 Market Size
USD 933.5 million
2034 Projected Size
USD 2.23 billion
CAGR (2026–2034)
10.2%
Largest Market in 2025
North America

Key Takeaways

  • Horn lens antennas lead the product mix because they combine a directional feed with a dielectric lens to achieve high gain, controlled beamwidth and low sidelobes across microwave and millimeter-wave communication and measurement systems.
  • Telecom carriers are the leading application segment as 5G capacity, venue densification and high-frequency backhaul create demand for high-gain and multi-beam antenna systems with strong sector isolation.
  • North America is the largest current regional market through advanced telecom infrastructure, defense communications, satellite programs and commercial venue deployments, while Asia Pacific is the fastest-growing region.
  • Millimeter-wave is the strongest frequency-growth area. Current commercial lens products span Ka-, E-, W-, D- and G-band frequencies, extending lens antennas from 5G and radar into sub-THz test, sensing and next-generation communication.
  • Lens technology is broadening beyond cellular. MatSing introduced a large-format Luneburg lens for satellite, defense and radar in August 2026 and launched a high-capacity WiFi 6E lens antenna for stadium and arena deployments earlier in the year.

Lens Antenna Market Overview

Lens Antenna market is valued at USD 933.5 million in 2025 and is projected to reach USD 2.23 billion by 2034, representing a 10.2% CAGR during 2026–2034. The 2026 estimated market size is USD 1.03 billion. North America is the largest current regional market, supported by advanced telecom, defense, satellite and high-frequency RF infrastructure.

Base year: 2025 · Estimated year: 2026 · Forecast period: 2026–2034 · Historical data: 2020–2025 · Values in USD

Lens antennas use dielectric or engineered electromagnetic structures to refract and focus radio-frequency energy in a manner analogous to optical lenses. They can produce high gain and narrow beams without the mechanical depth of a large reflector and can support multiple feeds around a Luneburg or other lens to create several isolated beams from one aperture. This makes the architecture valuable where capacity, directivity and compact installation matter.

The market spans conventional horn-lens antennas, Luneburg lenses, plano-convex designs and newer metamaterial or additively manufactured structures. Product frequencies range from microwave through millimeter-wave and into sub-terahertz test bands. Eravant’s current catalog includes lens antennas from Ku-band through 220 GHz, illustrating how the technology serves both deployed communication systems and advanced laboratory, radar and measurement applications.

Commercial adoption depends on more than antenna gain. Operators evaluate beam isolation, sector count, mechanical size, weight, polarization, band coverage and installation complexity. In cellular and venue networks, a multi-beam lens can replace many conventional panel antennas and reduce infrastructure. In radar and satellite systems, wide-angle field of view, multi-beam operation and high-gain focusing create different value propositions.

Segment Analysis: By Type

By type, the market covers Horn Lens Antennas, Luneberg Lens Antennas, Plano-Convex Lens Antennas and Others. Horn lens antennas lead because they are widely used in high-frequency communications, measurement and radar where a waveguide or horn feed can be combined with a lens to improve aperture efficiency and beam control.

Type Technical characteristics Market position
Horn Lens Antennas A horn feed illuminates a dielectric lens that corrects phase across the aperture and concentrates RF energy. The architecture supports high gain, controlled sidelobes and predictable polarization across microwave and millimeter-wave bands. Commercial products are available from Ka-band through sub-THz frequencies. Leading type. Horn-lens products are established in point-to-point links, radar, test systems and satellite equipment because their geometry is well understood and can be customized across many frequency bands.
Luneberg Lens Antennas A Luneburg lens has a graded refractive-index profile that can focus waves from many directions onto the opposite surface. Multiple feeds placed around the lens can create independent beams without a conventional phased-array beamformer. A high-growth segment in multi-beam telecom, venue, satellite and radar applications. MatSing and Lunewave illustrate commercial use of Luneburg principles for cellular capacity and automotive sensing.
Plano-Convex Lens Antennas Plano-convex designs use one flat and one curved lens surface to focus RF energy from horn, waveguide or planar feeds. The form factor can support compact high-gain terminals and laboratory systems where mechanical integration is important. A specialized segment serving point-to-point, measurement, satellite and high-frequency systems where compact focal geometry is preferred.
Other Lens / Metasurface Designs This category includes shaped dielectric lenses, flat metamaterial lenses, transmit arrays and additive-manufactured electromagnetic structures. These designs aim to reduce weight, thickness or manufacturing cost while preserving beam control. An innovation segment. Adoption depends on proving low loss, bandwidth, environmental durability and repeatable manufacturing at the target operating frequency.

Frequency and end-user segmentation

The market also segments by frequency range and end user. Ku- and Ka-band remain important in satellite and point-to-point links, while millimeter-wave bands support 5G, automotive radar and high-capacity backhaul. Commercial users are the largest end-user group through telecom and venue networks, while defense and aerospace demand favors rugged, high-gain systems with secure communication and sensing requirements.

Axis Segments Commercial implication
By Frequency Range Ku-Band · Ka-Band · Millimeter Wave · Others Ku/Ka remain important in satellite and high-capacity links; millimeter-wave supports 5G, radar and short-range high-throughput systems; sub-THz designs expand into 6G research, imaging and measurement.
By End User Commercial · Defense & Aerospace · Industrial · Others Commercial demand is led by telecom carriers and venues. Defense and aerospace pay for wideband, high-gain and multi-beam performance, while industrial users adopt lens antennas for sensing, material inspection and specialized wireless links.

Segment Analysis: By Application

By application, Telecom Carriers lead the market, followed by governments, corporate organizations, satellite communication and other specialized uses. Telecom demand is driven by capacity expansion rather than simple coverage: multi-beam lens systems can create many isolated sectors from one installation point and improve spectrum reuse in high-traffic environments.

Application Demand characteristics
Telecom Carriers The leading application includes macro networks, stadiums, arenas, airports and high-density urban sites. Lens antennas can create multiple narrow beams with strong isolation and reduce the number of physical antennas needed for sectorization. MatSing systems support multi-band and multi-beam configurations for 4G, 5G and WiFi deployments.
Governments & Defense Defense users require secure communications, radar, spectrum monitoring and satellite links across difficult environments. Lens antennas offer high gain, wide angular coverage and multi-beam capability without the same electronic complexity as large phased arrays in selected applications.
Corporate Organizations / Venues Stadiums, campuses and large public venues need high-capacity wireless service with minimal visual and structural impact. Centralized overhead lens antennas can replace many under-seat or distributed antennas, simplifying maintenance and improving line-of-sight coverage.
Satellite Communication Satellite terminals and ground systems value wide-angle multi-beam coverage and high gain. Large-format Luneburg lenses can support simultaneous transmit and receive across multiple directions and frequencies, creating an alternative to mechanically steered dishes or electronically steered arrays.
Automotive / Industrial Automotive radar and industrial mmWave systems use lens structures to improve angular resolution, range and field of view. Lunewave’s current automotive radar platform operates at 76–81 GHz and targets long-range high-resolution sensing with wide coverage.

Lens Antenna Market Analysis

Regional Analysis

North America is the largest current Lens Antenna market because the region combines advanced telecom infrastructure, defense spending, satellite communication and a strong base of lens-antenna innovators. Asia Pacific is the fastest-growing region through 5G deployment, electronics manufacturing and domestic antenna suppliers. Europe is a high-value technology market for radar, aerospace and satellite applications.

How do regional lens-antenna demand patterns differ?

Regional demand reflects spectrum, telecom architecture and defense or space programs. North America leads current commercial and defense adoption, Asia Pacific combines rapidly growing mobile infrastructure with cost-competitive production, and Europe contributes sophisticated RF, automotive and satellite engineering. Emerging regions adopt lens systems where mobile coverage, venue capacity or satellite links justify higher antenna gain and sectorization.

Region Market position Growth outlook Demand profile What decides supplier selection
North America Largest current market High 5G, venues, defense & satellite Performance, certification and deployment economics
Asia Pacific Fastest-growing Very high 5G, telecom & manufacturing Cost, scale and multi-band support
Europe Technology-focused High Satellite, radar & automotive RF performance, standards and engineering support
South America Emerging Moderate Telecom & venues Cost and operator investment
Middle East & Africa Emerging Moderate to high Telecom, satellite & defense Coverage, heat tolerance and integration
North America LARGEST CURRENT MARKET

Why does North America lead lens-antenna adoption?

The United States combines large carrier networks, stadium and venue deployments, defense communications, radar programs and commercial satellite activity. MatSing, Millimeter Wave Products, Eravant and Lunewave contribute technology across multi-beam cellular, mmWave test, satellite and automotive radar. The region’s buyers are willing to pay for performance when lens systems reduce infrastructure or improve spectrum efficiency.

Market positionLargest
Growth outlookHigh
Demand profileTelecom, defense & satellite
Commercial gatePerformance and certification
Country / market Role in region Demand mechanism
United States Primary market 5G carriers, defense programs, venue networks, satellite operators and automotive-radar developers create broad lens-antenna demand.
Canada Telecom and aerospace niche Large geographic coverage and aerospace activity support high-gain antennas and specialized wireless links.
Mexico Telecom growth market Carrier upgrades and venue connectivity create downstream demand through global antenna suppliers.

Market instances

  • MatSing launched a WiFi 6E multi-beam lens antenna in February 2026. The product targets stadiums and arenas where centralized high-capacity coverage can reduce access-point count.
  • MatSing introduced large-format Luneburg manufacturing in August 2026. The platform targets satellite, defense, radar and ultra-wideband applications.
  • Eravant maintains a broad lens-antenna catalog extending to 220 GHz. Its current portfolio shows commercial availability across Ka-, E-, W-, D- and G-band frequency ranges.
In the full report: country-level market sizing, segment revenue, supplier positioning and forecast detail for this geography.
Asia Pacific FASTEST-GROWING REGION

What drives Asia Pacific lens-antenna growth?

The region combines aggressive 5G and broadband deployment with large electronics manufacturing and growing defense and satellite programs. China is an important production center, Japan contributes precision RF engineering, South Korea has advanced mobile networks and India is expanding telecom and space infrastructure. Cost-competitive manufacturing helps widen commercial adoption beyond premium defense systems.

Market positionFastest-growing
Growth outlookVery high
Demand profile5G & telecom
Commercial gateCost and multi-band capability
Country / market Role in region Demand mechanism
China Production and telecom scale Domestic antenna suppliers and large network deployments create strong commercial demand and manufacturing volume.
Japan Precision RF technology High-frequency test, satellite and electronics applications support specialized lens antennas.
South Korea Advanced mobile infrastructure Dense 5G networks create demand for high-capacity and high-frequency antenna solutions.
India Telecom and space growth 5G rollout, satellite programs and smart-city infrastructure expand the long-term addressable market.

Market instances

  • Regional 5G networks need capacity as well as coverage. Multi-beam lenses can create several isolated sectors from one site and improve frequency reuse.
  • Manufacturing scale supports lower system cost. Chinese suppliers compete strongly in commercial telecom applications where price and production speed matter.
  • Satellite and defense investment expands the market beyond cellular. High-gain wide-angle lens systems can serve tracking, ground-terminal and radar applications.
In the full report: country-level market sizing, segment revenue, supplier positioning and forecast detail for this geography.
Europe

What differentiates the European lens-antenna market?

Europe has a strong RF engineering, satellite, automotive and defense base. Anteral in Spain and Flann Microwave in the United Kingdom illustrate specialized suppliers, while Germany and France support automotive radar and aerospace applications. Buyers emphasize measurement quality, standard compliance and custom engineering for high-value programs rather than the largest manufacturing volumes.

Market positionTechnology-focused
Growth outlookHigh
Demand profileSatellite, radar & auto
Commercial gateRF precision and standards
Country / market Role in region Demand mechanism
Spain Specialized antenna engineering Anteral supplies lens horn antennas, focusing lenses and aerospace RF solutions from microwave through mmWave bands.
United Kingdom Microwave and measurement expertise Flann Microwave and related engineering ecosystems serve radar, test and communications applications.
Germany / France Automotive and aerospace demand Radar, satellite and smart-infrastructure programs create high-value customized demand.

Market instances

  • Anteral’s current product range includes lens horn, focusing lens horn and high-gain lens horn antennas. The portfolio extends from C-band to THz-oriented RF applications.
  • A May 2026 Anteral Ka-band lens-horn data sheet specifies 26.5–40 GHz operation and 30 dBi directivity. This illustrates commercially engineered lens products for high-frequency links.
  • European space and radar programs favor custom RF design. Lower unit volume can still support premium antenna engineering and qualification.
In the full report: country-level market sizing, segment revenue, supplier positioning and forecast detail for this geography.
South America

How does South American demand develop?

South America remains an emerging market dominated by telecom coverage, fixed wireless and venue connectivity. Brazil is the largest opportunity because it has the deepest mobile network and large public venues. Lens antennas can be attractive when one multi-beam installation replaces several conventional sectors, but operator capital budgets and import cost influence adoption.

Market positionEmerging
Growth outlookModerate
Demand profileTelecom & venues
Commercial gateDeployment economics
Country / market Role in region Demand mechanism
Brazil Largest regional market Dense cities, stadiums and 5G deployment create the strongest regional lens-antenna opportunity.
Chile Telecom and satellite niche Mining, remote connectivity and mobile infrastructure create selective high-gain antenna demand.
Argentina Selective telecom demand Operator upgrades and industrial links create smaller addressable demand.

Market instances

  • Venue networks are a natural use case. A smaller number of overhead multi-beam antennas can simplify maintenance compared with dense distributed antenna installations.
  • Fixed wireless can benefit from high-gain directional links. Lens antennas improve link margin where fiber deployment is difficult.
  • Import economics matter. Commercial adoption is strongest when infrastructure savings offset higher specialized-antenna cost.
In the full report: country-level market sizing, segment revenue, supplier positioning and forecast detail for this geography.
Middle East & Africa

What supports lens-antenna growth in the Middle East and Africa?

The region combines fast telecom investment in Gulf markets with satellite, defense and remote-connectivity requirements across a wide geography. High-gain antennas are valuable where long links or sparse infrastructure increase the importance of link margin. Heat, dust and installation access also influence mechanical design and maintenance strategy.

Market positionEmerging
Growth outlookModerate to high
Demand profileTelecom, satellite & defense
Commercial gateCoverage and environmental reliability
Country / market Role in region Demand mechanism
Saudi Arabia 5G and smart-city growth Large digital-infrastructure projects create demand for high-capacity wireless and satellite systems.
UAE Satellite and telecom hub Advanced mobile networks, aerospace and defense programs support high-value lens-antenna demand.
South Africa Regional telecom base Mobile operators and industrial networks create the strongest sub-Saharan commercial opportunity.

Market instances

  • High-gain beams can extend coverage in sparse networks. Lens antennas improve link budget without requiring very large reflector structures.
  • Satellite connectivity is strategically important in remote areas. Wide-angle multi-beam lenses can support tracking and multiple simultaneous links.
  • Environmental engineering matters. Radomes, materials and mechanical supports need to tolerate heat, dust and wind loading.
In the full report: country-level market sizing, segment revenue, supplier positioning and forecast detail for this geography.

Competitive Landscape

Key participants include Millimeter Wave Products, MatSing, Tongyu Communication, Vector Telecom Solutions, Flann Microwave, KEYCOM, Anteral, Eravant and Lunewave. The market is moderately competitive and highly application-specific: some suppliers focus on telecom multi-beam lenses, others on laboratory and waveguide products, and others on automotive radar or satellite systems.

MatSing differentiates through multi-beam Luneburg lens systems for cellular, WiFi, venues and satellite applications. Its lens technology supports up to 48 beams per antenna and up to three bands simultaneously. The company is expanding the platform into WiFi 6E and large-format satellite lenses, demonstrating how a core lens architecture can serve several communication markets.

Eravant competes through breadth in microwave and millimeter-wave lens products. Its current catalog contains more than 50 lens antennas and includes Gaussian-optics, spot-focusing and lens-corrected designs across frequencies up to 220 GHz. This makes the company important in R&D, measurement, radar and emerging sub-THz applications.

Lunewave uses additively manufactured Luneburg lenses in automotive radar and RF sensing. Its current automotive system targets 76–81 GHz, wide field of view and long detection range, while its custom lens business extends into satellite communication and 5G. Anteral and Flann Microwave compete through specialized European RF engineering and custom lens-horn products.

Competitive tier structure

Tier Companies Basis of competition
Multi-beam telecom leaders MatSing; Tongyu Communication; Vector Telecom Solutions High-capacity cellular, venue, multi-sector and multi-band lens antenna systems
High-frequency RF specialists Millimeter Wave Products; Eravant; Flann Microwave; Anteral; KEYCOM Waveguide, lens-horn, Gaussian, measurement, satellite and mmWave products
Automotive / emerging innovators Lunewave 3D-printed Luneburg lens radar, automotive sensing and broadband RF applications

Key companies profiled in the report scope

  • Millimeter Wave Products Inc.
  • MatSing
  • Tongyu Communication Inc.
  • Vector Telecom Solutions
  • Flann Microwave
  • KEYCOM Corporation
  • Anteral
  • Eravant
  • Lunewave Inc.

Lens Antenna Production & RF Qualification Analysis

Lens-antenna capacity is determined by dielectric material availability, machining or additive manufacturing, feed-array production, RF calibration and final antenna test. Large telecom lenses and compact mmWave products require different production equipment, so nominal factory volume cannot be compared directly across suppliers. High-frequency products also need precision test chambers and calibrated measurement systems.

Dielectric control is central to performance. A lens relies on refractive index, material loss and geometric accuracy to create the intended phase distribution. Small material or dimensional errors can shift beam shape and gain, especially at millimeter-wave frequencies where wavelength is only a few millimeters. Suppliers therefore need tight material characterization and production repeatability.

Multi-beam telecom products add another capacity layer because each feed, polarization and band must be aligned and tested. Additive manufacturing can reduce tooling for complex Luneburg structures and enable custom geometries, but material repeatability and surface finish must support RF performance. Final capacity is therefore a combination of mechanical manufacturing and RF test throughput.

Market Dynamics

Growth is driven by 5G capacity, satellite communication, mmWave radar, venue connectivity and emerging sub-THz systems. Restraints include manufacturing cost, integration complexity, specialized dielectric supply and standardization gaps. Opportunities center on large-format Luneburg lenses, WiFi multi-beam systems, automotive radar, flat metamaterial lenses and 6G/sub-THz research.

MARKET DRIVERS

Drivers Impact Analysis*

Factor Forecast impact* Geographic relevance Impact timeline
5G and high-density network capacity High North America, Asia Pacific Short to medium term
Satellite and defense communication High North America, Europe, Middle East Medium to long term
Automotive mmWave radar Medium to high North America, Europe, Asia Medium term
6G / sub-THz research Medium Global R&D centers Long term

*Directional analytical rating; it is not a measured contribution to the headline CAGR.

5G networks need more spatial reuse

Mobile data growth is pushing operators to divide high-traffic areas into more sectors. Multi-beam lens antennas can create many narrow, isolated beams from one physical aperture, improving frequency reuse and capacity without installing a separate panel for every sector.

Satellite systems value wide-angle multi-beam coverage

Luneburg lenses can transmit and receive over many directions without mechanically steering a large reflector. Large-format manufacturing extends this principle into satellite tracking, defense and broadband terminals where simultaneous beams can simplify network architecture.

Automotive radar needs angular resolution

ADAS and autonomous systems need to detect objects accurately in rain, fog and darkness. Lens-based radar can provide high gain and wide field of view with fewer antenna elements. Additive manufacturing improves the economics of complex Luneburg geometries for vehicle-scale sensors.

Higher frequencies increase the value of precise focusing

At mmWave and sub-THz frequencies, antenna apertures can be physically small while delivering high gain. Lens structures are therefore attractive in 60 GHz, E-band, W-band and higher-frequency measurement and communications, where conventional low-gain antennas cannot support the link budget.

MARKET RESTRAINTS

Restraints Impact Analysis*

Factor Forecast impact* Geographic relevance Impact timeline
Precision manufacturing cost High High-frequency products Persistent
Network integration complexity Medium to high Telecom carriers Short to medium term
Specialized dielectric materials Medium Global supply chain Persistent
Standardization and certification Medium New applications Medium term

*Directional analytical rating; it is not a measured contribution to the headline CAGR.

Lens geometry and materials require precision

A lens must maintain accurate shape and dielectric properties across the aperture. At high frequency, small variations can create phase error, sidelobes or loss. Precision machining, molding or additive manufacturing can therefore cost more than simpler antennas.

Telecom integration can be complex

Multi-beam lens antennas change sector planning and radio distribution. Operators may need new mounting, feed routing and optimization procedures compared with familiar panel antennas. Deployment economics must include engineering and training as well as antenna cost.

Material supply can constrain specialized products

Low-loss dielectric materials, radomes, waveguide components and high-frequency connectors are not as commoditized as standard mobile-antenna materials. Defense and satellite export controls can add additional sourcing and compliance constraints.

Standards are evolving in new frequency bands

6G, sub-THz sensing and new satellite architectures are still defining operating bands and interfaces. Suppliers face a risk that early designs may need redesign when standards or regulatory rules change, slowing volume investment.

MARKET OPPORTUNITIES

Scale large-format Luneburg lenses for satellite

MatSing’s 2026 manufacturing milestone demonstrates that larger Luneburg lenses can be produced for satellite, defense and radar. Multi-beam wide-angle operation could reduce mechanical steering and support simultaneous links across several directions or frequencies.

Use lens antennas for high-density WiFi

The same multi-beam principle used in cellular venues can be applied to WiFi 6E and future WiFi generations. Centralized lens systems can reduce access-point count in stadiums and arenas while concentrating capacity into seating zones.

Expand automotive and robotic radar

Lunewave’s 76–81 GHz radar architecture shows how 3D-printed lens antennas can deliver wide field of view and long range. Similar concepts can extend into drones, mining equipment, robotics and industrial sensing where reliable all-weather perception is valuable.

Develop flat and metamaterial lenses

Engineered metasurfaces can reduce thickness and weight compared with conventional dielectric lenses. If suppliers achieve low loss and wide bandwidth, flat lenses could expand adoption in airborne, mobile and compact terminal systems that cannot accommodate bulky optics.

Lens Antenna Value Chain Analysis

1. Dielectric / RF materialsLow-loss polymers, ceramics and engineered structures determine refractive behavior and RF efficiency.
2. Lens & feed manufacturingMachining, molding, additive manufacturing and waveguide/feed production create the antenna aperture.
3. RF integration & testFeeds, radomes, polarization, beam alignment and chamber measurements validate antenna performance.
4. Network / system deploymentTelecom, satellite, defense, radar and industrial systems convert focused beams into coverage or sensing value.

Material properties define lens performance

Dielectric constant and loss tangent determine refraction and attenuation. Materials also need mechanical stability across temperature and humidity. A material change can alter beam shape even when the external lens geometry is unchanged, so suppliers carefully qualify resin, ceramic or composite formulations.

Manufacturing accuracy becomes tighter as frequency rises

At 30 GHz and above, wavelength is measured in millimeters, so geometric error that is harmless at lower frequency can affect phase and gain. Precision machining, molding and additive manufacturing need controlled dimensions and surface quality across the full aperture.

RF test closes the manufacturing loop

A finished antenna is measured for gain, return loss, beamwidth, sidelobes and polarization. Multi-beam products add isolation and beam-to-beam consistency requirements. Automated test capacity can therefore become a production bottleneck for complex lens systems.

Deployment economics determine adoption

A lens antenna can cost more than a simple panel but reduce site count, sector hardware or maintenance. The buyer evaluates total network or system performance. In venues, fewer overhead antennas can replace many distributed units; in radar, one lens can replace more complex phased-array hardware in selected designs.

Recent Developments in the Lens Antenna Market

5 August 2026

MatSing unveils large-format Luneburg lens manufacturing

MatSing announced a proprietary manufacturing technology for large high-performance Luneburg lenses targeting satellite communication, ultra-wideband connectivity, defense and radar. The platform supports simultaneous transmit and receive across multiple directions and frequencies.

Source

13 August 2026

Anteral presents space and satellite RF solutions at SmallSat 2026

Anteral’s current RF portfolio includes lens horn, focusing lens horn and high-gain lens horn products alongside aerospace and satellite components, illustrating continued commercialization of lens antennas in space applications.

Source

18 February 2026

MatSing launches high-capacity WiFi 6E lens antenna

MatSing introduced the MS-16.16W45 for stadiums and arenas, bringing multi-beam lens technology into WiFi 6E with the goal of reducing access-point count while increasing venue capacity.

Source

2026

MatSing documents full-bowl lens deployment at Allegiant Stadium

A 2026 case study describes expansion to 40 lens antennas across the stadium seating bowl and reports high-capacity network performance using overhead line-of-sight coverage rather than under-seat infrastructure.

Source

Current

Eravant expands commercial lens-antenna coverage to sub-THz bands

Eravant’s current lens catalog includes products up to 220 GHz, including Gaussian-optics and lens-corrected designs for mmWave and sub-THz measurement and communications.

Source

REPORT SCOPE & SEGMENTATION

Attribute Details
Study Period 2020–2034
Base Year 2025
Estimated Year 2026
Forecast Period 2026–2034
Historical Period 2020–2025
Market Size 2025 USD 933.5 million
Market Size 2034 USD 2.23 billion
Growth Rate CAGR of 10.2% from 2026–2034
Unit Value (USD Million/Billion) and antenna unit shipments
Segmentation By Type, By Application, By Frequency Range, By End User, By Region
By Type Horn Lens Antennas · Luneberg Lens Antenna · Plano-Convex Lens Antennas · Others
By Application Telecom Carriers · Governments · Corporate Organizations · Satellite Communication · Others
By Frequency Range Ku-Band · Ka-Band · Millimeter Wave · Others
By End User Commercial · Defense & Aerospace · Industrial · Others
By Region Each region analysed by antenna type, application, frequency range, end user and country marketNorth AmericaUnited States, Canada, MexicoEuropeGermany, France, United Kingdom, Spain and other European marketsAsia PacificChina, Japan, South Korea, India, Southeast Asia and other Asian marketsSouth AmericaBrazil, Chile, Argentina and other South American marketsMiddle East & AfricaSaudi Arabia, UAE, South Africa and other MEA markets
Key Companies Profiled Millimeter Wave Products Inc. · MatSing · Tongyu Communication Inc. · Vector Telecom Solutions · Flann Microwave · KEYCOM Corporation · Anteral · Eravant · Lunewave Inc.
Customization Scope Free report customization equivalent to up to four analyst working days with purchase. Addition or alteration to country, regional and segment scope.

Frequently Asked Questions

What is the 2025 size of the Lens Antenna market?

The market is valued at USD 933.5 million in 2025 and is projected to reach USD 2.23 billion by 2034. The 2026 estimate is USD 1.03 billion and the 2026–2034 CAGR is 10.2%, reflecting growth in telecom, satellite, radar and millimeter-wave applications.

Which lens antenna type leads the market?

Horn lens antennas lead because they are widely used in microwave and millimeter-wave communication, radar and measurement systems. A horn feed and dielectric lens can deliver high gain, controlled beamwidth and low sidelobes across many frequency bands, supporting both standard catalog and custom products.

Which application is the largest?

Telecom carriers are the leading application because 5G and high-density venue networks need more spatial sectors and higher frequency reuse. Multi-beam lens antennas can create several isolated coverage zones from one installation point, reducing the number of separate antennas needed.

Which region leads the market?

North America is the largest current market through advanced 5G infrastructure, venue deployments, defense communications, satellite programs and a strong base of lens-antenna suppliers. Asia Pacific is the fastest-growing region through telecom expansion and cost-competitive manufacturing.

What is the estimated market size in 2026?

The 2026 estimated market size is USD 1.03 billion. Growth is supported by 5G capacity, satellite communication, automotive mmWave radar, high-density WiFi and expansion of commercial antenna products into E-band, W-band and higher frequencies.

Why are Luneburg lenses important?

A Luneburg lens can focus waves arriving from many directions and can support several feeds around the lens. This enables multi-beam antennas without a conventional electronically steered phased array. The architecture is used in cellular, satellite, radar and automotive sensing applications.

What frequency ranges are most important?

Ku- and Ka-band remain important for satellite and point-to-point systems, while millimeter-wave bands are growing quickly in 5G, automotive radar and high-capacity links. Commercial lens products now extend into W-, D- and G-band for sub-THz research and measurement.

What are the main market restraints?

The main restraints are precision manufacturing cost, telecom integration complexity, specialized dielectric-material requirements and evolving standards in new frequency bands. High-frequency lens products also require calibrated RF test infrastructure and tight mechanical tolerances.

What new applications are emerging?

New opportunities include WiFi 6E venue networks, large-format satellite Luneburg lenses, automotive imaging radar, passive RF sensing and sub-THz communication or measurement. Flat metamaterial lenses may further expand adoption by reducing thickness and weight.

What does the report cover?

The report covers horn, Luneburg, plano-convex and other lens antennas; telecom, government, corporate and satellite applications; Ku-, Ka- and millimeter-wave bands; commercial, defense and industrial end users; five global regions; manufacturing and RF qualification; and the full profiled company set.

Research Sources & Evidence Base

View primary and authoritative evidence used in this overview
  1. MatSing. Lens Technology – Official current evidence on multi-beam Luneburg technology, beam count, spectrum efficiency and deployment architecture.
  2. MatSing. Large-Format Luneburg Lens for Satellite Communications – August 2026 official product-development announcement for satellite, defense, radar and ultra-wideband applications.
  3. MatSing. WiFi 6E Lens Antenna – February 2026 official launch covering high-density stadium and arena WiFi.
  4. Eravant. Lens Antennas – Official current catalog covering more than 50 lens products across microwave, millimeter-wave and sub-THz frequencies.
  5. Lunewave. Automotive Radar Sensor – Official evidence on 76–81 GHz Luneburg-lens radar, wide field of view and long-range automotive sensing.
  6. Anteral. Antennas & Passives – Official product portfolio covering lens horn, focusing lens horn and high-gain lens horn antennas for RF and aerospace applications.

Global Lens Antenna Market Research Report 2026-2034

Get Sample Report PDF for Exclusive Insights

Report Sample Includes

  • Table of Contents
  • List of Tables & Figures
  • Charts, Research Methodology, and more...

PDF Icon Download Sample Report PDF

Download Sample Report

Table of Content

Table of Contents
1 Research Methodology and Statistical Scope
1.1 Market Definition and Statistical Scope of Lens Antenna
1.2 Key Market Segments
1.2.1 Lens Antenna Segment by Type
1.2.2 Lens Antenna Segment by Application
1.3 Methodology & Sources of Information
1.3.1 Research Methodology
1.3.2 Research Process
1.3.3 Market Breakdown and Data Triangulation
1.3.4 Base Year
1.3.5 Report Assumptions & Caveats
2 Lens Antenna Market Overview
2.1 Global Market Overview
2.1.1 Global Lens Antenna Market Size (M USD) Estimates and Forecasts (2019-2032)
2.1.2 Global Lens Antenna Sales Estimates and Forecasts (2019-2032)
2.2 Market Segment Executive Summary
2.3 Global Market Size by Region
3 Lens Antenna Market Competitive Landscape
3.1 Global Lens Antenna Sales by Manufacturers (2019-2025)
3.2 Global Lens Antenna Revenue Market Share by Manufacturers (2019-2025)
3.3 Lens Antenna Market Share by Company Type (Tier 1, Tier 2, and Tier 3)
3.4 Global Lens Antenna Average Price by Manufacturers (2019-2025)
3.5 Manufacturers Lens Antenna Sales Sites, Area Served, Product Type
3.6 Lens Antenna Market Competitive Situation and Trends
3.6.1 Lens Antenna Market Concentration Rate
3.6.2 Global 5 and 10 Largest Lens Antenna Players Market Share by Revenue
3.6.3 Mergers & Acquisitions, Expansion
4 Lens Antenna Industry Chain Analysis
4.1 Lens Antenna Industry Chain Analysis
4.2 Market Overview of Key Raw Materials
4.3 Midstream Market Analysis
4.4 Downstream Customer Analysis
5 The Development and Dynamics of Lens Antenna Market
5.1 Key Development Trends
5.2 Driving Factors
5.3 Market Challenges
5.4 Market Restraints
5.5 Industry News
5.5.1 New Product Developments
5.5.2 Mergers & Acquisitions
5.5.3 Expansions
5.5.4 Collaboration/Supply Contracts
5.6 Industry Policies
6 Lens Antenna Market Segmentation by Type
6.1 Evaluation Matrix of Segment Market Development Potential (Type)
6.2 Global Lens Antenna Sales Market Share by Type (2019-2025)
6.3 Global Lens Antenna Market Size Market Share by Type (2019-2025)
6.4 Global Lens Antenna Price by Type (2019-2025)
7 Lens Antenna Market Segmentation by Application
7.1 Evaluation Matrix of Segment Market Development Potential (Application)
7.2 Global Lens Antenna Market Sales by Application (2019-2025)
7.3 Global Lens Antenna Market Size (M USD) by Application (2019-2025)
7.4 Global Lens Antenna Sales Growth Rate by Application (2019-2025)
8 Lens Antenna Market Segmentation by Region
8.1 Global Lens Antenna Sales by Region
8.1.1 Global Lens Antenna Sales by Region
8.1.2 Global Lens Antenna Sales Market Share by Region
8.2 North America
8.2.1 North America Lens Antenna Sales by Country
8.2.2 U.S.
8.2.3 Canada
8.2.4 Mexico
8.3 Europe
8.3.1 Europe Lens Antenna Sales by Country
8.3.2 Germany
8.3.3 France
8.3.4 U.K.
8.3.5 Italy
8.3.6 Russia
8.4 Asia Pacific
8.4.1 Asia Pacific Lens Antenna Sales by Region
8.4.2 China
8.4.3 Japan
8.4.4 South Korea
8.4.5 India
8.4.6 Southeast Asia
8.5 South America
8.5.1 South America Lens Antenna Sales by Country
8.5.2 Brazil
8.5.3 Argentina
8.5.4 Columbia
8.6 Middle East and Africa
8.6.1 Middle East and Africa Lens Antenna Sales by Region
8.6.2 Saudi Arabia
8.6.3 UAE
8.6.4 Egypt
8.6.5 Nigeria
8.6.6 South Africa
9 Key Companies Profile
9.1 Millimeter Wave Products
9.1.1 Millimeter Wave Products Lens Antenna Basic Information
9.1.2 Millimeter Wave Products Lens Antenna Product Overview
9.1.3 Millimeter Wave Products Lens Antenna Product Market Performance
9.1.4 Millimeter Wave Products Business Overview
9.1.5 Millimeter Wave Products Lens Antenna SWOT Analysis
9.1.6 Millimeter Wave Products Recent Developments
9.2 MatSing
9.2.1 MatSing Lens Antenna Basic Information
9.2.2 MatSing Lens Antenna Product Overview
9.2.3 MatSing Lens Antenna Product Market Performance
9.2.4 MatSing Business Overview
9.2.5 MatSing Lens Antenna SWOT Analysis
9.2.6 MatSing Recent Developments
9.3 Tongyu Communication
9.3.1 Tongyu Communication Lens Antenna Basic Information
9.3.2 Tongyu Communication Lens Antenna Product Overview
9.3.3 Tongyu Communication Lens Antenna Product Market Performance
9.3.4 Tongyu Communication Lens Antenna SWOT Analysis
9.3.5 Tongyu Communication Business Overview
9.3.6 Tongyu Communication Recent Developments
9.4 Vector Telecom
9.4.1 Vector Telecom Lens Antenna Basic Information
9.4.2 Vector Telecom Lens Antenna Product Overview
9.4.3 Vector Telecom Lens Antenna Product Market Performance
9.4.4 Vector Telecom Business Overview
9.4.5 Vector Telecom Recent Developments
9.5 Flann
9.5.1 Flann Lens Antenna Basic Information
9.5.2 Flann Lens Antenna Product Overview
9.5.3 Flann Lens Antenna Product Market Performance
9.5.4 Flann Business Overview
9.5.5 Flann Recent Developments
9.6 KEYCOM
9.6.1 KEYCOM Lens Antenna Basic Information
9.6.2 KEYCOM Lens Antenna Product Overview
9.6.3 KEYCOM Lens Antenna Product Market Performance
9.6.4 KEYCOM Business Overview
9.6.5 KEYCOM Recent Developments
9.7 Anteral
9.7.1 Anteral Lens Antenna Basic Information
9.7.2 Anteral Lens Antenna Product Overview
9.7.3 Anteral Lens Antenna Product Market Performance
9.7.4 Anteral Business Overview
9.7.5 Anteral Recent Developments
9.8 Eravant
9.8.1 Eravant Lens Antenna Basic Information
9.8.2 Eravant Lens Antenna Product Overview
9.8.3 Eravant Lens Antenna Product Market Performance
9.8.4 Eravant Business Overview
9.8.5 Eravant Recent Developments
9.9 Lunewave
9.9.1 Lunewave Lens Antenna Basic Information
9.9.2 Lunewave Lens Antenna Product Overview
9.9.3 Lunewave Lens Antenna Product Market Performance
9.9.4 Lunewave Business Overview
9.9.5 Lunewave Recent Developments
10 Lens Antenna Market Forecast by Region
10.1 Global Lens Antenna Market Size Forecast
10.2 Global Lens Antenna Market Forecast by Region
10.2.1 North America Market Size Forecast by Country
10.2.2 Europe Lens Antenna Market Size Forecast by Country
10.2.3 Asia Pacific Lens Antenna Market Size Forecast by Region
10.2.4 South America Lens Antenna Market Size Forecast by Country
10.2.5 Middle East and Africa Forecasted Consumption of Lens Antenna by Country
11 Forecast Market by Type and by Application (2025-2032)
11.1 Global Lens Antenna Market Forecast by Type (2025-2032)
11.1.1 Global Forecasted Sales of Lens Antenna by Type (2025-2032)
11.1.2 Global Lens Antenna Market Size Forecast by Type (2025-2032)
11.1.3 Global Forecasted Price of Lens Antenna by Type (2025-2032)
11.2 Global Lens Antenna Market Forecast by Application (2025-2032)
11.2.1 Global Lens Antenna Sales (K Units) Forecast by Application
11.2.2 Global Lens Antenna Market Size (M USD) Forecast by Application (2025-2032)
12 Conclusion and Key FindingsList of Tables
Table 1. Introduction of the Type
Table 2. Introduction of the Application
Table 3. Market Size (M USD) Segment Executive Summary
Table 4. Lens Antenna Market Size Comparison by Region (M USD)
Table 5. Global Lens Antenna Sales (K Units) by Manufacturers (2019-2025)
Table 6. Global Lens Antenna Sales Market Share by Manufacturers (2019-2025)
Table 7. Global Lens Antenna Revenue (M USD) by Manufacturers (2019-2025)
Table 8. Global Lens Antenna Revenue Share by Manufacturers (2019-2025)
Table 9. Company Type (Tier 1, Tier 2, and Tier 3) & (based on the Revenue in Lens Antenna as of 2022)
Table 10. Global Market Lens Antenna Average Price (USD/Unit) of Key Manufacturers (2019-2025)
Table 11. Manufacturers Lens Antenna Sales Sites and Area Served
Table 12. Manufacturers Lens Antenna Product Type
Table 13. Global Lens Antenna Manufacturers Market Concentration Ratio (CR5 and HHI)
Table 14. Mergers & Acquisitions, Expansion Plans
Table 15. Industry Chain Map of Lens Antenna
Table 16. Market Overview of Key Raw Materials
Table 17. Midstream Market Analysis
Table 18. Downstream Customer Analysis
Table 19. Key Development Trends
Table 20. Driving Factors
Table 21. Lens Antenna Market Challenges
Table 22. Global Lens Antenna Sales by Type (K Units)
Table 23. Global Lens Antenna Market Size by Type (M USD)
Table 24. Global Lens Antenna Sales (K Units) by Type (2019-2025)
Table 25. Global Lens Antenna Sales Market Share by Type (2019-2025)
Table 26. Global Lens Antenna Market Size (M USD) by Type (2019-2025)
Table 27. Global Lens Antenna Market Size Share by Type (2019-2025)
Table 28. Global Lens Antenna Price (USD/Unit) by Type (2019-2025)
Table 29. Global Lens Antenna Sales (K Units) by Application
Table 30. Global Lens Antenna Market Size by Application
Table 31. Global Lens Antenna Sales by Application (2019-2025) & (K Units)
Table 32. Global Lens Antenna Sales Market Share by Application (2019-2025)
Table 33. Global Lens Antenna Sales by Application (2019-2025) & (M USD)
Table 34. Global Lens Antenna Market Share by Application (2019-2025)
Table 35. Global Lens Antenna Sales Growth Rate by Application (2019-2025)
Table 36. Global Lens Antenna Sales by Region (2019-2025) & (K Units)
Table 37. Global Lens Antenna Sales Market Share by Region (2019-2025)
Table 38. North America Lens Antenna Sales by Country (2019-2025) & (K Units)
Table 39. Europe Lens Antenna Sales by Country (2019-2025) & (K Units)
Table 40. Asia Pacific Lens Antenna Sales by Region (2019-2025) & (K Units)
Table 41. South America Lens Antenna Sales by Country (2019-2025) & (K Units)
Table 42. Middle East and Africa Lens Antenna Sales by Region (2019-2025) & (K Units)
Table 43. Millimeter Wave Products Lens Antenna Basic Information
Table 44. Millimeter Wave Products Lens Antenna Product Overview
Table 45. Millimeter Wave Products Lens Antenna Sales (K Units), Revenue (M USD), Price (USD/Unit) and Gross Margin (2019-2025)
Table 46. Millimeter Wave Products Business Overview
Table 47. Millimeter Wave Products Lens Antenna SWOT Analysis
Table 48. Millimeter Wave Products Recent Developments
Table 49. MatSing Lens Antenna Basic Information
Table 50. MatSing Lens Antenna Product Overview
Table 51. MatSing Lens Antenna Sales (K Units), Revenue (M USD), Price (USD/Unit) and Gross Margin (2019-2025)
Table 52. MatSing Business Overview
Table 53. MatSing Lens Antenna SWOT Analysis
Table 54. MatSing Recent Developments
Table 55. Tongyu Communication Lens Antenna Basic Information
Table 56. Tongyu Communication Lens Antenna Product Overview
Table 57. Tongyu Communication Lens Antenna Sales (K Units), Revenue (M USD), Price (USD/Unit) and Gross Margin (2019-2025)
Table 58. Tongyu Communication Lens Antenna SWOT Analysis
Table 59. Tongyu Communication Business Overview
Table 60. Tongyu Communication Recent Developments
Table 61. Vector Telecom Lens Antenna Basic Information
Table 62. Vector Telecom Lens Antenna Product Overview
Table 63. Vector Telecom Lens Antenna Sales (K Units), Revenue (M USD), Price (USD/Unit) and Gross Margin (2019-2025)
Table 64. Vector Telecom Business Overview
Table 65. Vector Telecom Recent Developments
Table 66. Flann Lens Antenna Basic Information
Table 67. Flann Lens Antenna Product Overview
Table 68. Flann Lens Antenna Sales (K Units), Revenue (M USD), Price (USD/Unit) and Gross Margin (2019-2025)
Table 69. Flann Business Overview
Table 70. Flann Recent Developments
Table 71. KEYCOM Lens Antenna Basic Information
Table 72. KEYCOM Lens Antenna Product Overview
Table 73. KEYCOM Lens Antenna Sales (K Units), Revenue (M USD), Price (USD/Unit) and Gross Margin (2019-2025)
Table 74. KEYCOM Business Overview
Table 75. KEYCOM Recent Developments
Table 76. Anteral Lens Antenna Basic Information
Table 77. Anteral Lens Antenna Product Overview
Table 78. Anteral Lens Antenna Sales (K Units), Revenue (M USD), Price (USD/Unit) and Gross Margin (2019-2025)
Table 79. Anteral Business Overview
Table 80. Anteral Recent Developments
Table 81. Eravant Lens Antenna Basic Information
Table 82. Eravant Lens Antenna Product Overview
Table 83. Eravant Lens Antenna Sales (K Units), Revenue (M USD), Price (USD/Unit) and Gross Margin (2019-2025)
Table 84. Eravant Business Overview
Table 85. Eravant Recent Developments
Table 86. Lunewave Lens Antenna Basic Information
Table 87. Lunewave Lens Antenna Product Overview
Table 88. Lunewave Lens Antenna Sales (K Units), Revenue (M USD), Price (USD/Unit) and Gross Margin (2019-2025)
Table 89. Lunewave Business Overview
Table 90. Lunewave Recent Developments
Table 91. Global Lens Antenna Sales Forecast by Region (2025-2032) & (K Units)
Table 92. Global Lens Antenna Market Size Forecast by Region (2025-2032) & (M USD)
Table 93. North America Lens Antenna Sales Forecast by Country (2025-2032) & (K Units)
Table 94. North America Lens Antenna Market Size Forecast by Country (2025-2032) & (M USD)
Table 95. Europe Lens Antenna Sales Forecast by Country (2025-2032) & (K Units)
Table 96. Europe Lens Antenna Market Size Forecast by Country (2025-2032) & (M USD)
Table 97. Asia Pacific Lens Antenna Sales Forecast by Region (2025-2032) & (K Units)
Table 98. Asia Pacific Lens Antenna Market Size Forecast by Region (2025-2032) & (M USD)
Table 99. South America Lens Antenna Sales Forecast by Country (2025-2032) & (K Units)
Table 100. South America Lens Antenna Market Size Forecast by Country (2025-2032) & (M USD)
Table 101. Middle East and Africa Lens Antenna Consumption Forecast by Country (2025-2032) & (Units)
Table 102. Middle East and Africa Lens Antenna Market Size Forecast by Country (2025-2032) & (M USD)
Table 103. Global Lens Antenna Sales Forecast by Type (2025-2032) & (K Units)
Table 104. Global Lens Antenna Market Size Forecast by Type (2025-2032) & (M USD)
Table 105. Global Lens Antenna Price Forecast by Type (2025-2032) & (USD/Unit)
Table 106. Global Lens Antenna Sales (K Units) Forecast by Application (2025-2032)
Table 107. Global Lens Antenna Market Size Forecast by Application (2025-2032) & (M USD)
List of Figures
Figure 1. Product Picture of Lens Antenna
Figure 2. Data Triangulation
Figure 3. Key Caveats
Figure 4. Global Lens Antenna Market Size (M USD), 2019-2032
Figure 5. Global Lens Antenna Market Size (M USD) (2019-2032)
Figure 6. Global Lens Antenna Sales (K Units) & (2019-2032)
Figure 7. Evaluation Matrix of Segment Market Development Potential (Type)
Figure 8. Evaluation Matrix of Segment Market Development Potential (Application)
Figure 9. Evaluation Matrix of Regional Market Development Potential
Figure 10. Lens Antenna Market Size by Country (M USD)
Figure 11. Lens Antenna Sales Share by Manufacturers in 2023
Figure 12. Global Lens Antenna Revenue Share by Manufacturers in 2023
Figure 13. Lens Antenna Market Share by Company Type (Tier 1, Tier 2 and Tier 3): 2023
Figure 14. Global Market Lens Antenna Average Price (USD/Unit) of Key Manufacturers in 2023
Figure 15. The Global 5 and 10 Largest Players: Market Share by Lens Antenna Revenue in 2023
Figure 16. Evaluation Matrix of Segment Market Development Potential (Type)
Figure 17. Global Lens Antenna Market Share by Type
Figure 18. Sales Market Share of Lens Antenna by Type (2019-2025)
Figure 19. Sales Market Share of Lens Antenna by Type in 2023
Figure 20. Market Size Share of Lens Antenna by Type (2019-2025)
Figure 21. Market Size Market Share of Lens Antenna by Type in 2023
Figure 22. Evaluation Matrix of Segment Market Development Potential (Application)
Figure 23. Global Lens Antenna Market Share by Application
Figure 24. Global Lens Antenna Sales Market Share by Application (2019-2025)
Figure 25. Global Lens Antenna Sales Market Share by Application in 2023
Figure 26. Global Lens Antenna Market Share by Application (2019-2025)
Figure 27. Global Lens Antenna Market Share by Application in 2023
Figure 28. Global Lens Antenna Sales Growth Rate by Application (2019-2025)
Figure 29. Global Lens Antenna Sales Market Share by Region (2019-2025)
Figure 30. North America Lens Antenna Sales and Growth Rate (2019-2025) & (K Units)
Figure 31. North America Lens Antenna Sales Market Share by Country in 2023
Figure 32. U.S. Lens Antenna Sales and Growth Rate (2019-2025) & (K Units)
Figure 33. Canada Lens Antenna Sales (K Units) and Growth Rate (2019-2025)
Figure 34. Mexico Lens Antenna Sales (Units) and Growth Rate (2019-2025)
Figure 35. Europe Lens Antenna Sales and Growth Rate (2019-2025) & (K Units)
Figure 36. Europe Lens Antenna Sales Market Share by Country in 2023
Figure 37. Germany Lens Antenna Sales and Growth Rate (2019-2025) & (K Units)
Figure 38. France Lens Antenna Sales and Growth Rate (2019-2025) & (K Units)
Figure 39. U.K. Lens Antenna Sales and Growth Rate (2019-2025) & (K Units)
Figure 40. Italy Lens Antenna Sales and Growth Rate (2019-2025) & (K Units)
Figure 41. Russia Lens Antenna Sales and Growth Rate (2019-2025) & (K Units)
Figure 42. Asia Pacific Lens Antenna Sales and Growth Rate (K Units)
Figure 43. Asia Pacific Lens Antenna Sales Market Share by Region in 2023
Figure 44. China Lens Antenna Sales and Growth Rate (2019-2025) & (K Units)
Figure 45. Japan Lens Antenna Sales and Growth Rate (2019-2025) & (K Units)
Figure 46. South Korea Lens Antenna Sales and Growth Rate (2019-2025) & (K Units)
Figure 47. India Lens Antenna Sales and Growth Rate (2019-2025) & (K Units)
Figure 48. Southeast Asia Lens Antenna Sales and Growth Rate (2019-2025) & (K Units)
Figure 49. South America Lens Antenna Sales and Growth Rate (K Units)
Figure 50. South America Lens Antenna Sales Market Share by Country in 2023
Figure 51. Brazil Lens Antenna Sales and Growth Rate (2019-2025) & (K Units)
Figure 52. Argentina Lens Antenna Sales and Growth Rate (2019-2025) & (K Units)
Figure 53. Columbia Lens Antenna Sales and Growth Rate (2019-2025) & (K Units)
Figure 54. Middle East and Africa Lens Antenna Sales and Growth Rate (K Units)
Figure 55. Middle East and Africa Lens Antenna Sales Market Share by Region in 2023
Figure 56. Saudi Arabia Lens Antenna Sales and Growth Rate (2019-2025) & (K Units)
Figure 57. UAE Lens Antenna Sales and Growth Rate (2019-2025) & (K Units)
Figure 58. Egypt Lens Antenna Sales and Growth Rate (2019-2025) & (K Units)
Figure 59. Nigeria Lens Antenna Sales and Growth Rate (2019-2025) & (K Units)
Figure 60. South Africa Lens Antenna Sales and Growth Rate (2019-2025) & (K Units)
Figure 61. Global Lens Antenna Sales Forecast by Volume (2019-2032) & (K Units)
Figure 62. Global Lens Antenna Market Size Forecast by Value (2019-2032) & (M USD)
Figure 63. Global Lens Antenna Sales Market Share Forecast by Type (2025-2032)
Figure 64. Global Lens Antenna Market Share Forecast by Type (2025-2032)
Figure 65. Global Lens Antenna Sales Forecast by Application (2025-2032)
Figure 66. Global Lens Antenna Market Share Forecast by Application (2025-2032)