SEMICONDUCTOR INSIGHT
MARKET RESEARCH REPORT

DC Electronic Load Market

2026 to 2034
MARKET INTELLIGENCE
ACROSS KEY REGIONS
2026 EDITION
POWER ELECTRONICS Semiconductor Market Research

DC Electronic Load Market

Trends, Business Strategies 2026-2034

◷
UPDATED 18 September 2026
▤
REPORT LENGTH Detailed Report
▣
REPORT CODE e84395166891
▯
FORMATS PDF

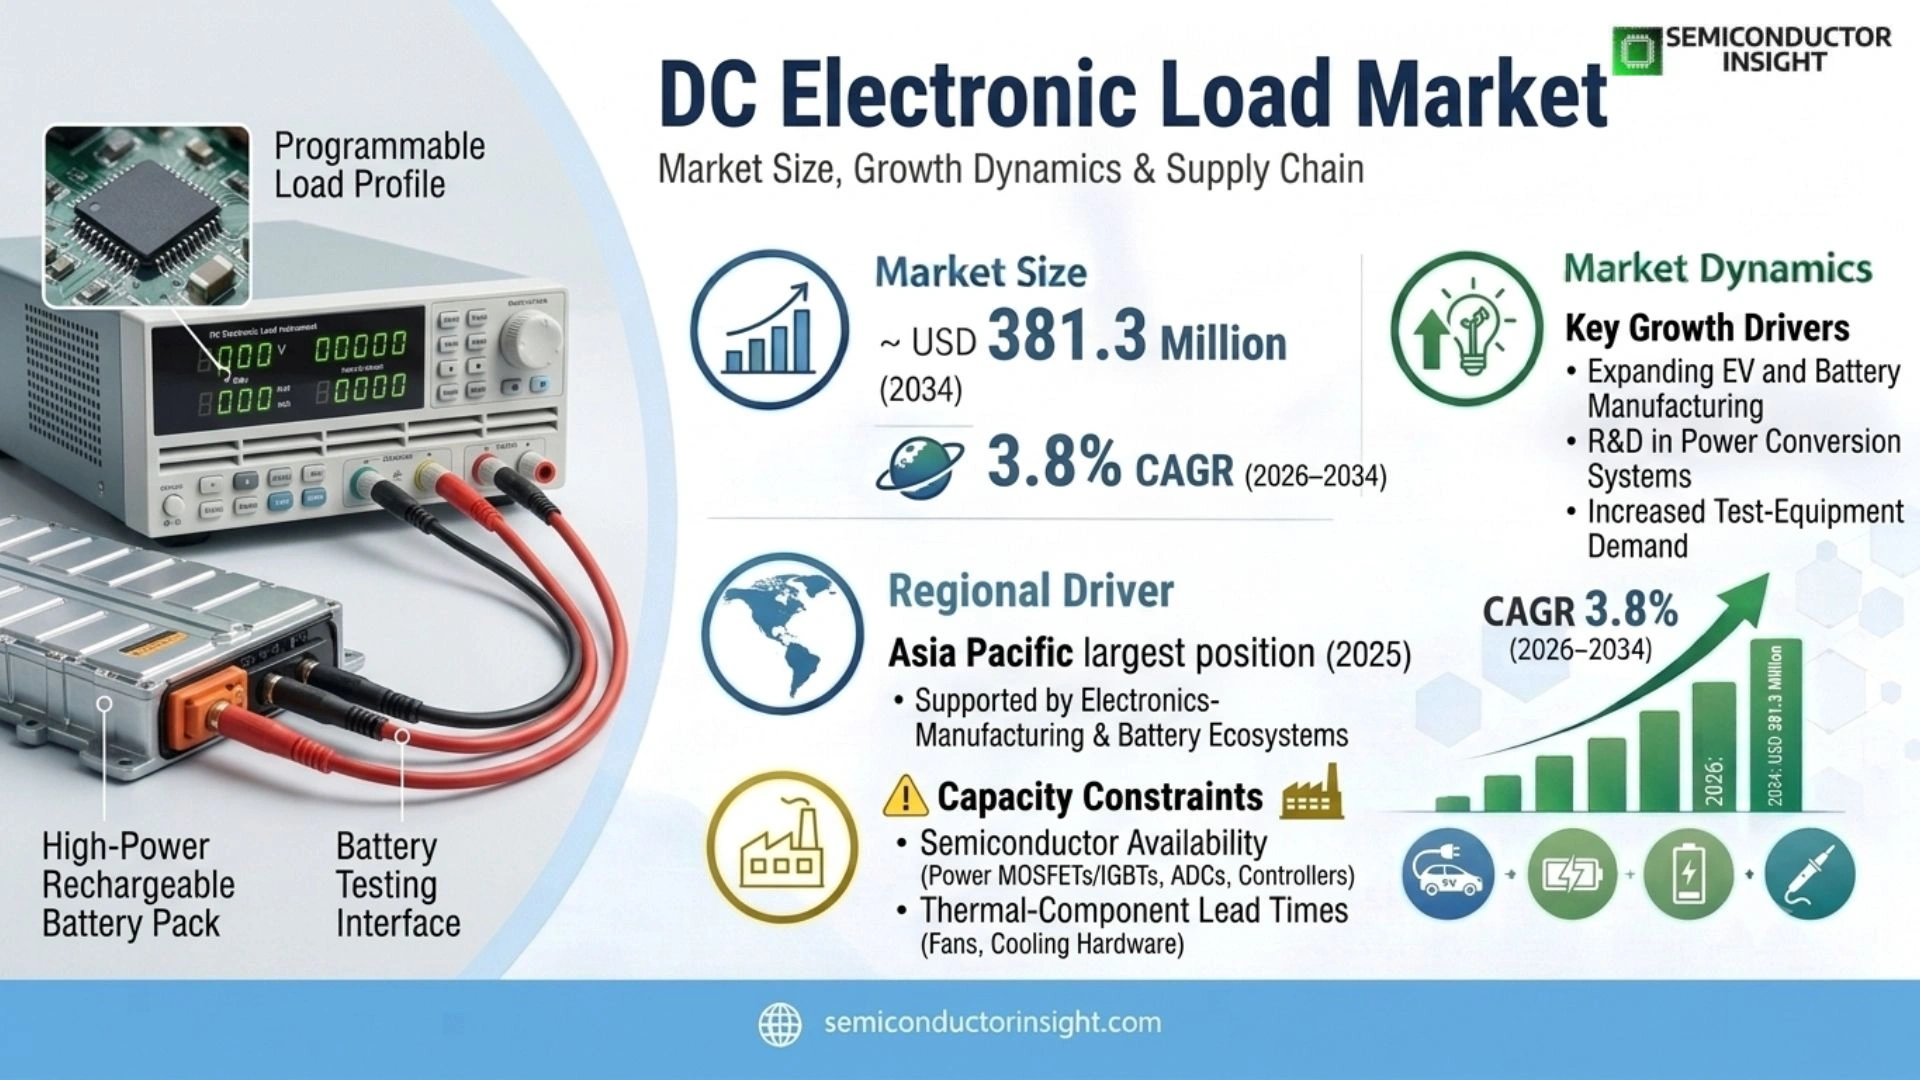
DC Electronic Load Market is projected to reach USD 381.3 million by 2034, CAGR of 3.8% during 2026–2034. Asia Pacific held the largest market position in 2025, supported by the region’s electronics-manufacturing, battery, power-conversion and test-equipment ecosystems.

Get the sample PDF with study scope, segmentation and methodology details.

Key Statistics

2025 Market Size
USD 273.0 million
2034 Projected Size
USD 381.3 million
CAGR (2026–2034)
3.8%
Largest Market in 2025
Asia Pacific

Key Takeaways

  • Low-voltage electronic loads remain the largest type because the highest test-unit volumes sit in server power, consumer and communications power supplies, lower-voltage batteries and production-line electronics. The source page places this category at about 85% of demand, making it the commercial volume base even as higher-voltage platforms expand.
  • Programmable and regenerative architectures are the most important product shift. Automation, dynamic profiles, data logging and energy recovery turn the load from a passive sink into a software-controlled test asset, allowing laboratories to reuse test scripts, raise throughput and reduce heat-management costs at higher power levels.
  • Server power is the leading application, while battery and charging-system validation provides the strongest adjacent growth mechanism. Data-centre power density raises requirements for transient response and repeatability, while EV battery deployment reached more than 950 GWh in 2024 and public charging additions exceeded 1.3 million points.
  • Asia Pacific remains the largest regional market because electronics manufacturing, battery production, power-conversion manufacturing and test-equipment supply are concentrated in China, Japan, South Korea and Taiwan. North America and Europe retain high-value demand in R&D, aerospace, automotive validation and advanced power-system qualification.
  • Capital cost and integration complexity are the principal restraints. High-power systems need precision power stages, thermal management, calibration, software integration and safety infrastructure, so buyers increasingly evaluate total test-cell economics rather than comparing only the nameplate wattage or initial instrument price.

DC Electronic Load Market Overview

DC Electronic Load Market was valued at USD 273.0 million in 2025 and is projected to reach USD 381.3 million by 2034, representing an anchor-consistent CAGR of 3.8% during 2026–2034. Asia Pacific held the largest market position in 2025, supported by the region’s electronics-manufacturing, battery, power-conversion and test-equipment ecosystems.

Base year: 2025 · Estimated year: 2026 · Forecast period: 2026–2034 · Historical context: 2021–2025 · Values in USD million unless otherwise stated

A DC electronic load is a programmable test instrument that draws controlled current or power from a device under test and reproduces operating conditions that a simple resistor cannot maintain. Modern instruments support constant-current, constant-voltage, constant-resistance and constant-power modes, transient sequences and remote interfaces. Those functions make them core assets for qualifying power supplies, batteries, fuel cells, converters, chargers and other DC sources under repeatable laboratory and production conditions.

The commercial market spans benchtop and modular low-power loads, high-power rack systems and regenerative platforms that return absorbed energy to the facility supply. Purchasing decisions depend on voltage and current envelope, slew rate, measurement resolution, transient behaviour, parallel scalability, communication interfaces and calibration support. At higher power, energy-recovery efficiency and cooling architecture become operating-cost variables, so the best-value system is not always the instrument with the lowest acquisition price.

Demand is being reshaped by two simultaneous changes in power engineering. First, data-centre and telecom power systems are becoming denser and more dynamic, which increases the value of programmable load profiles and automated test sequences. Second, electrification moves more engineering effort into batteries, onboard chargers, fast-charging equipment, renewable-energy converters and storage systems. Each transition expands the number of power stages that must be characterized before release and monitored through production.

Segment Analysis: By Type

By type, the source report segments the market into Low-Voltage Electronic Load and High-Voltage Electronic Load. Low-voltage systems form the largest revenue and unit base because they address the broadest range of server, electronics and general power-supply tests, while high-voltage systems gain strategic importance in EV, storage, renewable-energy and industrial power-conversion validation.

Type Technical role Market position
Low-Voltage Electronic Load Low-voltage loads are optimized for dense current sinking, fast transient response and accurate measurements across common power-supply and battery voltage ranges. They are used on bench and automated lines to validate server rails, telecom converters, adapters, embedded power modules and lower-voltage battery packs. Modular architectures let users place several channels in one mainframe and scale test capacity without rebuilding the entire station. Largest type in 2025. The source report identifies low-voltage electronic loads as the dominant category, with about 85% share. Their breadth is the key commercial advantage: one family can serve design verification, production screening and maintenance across many power products. Competition is therefore intense, and suppliers differentiate through channel density, transient fidelity, software, calibration and global service rather than voltage rating alone.
High-Voltage Electronic Load High-voltage loads extend the safe operating area for traction batteries, DC fast chargers, solar strings, high-voltage DC buses, aerospace power and industrial converters. They require stronger isolation, protection, switching devices and thermal systems, and many high-power platforms support parallel operation so the buyer can add kilowatts or megawatts as the device under test scales. High-voltage systems represent a smaller unit base but a higher-value engineering segment. Their opportunity grows with 400 V, 800 V and higher battery and power-conversion architectures, renewable-energy systems and grid-connected storage. Buyers place greater weight on protection logic, regenerative capability, facility integration and service response because a test interruption on a high-power validation cell can delay qualification of an expensive system.

Programmability, power rating and energy recovery

The source scope also distinguishes programmable versus manual or static loads and low-, medium- and high-power ratings. Programmable platforms are commercially advantaged because automated test equipment can recall profiles, sweep operating points, synchronize measurements and store pass/fail data without operator intervention. Above the medium-power range, regenerative systems add another economic layer: returning energy to the AC supply reduces heat rejection, cooling demand and the cost of running long-duration battery, charger and power-converter tests.

Segment Analysis: By Application

By application, the report covers Server Power, Car Battery, DC Charging Pile and Others. Server power is the largest application because every high-availability power supply and conversion stage must be validated across steady-state and transient conditions. Car-battery and charging-pile testing are the strongest electrification-linked demand pools as voltage, power and charging speed continue to increase.

Application Demand characteristics
Server Power Server and data-centre power supplies require repetitive validation of efficiency, regulation, transient response, protection and ride-through behaviour over many loading states. Higher rack power density increases the need for fast programmable transitions rather than fixed resistor banks. Suppliers that combine multiple synchronized channels, automation APIs, accurate low-voltage measurements and service calibration can become embedded in both power-supply design laboratories and manufacturing test lines.
Car Battery Battery validation requires controlled discharge profiles, capacity measurements, pulse loads and protection testing that represent acceleration, auxiliary loads and fault conditions. The IEA reported global EV battery demand above 950 GWh in 2024, up 25% from 2023, so growth in pack production creates more test stations and longer validation programmes. High-power and regenerative loads benefit because they can cycle large packs while containing facility energy and thermal costs.
DC Charging Pile Charging-equipment manufacturers use electronic loads to validate output regulation, protection, communication-linked load changes and sustained high-power operation before field deployment. The IEA reported more than 1.3 million public charging points added globally in 2024, an increase above 30%, and ultra-fast charging above 150 kW expanded rapidly. That infrastructure build-out raises test power, voltage and automation requirements for charger makers and certification laboratories.
Others Other applications include fuel cells, photovoltaic and storage converters, aerospace and defense power, telecommunications, industrial drives, laboratory research and consumer-electronics power products. These markets are heterogeneous, but the purchasing logic is consistent: engineers need a repeatable sink with traceable measurements and programmable dynamics. Specialist suppliers can win by offering unusual voltage ranges, low-current accuracy, environmental compatibility, isolated channels or application-specific software rather than competing on broad volume alone.

DC Electronic Load Market Trends

Regional Analysis

Asia Pacific is the largest DC electronic load market in 2025, reflecting the concentration of electronics manufacturing, battery supply chains and power-conversion production. North America and Europe remain high-value markets for design validation, aerospace and defense, automotive qualification and data-centre power, while South America and the Middle East & Africa are more import-dependent and project-led.

How does regional demand differ across the DC electronic load market?

The regions buy electronic loads for different reasons. Asia Pacific is anchored by production testing and local instrument manufacturing; North America by R&D, hyperscale power and defense qualification; Europe by automotive electrification, industrial power and compliance-driven engineering; South America by imported industrial and renewable-energy equipment; and the Middle East & Africa by telecom, energy and infrastructure projects. These differences determine required voltage, service coverage, procurement channels and acceptable capital cost.

Region Position Growth outlook Demand profile What decides supplier selection
Asia Pacific Largest region Above market average Manufacturing and electrification led Production buyers prioritize channel density, local availability, automation support and service response, while EV and power-conversion laboratories add high-voltage, regenerative operation and parallel scalability to the decision. Regional suppliers benefit from proximity to electronics and battery manufacturers, but global brands retain high-end accounts where calibration and installed test code are critical.
North America Second-tier global region Steady to strong in power test R&D, data-centre and defense led North American buyers in hyperscale computing, aerospace, defense and advanced automotive development typically require traceable calibration, software integration and strong service response. Procurement is less focused on lowest hardware cost and more focused on minimizing engineering risk, keeping automated test code stable and ensuring that high-power equipment can be supported across multi-year programmes.
Europe Major high-value region Moderate Automotive and industrial power led European customers emphasize automotive qualification, industrial automation, renewable-energy power conversion and documented measurement processes. Supplier selection therefore includes safety, EMC, traceability, software stability and long-term product support. High energy costs also strengthen the operating-cost case for regenerative loads in high-utilization battery and power-converter laboratories.
South America Smaller global share Selective Industrial and energy project led South American buyers are more sensitive to import cost, financing, distributor inventory and local repair because many advanced test platforms are sourced from outside the region. Suppliers that can provide broad voltage coverage, durable hardware and local technical support have an advantage, particularly in automotive manufacturing, renewable-energy integration, universities and industrial maintenance.
Middle East & Africa Smallest base Emerging Energy, telecom and infrastructure led Demand is concentrated in telecom power, energy projects, universities, defense and infrastructure rather than broad electronics manufacturing. Customers value rugged equipment, broad operating ranges and dependable project delivery. Supplier presence often depends on regional distributors and integrators that can provide commissioning, training and after-sales support across geographically dispersed sites.

Asia Pacific LARGEST

Why does Asia Pacific lead the DC electronic load market?

Asia Pacific leads because the region combines the world’s largest concentration of electronics manufacturing with major battery, charging, telecom and power-conversion supply chains. That creates demand at both ends of the market: high-volume low-voltage production testing and higher-value battery, charger and energy-system validation. Local equipment manufacturers also shorten service and procurement cycles, reinforcing the region’s share of global demand.

Market positionLargest region
Growth outlookAbove market average
Demand profileManufacturing and electrification led
Market access gateLocal service, price and application fit
Country / market Position in region What drives demand
China Largest demand base China combines electronics assembly, battery manufacturing, charger production and renewable-energy equipment at exceptional scale. The IEA reports that China accounted for most recent growth in global fast charging, while its battery and power-electronics industries require production and engineering test across many voltage and power ranges. Local test-equipment suppliers intensify price competition and make application support and rapid delivery important selection factors.
Japan High-specification market Japan’s automotive, battery, power semiconductor and precision-instrument industries create demand for accurate, repeatable test systems and long product support. Customers often place more weight on measurement stability, documented calibration and supplier continuity than on the lowest purchase price. Domestic test brands also create a demanding competitive environment in which remote control, reliability and service quality must match established engineering practices.
South Korea & Taiwan Electronics and data-centre supply hub South Korea and Taiwan support dense semiconductor, server, telecom and battery ecosystems. Power-supply and system manufacturers need automated electronic-load testing to validate converters and server rails before shipment, while battery and energy programmes increase demand for higher-power systems. The combination rewards suppliers with multi-channel automation, fast transient performance and regional application engineers who can integrate instruments into production lines.

Market instances

  • China remains central to charging deployment. The IEA reported that around two-thirds of global public-charger growth since 2020 occurred in China and that the country accounted for 80% of global fast-charger growth in 2024. That scale increases charger and power-module production, which expands the addressable base for high-voltage electronic-load validation and production testing.
  • Battery manufacturing adds a second power-test engine. Global EV battery demand exceeded 950 GWh in 2024, and China recorded growth above 30%. Every expansion in battery output creates test needs at cell, module, pack, charger and power-conversion levels, so the regional opportunity is broader than the final vehicle-assembly count alone.
  • Local equipment supply changes pricing dynamics. Chinese and Taiwanese electronic-load manufacturers can serve production and laboratory accounts with short lead times and competitive hardware pricing. Global suppliers therefore defend premium positions through calibration, software compatibility, high-power regeneration and worldwide service, making Asia Pacific both the largest demand region and the most aggressive competitive arena.
In the full report: country-level market size, demand drivers, supplier positioning, application mix and forecast metrics for the dc electronic load across the markets listed above, aligned to the 2025 base year and 2026–2034 forecast window.

North America HIGH-VALUE R&D

What distinguishes North American DC electronic load demand?

North American demand is disproportionately weighted toward engineering, high-availability computing, aerospace and defense qualification rather than only production volume. That mix raises average system requirements because laboratories need accurate measurements, dynamic profiles, automation and traceable calibration. The region also contains major cloud and AI infrastructure investment, making server-power validation a durable source of demand alongside EV, charger and energy-storage development.

Market positionSecond-tier global region
Growth outlookSteady to strong in power test
Demand profileR&D, data-centre and defense led
Market access gateCalibration, automation and service
Country / market Position in region What drives demand
United States Dominant The United States combines hyperscale data-centre development, aerospace and defense programmes, power-electronics R&D and a large automotive engineering base. Buyers frequently integrate loads into automated benches that run for years, so command compatibility, calibration and supplier service can outweigh small differences in purchase price. Growth in AI infrastructure also raises server-power density and strengthens demand for faster, higher-current validation.
Canada Established niche Canada contributes telecom, aerospace, energy, research and electric-transport programmes that require precision power testing, though total volume is smaller than the United States. Harsh-environment and utility applications can place additional emphasis on reliability and long-duration testing. Canadian laboratories often source through North American distribution and service networks, making calibration access and cross-border support part of the supplier-selection process.
Mexico Manufacturing growth market Mexico’s role in North American electronics and automotive manufacturing creates production-test demand linked to near-shoring. New lines built for export frequently adopt test methods specified by U.S. or multinational engineering teams, which can favor global instrument platforms with established automation code. At the same time, local cost sensitivity creates room for value suppliers in standardized low- and medium-power production applications.

Market instances

  • Public charging continues to expand. The IEA reported almost 200,000 public light-duty charging points in the United States at the end of 2024 and projects more than 500,000 by 2030 under stated policies. Charger deployment supports validation demand for output modules, protection systems and high-voltage DC interfaces as suppliers qualify new hardware generations.
  • Server-power validation is becoming more demanding. AI and cloud infrastructure increase rack power and dynamic load variation, making simple static loading less representative of field conditions. North American data-centre supply chains therefore create demand for programmable multi-channel loads that can reproduce fast current steps and collect synchronized measurements during power-supply development.
  • Service infrastructure protects incumbent platforms. Engineering organizations reuse automated test code and calibration procedures over long periods. A supplier with regional service, traceable calibration and backward-compatible commands can remain embedded across multiple product generations, creating a commercial barrier that is not visible in raw voltage, current or power specifications.
In the full report: country-level market size, demand drivers, supplier positioning, application mix and forecast metrics for the dc electronic load across the markets listed above, aligned to the 2025 base year and 2026–2034 forecast window.

Europe AUTOMOTIVE & INDUSTRIAL

What drives DC electronic load demand in Europe?

Europe is shaped by automotive electrification, industrial power electronics, renewable-energy systems and sophisticated engineering laboratories. The region has less electronics production volume than Asia Pacific, but a high proportion of tests are specification-intensive and long-duration. That supports premium programmable and regenerative platforms where measurement confidence, energy handling and integration with automated validation systems create more value than the lowest equipment purchase price.

Market positionMajor high-value region
Growth outlookModerate
Demand profileAutomotive and industrial power led
Market access gateTechnical compliance and lifecycle support
Country / market Position in region What drives demand
Germany Largest regional engineering base Germany’s automotive, industrial automation, power electronics and machinery sectors create sustained validation requirements for batteries, converters, chargers and industrial power supplies. Engineering teams often qualify equipment into long-lived production and laboratory systems, so test repeatability, traceable calibration and lifecycle support matter. High utilization and electricity cost can also improve the payback case for regenerative loads that reduce waste heat.
France Aerospace, energy and mobility France combines aerospace, defense, rail, automotive and energy-system engineering. These applications reward high measurement confidence and controlled dynamic profiles because the test result may support formal design verification. Local service and calibration shorten downtime, while programmable interfaces matter for laboratories that integrate electronic loads with sources, oscilloscopes, safety systems and environmental equipment in complex automated benches.
United Kingdom & Nordics R&D and energy systems The United Kingdom and Nordic markets contribute power-electronics R&D, telecom, renewable-energy and electrified-transport activity. Their demand profile favors flexible programmable systems that can be reused across changing projects rather than dedicated fixed loads. Energy-efficiency considerations can be particularly important for long-duration high-power testing, strengthening interest in regenerative architectures where utilization justifies the capital premium.

Market instances

  • Europe added more than 275,000 public charging points in 2024. IEA data show the regional public network surpassed 1 million points, with growth above 35%. That infrastructure expansion creates validation work for charger manufacturers, power-module suppliers and certification laboratories, particularly as fast and ultra-fast charging raises the voltage and power handled by each test cell.
  • Automotive battery demand remained substantial despite slower 2024 growth. The IEA reports that European Union EV battery demand was broadly flat in 2024 while the global market grew. This contrary evidence matters commercially: electronic-load demand can still rise through higher test complexity, charging power and new vehicle platforms even when regional battery-volume growth is not the strongest globally.
  • Energy recovery has a stronger economic argument in high-cost facilities. High-power battery and converter tests can run for hours and convert absorbed electricity into heat. Regenerative loads reduce both wasted electricity and cooling demand, giving European engineering centers a total-cost rationale for replacing resistor banks or conventional dissipative loads when utilization is high.
In the full report: country-level market size, demand drivers, supplier positioning, application mix and forecast metrics for the dc electronic load across the markets listed above, aligned to the 2025 base year and 2026–2034 forecast window.

South America IMPORT-DEPENDENT

Where is demand developing in South America?

South American demand is smaller and more project-driven than in the three largest regions. Brazil and selected industrial markets create requirements for automotive, renewable-energy, telecom and general power-electronics testing, but imported equipment cost and service availability shape purchasing decisions. Flexible platforms that can be shared across multiple programmes are attractive because laboratories often need to maximize utilization before approving specialized high-power systems.

Market positionSmaller global share
Growth outlookSelective
Demand profileIndustrial and energy project led
Market access gateLanded cost and distributor support
Country / market Position in region What drives demand
Brazil Largest regional market Brazil combines vehicle manufacturing, renewable-energy investment, telecom infrastructure and research institutions, producing the broadest regional demand for DC power testing. Buyers may use electronic loads for battery systems, converters, industrial power supplies and laboratory education. Import duties and logistics raise acquisition cost, so local distributors, repair capability and multi-purpose systems that can support several programmes are commercially important.
Chile Energy and mining applications Chile’s mining and renewable-energy sectors create specialized power-electronics requirements, including converters, storage and DC systems operating in demanding environments. Test volumes are smaller than in Brazil but can involve high power and long-duration validation. Procurement tends to favor robust systems with remote control and strong support because equipment may be used far from major service centers.
Argentina & Colombia Selective industrial demand Argentina and Colombia provide smaller demand pockets in electronics, energy, universities, telecom and industrial maintenance. Capital budgets can be constrained and exchange-rate exposure raises the value of platforms that cover several test modes. Suppliers that offer modular systems, regional distribution and remote applications support can compete more effectively than vendors that require factory-level service for routine configuration or repair.

Market instances

  • Electrification creates targeted rather than uniform demand. IEA battery data show emerging markets outside China remain a small global share but are growing from a low base, including Brazil. This creates project-specific opportunities for battery and charger validation without implying the same production-test scale seen in East Asia.
  • Renewable-energy projects expand converter testing. Solar and storage installations require DC/DC and DC/AC power stages, and engineering teams need controllable loads for efficiency, thermal and protection testing. The regional opportunity favors versatile high-voltage instruments that can move between energy projects rather than narrowly optimized production-line hardware.
  • Distribution quality directly affects purchase decisions. Heavy high-power equipment is expensive to ship internationally for service. A supplier that stocks replacement parts, provides remote applications support and can arrange calibration locally reduces lifecycle risk, which can offset a higher headline instrument price in markets where import logistics are slow or volatile.
In the full report: country-level market size, demand drivers, supplier positioning, application mix and forecast metrics for the dc electronic load across the markets listed above, aligned to the 2025 base year and 2026–2034 forecast window.

Middle East & Africa PROJECT-LED

What is the opportunity in the Middle East & Africa?

The Middle East & Africa market is smaller but can produce high-value project demand in energy, telecom, defense, laboratories and infrastructure modernization. The region does not have the same high-volume electronics manufacturing base as Asia Pacific, so purchases are more episodic and specification-driven. High-voltage and high-power loads can be attractive where renewable energy, storage or critical-power systems require local commissioning and validation.

Market positionSmallest base
Growth outlookEmerging
Demand profileEnergy, telecom and infrastructure led
Market access gateProject support and supply reliability
Country / market Position in region What drives demand
Gulf Cooperation Council Energy and infrastructure hub Gulf markets invest in data centers, renewable-energy projects, utility modernization and advanced infrastructure, creating demand for power-conversion and storage testing. Projects are often delivered by multinational engineering firms, so instrument brands with global specifications and regional distributor support can be favored. High ambient temperatures also raise the importance of thermal design and operating derating in sustained high-power tests.
Israel R&D-intensive niche Israel’s electronics, defense, semiconductor and power-technology research base supports precision laboratory demand despite a small domestic production volume. Engineering teams value programmable loads that integrate with broader automated benches and can cover fast-changing prototype requirements. Supplier selection is therefore driven by technical performance and software flexibility more than by the high-volume production economics common in East Asian manufacturing hubs.
South Africa & North Africa Telecom and industrial demand South Africa and North African markets contribute telecom power, industrial maintenance, renewable-energy and university test requirements. Projects can be geographically dispersed, increasing the value of robust hardware and remote support. Import dependence and budget constraints encourage shared laboratory assets and modular systems that can serve multiple voltage and power ranges rather than highly specialized single-purpose platforms.

Market instances

  • Data-centre investment creates a new power-test channel. New regional cloud and AI infrastructure requires server power supplies, backup systems and conversion equipment to meet high availability targets. Even when final server hardware is imported, local integration, commissioning and supplier qualification can generate demand for programmable loads and power analyzers.
  • Renewable-energy and storage projects favor high-voltage flexibility. Solar, battery and grid-support systems operate across wide DC ranges and often require long-duration validation. A high-voltage regenerative load can serve inverter, storage and converter programmes while reducing facility heat, making it more useful than a fixed load bank for engineering organizations with varied project portfolios.
  • Distributor capability is a market-access requirement. The installed base is geographically dispersed and high-power equipment is costly to ship for service. Vendors that train local partners, maintain spares and provide remote engineering support can win project specifications because buyers evaluate downtime and commissioning risk alongside electrical performance.
In the full report: country-level market size, demand drivers, supplier positioning, application mix and forecast metrics for the dc electronic load across the markets listed above, aligned to the 2025 base year and 2026–2034 forecast window.

Competitive Landscape

Competition combines a small group of global test-and-measurement brands with specialized high-power suppliers and value-oriented Asian manufacturers. The source report names Keysight, Chroma, ITECH and Ametek among the leading companies, while NH Research, Kikusui, NF, B&K Precision and regional firms compete through specific power ranges, automation features, local service and price-performance positioning.

Premium suppliers defend R&D and regulated-industry accounts through measurement accuracy, calibration infrastructure, software continuity and installed-base compatibility. Once a laboratory has built scripts, fixtures and pass/fail methods around an instrument family, replacement decisions include switching cost beyond the hardware price. This favors vendors that maintain long product lifecycles, backward-compatible commands and service organizations able to calibrate or repair instruments close to the customer.

High-power competition is increasingly shaped by regenerative operation and modular scaling. ITECH’s IT8000 family, for example, is designed for high-voltage and high-power test with parallel expansion and energy recovery, while Chroma offers dedicated high-power DC load platforms. These architectures compete on facility economics as much as electrical performance: heat rejected into the room, electrical infrastructure, rack density and test-cycle duration all affect the customer’s cost per validation hour.

Value-segment manufacturers compete effectively where buyers need broad functionality at lower capital cost and can rely on local distributors for support. That pressure is strongest in production engineering, education and general industrial testing. Global brands therefore protect margin by bundling application software, traceable calibration, warranty response, higher measurement confidence and integration support rather than trying to match every low-price instrument on headline specifications.

Competitive tier Representative participants How competition works
Global precision platforms Keysight (Agilent); Ametek Inc. (Programmable Power); NH Research (NHR) These suppliers compete for R&D, aerospace, defense, advanced power and automated-test accounts where calibration, measurement confidence, software continuity and service availability are central to qualification. Their commercial moat is an installed ecosystem of test code, support and traceable measurement processes, which raises the cost of replacing the instrument even when another supplier offers similar headline voltage and current ratings.
High-power and automation specialists Chroma ATE; ITECH Electronic; Kikusui Electronics; NF Corporation This tier competes through dense programmable functionality, wide power envelopes, modularity, regenerative options and faster adaptation to EV, charger, storage and converter test requirements. Product roadmaps increasingly emphasize bidirectional or regenerative operation, parallel scaling, waveform control and communications interfaces so the instrument can become part of a larger automated validation cell rather than operate as an isolated bench load.
Value and regional suppliers B&K Precision; Prodigit Electronics; Maynuo Electronic; Array Electronic; Dahua Electronic; Ainuo Instrument; Unicorn These participants address cost-sensitive production, education, service and general industrial accounts. They win where basic programmable modes, adequate accuracy and local availability matter more than the deepest software ecosystem. Their presence keeps price pressure high in low- and medium-power categories, pushing leading vendors toward application-specific software, service and higher-power architectures where differentiation is easier to sustain.

Companies profiled in the report

The source report profiles the following electronic-load manufacturers across precision instrumentation, high-power systems and value-oriented regional supply. The names are preserved exactly so the competitive universe remains aligned with the published report. The tier table above then separates premium measurement platforms, high-power automation specialists and value suppliers because their customer requirements, service models and pricing structures differ materially even when all sell equipment that can sink controlled DC power.

  • Keysight (Agilent)
  • Chroma ATE Inc.
  • ITECH Electronic Co., Ltd.
  • Ametek Inc. (Programmable Power)
  • NH Research, Inc. (NHR)
  • Kikusui Electronics Corporation
  • NF Corporation
  • B&K Precision Corporation
  • Unicorn
  • Dahua Electronic
  • Maynuo Electronic
  • Prodigit Electronics Co., Ltd.
  • Array Electronic
  • Ainuo Instrument

Production Capacity Analysis

Production capacity in this market is not measured by wafer starts or chemical output; it is constrained by the ability to build, calibrate and service precision power-electronic systems. Capacity therefore sits where power semiconductor sourcing, instrument engineering, metalwork, thermal design, firmware development and calibration infrastructure can be coordinated at scale, with Asia Pacific holding a strong manufacturing position and North America, Japan and Europe retaining important high-end engineering capabilities.

Electronic-load manufacturing requires a dependable supply of power MOSFETs or IGBTs, current shunts, precision amplifiers, ADCs, controllers, magnetics, fans or liquid-cooling hardware and safety components. A supplier can expand assembly floor space quickly, but qualified substitutions for precision or high-power components may require hardware redesign and revalidation. That makes semiconductor availability and thermal-component lead times more meaningful capacity constraints than final assembly labour alone.

Calibration and burn-in are additional bottlenecks because a completed instrument must meet accuracy and stability specifications across voltage, current, power and temperature. High-power systems also need safe test bays and substantial facility power. Manufacturers that own regional calibration laboratories can turn service capacity into a sales advantage because customers in production and regulated sectors often cannot tolerate long instrument downtime or international shipping for recertification.

Regenerative platforms shift part of the capacity challenge from heat dissipation toward grid-interface engineering. Returning test energy to the facility reduces room cooling and resistor-bank requirements, but it adds power-conversion stages, control loops, EMC design and compliance work. Suppliers with expertise in both precision measurement and bidirectional power electronics are therefore better positioned as battery and charger test cells move to hundreds of kilowatts and parallel megawatt-class configurations.

Market Dynamics

The market grows when more power-conversion products require automated validation and when each validation job becomes more demanding. Electrification and data-centre power raise the value of high-power, programmable and regenerative loads, while mature low-voltage production testing keeps a large installed base. The balancing forces are capital discipline, long instrument replacement cycles and growing pressure to integrate new loads into existing software and fixtures.

The core market mechanism is a change in test complexity rather than a simple increase in unit shipments. A conventional fixed load can verify a basic supply, but modern batteries, chargers and server power systems must be tested under transient, fault and communication-linked conditions. That pushes spending toward instruments with faster control, logging and automation. At the same time, laboratories reuse high-quality equipment for many years, so growth depends on new applications and capability upgrades rather than annual replacement of the installed base.

Market Drivers

Growth forces shaping the 2026–2034 outlook
Driver Directional impact* Commercial mechanism
EV batteries and charging infrastructure High Battery packs, onboard chargers, DC fast chargers and associated converters require controlled discharge, dynamic profiles and protection testing. IEA data show EV battery demand above 950 GWh in 2024 and more than 1.3 million public charging points added in the same year, creating more engineering and production test points across the value chain.
Data-centre and server power density High Server power is the largest application in the source scope. More compute per rack increases current density and makes transient behaviour, redundancy and conversion efficiency central to power-supply qualification. Programmable multi-channel loads allow engineers to reproduce rapidly changing rail conditions and automate long regression sequences before a supply or power shelf enters production.
Renewable energy and storage power conversion Medium-High Solar, storage and grid-support systems contain DC/DC and DC/AC conversion stages that must be validated across voltage, current and fault conditions. High-voltage electronic loads give developers a controllable sink for converter output, while regenerative models reduce the facility cost of long full-power tests and can be scaled in parallel for larger systems.
Automation of production and validation Medium Programmable loads can be controlled through standard interfaces and incorporated into automated test equipment, allowing the same sequence to be repeated across engineering samples and production units. Automated data capture improves traceability and reduces operator variability, especially when products have many operating states or require long qualification cycles.

EV batteries and charging infrastructure

Electrification broadens the addressable test workload at both the component and system level. Battery cells and modules require characterization, packs require high-current discharge and safety validation, and charging equipment requires sustained and transient output testing across its operating range. As vehicle platforms migrate to higher voltage and charging power, suppliers can sell higher-value regenerative and parallel systems, not merely more low-power instruments. The commercial benefit therefore comes from both test-station count and higher average system value.

Data-centre and server power density

AI and cloud infrastructure increase the consequences of a power-system failure because a single rack carries more compute value and thermal load. Power suppliers must prove response to abrupt demand changes, protection events and sustained high utilization. That creates demand for fast slew rates, synchronized channels and software-driven sequences. Vendors that integrate measurement and automation can capture more of the test cell because engineers prefer a validated workflow over assembling separate instruments and custom control code.

Renewable energy and storage power conversion

Renewable-energy hardware shifts electronic-load demand toward longer-duration and higher-energy tests. A converter may need thermal-soak testing, efficiency mapping and fault recovery across many operating points rather than a short bench check. In those scenarios, wasting all absorbed power as heat becomes expensive. Regeneration changes the economics by returning energy to the building supply, which can justify a higher equipment price when utilization is high and cooling infrastructure would otherwise be substantial.

Automation of production and validation

Automation turns software compatibility into a purchasing criterion. Once a manufacturer has written test sequences around a command set and integrated results into manufacturing systems, instrument replacement is evaluated on migration effort as well as price. Suppliers that preserve remote-command compatibility, publish robust APIs and offer reusable application libraries can therefore build recurring business across product generations. This dynamic also supports modular mainframes because capacity can be added while the existing automation stack remains intact.

Market Restraints

Constraints that can slow conversion of technical demand into revenue
Restraint Directional impact* Commercial mechanism
High acquisition and facility cost Medium-High High-power precision loads can require substantial capital, three-phase facility power, cooling, safety infrastructure and calibration support. The cost is especially visible for smaller laboratories and low-utilization programmes, where the instrument may sit idle for long periods and a simpler resistor bank or shared test resource can appear economically sufficient.
Long replacement cycles Medium Well-maintained electronic loads remain useful for many years because the basic electrical functions do not become obsolete as quickly as computing equipment. Laboratories may add channels or power rather than replace a complete platform, which limits recurring unit demand and makes growth dependent on new applications, higher voltage ranges or software requirements.
Integration with existing automated test equipment Medium New loads must communicate with legacy controllers, fixtures, safety interlocks and data systems. Differences in command syntax, timing, drivers or trigger behaviour can force software redevelopment and validation, raising switching cost and slowing adoption even when a new instrument has better electrical specifications.
Price pressure in low- and medium-power segments Medium Numerous global and regional suppliers offer programmable loads for common voltage and power ranges, increasing price transparency and reducing hardware margins. Buyers that do not require deep calibration support or high-end transient performance can choose lower-cost alternatives, particularly in education, service and general production testing.

High acquisition and facility cost

The restraint is strongest at the point where technical capability outruns utilization. A regenerative or megawatt-scalable platform can lower operating cost, but its economics depend on enough test hours to recover the acquisition premium. Suppliers therefore need to sell on total cost of ownership, including recovered energy, reduced cooling and faster automation. Financing, modular expansion and shared platforms can widen adoption, but capital approval remains a real gate in cyclical industrial markets.

Long replacement cycles

Installed-base durability is a positive service attribute but a structural restraint on hardware growth. A customer with adequate voltage, current and accuracy has little reason to replace equipment solely because a newer model exists. Vendors must therefore create upgrade value through greater channel density, regeneration, faster transients, improved low-voltage performance or automation. Service and calibration revenue can offset slower replacement, but it does not create the same hardware growth as a rapidly turning installed base.

Integration with existing automated test equipment

Integration risk becomes commercially important in production because test software is part of the manufacturing process. A minor change in command timing can affect throughput or pass/fail results, so engineering teams often prefer an incumbent instrument family. Suppliers can reduce this barrier with emulation modes, backward-compatible command sets, documented APIs and migration support. The result is a market where software continuity and application engineering can protect share as effectively as a small advantage in measurement accuracy.

Price pressure in low- and medium-power segments

Price pressure pushes the market toward segmentation. Global brands protect value in high-accuracy, high-power and integrated systems, while value suppliers expand in standardized bench categories. This can slow revenue growth even when unit demand rises because average selling prices in mature classes are contested. The strategic response is to attach software, calibration, service, application expertise and energy-saving features that are harder to compare on a simple specification table.

Market Opportunities

The best opportunities sit where rising power levels and automation create a measurable economic reason to upgrade the test cell. Regenerative battery and charger testing, dense server-power validation, modular production systems and application-specific software let suppliers move beyond commodity current sinking and capture value through energy recovery, throughput, traceability and engineering support.

Regenerative high-power battery test

Vehicle and stationary-storage programmes run long, high-energy discharge tests that can turn conventional electronic loads into major heat sources. Regenerative systems return much of that energy to the facility, cutting cooling demand and enabling denser test bays. Suppliers that combine high voltage, parallel scaling, protection logic and accurate low-current operation can serve both large traction packs and smaller module programmes within one expandable architecture.

Ultra-fast charger and high-voltage converter validation

Charging infrastructure is moving toward higher power and voltage, increasing the importance of stable high-voltage loading, fault simulation and long-duration full-power tests. Electronic-load vendors can package hardware, safety interlocks and automation for charger manufacturers rather than selling a generic instrument. The opportunity is especially attractive when the same platform can validate power modules, complete chargers and associated DC/DC stages across development and production.

Software-defined production test

Manufacturers want one test platform to execute multiple product recipes, capture results and feed manufacturing systems. A vendor that supplies APIs, reusable sequence libraries and remote fleet management can create switching costs that a hardware-only competitor cannot match. Software also supports recurring value through updates and application packages, helping suppliers defend margins in low- and medium-power hardware classes where specification-based price competition is strongest.

Modular expansion for laboratories and contract manufacturers

Contract manufacturers and shared laboratories face uncertain future power requirements, so large fixed systems can be difficult to justify. Modular mainframes and parallel power blocks let customers start with a smaller investment and add channels or kilowatts as programmes mature. This aligns supplier revenue with customer utilization and reduces the risk that a laboratory overbuys capacity before a new EV, server or energy-storage programme reaches volume.

Supply Chain Analysis

The supply chain begins with precision power-electronic and measurement components, moves through load-module design and system assembly, then into software, calibration, distribution and field support. Value capture increases where suppliers combine electrical performance with automation and service because the finished product becomes part of a qualification process rather than a stand-alone piece of hardware.

Stage 1
Power and precision components
Power semiconductors, shunts, amplifiers, ADCs, controllers, magnetics, protection parts and thermal hardware determine voltage, current, accuracy and reliability.
Stage 2
Load modules and power stages
Manufacturers combine switching devices, sensing, cooling and control loops into programmable channels, mainframes or regenerative high-power blocks.
Stage 3
System integration and software
Firmware, APIs, sequencing, safety interlocks, racks and application packages convert the power stage into an automated validation platform.
Stage 4
Calibration, distribution and service
Traceable calibration, local repair, applications support and distributor coverage determine uptime and lower the risk of adopting a supplier across many test cells.

Upstream components

Power semiconductors set the safe operating area and thermal efficiency, while shunts, amplifiers and converters set measurement performance. Alternate-sourcing is not always straightforward because a component change can alter stability, noise or protection behaviour and trigger requalification. High-voltage platforms add isolation and insulation requirements. Suppliers that design around broadly available parts while preserving calibration margins are more resilient when semiconductor or fan and cooling-component lead times tighten.

Instrument and module manufacturing

The manufacturer must combine electrical design, mechanical airflow, firmware and protection into a system that remains stable across its entire operating envelope. High-current low-voltage loads and high-voltage loads stress different parts of the design, so a broad portfolio often uses several hardware architectures. Modular construction improves manufacturing leverage because a common chassis, controller and software layer can support multiple power blocks and lets customers expand without changing the automation environment.

Integration and automation

System integrators add racks, contactors, interlocks, switching matrices and software that match the product under test. This stage captures substantial value in EV and high-power applications because safe sequencing and data integrity matter as much as the load itself. Instrument vendors that provide reference architectures and partner APIs can influence the broader bill of materials and make their hardware the default platform for multiple programmes within the same customer.

Calibration and lifecycle service

Calibration is essential for customers that use load measurements as part of engineering decisions or regulated quality systems. Local service reduces downtime and shipping risk, particularly for heavy high-power equipment. Lifecycle support also protects software compatibility when operating systems and automation platforms change. A supplier with service centres, spare parts and stable commands can therefore maintain accounts for many years even when competing products offer similar electrical specifications at lower initial cost.

Recent Developments

Recent external developments reinforce the demand mechanisms behind battery, charging and high-power test. They also show the product direction toward programmable and regenerative systems, where energy handling, automation and scalable power matter more than simple resistive loading. The result is a clearer shift from basic bench loading toward test platforms that can handle longer duty cycles, higher voltage, faster automation and measurable facility-energy savings.

14 May 2025

The International Energy Agency published Global EV Outlook 2025, reporting EV battery demand above 950 GWh in 2024, 25% higher than 2023. For electronic-load suppliers, that expansion matters because battery cells, modules and packs require characterization and controlled discharge at multiple development and production stages, increasing demand for programmable and high-power battery test assets.

Source: International Energy Agency

14 May 2025

The IEA also reported that more than 1.3 million public charging points were added worldwide in 2024, raising the global stock above 5 million. Faster charger deployment and rising ultra-fast charging power create a direct need for high-voltage, high-power validation of charger outputs, protection behaviour and sustained thermal performance before equipment is deployed to public networks.

Source: International Energy Agency

12 April 2024

Chroma published guidance on user-defined waveform load simulation, highlighting the use of programmable electronic loads to reproduce non-static current patterns rather than relying on fixed operating points. The development reflects a broader shift in the market: software-defined profiles make the load part of system-level validation for batteries, power supplies and converters whose real operating conditions are dynamic.

Source: Chroma Systems Solutions

2025 product portfolio

ITECH’s IT8000 regenerative DC electronic load platform supports high-voltage and high-power applications, parallel expansion and energy feedback to the grid. Regeneration is commercially important because long-duration power tests can otherwise convert all absorbed energy into facility heat, so the architecture lowers operating and cooling cost for EV, storage, charger and power-converter laboratories with high utilization.

Source: ITECH Electronic

Report Scope & Segmentation

The report scope covers DC electronic loads used to simulate controlled electrical demand for power-source testing. The segmentation below preserves the source page’s named axes and members, while the forecast fields are normalized to the 2025 base, 2026 estimate and 2034 endpoint required for this workbook. It also preserves the published type, application, end-user, programmability and power-rating definitions so each workbook row remains traceable to the report scope.

Scope attribute Coverage
Market definition Programmable and static DC electronic load instruments used to sink controlled current or power from power supplies, batteries, chargers, converters, fuel cells and other DC sources for design validation, production testing and laboratory characterization.
Base / estimated / forecast years 2025 base year; 2026 estimated year; 2034 forecast end year; CAGR stated for 2026–2034.
By Type Low-Voltage Electronic Load; High-Voltage Electronic Load
By Application Server Power; Car Battery; DC Charging Pile; Others
By End User Automotive & Transportation; Telecommunications & Data Centers; Aerospace, Defense & Government; Energy & Power Utilities; Consumer Electronics & Appliances
By Programmability Programmable Loads; Manual/Static Loads
By Power Rating Low Power (Below 1 kW); Medium Power (1 kW to 10 kW); High Power (Above 10 kW)
Regions North America; Europe; Asia-Pacific; South America / Latin America; Middle East & Africa
Companies profiled Keysight (Agilent); Chroma ATE Inc.; ITECH Electronic Co., Ltd.; Ametek Inc. (Programmable Power); NH Research, Inc. (NHR); Kikusui Electronics Corporation; NF Corporation; B&K Precision Corporation; Unicorn; Dahua Electronic; Maynuo Electronic; Prodigit Electronics Co., Ltd.; Array Electronic; Ainuo Instrument

Frequently Asked Questions

What is the DC electronic load market size in 2025?

The rebased global DC electronic load market size is USD 273.0 million in 2025. This value is derived from the source page’s published anchors of USD 263 million in 2024 and USD 354 million in 2032, preserving the anchor-implied growth path rather than the printed percentage where the two disagree. Asia Pacific is the largest regional market because it combines electronics, battery and power-conversion manufacturing with a substantial local test-equipment ecosystem.

What is the market forecast for 2034?

The market is projected to reach USD 381.3 million in 2034 under the anchor-consistent series used in this overview. The 2034 endpoint extends the annual growth factor implied by the source page’s 2024 and 2032 market-size anchors. Growth is supported by server-power validation, battery and charger testing, renewable-energy power conversion and broader adoption of programmable and regenerative high-power test systems.

What CAGR is used for 2026–2034?

The market uses a CAGR of 3.8% for the 2026–2034 forecast window. The rate is the annual growth factor implied by the two published market-size anchors, not the 4.4% label printed on the source page. Applying one consistent compound rate keeps the 2025 base size, 2026 estimate and 2034 forecast mathematically aligned and avoids mixing a percentage that does not reproduce the published anchor values.

Which type is the largest?

Low-Voltage Electronic Load is the largest type in the source segmentation, with the report page placing it at about 85% of the market. Its scale reflects the broad installed base of server, telecommunications, consumer-electronics and general power-supply testing. High-voltage systems have a smaller unit base but gain strategic value as EV batteries, DC fast chargers, storage systems and renewable-energy converters move to higher voltage and power.

Which application leads the market?

Server Power is the leading application in the source report. Data-centre and server power supplies must be qualified for regulation, efficiency, transient response, protection and sustained operation across many loading states. Increasing rack density raises the value of programmable loads with fast slew rates, synchronized channels and automated sequences. Car Battery and DC Charging Pile applications provide important adjacent growth through electrification.

Why is Asia Pacific the largest region?

Asia Pacific is the largest region because it concentrates electronics manufacturing, battery production, power-conversion manufacturing and a meaningful share of electronic-load suppliers. China, Japan, South Korea and Taiwan create both production-test demand and local equipment supply. The region also leads global public charging growth and battery manufacturing, which expands demand for high-power and high-voltage validation alongside the large installed base of general electronics test.

What is driving regenerative electronic loads?

Regenerative loads return absorbed test energy to the facility instead of dissipating all of it as heat. The architecture becomes more valuable as battery, charger, storage and converter tests move to higher power and longer durations because it reduces cooling demand and operating energy. It also allows laboratories to increase power density within a test area. The trade-off is greater equipment complexity and a higher initial capital requirement.

What are the main market restraints?

The principal restraints are high capital and facility cost for advanced high-power systems, long replacement cycles, integration work with existing automated test equipment and pricing pressure in standardized low- and medium-power categories. These factors slow hardware turnover even when underlying test activity is growing. Suppliers respond with modular expansion, backward-compatible software, calibration services and regenerative operation that improves total cost of ownership.

Who are the key companies profiled?

The source report profiles Keysight, Chroma ATE, ITECH Electronic, Ametek Programmable Power, NH Research, Kikusui Electronics, NF Corporation, B&K Precision, Unicorn, Dahua Electronic, Maynuo Electronic, Prodigit Electronics, Array Electronic and Ainuo Instrument. Competitive positions differ by power range, precision, regenerative capability, software ecosystem, price and local service, so the addressable customer base is broader than a single ranking suggests.

What should buyers compare when selecting a DC electronic load?

Buyers should compare the full voltage-current-power operating envelope, transient response, measurement accuracy, protection, parallel scalability, communication interfaces, automation compatibility and calibration support. For high-utilization power tests, regenerative efficiency and cooling impact should be evaluated as part of facility cost. The correct choice depends on the device under test and workflow because a lower-cost instrument can become expensive if it requires software redevelopment or cannot scale with future programmes.

Research Sources & Evidence Base

View research sources used for this overview
  1. International Energy Agency. Global EV Outlook 2025 – Electric vehicle batteries, 2024 EV battery demand, regional deployment and growth evidence.
  2. International Energy Agency. Global EV Outlook 2025 – Electric vehicle charging, 2024 public charging additions, fast-charging growth and regional charging evidence.
  3. Keysight Technologies. N3300 Series Modular DC Electronic Loads, modular electronic-load architecture and precision test capabilities.
  4. Chroma Systems Solutions. DC Electronic Loads, product architectures across programmable and high-power DC loading.
  5. Chroma Systems Solutions. User Defined Waveform Load Simulation, programmable dynamic waveform simulation use case, published 12 April 2024.
  6. ITECH Electronic. IT8000 Regenerative DC Electronic Load, high-voltage, parallel, regenerative load architecture and energy-recovery capability.
  7. B&K Precision. 8600B Series DC Electronic Loads, programmable bench-load functionality and general test positioning.
DC Electronic Load Market, Trends, Business Strategies 2026-2034

Get Sample Report PDF for Exclusive Insights

Report Sample Includes

  • Table of Contents
  • List of Tables & Figures
  • Charts, Research Methodology, and more...

PDF Icon Download Sample Report PDF

Download Sample Report

Table of Content

1 Introduction to Research & Analysis Reports
1.1 DC Electronic Load Market Definition
1.2 Market Segments
1.2.1 Segment by Type
1.2.2 Segment by Application
1.3 Global DC Electronic Load Market Overview
1.4 Features & Benefits of This Report
1.5 Methodology & Sources of Information
1.5.1 Research Methodology
1.5.2 Research Process
1.5.3 Base Year
1.5.4 Report Assumptions & Caveats
2 Global DC Electronic Load Overall Market Size
2.1 Global DC Electronic Load Market Size: 2024 VS 2032
2.2 Global DC Electronic Load Market Size, Prospects & Forecasts: 2020-2032
2.3 Global DC Electronic Load Sales: 2020-2032
3 Company Landscape
3.1 Top DC Electronic Load Players in Global Market
3.2 Top Global DC Electronic Load Companies Ranked by Revenue
3.3 Global DC Electronic Load Revenue by Companies
3.4 Global DC Electronic Load Sales by Companies
3.5 Global DC Electronic Load Price by Manufacturer (2020-2025)
3.6 Top 3 and Top 5 DC Electronic Load Companies in Global Market, by Revenue in 2024
3.7 Global Manufacturers DC Electronic Load Product Type
3.8 Tier 1, Tier 2, and Tier 3 DC Electronic Load Players in Global Market
3.8.1 List of Global Tier 1 DC Electronic Load Companies
3.8.2 List of Global Tier 2 and Tier 3 DC Electronic Load Companies
4 Sights by Product
4.1 Overview
4.1.1 Segment by Type – Global DC Electronic Load Market Size Markets, 2024 & 2032
4.1.2 High-Voltage Electronic Load
4.1.3 Low-Voltage Electronic Load
4.2 Segment by Type – Global DC Electronic Load Revenue & Forecasts
4.2.1 Segment by Type – Global DC Electronic Load Revenue, 2020-2025
4.2.2 Segment by Type – Global DC Electronic Load Revenue, 2026-2032
4.2.3 Segment by Type – Global DC Electronic Load Revenue Market Share, 2020-2032
4.3 Segment by Type – Global DC Electronic Load Sales & Forecasts
4.3.1 Segment by Type – Global DC Electronic Load Sales, 2020-2025
4.3.2 Segment by Type – Global DC Electronic Load Sales, 2026-2032
4.3.3 Segment by Type – Global DC Electronic Load Sales Market Share, 2020-2032
4.4 Segment by Type – Global DC Electronic Load Price (Manufacturers Selling Prices), 2020-2032
5 Sights by Application
5.1 Overview
5.1.1 Segment by Application – Global DC Electronic Load Market Size, 2024 & 2032
5.1.2 Car Battery
5.1.3 DC Charging Pile
5.1.4 Server Power
5.1.5 Others
5.2 Segment by Application – Global DC Electronic Load Revenue & Forecasts
5.2.1 Segment by Application – Global DC Electronic Load Revenue, 2020-2025
5.2.2 Segment by Application – Global DC Electronic Load Revenue, 2026-2032
5.2.3 Segment by Application – Global DC Electronic Load Revenue Market Share, 2020-2032
5.3 Segment by Application – Global DC Electronic Load Sales & Forecasts
5.3.1 Segment by Application – Global DC Electronic Load Sales, 2020-2025
5.3.2 Segment by Application – Global DC Electronic Load Sales, 2026-2032
5.3.3 Segment by Application – Global DC Electronic Load Sales Market Share, 2020-2032
5.4 Segment by Application – Global DC Electronic Load Price (Manufacturers Selling Prices), 2020-2032
6 Sights by Region
6.1 By Region – Global DC Electronic Load Market Size, 2024 & 2032
6.2 By Region – Global DC Electronic Load Revenue & Forecasts
6.2.1 By Region – Global DC Electronic Load Revenue, 2020-2025
6.2.2 By Region – Global DC Electronic Load Revenue, 2026-2032
6.2.3 By Region – Global DC Electronic Load Revenue Market Share, 2020-2032
6.3 By Region – Global DC Electronic Load Sales & Forecasts
6.3.1 By Region – Global DC Electronic Load Sales, 2020-2025
6.3.2 By Region – Global DC Electronic Load Sales, 2026-2032
6.3.3 By Region – Global DC Electronic Load Sales Market Share, 2020-2032
6.4 North America
6.4.1 By Country – North America DC Electronic Load Revenue, 2020-2032
6.4.2 By Country – North America DC Electronic Load Sales, 2020-2032
6.4.3 United States DC Electronic Load Market Size, 2020-2032
6.4.4 Canada DC Electronic Load Market Size, 2020-2032
6.4.5 Mexico DC Electronic Load Market Size, 2020-2032
6.5 Europe
6.5.1 By Country – Europe DC Electronic Load Revenue, 2020-2032
6.5.2 By Country – Europe DC Electronic Load Sales, 2020-2032
6.5.3 Germany DC Electronic Load Market Size, 2020-2032
6.5.4 France DC Electronic Load Market Size, 2020-2032
6.5.5 U.K. DC Electronic Load Market Size, 2020-2032
6.5.6 Italy DC Electronic Load Market Size, 2020-2032
6.5.7 Russia DC Electronic Load Market Size, 2020-2032
6.5.8 Nordic Countries DC Electronic Load Market Size, 2020-2032
6.5.9 Benelux DC Electronic Load Market Size, 2020-2032
6.6 Asia
6.6.1 By Region – Asia DC Electronic Load Revenue, 2020-2032
6.6.2 By Region – Asia DC Electronic Load Sales, 2020-2032
6.6.3 China DC Electronic Load Market Size, 2020-2032
6.6.4 Japan DC Electronic Load Market Size, 2020-2032
6.6.5 South Korea DC Electronic Load Market Size, 2020-2032
6.6.6 Southeast Asia DC Electronic Load Market Size, 2020-2032
6.6.7 India DC Electronic Load Market Size, 2020-2032
6.7 South America
6.7.1 By Country – South America DC Electronic Load Revenue, 2020-2032
6.7.2 By Country – South America DC Electronic Load Sales, 2020-2032
6.7.3 Brazil DC Electronic Load Market Size, 2020-2032
6.7.4 Argentina DC Electronic Load Market Size, 2020-2032
6.8 Middle East & Africa
6.8.1 By Country – Middle East & Africa DC Electronic Load Revenue, 2020-2032
6.8.2 By Country – Middle East & Africa DC Electronic Load Sales, 2020-2032
6.8.3 Turkey DC Electronic Load Market Size, 2020-2032
6.8.4 Israel DC Electronic Load Market Size, 2020-2032
6.8.5 Saudi Arabia DC Electronic Load Market Size, 2020-2032
6.8.6 UAE DC Electronic Load Market Size, 2020-2032
7 Manufacturers & Brands Profiles
7.1 Keysight (Agilent)
7.1.1 Keysight (Agilent) Company Summary
7.1.2 Keysight (Agilent) Business Overview
7.1.3 Keysight (Agilent) DC Electronic Load Major Product Offerings
7.1.4 Keysight (Agilent) DC Electronic Load Sales and Revenue in Global (2020-2025)
7.1.5 Keysight (Agilent) Key News & Latest Developments
7.2 Chroma
7.2.1 Chroma Company Summary
7.2.2 Chroma Business Overview
7.2.3 Chroma DC Electronic Load Major Product Offerings
7.2.4 Chroma DC Electronic Load Sales and Revenue in Global (2020-2025)
7.2.5 Chroma Key News & Latest Developments
7.3 ITECH
7.3.1 ITECH Company Summary
7.3.2 ITECH Business Overview
7.3.3 ITECH DC Electronic Load Major Product Offerings
7.3.4 ITECH DC Electronic Load Sales and Revenue in Global (2020-2025)
7.3.5 ITECH Key News & Latest Developments
7.4 Ametek
7.4.1 Ametek Company Summary
7.4.2 Ametek Business Overview
7.4.3 Ametek DC Electronic Load Major Product Offerings
7.4.4 Ametek DC Electronic Load Sales and Revenue in Global (2020-2025)
7.4.5 Ametek Key News & Latest Developments
7.5 NH Research
7.5.1 NH Research Company Summary
7.5.2 NH Research Business Overview
7.5.3 NH Research DC Electronic Load Major Product Offerings
7.5.4 NH Research DC Electronic Load Sales and Revenue in Global (2020-2025)
7.5.5 NH Research Key News & Latest Developments
7.6 Kikusui
7.6.1 Kikusui Company Summary
7.6.2 Kikusui Business Overview
7.6.3 Kikusui DC Electronic Load Major Product Offerings
7.6.4 Kikusui DC Electronic Load Sales and Revenue in Global (2020-2025)
7.6.5 Kikusui Key News & Latest Developments
7.7 NF Corporation
7.7.1 NF Corporation Company Summary
7.7.2 NF Corporation Business Overview
7.7.3 NF Corporation DC Electronic Load Major Product Offerings
7.7.4 NF Corporation DC Electronic Load Sales and Revenue in Global (2020-2025)
7.7.5 NF Corporation Key News & Latest Developments
7.8 B&K Precision Corporation
7.8.1 B&K Precision Corporation Company Summary
7.8.2 B&K Precision Corporation Business Overview
7.8.3 B&K Precision Corporation DC Electronic Load Major Product Offerings
7.8.4 B&K Precision Corporation DC Electronic Load Sales and Revenue in Global (2020-2025)
7.8.5 B&K Precision Corporation Key News & Latest Developments
7.9 Unicorn
7.9.1 Unicorn Company Summary
7.9.2 Unicorn Business Overview
7.9.3 Unicorn DC Electronic Load Major Product Offerings
7.9.4 Unicorn DC Electronic Load Sales and Revenue in Global (2020-2025)
7.9.5 Unicorn Key News & Latest Developments
7.10 Dahua Electronic
7.10.1 Dahua Electronic Company Summary
7.10.2 Dahua Electronic Business Overview
7.10.3 Dahua Electronic DC Electronic Load Major Product Offerings
7.10.4 Dahua Electronic DC Electronic Load Sales and Revenue in Global (2020-2025)
7.10.5 Dahua Electronic Key News & Latest Developments
7.11 Maynuo Electronic
7.11.1 Maynuo Electronic Company Summary
7.11.2 Maynuo Electronic Business Overview
7.11.3 Maynuo Electronic DC Electronic Load Major Product Offerings
7.11.4 Maynuo Electronic DC Electronic Load Sales and Revenue in Global (2020-2025)
7.11.5 Maynuo Electronic Key News & Latest Developments
7.12 Prodigit
7.12.1 Prodigit Company Summary
7.12.2 Prodigit Business Overview
7.12.3 Prodigit DC Electronic Load Major Product Offerings
7.12.4 Prodigit DC Electronic Load Sales and Revenue in Global (2020-2025)
7.12.5 Prodigit Key News & Latest Developments
7.13 Array Electronic
7.13.1 Array Electronic Company Summary
7.13.2 Array Electronic Business Overview
7.13.3 Array Electronic DC Electronic Load Major Product Offerings
7.13.4 Array Electronic DC Electronic Load Sales and Revenue in Global (2020-2025)
7.13.5 Array Electronic Key News & Latest Developments
7.14 Ainuo Instrument
7.14.1 Ainuo Instrument Company Summary
7.14.2 Ainuo Instrument Business Overview
7.14.3 Ainuo Instrument DC Electronic Load Major Product Offerings
7.14.4 Ainuo Instrument DC Electronic Load Sales and Revenue in Global (2020-2025)
7.14.5 Ainuo Instrument Key News & Latest Developments
8 Global DC Electronic Load Production Capacity, Analysis
8.1 Global DC Electronic Load Production Capacity, 2020-2032
8.2 DC Electronic Load Production Capacity of Key Manufacturers in Global Market
8.3 Global DC Electronic Load Production by Region
9 Key Market Trends, Opportunity, Drivers and Restraints
9.1 Market Opportunities & Trends
9.2 Market Drivers
9.3 Market Restraints
10 DC Electronic Load Supply Chain Analysis
10.1 DC Electronic Load Industry Value Chain
10.2 DC Electronic Load Upstream Market
10.3 DC Electronic Load Downstream and Clients
10.4 Marketing Channels Analysis
10.4.1 Marketing Channels
10.4.2 DC Electronic Load Distributors and Sales Agents in Global
11 Conclusion
12 Appendix
12.1 Note
12.2 Examples of Clients
12.3 DisclaimerList of Tables
Table 1. Key Players of DC Electronic Load in Global Market
Table 2. Top DC Electronic Load Players in Global Market, Ranking by Revenue (2024)
Table 3. Global DC Electronic Load Revenue by Companies, (US$, Mn), 2020-2025
Table 4. Global DC Electronic Load Revenue Share by Companies, 2020-2025
Table 5. Global DC Electronic Load Sales by Companies, (Units), 2020-2025
Table 6. Global DC Electronic Load Sales Share by Companies, 2020-2025
Table 7. Key Manufacturers DC Electronic Load Price (2020-2025) & (USD/Unit)
Table 8. Global Manufacturers DC Electronic Load Product Type
Table 9. List of Global Tier 1 DC Electronic Load Companies, Revenue (US$, Mn) in 2024 and Market Share
Table 10. List of Global Tier 2 and Tier 3 DC Electronic Load Companies, Revenue (US$, Mn) in 2024 and Market Share
Table 11. Segment by Type – Global DC Electronic Load Revenue, (US$, Mn), 2024 & 2032
Table 12. Segment by Type – Global DC Electronic Load Revenue (US$, Mn), 2020-2025
Table 13. Segment by Type – Global DC Electronic Load Revenue (US$, Mn), 2026-2032
Table 14. Segment by Type – Global DC Electronic Load Sales (Units), 2020-2025
Table 15. Segment by Type – Global DC Electronic Load Sales (Units), 2026-2032
Table 16. Segment by Application – Global DC Electronic Load Revenue, (US$, Mn), 2024 & 2032
Table 17. Segment by Application – Global DC Electronic Load Revenue, (US$, Mn), 2020-2025
Table 18. Segment by Application – Global DC Electronic Load Revenue, (US$, Mn), 2026-2032
Table 19. Segment by Application – Global DC Electronic Load Sales, (Units), 2020-2025
Table 20. Segment by Application – Global DC Electronic Load Sales, (Units), 2026-2032
Table 21. By Region – Global DC Electronic Load Revenue, (US$, Mn), 2025-2032
Table 22. By Region – Global DC Electronic Load Revenue, (US$, Mn), 2020-2025
Table 23. By Region – Global DC Electronic Load Revenue, (US$, Mn), 2026-2032
Table 24. By Region – Global DC Electronic Load Sales, (Units), 2020-2025
Table 25. By Region – Global DC Electronic Load Sales, (Units), 2026-2032
Table 26. By Country – North America DC Electronic Load Revenue, (US$, Mn), 2020-2025
Table 27. By Country – North America DC Electronic Load Revenue, (US$, Mn), 2026-2032
Table 28. By Country – North America DC Electronic Load Sales, (Units), 2020-2025
Table 29. By Country – North America DC Electronic Load Sales, (Units), 2026-2032
Table 30. By Country – Europe DC Electronic Load Revenue, (US$, Mn), 2020-2025
Table 31. By Country – Europe DC Electronic Load Revenue, (US$, Mn), 2026-2032
Table 32. By Country – Europe DC Electronic Load Sales, (Units), 2020-2025
Table 33. By Country – Europe DC Electronic Load Sales, (Units), 2026-2032
Table 34. By Region – Asia DC Electronic Load Revenue, (US$, Mn), 2020-2025
Table 35. By Region – Asia DC Electronic Load Revenue, (US$, Mn), 2026-2032
Table 36. By Region – Asia DC Electronic Load Sales, (Units), 2020-2025
Table 37. By Region – Asia DC Electronic Load Sales, (Units), 2026-2032
Table 38. By Country – South America DC Electronic Load Revenue, (US$, Mn), 2020-2025
Table 39. By Country – South America DC Electronic Load Revenue, (US$, Mn), 2026-2032
Table 40. By Country – South America DC Electronic Load Sales, (Units), 2020-2025
Table 41. By Country – South America DC Electronic Load Sales, (Units), 2026-2032
Table 42. By Country – Middle East & Africa DC Electronic Load Revenue, (US$, Mn), 2020-2025
Table 43. By Country – Middle East & Africa DC Electronic Load Revenue, (US$, Mn), 2026-2032
Table 44. By Country – Middle East & Africa DC Electronic Load Sales, (Units), 2020-2025
Table 45. By Country – Middle East & Africa DC Electronic Load Sales, (Units), 2026-2032
Table 46. Keysight (Agilent) Company Summary
Table 47. Keysight (Agilent) DC Electronic Load Product Offerings
Table 48. Keysight (Agilent) DC Electronic Load Sales (Units), Revenue (US$, Mn) and Average Price (USD/Unit) & (2020-2025)
Table 49. Keysight (Agilent) Key News & Latest Developments
Table 50. Chroma Company Summary
Table 51. Chroma DC Electronic Load Product Offerings
Table 52. Chroma DC Electronic Load Sales (Units), Revenue (US$, Mn) and Average Price (USD/Unit) & (2020-2025)
Table 53. Chroma Key News & Latest Developments
Table 54. ITECH Company Summary
Table 55. ITECH DC Electronic Load Product Offerings
Table 56. ITECH DC Electronic Load Sales (Units), Revenue (US$, Mn) and Average Price (USD/Unit) & (2020-2025)
Table 57. ITECH Key News & Latest Developments
Table 58. Ametek Company Summary
Table 59. Ametek DC Electronic Load Product Offerings
Table 60. Ametek DC Electronic Load Sales (Units), Revenue (US$, Mn) and Average Price (USD/Unit) & (2020-2025)
Table 61. Ametek Key News & Latest Developments
Table 62. NH Research Company Summary
Table 63. NH Research DC Electronic Load Product Offerings
Table 64. NH Research DC Electronic Load Sales (Units), Revenue (US$, Mn) and Average Price (USD/Unit) & (2020-2025)
Table 65. NH Research Key News & Latest Developments
Table 66. Kikusui Company Summary
Table 67. Kikusui DC Electronic Load Product Offerings
Table 68. Kikusui DC Electronic Load Sales (Units), Revenue (US$, Mn) and Average Price (USD/Unit) & (2020-2025)
Table 69. Kikusui Key News & Latest Developments
Table 70. NF Corporation Company Summary
Table 71. NF Corporation DC Electronic Load Product Offerings
Table 72. NF Corporation DC Electronic Load Sales (Units), Revenue (US$, Mn) and Average Price (USD/Unit) & (2020-2025)
Table 73. NF Corporation Key News & Latest Developments
Table 74. B&K Precision Corporation Company Summary
Table 75. B&K Precision Corporation DC Electronic Load Product Offerings
Table 76. B&K Precision Corporation DC Electronic Load Sales (Units), Revenue (US$, Mn) and Average Price (USD/Unit) & (2020-2025)
Table 77. B&K Precision Corporation Key News & Latest Developments
Table 78. Unicorn Company Summary
Table 79. Unicorn DC Electronic Load Product Offerings
Table 80. Unicorn DC Electronic Load Sales (Units), Revenue (US$, Mn) and Average Price (USD/Unit) & (2020-2025)
Table 81. Unicorn Key News & Latest Developments
Table 82. Dahua Electronic Company Summary
Table 83. Dahua Electronic DC Electronic Load Product Offerings
Table 84. Dahua Electronic DC Electronic Load Sales (Units), Revenue (US$, Mn) and Average Price (USD/Unit) & (2020-2025)
Table 85. Dahua Electronic Key News & Latest Developments
Table 86. Maynuo Electronic Company Summary
Table 87. Maynuo Electronic DC Electronic Load Product Offerings
Table 88. Maynuo Electronic DC Electronic Load Sales (Units), Revenue (US$, Mn) and Average Price (USD/Unit) & (2020-2025)
Table 89. Maynuo Electronic Key News & Latest Developments
Table 90. Prodigit Company Summary
Table 91. Prodigit DC Electronic Load Product Offerings
Table 92. Prodigit DC Electronic Load Sales (Units), Revenue (US$, Mn) and Average Price (USD/Unit) & (2020-2025)
Table 93. Prodigit Key News & Latest Developments
Table 94. Array Electronic Company Summary
Table 95. Array Electronic DC Electronic Load Product Offerings
Table 96. Array Electronic DC Electronic Load Sales (Units), Revenue (US$, Mn) and Average Price (USD/Unit) & (2020-2025)
Table 97. Array Electronic Key News & Latest Developments
Table 98. Ainuo Instrument Company Summary
Table 99. Ainuo Instrument DC Electronic Load Product Offerings
Table 100. Ainuo Instrument DC Electronic Load Sales (Units), Revenue (US$, Mn) and Average Price (USD/Unit) & (2020-2025)
Table 101. Ainuo Instrument Key News & Latest Developments
Table 102. DC Electronic Load Capacity of Key Manufacturers in Global Market, 2023-2025 (Units)
Table 103. Global DC Electronic Load Capacity Market Share of Key Manufacturers, 2023-2025
Table 104. Global DC Electronic Load Production by Region, 2020-2025 (Units)
Table 105. Global DC Electronic Load Production by Region, 2026-2032 (Units)
Table 106. DC Electronic Load Market Opportunities & Trends in Global Market
Table 107. DC Electronic Load Market Drivers in Global Market
Table 108. DC Electronic Load Market Restraints in Global Market
Table 109. DC Electronic Load Raw Materials
Table 110. DC Electronic Load Raw Materials Suppliers in Global Market
Table 111. Typical DC Electronic Load Downstream
Table 112. DC Electronic Load Downstream Clients in Global Market
Table 113. DC Electronic Load Distributors and Sales Agents in Global Market

List of Figures
Figure 1. DC Electronic Load Product Picture
Figure 2. DC Electronic Load Segment by Type in 2024
Figure 3. DC Electronic Load Segment by Application in 2024
Figure 4. Global DC Electronic Load Market Overview: 2024
Figure 5. Key Caveats
Figure 6. Global DC Electronic Load Market Size: 2024 VS 2032 (US$, Mn)
Figure 7. Global DC Electronic Load Revenue: 2020-2032 (US$, Mn)
Figure 8. DC Electronic Load Sales in Global Market: 2020-2032 (Units)
Figure 9. The Top 3 and 5 Players Market Share by DC Electronic Load Revenue in 2024
Figure 10. Segment by Type – Global DC Electronic Load Revenue, (US$, Mn), 2024 & 2032
Figure 11. Segment by Type – Global DC Electronic Load Revenue Market Share, 2020-2032
Figure 12. Segment by Type – Global DC Electronic Load Sales Market Share, 2020-2032
Figure 13. Segment by Type – Global DC Electronic Load Price (USD/Unit), 2020-2032
Figure 14. Segment by Application – Global DC Electronic Load Revenue, (US$, Mn), 2024 & 2032
Figure 15. Segment by Application – Global DC Electronic Load Revenue Market Share, 2020-2032
Figure 16. Segment by Application – Global DC Electronic Load Sales Market Share, 2020-2032
Figure 17. Segment by Application -Global DC Electronic Load Price (USD/Unit), 2020-2032
Figure 18. By Region – Global DC Electronic Load Revenue, (US$, Mn), 2025 & 2032
Figure 19. By Region – Global DC Electronic Load Revenue Market Share, 2020 VS 2024 VS 2032
Figure 20. By Region – Global DC Electronic Load Revenue Market Share, 2020-2032
Figure 21. By Region – Global DC Electronic Load Sales Market Share, 2020-2032
Figure 22. By Country – North America DC Electronic Load Revenue Market Share, 2020-2032
Figure 23. By Country – North America DC Electronic Load Sales Market Share, 2020-2032
Figure 24. United States DC Electronic Load Revenue, (US$, Mn), 2020-2032
Figure 25. Canada DC Electronic Load Revenue, (US$, Mn), 2020-2032
Figure 26. Mexico DC Electronic Load Revenue, (US$, Mn), 2020-2032
Figure 27. By Country – Europe DC Electronic Load Revenue Market Share, 2020-2032
Figure 28. By Country – Europe DC Electronic Load Sales Market Share, 2020-2032
Figure 29. Germany DC Electronic Load Revenue, (US$, Mn), 2020-2032
Figure 30. France DC Electronic Load Revenue, (US$, Mn), 2020-2032
Figure 31. U.K. DC Electronic Load Revenue, (US$, Mn), 2020-2032
Figure 32. Italy DC Electronic Load Revenue, (US$, Mn), 2020-2032
Figure 33. Russia DC Electronic Load Revenue, (US$, Mn), 2020-2032
Figure 34. Nordic Countries DC Electronic Load Revenue, (US$, Mn), 2020-2032
Figure 35. Benelux DC Electronic Load Revenue, (US$, Mn), 2020-2032
Figure 36. By Region – Asia DC Electronic Load Revenue Market Share, 2020-2032
Figure 37. By Region – Asia DC Electronic Load Sales Market Share, 2020-2032
Figure 38. China DC Electronic Load Revenue, (US$, Mn), 2020-2032
Figure 39. Japan DC Electronic Load Revenue, (US$, Mn), 2020-2032
Figure 40. South Korea DC Electronic Load Revenue, (US$, Mn), 2020-2032
Figure 41. Southeast Asia DC Electronic Load Revenue, (US$, Mn), 2020-2032
Figure 42. India DC Electronic Load Revenue, (US$, Mn), 2020-2032
Figure 43. By Country – South America DC Electronic Load Revenue Market Share, 2020-2032
Figure 44. By Country – South America DC Electronic Load Sales, Market Share, 2020-2032
Figure 45. Brazil DC Electronic Load Revenue, (US$, Mn), 2020-2032
Figure 46. Argentina DC Electronic Load Revenue, (US$, Mn), 2020-2032
Figure 47. By Country – Middle East & Africa DC Electronic Load Revenue, Market Share, 2020-2032
Figure 48. By Country – Middle East & Africa DC Electronic Load Sales, Market Share, 2020-2032
Figure 49. Turkey DC Electronic Load Revenue, (US$, Mn), 2020-2032
Figure 50. Israel DC Electronic Load Revenue, (US$, Mn), 2020-2032
Figure 51. Saudi Arabia DC Electronic Load Revenue, (US$, Mn), 2020-2032
Figure 52. UAE DC Electronic Load Revenue, (US$, Mn), 2020-2032
Figure 53. Global DC Electronic Load Production Capacity (Units), 2020-2032
Figure 54. The Percentage of Production DC Electronic Load by Region, 2024 VS 2032
Figure 55. DC Electronic Load Industry Value Chain
Figure 56. Marketing Channels