SEMICONDUCTOR INSIGHT
MARKET RESEARCH REPORT

Data Center Chips Market

2026 to 2034
MARKET INTELLIGENCE
ACROSS KEY REGIONS
2026 EDITION
INTEGRATED CIRCUITS Semiconductor Market Research

Data Center Chips Market

Size, Emerging Trends, Technological Advancements, and Business Strategies 2026-2034

◷
UPDATED 28 September 2026
▤
REPORT LENGTH Detailed Report
▯
FORMATS PDF

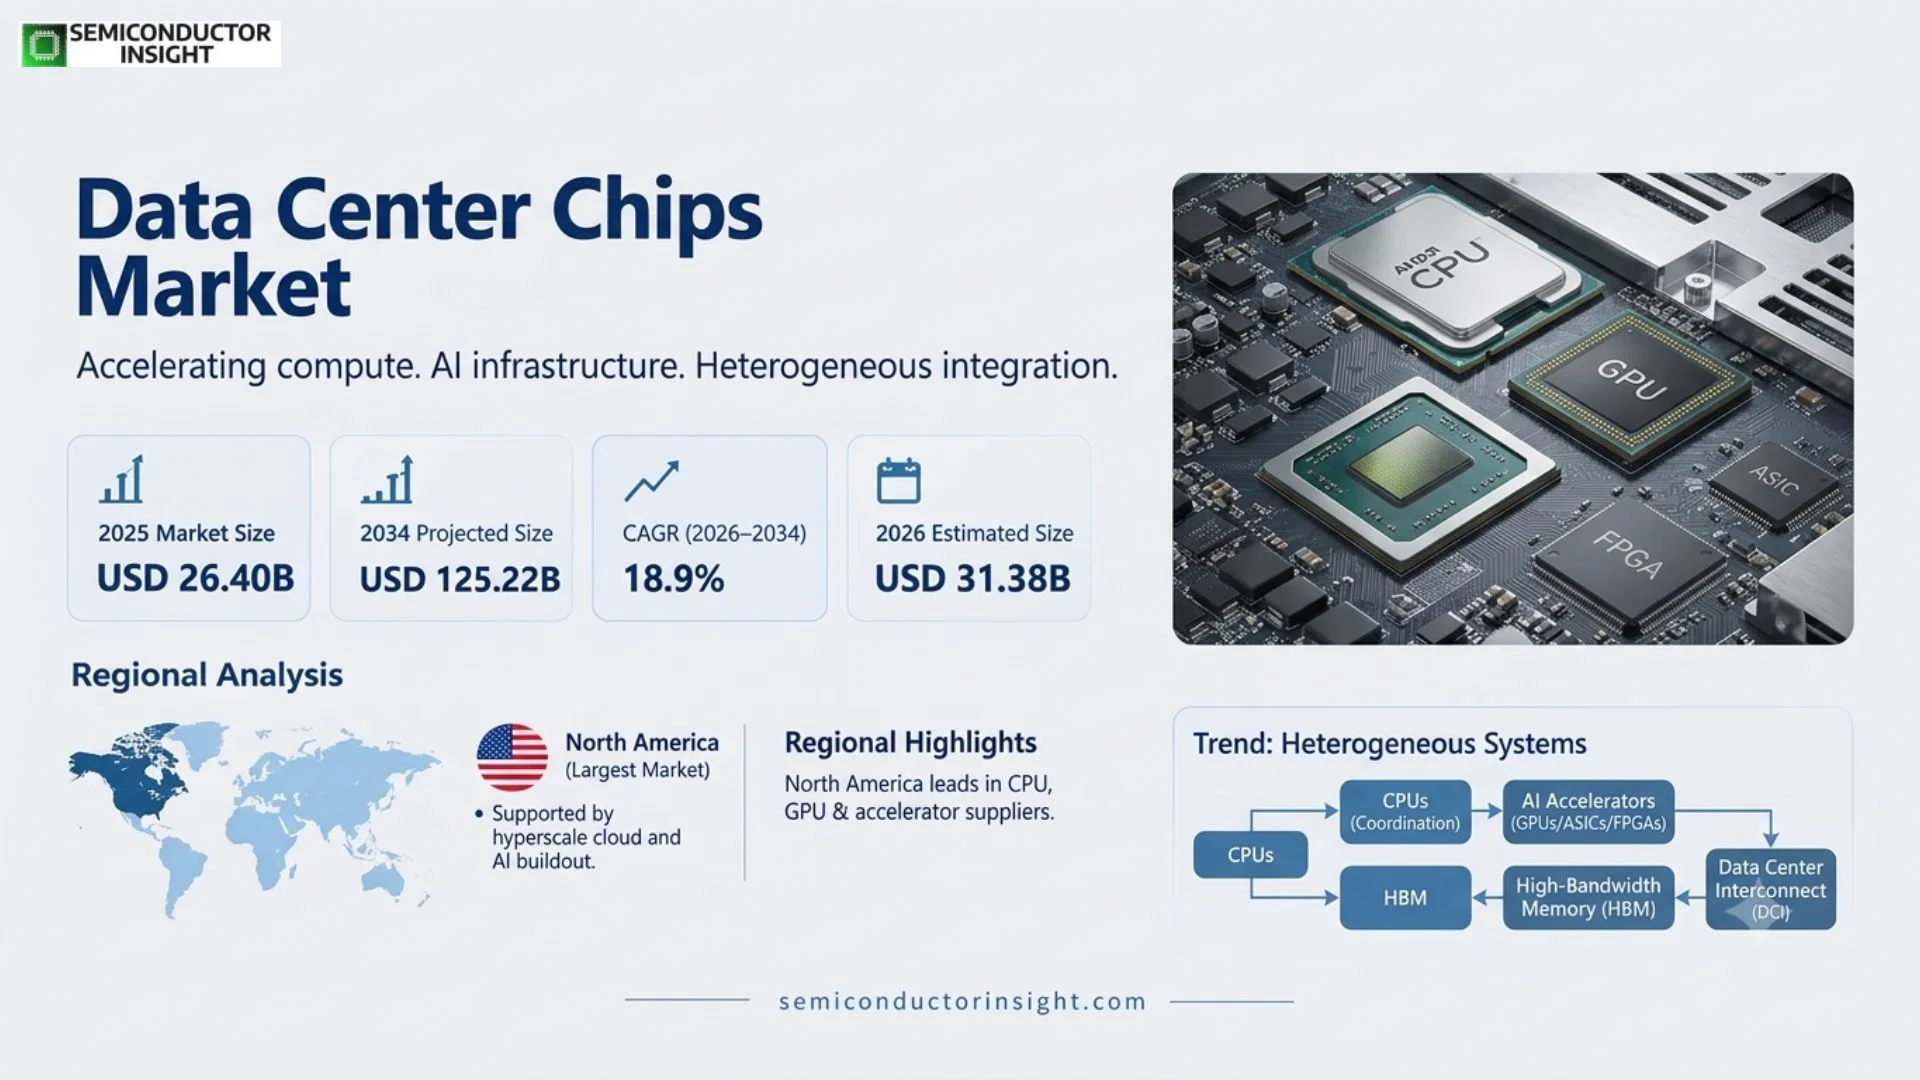
Data Center Chips Market is estimated at USD 31.38 billion in 2026. The market is projected to reach USD 125.22 billion by 2034, representing a CAGR of 18.9% during 2026–2034. North America is the largest regional market, supported by hyperscale cloud investment, AI infrastructure buildout and major CPU, GPU and custom-accelerator suppliers.

Get the sample PDF with study scope, segmentation and methodology details.

Key Statistics

2025 Market Size
USD 26.40 billion
2026 Estimated Market Size
USD 31.38 billion
2034 Projected Market Size
USD 125.22 billion
CAGR (2026–2034)
18.9%

Key Takeaways

  • Market size and growth: the market is estimated at USD 31.38 billion in 2026 and is projected to reach USD 125.22 billion by 2034, representing an 18.9% CAGR during 2026–2034.
  • GPUs and custom accelerators are the fastest-expanding chip classes because AI training and inference require far more parallel compute and memory bandwidth than conventional server workloads.
  • North America leads through hyperscalers, cloud platforms and semiconductor vendors, while Asia Pacific is central to foundry manufacturing, memory and advanced packaging supply.
  • AI infrastructure is reshaping vendor economics: AMD reported USD 16.6 billion of Data Center revenue in 2025, up 32%, driven by EPYC CPUs and Instinct GPU accelerators.
  • Power efficiency is becoming a first-order design constraint: the IEA reported data-center electricity demand rose 17% in 2025 and projects global consumption to roughly double by 2030.

Data Center Chips Market Overview

Data Center Chips Market was valued at USD 26.40 billion in 2025 and is estimated at USD 31.38 billion in 2026. The market is projected to reach USD 125.22 billion by 2034, representing a CAGR of 18.9% during 2026–2034. North America is the largest regional market, supported by hyperscale cloud investment, AI infrastructure buildout and major CPU, GPU and custom-accelerator suppliers.

Base year: 2025 · Estimated year: 2026 · Forecast period: 2026–2034 · Values in USD million unless otherwise stated

Data center chips include CPUs, GPUs, ASICs, FPGAs and other specialized processors used in servers, storage, networking and accelerated-computing systems. The market is transitioning from CPU-centric architectures toward heterogeneous systems in which general-purpose processors coordinate AI accelerators, memory, networking and storage silicon. This shift increases silicon value per rack because performance depends on the combined throughput of compute, memory bandwidth and interconnect rather than the clock speed of a single processor.

Artificial intelligence is the strongest demand catalyst. IEA analysis found that data-center electricity demand increased 17% in 2025 and that AI-focused data-center consumption grew even faster. AMD reported USD 16.6 billion in Data Center revenue for 2025, up 32%, driven mainly by EPYC processors and Instinct GPU accelerators. These figures demonstrate the commercial scale of the current AI compute cycle and the resulting demand for heterogeneous server silicon.

The market is also constrained by the physical requirements of deploying chips at scale. Advanced-node wafer supply, HBM memory, packaging capacity, networking bandwidth and power delivery all determine how quickly accelerator demand converts into installed systems. Data-center chip vendors therefore compete increasingly as platform providers that coordinate processors, accelerators, software, memory and interconnect rather than as isolated silicon suppliers.

Segment Analysis: By Type

By type, the market is segmented into GPU, ASIC, FPGA, CPU and other data-center chips. CPUs remain essential for general-purpose workloads and orchestration, but GPUs and custom ASICs capture the strongest incremental value from AI. FPGAs maintain a role in programmable acceleration, networking and specialized inference, while hybrid architectures combine multiple processor types to optimize workload performance and energy efficiency across different data-center tasks.

Type Technical / commercial role Market position
Graphics Processing Unit (GPU) Massively parallel acceleration for AI training, inference and HPC. Fastest value growth due to generative AI and accelerated computing.
Application Specific Integrated Circuit (ASIC) Custom accelerators optimized for hyperscale inference, training or networking workloads. Strong growth where scale justifies proprietary silicon and lower cost per operation.
Field Programmable Gate Array (FPGA) Reconfigurable acceleration for networking, inference and specialized workloads. Valued for flexibility and lower-volume customization.
Central Processing Unit (CPU) General-purpose server compute, orchestration and broad software compatibility. Core installed base; growth increasingly tied to heterogeneous platforms.
Others Includes DPUs, SmartNICs and specialized storage or networking processors. Growing as infrastructure becomes more disaggregated and software defined.

Segment Analysis: By Application

Applications span cloud computing, high-performance computing, AI and machine learning, data analytics, virtualization, edge computing and other data-center workloads. AI and machine learning are the dominant growth engine because training and inference increase accelerator and HBM content per server. Cloud computing remains the largest deployment environment, while HPC, analytics and virtualization continue to support CPU, GPU and networking demand across enterprise and research infrastructure.

Application Demand characteristics
Cloud Computing Hyperscale and cloud service providers deploy large heterogeneous fleets across compute, storage and managed AI.
High-Performance Computing Scientific and engineering workloads use CPU-GPU clusters with high-speed interconnects.
AI & Machine Learning Fastest-growing application; requires accelerators, HBM and high-bandwidth networking.
Data Analytics Large datasets drive CPU, accelerator and memory demand for real-time and batch processing.
Virtualization Enterprise consolidation and cloud infrastructure support dense CPU and memory configurations.
Edge Computing Smaller distributed data centers need efficient inference and low-latency processing.
Others Storage, networking, security and specialized infrastructure workloads.

Segment Analysis: By Architecture

Processor architecture is becoming more diverse as x86 remains dominant in established server workloads, ARM expands in hyperscale and cloud-native environments, RISC-V develops in specialized infrastructure roles, and custom architectures target tightly defined AI or network tasks. Hybrid systems increasingly mix CPU and accelerator architectures within one server or rack. Software compatibility remains crucial, but energy efficiency and workload specialization can justify architectural change at hyperscale volumes.

Architecture Market role
x86 Architecture Largest installed software ecosystem across enterprise and cloud servers.
ARM Architecture Growing in hyperscale and cloud-native systems where power efficiency is prioritized.
RISC-V Architecture Emerging for specialized controllers and future custom infrastructure silicon.
Custom Architectures Hyperscaler accelerators and proprietary inference/training silicon.
Hybrid Architectures Combines CPU, GPU, DPU and accelerators for workload-specific optimization.

Segment Analysis: By End User

End users range from IT and telecom companies to BFSI, manufacturing, government, retail, transportation and energy organizations. Hyperscalers and IT service providers account for the highest direct chip volumes, but enterprise sectors consume data-center silicon through both owned infrastructure and cloud services. Financial services emphasize latency and reliability, manufacturing uses analytics and AI for operations, while government and regulated industries value security, sovereignty and long product support.

End User Demand logic
IT & Telecom Largest infrastructure buyers and cloud or network operators.
BFSI High-performance analytics, transactions, AI and security workloads.
Manufacturing AI, digital twins, analytics and industrial data processing.
Government Sovereign compute, security and scientific infrastructure.
Retail / Transportation Recommendation, logistics and real-time analytics.
Energy & Utilities Simulation, grid analytics and AI-assisted operations.

Data Center Chips Market Trends

Regional Analysis

North America is the largest regional market due to hyperscale cloud investment, leading AI platform companies and major CPU, GPU and custom-silicon designers. The IEA estimated that the United States accounted for 45% of global data-center electricity consumption in 2024, compared with 25% for China and 15% for Europe. Asia Pacific remains indispensable because advanced logic, memory and packaging manufacturing are concentrated there.

Data-center chip demand must be viewed through both deployment and manufacturing geography. North America consumes a very large share of accelerator systems and captures platform value through major semiconductor and cloud companies. Asia Pacific manufactures much of the advanced logic, HBM and packaging required by those systems. Europe is smaller in hyperscale compute but invests in sovereign AI and research infrastructure. This separation creates a deeply interdependent supply chain despite regional semiconductor industrial policies.

Region Position Growth outlook Demand profile Supplier-selection factor
North America Largest Very high Hyperscale cloud and AI Performance, software and supply
Asia Pacific Manufacturing + growth High Foundry, memory, cloud and sovereign AI Capacity and cost
Europe Established Moderate-High Enterprise, research and sovereign compute Efficiency and sovereignty
South America Emerging Moderate Cloud regions and enterprise digitization Cost and availability
Middle East & Africa Fast-emerging High from small base Sovereign AI and cloud investment Turnkey platform support
North AmericaLARGEST

What defines demand in North America?

North America leads end-market value through hyperscalers, cloud providers, AI companies and semiconductor platform vendors. The United States accounted for 45% of global data-center electricity consumption in 2024 according to the IEA, illustrating the region’s very large installed infrastructure base and the scale of ongoing accelerated-compute deployment.

PositionLargest
Demand baseHyperscale AI
FocusPerformance / software
Primary hubUnited States
Country / subregion Role Demand logic
United States Global demand center Cloud and AI investment drive accelerator deployments.
Canada Research / cloud Specialty compute and cloud expansion support demand.
Mexico Regional infrastructure Nearshore digital infrastructure creates selective server demand.

Regional demand is shaped by the local concentration of customers, supplier service capability and the availability of qualified technical support. Companies that can shorten lead times, maintain local application engineering and support product changes during the customer lifecycle are better positioned to convert market growth into durable share. These factors matter most in technically demanding markets where a design change can affect validation, uptime or manufacturing yield.

Asia PacificMANUFACTURING CORE

What defines demand in Asia Pacific?

Asia Pacific is the production center for much of the advanced logic, HBM memory and packaging used in data-center processors. China, Taiwan, South Korea and Japan also have expanding cloud and AI infrastructure, making the region both a supplier and a rapidly growing end market. Manufacturing concentration gives the region strategic influence over the global availability of accelerated-compute systems.

PositionManufacturing core
Demand baseFoundry + memory
FocusCapacity / packaging
Key hubsTaiwan, Korea, China
Country / subregion Role Demand logic
China Large end market Cloud and domestic AI investment support processor demand.
Taiwan Foundry / packaging Leading-edge logic and advanced packaging are strategically critical.
South Korea Memory / HBM HBM and DRAM supply directly support AI accelerator systems.

Regional demand is shaped by the local concentration of customers, supplier service capability and the availability of qualified technical support. Companies that can shorten lead times, maintain local application engineering and support product changes during the customer lifecycle are better positioned to convert market growth into durable share. These factors matter most in technically demanding markets where a design change can affect validation, uptime or manufacturing yield.

EuropeESTABLISHED

What defines demand in Europe?

Europe is investing in enterprise, research and sovereign AI infrastructure while emphasizing energy efficiency and data governance. The region has less advanced-logic manufacturing than Asia but important equipment, automotive, industrial and scientific-computing demand. Regional AI initiatives can support accelerator adoption even when the underlying processors and memory are imported through global supply chains.

PositionEstablished
Demand baseSovereign / research compute
FocusEfficiency / sovereignty
Key hubsGermany, France, Nordics
Country / subregion Role Demand logic
Germany Industrial compute Enterprise, automotive and research support high-end servers.
France Sovereign AI National and cloud projects expand accelerator demand.
Nordics Data-center hubs Power availability supports regional compute facilities.

Regional demand is shaped by the local concentration of customers, supplier service capability and the availability of qualified technical support. Companies that can shorten lead times, maintain local application engineering and support product changes during the customer lifecycle are better positioned to convert market growth into durable share. These factors matter most in technically demanding markets where a design change can affect validation, uptime or manufacturing yield.

South AmericaEMERGING

What defines demand in South America?

South America is a smaller market led by cloud-region investment in Brazil and enterprise digitization. Most high-end processors are imported, making infrastructure cost, currency conditions and the availability of regional cloud services important demand variables. Growth is driven more by new data-center deployments and cloud adoption than by local semiconductor manufacturing.

PositionEmerging
Demand baseCloud regions
FocusCost / availability
Primary hubBrazil
Country / subregion Role Demand logic
Brazil Primary market Hyperscale and enterprise deployments drive demand.
Argentina Niche Research and enterprise compute provide selective demand.
Rest of region Cloud-led Most chip demand is embedded in imported servers.

Regional demand is shaped by the local concentration of customers, supplier service capability and the availability of qualified technical support. Companies that can shorten lead times, maintain local application engineering and support product changes during the customer lifecycle are better positioned to convert market growth into durable share. These factors matter most in technically demanding markets where a design change can affect validation, uptime or manufacturing yield.

Middle East & AfricaFAST-EMERGING

What defines demand in Middle East & Africa?

Middle East & Africa is emerging through sovereign AI, hyperscale cloud and national digital-infrastructure programs. Gulf countries are investing in data-center capacity and AI compute from a relatively small installed base, creating high-value project opportunities. The region relies heavily on imported processors and complete systems, so platform support and infrastructure integration are important purchasing criteria.

PositionFast-emerging
Demand baseSovereign AI
FocusTurnkey deployment
Key hubsUAE, Saudi Arabia
Country / subregion Role Demand logic
UAE AI / cloud hub Large technology investments support accelerated compute.
Saudi Arabia Sovereign AI National digital programs expand data-center demand.
South Africa Regional data centers Enterprise and cloud infrastructure support selective growth.

Regional demand is shaped by the local concentration of customers, supplier service capability and the availability of qualified technical support. Companies that can shorten lead times, maintain local application engineering and support product changes during the customer lifecycle are better positioned to convert market growth into durable share. These factors matter most in technically demanding markets where a design change can affect validation, uptime or manufacturing yield.

Competitive Landscape

Competition in the Data Center Chips market is shaped by technology performance, customer qualification, application engineering and continuity of supply. Leading companies use product breadth and global support to win large programs, while specialist suppliers can defend attractive niches through deeper technical performance in specific applications. As the market expands, customers increasingly evaluate total system value and lifecycle support rather than relying only on initial component price.

The leading suppliers compete through a combination of proprietary technology, manufacturing scale and customer relationships. In the Data Center Chips market, design wins can remain in place for several product generations because switching suppliers often requires requalification, software changes or manufacturing adjustments. This creates durable revenue positions for vendors that deliver reliable performance and responsive technical support.

Regional suppliers can still gain share where local availability, cost and fast engineering response matter. Their strongest opportunities are generally in standardized or mature applications, while the highest-performance segments remain concentrated among companies with deeper intellectual property, process control and qualification histories. This creates a market structure with both global platform leaders and specialized regional competitors.

Competitive strategy is increasingly moving toward integrated solutions. Customers prefer suppliers that can combine the core product with software, interface components, testing, support or adjacent technologies because integration reduces project risk and development time. Companies able to solve a broader customer problem therefore have more pricing power than vendors competing only on a single specification.

Competitive tier Representative companies Competitive basis
Global technology leaders AMD, Intel, Ampere, Arm Limited Scale, broad product portfolios, strong R&D and global customer support.
Established specialists Qualcomm, GlobalFoundries, TSMC, Samsung Electronics Application-specific engineering and strong qualification in selected segments.
Regional / emerging suppliers Broadcom, NVIDIA, Google, Amazon Web Services, Microsoft Local service, competitive pricing and focused customer relationships.

Key Participants

The profiled competitive set includes AMD, Intel, Ampere, Arm Limited, Qualcomm, GlobalFoundries, TSMC, Samsung Electronics, Broadcom, NVIDIA, Google, Amazon Web Services, Microsoft. Supplier position depends on engineering performance, customer qualification, manufacturing continuity and the ability to support design changes over long product cycles. Larger vendors benefit from broad portfolios and application teams, while specialists can retain strong positions in narrow, technically demanding subsegments where historical qualification and process know-how create meaningful switching costs.

Production Capacity Analysis

Production capacity for Data Center Chips is constrained by the combination of specialized equipment, qualified materials, process know-how and customer-specific validation. Nominal factory output can overstate commercial supply because a new line or material source must often demonstrate consistent performance before it can serve high-value customers. This makes qualified capacity more important than raw nameplate capacity.

Regional manufacturing and service capacity influence lead time and resilience. Customers increasingly prefer suppliers that can support major production clusters from more than one site, reducing exposure to logistics disruption and single-factory events. At the same time, duplicating specialized processes can be difficult because equipment recipes, trained engineers and quality systems must be transferred without changing product performance.

The strongest capacity investments are aligned with structural demand drivers rather than short-term cycles. Suppliers expanding around AI, advanced semiconductor manufacturing, automotive electronics or industrial automation seek to secure positions before customer volumes scale. Effective capacity therefore includes engineering resources, test capability and local technical support in addition to physical manufacturing equipment.

Capacity factor Market implication
Specialized manufacturing Determines qualified output and technical performance.
Critical materials / components Can constrain supply despite available factory floor space.
Qualification and test Controls how quickly new capacity becomes usable by customers.
Regional support Improves lead time, resilience and customer retention.

Market Dynamics

The Data Center Chips market is driven by higher system performance, automation, digitalization and expanding use in high-value applications. Growth is moderated by development cost, qualification requirements and supply-chain concentration. The strongest opportunities occur where new architectures or applications create a clear performance advantage and where suppliers can reduce integration complexity for customers.

MARKET DRIVERS

Driver Relative impact Commercial mechanism
Structural end-market growth High Expanding deployments increase unit demand and installed-base requirements.
Technology upgrade cycle High Higher performance raises value per product and accelerates replacement.
Customer integration needs Medium-High Validated solutions reduce engineering time and project risk.
Regional capacity expansion Medium New manufacturing clusters create local supplier demand.

Structural end-market expansion

Growth in the Data Center Chips market is supported by rising deployment across its principal applications. Customers are investing because the technology improves performance, efficiency, automation or product capability in ways that are difficult to replicate with older approaches. This expands both new-system demand and the installed base that later requires replacement, upgrades or related services.

Higher technical requirements increase value per system

New product generations demand tighter performance, greater integration and better reliability. These requirements can increase selling prices even when unit volumes grow more slowly, because customers are willing to pay for solutions that protect yield, uptime or user experience. Suppliers with stronger engineering capability therefore benefit disproportionately from technology transitions.

Regional investment broadens customer access

Manufacturing and infrastructure investment in North America, Europe and Asia is creating additional customer clusters outside traditional centers. Local engineering support and shorter supply chains help suppliers qualify products earlier in new projects, creating an opportunity to win design positions before production reaches full scale.

MARKET RESTRAINTS

Restraint Relative impact Commercial mechanism
Development and qualification cost High Raises barriers to entry and lengthens customer adoption.
Supply-chain concentration Medium-High Critical components or materials can limit output.
Price pressure Medium Customers seek lower total system cost as volumes increase.
Technology substitution Medium Alternative architectures can replace incumbent solutions in selected uses.

Qualification slows supplier switching

Customers in technical markets cannot change suppliers based only on purchase price. New products must demonstrate performance, reliability and compatibility in the actual application, which can require months of engineering work. This limits the pace at which new entrants gain share and can delay commercialization of technically promising products.

Specialized inputs can constrain supply

Advanced products depend on a limited number of qualified materials, components or manufacturing tools. Shortages or long lead times at one upstream stage can restrict finished-product output even when downstream assembly capacity is available. Suppliers therefore carry strategic inventory or qualify alternate sources, but those actions increase cost.

Customer cost pressure remains persistent

As a technology becomes more widely adopted, customers expect lower unit costs and may redesign systems to use standardized components. Suppliers must offset this pressure through better performance, lower manufacturing cost and additional software or service value. Vendors that cannot maintain differentiation can face margin erosion even in a growing market.

MARKET OPPORTUNITIES

High-performance product generations

New architectures create opportunities for premium products that solve tighter performance, efficiency or integration requirements.

Localized supply and technical support

Customers increasingly value shorter lead times and regional engineering, especially for production-critical components.

Software and data-enabled services

Monitoring, analytics and updateable software can create recurring value beyond the initial hardware sale.

Emerging end-use applications

New industries and use cases can broaden the addressable market beyond the traditional customer base.

Supply Chain Analysis

Stage 1
Specialized materials and components
Stage 2
Core product manufacturing
Stage 3
Qualification and system integration
Stage 4
End-user deployment, service and replacement

The upstream supply chain provides the specialized materials, semiconductor devices, mechanical components or substrates that determine baseline product performance. Qualified inputs are important because changes in composition or manufacturing source can alter reliability, electrical behavior or process compatibility. Suppliers therefore maintain close technical relationships with upstream partners and often approve alternate sources before a disruption occurs.

Manufacturing converts these inputs into finished products using process-specific equipment, inspection and test. Quality systems are central because customers expect lot-to-lot consistency and traceability, particularly in semiconductor, automotive and industrial applications. High-value suppliers differentiate through process control rather than simple assembly scale, and they invest heavily in metrology or validation to protect yield.

Downstream value is created when the product is integrated into the customer system and validated under real operating conditions. Application engineers support installation, software, calibration or process optimization, while service teams maintain the installed base. This lifecycle relationship creates recurring revenue through replacement, updates, refurbishment or expansion and makes customer support an important part of the market structure.

Recent Developments

4 Feb 2026 – AMD reports 32% growth in Data Center revenue

AMD reported USD 16.6 billion of Data Center revenue for 2025, up 32%, driven primarily by EPYC server processors and Instinct GPU accelerators. The result demonstrates continued strong commercial demand for heterogeneous CPU and GPU infrastructure. Source

16 Apr 2026 – IEA reports 17% rise in data-center electricity use in 2025

The IEA found that global data-center electricity demand increased 17% in 2025 and projects consumption to roughly double by 2030, underscoring both rapid compute growth and the physical infrastructure constraints that shape future chip deployments. Source

REPORT SCOPE & SEGMENTATION

Base Year 2025
Estimated Year 2026
Forecast Year 2034
2025 Market Size USD 26.40 billion
2026 Market Size USD 31.38 billion
2034 Market Size USD 125.22 billion
CAGR 18.9% during 2026–2034
Largest Market / Leading Geography North America
By Type GPU; ASIC; FPGA; CPU; Others
By Application Cloud Computing; HPC; AI & Machine Learning; Data Analytics; Virtualization; Edge Computing; Others
By Architecture x86; ARM; RISC-V; Custom; Hybrid
By End User BFSI; Manufacturing; Government; IT & Telecom; Retail; Transportation; Energy & Utilities; Others
Key Companies AMD; Intel; Ampere; Arm; Qualcomm; GlobalFoundries; TSMC; Samsung; Broadcom; NVIDIA; Google; AWS; Microsoft

Frequently Asked Questions

What is the size of the data center chips market?

The market is estimated at USD 31.38 billion in 2026 and is projected to reach USD 125.22 billion by 2034, representing an 18.9% CAGR during 2026–2034. The 2025 market size is USD 26.40 billion.

Which chip type is growing fastest?

GPUs and custom AI accelerators are growing fastest because AI training and inference require parallel compute, high memory bandwidth and specialized software stacks.

Which region leads the market?

North America leads data-center chip demand through hyperscale cloud and AI investment, while Asia Pacific is critical to advanced manufacturing, HBM memory and packaging supply.

Why are advanced packaging and HBM important?

High-end AI accelerators require multiple logic and memory dies connected at very high bandwidth. Packaging and HBM capacity therefore directly constrain how many complete accelerator modules can ship.

What is the main growth driver?

Generative AI and accelerated computing are the strongest growth drivers, supported by continued cloud expansion and increasing enterprise AI adoption.

What are the biggest constraints?

Power availability, data-center cooling, advanced packaging, HBM supply, export controls and leading-edge semiconductor capital intensity are the primary constraints.

Research Sources & Evidence Base
View research sources used for this overview
  1. AMD. 2025 Annual Report / Form 10-K, Data Center revenue and accelerator demand.
  2. International Energy Agency. Energy and AI, data-center electricity demand and accelerated-server outlook.
  3. International Energy Agency. Key Questions on Energy and AI, 2025 demand growth and 2030 outlook.
  4. NVIDIA. Annual Reports and Proxies, official financial reporting source for data-center platform scale.
Data Center Chips Market Size, Emerging Trends, Technological Advancements, and Business Strategies 2026-2034

Get Sample Report PDF for Exclusive Insights

Report Sample Includes

  • Table of Contents
  • List of Tables & Figures
  • Charts, Research Methodology, and more...

PDF Icon Download Sample Report PDF
License

Excel Data Pack, PDF & Excel license, Corporate License

Download Sample Report

Table of Content

1 Introduction to Research & Analysis Reports
1.1 Data Center Chips Market Definition
1.2 Market Segments
1.2.1 Market by Type
1.2.2 Market by Application
1.3 Global Data Center Chips Market Overview
1.4 Features & Benefits of This Report
1.5 Methodology & Sources of Information
1.5.1 Research Methodology
1.5.2 Research Process
1.5.3 Base Year
1.5.4 Report Assumptions & Caveats
2 Global Data Center Chips Overall Market Size
2.1 Global Data Center Chips Market Size: 2022 VS 2032
2.2 Global Data Center Chips Revenue, Prospects & Forecasts: 2018-2032
2.3 Global Data Center Chips Sales: 2018-2032
3 Company Landscape
3.1 Top Data Center Chips Players in Global Market
3.2 Top Global Data Center Chips Companies Ranked by Revenue
3.3 Global Data Center Chips Revenue by Companies
3.4 Global Data Center Chips Sales by Companies
3.5 Global Data Center Chips Price by Manufacturer (2018-2023)
3.6 Top 3 and Top 5 Data Center Chips Companies in Global Market, by Revenue in 2022
3.7 Global Manufacturers Data Center Chips Product Type
3.8 Tier 1, Tier 2 and Tier 3 Data Center Chips Players in Global Market
3.8.1 List of Global Tier 1 Data Center Chips Companies
3.8.2 List of Global Tier 2 and Tier 3 Data Center Chips Companies
4 Sights by Product
4.1 Overview
4.1.1 By Type – Global Data Center Chips Market Size Markets, 2022 & 2032
4.1.2 Graphics Processing Unit (GPU)
4.1.3 Application Specific Integrated Circuit (ASIC)
4.1.4 Field Programmable Gate Array (FPGA)
4.1.5 Central Processing Unit (CPU)
4.1.6 Others
4.2 By Type – Global Data Center Chips Revenue & Forecasts
4.2.1 By Type – Global Data Center Chips Revenue, 2018-2023
4.2.2 By Type – Global Data Center Chips Revenue, 2024-2032
4.2.3 By Type – Global Data Center Chips Revenue Market Share, 2018-2032
4.3 By Type – Global Data Center Chips Sales & Forecasts
4.3.1 By Type – Global Data Center Chips Sales, 2018-2023
4.3.2 By Type – Global Data Center Chips Sales, 2024-2032
4.3.3 By Type – Global Data Center Chips Sales Market Share, 2018-2032
4.4 By Type – Global Data Center Chips Price (Manufacturers Selling Prices), 2018-2032
5 Sights by Application
5.1 Overview
5.1.1 By Application – Global Data Center Chips Market Size, 2022 & 2032
5.1.2 BFSI
5.1.3 Manufacturing
5.1.4 Government
5.1.5 IT & Telecom
5.1.6 Retail
5.1.7 Transportation
5.1.8 Energy & Utilities
5.1.9 Others
5.2 By Application – Global Data Center Chips Revenue & Forecasts
5.2.1 By Application – Global Data Center Chips Revenue, 2018-2023
5.2.2 By Application – Global Data Center Chips Revenue, 2024-2032
5.2.3 By Application – Global Data Center Chips Revenue Market Share, 2018-2032
5.3 By Application – Global Data Center Chips Sales & Forecasts
5.3.1 By Application – Global Data Center Chips Sales, 2018-2023
5.3.2 By Application – Global Data Center Chips Sales, 2024-2032
5.3.3 By Application – Global Data Center Chips Sales Market Share, 2018-2032
5.4 By Application – Global Data Center Chips Price (Manufacturers Selling Prices), 2018-2032
6 Sights by Region
6.1 By Region – Global Data Center Chips Market Size, 2022 & 2032
6.2 By Region – Global Data Center Chips Revenue & Forecasts
6.2.1 By Region – Global Data Center Chips Revenue, 2018-2023
6.2.2 By Region – Global Data Center Chips Revenue, 2024-2032
6.2.3 By Region – Global Data Center Chips Revenue Market Share, 2018-2032
6.3 By Region – Global Data Center Chips Sales & Forecasts
6.3.1 By Region – Global Data Center Chips Sales, 2018-2023
6.3.2 By Region – Global Data Center Chips Sales, 2024-2032
6.3.3 By Region – Global Data Center Chips Sales Market Share, 2018-2032
6.4 North America
6.4.1 By Country – North America Data Center Chips Revenue, 2018-2032
6.4.2 By Country – North America Data Center Chips Sales, 2018-2032
6.4.3 US Data Center Chips Market Size, 2018-2032
6.4.4 Canada Data Center Chips Market Size, 2018-2032
6.4.5 Mexico Data Center Chips Market Size, 2018-2032
6.5 Europe
6.5.1 By Country – Europe Data Center Chips Revenue, 2018-2032
6.5.2 By Country – Europe Data Center Chips Sales, 2018-2032
6.5.3 Germany Data Center Chips Market Size, 2018-2032
6.5.4 France Data Center Chips Market Size, 2018-2032
6.5.5 U.K. Data Center Chips Market Size, 2018-2032
6.5.6 Italy Data Center Chips Market Size, 2018-2032
6.5.7 Russia Data Center Chips Market Size, 2018-2032
6.5.8 Nordic Countries Data Center Chips Market Size, 2018-2032
6.5.9 Benelux Data Center Chips Market Size, 2018-2032
6.6 Asia
6.6.1 By Region – Asia Data Center Chips Revenue, 2018-2032
6.6.2 By Region – Asia Data Center Chips Sales, 2018-2032
6.6.3 China Data Center Chips Market Size, 2018-2032
6.6.4 Japan Data Center Chips Market Size, 2018-2032
6.6.5 South Korea Data Center Chips Market Size, 2018-2032
6.6.6 Southeast Asia Data Center Chips Market Size, 2018-2032
6.6.7 India Data Center Chips Market Size, 2018-2032
6.7 South America
6.7.1 By Country – South America Data Center Chips Revenue, 2018-2032
6.7.2 By Country – South America Data Center Chips Sales, 2018-2032
6.7.3 Brazil Data Center Chips Market Size, 2018-2032
6.7.4 Argentina Data Center Chips Market Size, 2018-2032
6.8 Middle East & Africa
6.8.1 By Country – Middle East & Africa Data Center Chips Revenue, 2018-2032
6.8.2 By Country – Middle East & Africa Data Center Chips Sales, 2018-2032
6.8.3 Turkey Data Center Chips Market Size, 2018-2032
6.8.4 Israel Data Center Chips Market Size, 2018-2032
6.8.5 Saudi Arabia Data Center Chips Market Size, 2018-2032
6.8.6 UAE Data Center Chips Market Size, 2018-2032
7 Manufacturers & Brands Profiles
7.1 AMD
7.1.1 AMD Company Summary
7.1.2 AMD Business Overview
7.1.3 AMD Data Center Chips Major Product Offerings
7.1.4 AMD Data Center Chips Sales and Revenue in Global (2018-2023)
7.1.5 AMD Key News & Latest Developments
7.2 Intel
7.2.1 Intel Company Summary
7.2.2 Intel Business Overview
7.2.3 Intel Data Center Chips Major Product Offerings
7.2.4 Intel Data Center Chips Sales and Revenue in Global (2018-2023)
7.2.5 Intel Key News & Latest Developments
7.3 Ampere
7.3.1 Ampere Company Summary
7.3.2 Ampere Business Overview
7.3.3 Ampere Data Center Chips Major Product Offerings
7.3.4 Ampere Data Center Chips Sales and Revenue in Global (2018-2023)
7.3.5 Ampere Key News & Latest Developments
7.4 Arm Limited
7.4.1 Arm Limited Company Summary
7.4.2 Arm Limited Business Overview
7.4.3 Arm Limited Data Center Chips Major Product Offerings
7.4.4 Arm Limited Data Center Chips Sales and Revenue in Global (2018-2023)
7.4.5 Arm Limited Key News & Latest Developments
7.5 Qualcomm
7.5.1 Qualcomm Company Summary
7.5.2 Qualcomm Business Overview
7.5.3 Qualcomm Data Center Chips Major Product Offerings
7.5.4 Qualcomm Data Center Chips Sales and Revenue in Global (2018-2023)
7.5.5 Qualcomm Key News & Latest Developments
7.6 GlobalFoundries
7.6.1 GlobalFoundries Company Summary
7.6.2 GlobalFoundries Business Overview
7.6.3 GlobalFoundries Data Center Chips Major Product Offerings
7.6.4 GlobalFoundries Data Center Chips Sales and Revenue in Global (2018-2023)
7.6.5 GlobalFoundries Key News & Latest Developments
7.7 TSMC
7.7.1 TSMC Company Summary
7.7.2 TSMC Business Overview
7.7.3 TSMC Data Center Chips Major Product Offerings
7.7.4 TSMC Data Center Chips Sales and Revenue in Global (2018-2023)
7.7.5 TSMC Key News & Latest Developments
7.8 Samsung Electronics
7.8.1 Samsung Electronics Company Summary
7.8.2 Samsung Electronics Business Overview
7.8.3 Samsung Electronics Data Center Chips Major Product Offerings
7.8.4 Samsung Electronics Data Center Chips Sales and Revenue in Global (2018-2023)
7.8.5 Samsung Electronics Key News & Latest Developments
7.9 Broadcom
7.9.1 Broadcom Company Summary
7.9.2 Broadcom Business Overview
7.9.3 Broadcom Data Center Chips Major Product Offerings
7.9.4 Broadcom Data Center Chips Sales and Revenue in Global (2018-2023)
7.9.5 Broadcom Key News & Latest Developments
7.10 Huawei
7.10.1 Huawei Company Summary
7.10.2 Huawei Business Overview
7.10.3 Huawei Data Center Chips Major Product Offerings
7.10.4 Huawei Data Center Chips Sales and Revenue in Global (2018-2023)
7.10.5 Huawei Key News & Latest Developments
8 Global Data Center Chips Production Capacity, Analysis
8.1 Global Data Center Chips Production Capacity, 2018-2032
8.2 Data Center Chips Production Capacity of Key Manufacturers in Global Market
8.3 Global Data Center Chips Production by Region
9 Key Market Trends, Opportunity, Drivers and Restraints
9.1 Market Opportunities & Trends
9.2 Market Drivers
9.3 Market Restraints
10 Data Center Chips Supply Chain Analysis
10.1 Data Center Chips Industry Value Chain
10.2 Data Center Chips Upstream Market
10.3 Data Center Chips Downstream and Clients
10.4 Marketing Channels Analysis
10.4.1 Marketing Channels
10.4.2 Data Center Chips Distributors and Sales Agents in Global
11 Conclusion
12 Appendix
12.1 Note
12.2 Examples of Clients
12.3 DisclaimerList of Tables
Table 1. Key Players of Data Center Chips in Global Market
Table 2. Top Data Center Chips Players in Global Market, Ranking by Revenue (2022)
Table 3. Global Data Center Chips Revenue by Companies, (US$, Mn), 2018-2023
Table 4. Global Data Center Chips Revenue Share by Companies, 2018-2023
Table 5. Global Data Center Chips Sales by Companies, (K Units), 2018-2023
Table 6. Global Data Center Chips Sales Share by Companies, 2018-2023
Table 7. Key Manufacturers Data Center Chips Price (2018-2023) & (USD/Unit)
Table 8. Global Manufacturers Data Center Chips Product Type
Table 9. List of Global Tier 1 Data Center Chips Companies, Revenue (US$, Mn) in 2022 and Market Share
Table 10. List of Global Tier 2 and Tier 3 Data Center Chips Companies, Revenue (US$, Mn) in 2022 and Market Share
Table 11. By Type ? Global Data Center Chips Revenue, (US$, Mn), 2022 & 2032
Table 12. By Type – Global Data Center Chips Revenue (US$, Mn), 2018-2023
Table 13. By Type – Global Data Center Chips Revenue (US$, Mn), 2024-2032
Table 14. By Type – Global Data Center Chips Sales (K Units), 2018-2023
Table 15. By Type – Global Data Center Chips Sales (K Units), 2024-2032
Table 16. By Application ? Global Data Center Chips Revenue, (US$, Mn), 2022 & 2032
Table 17. By Application – Global Data Center Chips Revenue (US$, Mn), 2018-2023
Table 18. By Application – Global Data Center Chips Revenue (US$, Mn), 2024-2032
Table 19. By Application – Global Data Center Chips Sales (K Units), 2018-2023
Table 20. By Application – Global Data Center Chips Sales (K Units), 2024-2032
Table 21. By Region ? Global Data Center Chips Revenue, (US$, Mn), 2022 VS 2032
Table 22. By Region – Global Data Center Chips Revenue (US$, Mn), 2018-2023
Table 23. By Region – Global Data Center Chips Revenue (US$, Mn), 2024-2032
Table 24. By Region – Global Data Center Chips Sales (K Units), 2018-2023
Table 25. By Region – Global Data Center Chips Sales (K Units), 2024-2032
Table 26. By Country – North America Data Center Chips Revenue, (US$, Mn), 2018-2023
Table 27. By Country – North America Data Center Chips Revenue, (US$, Mn), 2024-2032
Table 28. By Country – North America Data Center Chips Sales, (K Units), 2018-2023
Table 29. By Country – North America Data Center Chips Sales, (K Units), 2024-2032
Table 30. By Country – Europe Data Center Chips Revenue, (US$, Mn), 2018-2023
Table 31. By Country – Europe Data Center Chips Revenue, (US$, Mn), 2024-2032
Table 32. By Country – Europe Data Center Chips Sales, (K Units), 2018-2023
Table 33. By Country – Europe Data Center Chips Sales, (K Units), 2024-2032
Table 34. By Region – Asia Data Center Chips Revenue, (US$, Mn), 2018-2023
Table 35. By Region – Asia Data Center Chips Revenue, (US$, Mn), 2024-2032
Table 36. By Region – Asia Data Center Chips Sales, (K Units), 2018-2023
Table 37. By Region – Asia Data Center Chips Sales, (K Units), 2024-2032
Table 38. By Country – South America Data Center Chips Revenue, (US$, Mn), 2018-2023
Table 39. By Country – South America Data Center Chips Revenue, (US$, Mn), 2024-2032
Table 40. By Country – South America Data Center Chips Sales, (K Units), 2018-2023
Table 41. By Country – South America Data Center Chips Sales, (K Units), 2024-2032
Table 42. By Country – Middle East & Africa Data Center Chips Revenue, (US$, Mn), 2018-2023
Table 43. By Country – Middle East & Africa Data Center Chips Revenue, (US$, Mn), 2024-2032
Table 44. By Country – Middle East & Africa Data Center Chips Sales, (K Units), 2018-2023
Table 45. By Country – Middle East & Africa Data Center Chips Sales, (K Units), 2024-2032
Table 46. AMD Company Summary
Table 47. AMD Data Center Chips Product Offerings
Table 48. AMD Data Center Chips Sales (K Units), Revenue (US$, Mn) and Average Price (USD/Unit) (2018-2023)
Table 49. AMD Key News & Latest Developments
Table 50. Intel Company Summary
Table 51. Intel Data Center Chips Product Offerings
Table 52. Intel Data Center Chips Sales (K Units), Revenue (US$, Mn) and Average Price (USD/Unit) (2018-2023)
Table 53. Intel Key News & Latest Developments
Table 54. Ampere Company Summary
Table 55. Ampere Data Center Chips Product Offerings
Table 56. Ampere Data Center Chips Sales (K Units), Revenue (US$, Mn) and Average Price (USD/Unit) (2018-2023)
Table 57. Ampere Key News & Latest Developments
Table 58. Arm Limited Company Summary
Table 59. Arm Limited Data Center Chips Product Offerings
Table 60. Arm Limited Data Center Chips Sales (K Units), Revenue (US$, Mn) and Average Price (USD/Unit) (2018-2023)
Table 61. Arm Limited Key News & Latest Developments
Table 62. Qualcomm Company Summary
Table 63. Qualcomm Data Center Chips Product Offerings
Table 64. Qualcomm Data Center Chips Sales (K Units), Revenue (US$, Mn) and Average Price (USD/Unit) (2018-2023)
Table 65. Qualcomm Key News & Latest Developments
Table 66. GlobalFoundries Company Summary
Table 67. GlobalFoundries Data Center Chips Product Offerings
Table 68. GlobalFoundries Data Center Chips Sales (K Units), Revenue (US$, Mn) and Average Price (USD/Unit) (2018-2023)
Table 69. GlobalFoundries Key News & Latest Developments
Table 70. TSMC Company Summary
Table 71. TSMC Data Center Chips Product Offerings
Table 72. TSMC Data Center Chips Sales (K Units), Revenue (US$, Mn) and Average Price (USD/Unit) (2018-2023)
Table 73. TSMC Key News & Latest Developments
Table 74. Samsung Electronics Company Summary
Table 75. Samsung Electronics Data Center Chips Product Offerings
Table 76. Samsung Electronics Data Center Chips Sales (K Units), Revenue (US$, Mn) and Average Price (USD/Unit) (2018-2023)
Table 77. Samsung Electronics Key News & Latest Developments
Table 78. Broadcom Company Summary
Table 79. Broadcom Data Center Chips Product Offerings
Table 80. Broadcom Data Center Chips Sales (K Units), Revenue (US$, Mn) and Average Price (USD/Unit) (2018-2023)
Table 81. Broadcom Key News & Latest Developments
Table 82. Huawei Company Summary
Table 83. Huawei Data Center Chips Product Offerings
Table 84. Huawei Data Center Chips Sales (K Units), Revenue (US$, Mn) and Average Price (USD/Unit) (2018-2023)
Table 85. Huawei Key News & Latest Developments
Table 86. Data Center Chips Production Capacity (K Units) of Key Manufacturers in Global Market, 2021-2023 (K Units)
Table 87. Global Data Center Chips Capacity Market Share of Key Manufacturers, 2021-2023
Table 88. Global Data Center Chips Production by Region, 2018-2023 (K Units)
Table 89. Global Data Center Chips Production by Region, 2024-2032 (K Units)
Table 90. Data Center Chips Market Opportunities & Trends in Global Market
Table 91. Data Center Chips Market Drivers in Global Market
Table 92. Data Center Chips Market Restraints in Global Market
Table 93. Data Center Chips Raw Materials
Table 94. Data Center Chips Raw Materials Suppliers in Global Market
Table 95. Typical Data Center Chips Downstream
Table 96. Data Center Chips Downstream Clients in Global Market
Table 97. Data Center Chips Distributors and Sales Agents in Global Market
List of Figures
Figure 1. Data Center Chips Segment by Type in 2022
Figure 2. Data Center Chips Segment by Application in 2022
Figure 3. Global Data Center Chips Market Overview: 2022
Figure 4. Key Caveats
Figure 5. Global Data Center Chips Market Size: 2022 VS 2032 (US$, Mn)
Figure 6. Global Data Center Chips Revenue, 2018-2032 (US$, Mn)
Figure 7. Data Center Chips Sales in Global Market: 2018-2032 (K Units)
Figure 8. The Top 3 and 5 Players Market Share by Data Center Chips Revenue in 2022
Figure 9. By Type – Global Data Center Chips Revenue, (US$, Mn), 2022 & 2032
Figure 10. By Type – Global Data Center Chips Revenue Market Share, 2018-2032
Figure 11. By Type – Global Data Center Chips Sales Market Share, 2018-2032
Figure 12. By Type – Global Data Center Chips Price (USD/Unit), 2018-2032
Figure 13. By Application – Global Data Center Chips Revenue, (US$, Mn), 2022 & 2032
Figure 14. By Application – Global Data Center Chips Revenue Market Share, 2018-2032
Figure 15. By Application – Global Data Center Chips Sales Market Share, 2018-2032
Figure 16. By Application – Global Data Center Chips Price (USD/Unit), 2018-2032
Figure 17. By Region – Global Data Center Chips Revenue, (US$, Mn), 2022 & 2032
Figure 18. By Region – Global Data Center Chips Revenue Market Share, 2018 VS 2022 VS 2032
Figure 19. By Region – Global Data Center Chips Revenue Market Share, 2018-2032
Figure 20. By Region – Global Data Center Chips Sales Market Share, 2018-2032
Figure 21. By Country – North America Data Center Chips Revenue Market Share, 2018-2032
Figure 22. By Country – North America Data Center Chips Sales Market Share, 2018-2032
Figure 23. US Data Center Chips Revenue, (US$, Mn), 2018-2032
Figure 24. Canada Data Center Chips Revenue, (US$, Mn), 2018-2032
Figure 25. Mexico Data Center Chips Revenue, (US$, Mn), 2018-2032
Figure 26. By Country – Europe Data Center Chips Revenue Market Share, 2018-2032
Figure 27. By Country – Europe Data Center Chips Sales Market Share, 2018-2032
Figure 28. Germany Data Center Chips Revenue, (US$, Mn), 2018-2032
Figure 29. France Data Center Chips Revenue, (US$, Mn), 2018-2032
Figure 30. U.K. Data Center Chips Revenue, (US$, Mn), 2018-2032
Figure 31. Italy Data Center Chips Revenue, (US$, Mn), 2018-2032
Figure 32. Russia Data Center Chips Revenue, (US$, Mn), 2018-2032
Figure 33. Nordic Countries Data Center Chips Revenue, (US$, Mn), 2018-2032
Figure 34. Benelux Data Center Chips Revenue, (US$, Mn), 2018-2032
Figure 35. By Region – Asia Data Center Chips Revenue Market Share, 2018-2032
Figure 36. By Region – Asia Data Center Chips Sales Market Share, 2018-2032
Figure 37. China Data Center Chips Revenue, (US$, Mn), 2018-2032
Figure 38. Japan Data Center Chips Revenue, (US$, Mn), 2018-2032
Figure 39. South Korea Data Center Chips Revenue, (US$, Mn), 2018-2032
Figure 40. Southeast Asia Data Center Chips Revenue, (US$, Mn), 2018-2032
Figure 41. India Data Center Chips Revenue, (US$, Mn), 2018-2032
Figure 42. By Country – South America Data Center Chips Revenue Market Share, 2018-2032
Figure 43. By Country – South America Data Center Chips Sales Market Share, 2018-2032
Figure 44. Brazil Data Center Chips Revenue, (US$, Mn), 2018-2032
Figure 45. Argentina Data Center Chips Revenue, (US$, Mn), 2018-2032
Figure 46. By Country – Middle East & Africa Data Center Chips Revenue Market Share, 2018-2032
Figure 47. By Country – Middle East & Africa Data Center Chips Sales Market Share, 2018-2032
Figure 48. Turkey Data Center Chips Revenue, (US$, Mn), 2018-2032
Figure 49. Israel Data Center Chips Revenue, (US$, Mn), 2018-2032
Figure 50. Saudi Arabia Data Center Chips Revenue, (US$, Mn), 2018-2032
Figure 51. UAE Data Center Chips Revenue, (US$, Mn), 2018-2032
Figure 52. Global Data Center Chips Production Capacity (K Units), 2018-2032
Figure 53. The Percentage of Production Data Center Chips by Region, 2022 VS 2032
Figure 54. Data Center Chips Industry Value Chain
Figure 55. Marketing Channels

Customer Reviews

There are no reviews yet.

Be the first to review “Data Center Chips Market Size, Emerging Trends, Technological Advancements, and Business Strategies 2026-2034”

Your email address will not be published. Required fields are marked *