Key Statistics
Key Takeaways
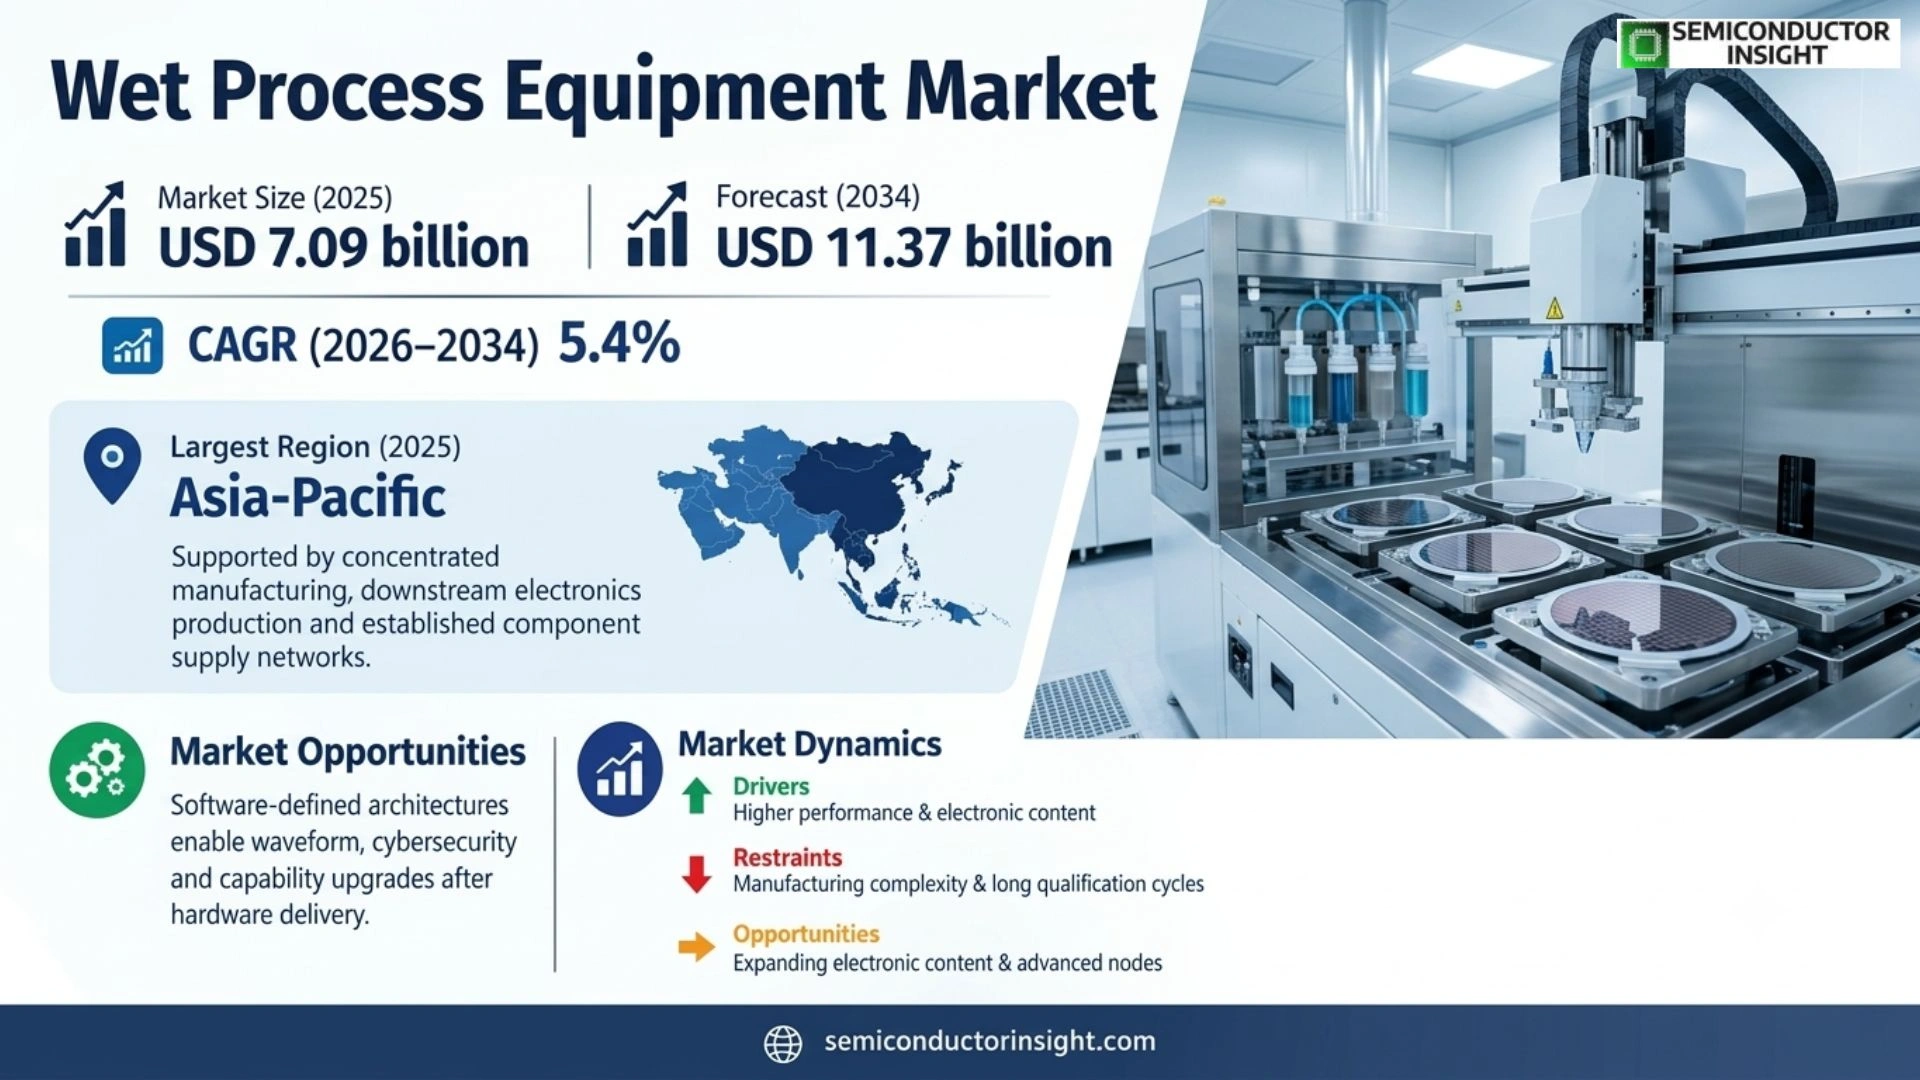
- The Wet Process Equipment Market was valued at USD 7.09 billion in the 2025 base year and is projected to reach USD 11.37 billion by 2034, expanding at a 5.4% CAGR during 2026–2034.
- Fully automatic systems lead by type as high-volume fabs prioritize robotic handling, recipe control, low defectivity, chamber matching, and factory integration.
- 300 mm wafer processing creates the largest equipment value, while 200 mm, compound-semiconductor, MEMS, photonics, and packaging lines sustain demand for flexible platforms.
- Asia Pacific is the largest regional market through concentrated foundry, memory, IDM, OSAT, materials, equipment, and electronics-manufacturing ecosystems.
- Yield and resource efficiency define competitive value. Particle control, selectivity, throughput, chemical use, water use, uptime, footprint, safety, and regional service shape purchase decisions.
Wet Process Equipment Market Overview
Wet Process Equipment Market was valued at USD 7.09 billion in 2025 and is projected to reach USD 11.37 billion by 2034, growing at a CAGR of 5.4% during 2026–2034. Asia Pacific held the largest regional position in 2025, supported by concentrated manufacturing, downstream electronics production and established component supply networks.
Wet process equipment performs wafer cleaning, liquid-phase etching, resist stripping, electrochemical deposition, surface preparation, rinsing, and drying during semiconductor fabrication and advanced packaging. Platforms range from manual wet benches and batch immersion tools to highly automated single-wafer systems with precise chemical delivery, endpoint control, filtration, contamination monitoring, and factory automation. Equipment value is determined by defect performance, uniformity, throughput, chemistry consumption, footprint, safety, and process repeatability.
Demand in the 2026 estimated year is supported by logic, memory, analog, power, MEMS, compound-semiconductor, and packaging investment. Advanced device structures add more critical cleans and selective wet steps, while mature-node factories continue to require dependable 200 mm and specialty-wafer equipment. Customers increasingly evaluate each tool as part of a complete process module, including chemical cabinets, abatement, facilities interfaces, recipe control, wafer handling, metrology correlation, and long-term service support.
The market serves very different production environments. High-volume 300 mm fabs prioritize automated handling, low particle addition, chamber matching, and fleet productivity; compound-semiconductor and MEMS lines need flexible materials compatibility; packaging operations require solvent cleaning, descum, plating, and selective etch; research facilities value configurable tools and safe operation at lower volumes. These requirements sustain room for global platform leaders and specialized regional manufacturers.
Segment Analysis: By Type
By type, the Wet Process Equipment market is segmented into Fully Automatic · Semi-automatic · Manual. Each category represents a different degree of integration, qualification burden and value capture, so suppliers compete through a combination of material performance, design support, manufacturing consistency, package architecture and application-specific testing rather than through unit price alone. Procurement also reflects lifecycle support, interoperability, compliance evidence, warranty exposure, and the cost of unsuccessful qualification.
| Type | Market relevance |
|---|---|
| Fully Automatic | Distinct performance, condition, integration, and qualification requirements shape demand and supplier positioning. |
| Semi-automatic | Distinct performance, condition, integration, and qualification requirements shape demand and supplier positioning. |
| Manual | Distinct performance, condition, integration, and qualification requirements shape demand and supplier positioning. |
Segment Analysis: By Application
By application, the market covers 150 mm Wafer · 200 mm Wafer · 300 mm Wafer · Other Specialized Applications. Demand varies by production volume and qualification intensity: consumer programmes reward scale and miniaturisation, while automotive, industrial, aerospace, medical or security designs place greater weight on reliability evidence, long product availability and system-level performance under demanding operating conditions. Channel design, documentation, service coverage, and total ownership economics further determine which application converts technical interest into repeat purchasing.
| Application | Market relevance |
|---|---|
| 150 mm Wafer | Purchasing criteria reflect use-case economics, technical requirements, warranty expectations, and channel support. |
| 200 mm Wafer | Purchasing criteria reflect use-case economics, technical requirements, warranty expectations, and channel support. |
| 300 mm Wafer | Purchasing criteria reflect use-case economics, technical requirements, warranty expectations, and channel support. |
| Other Specialized Applications | Purchasing criteria reflect use-case economics, technical requirements, warranty expectations, and channel support. |
Regional Analysis
Asia Pacific is the largest regional market for Wet Process Equipment products, combining an established component-production ecosystem with major downstream customers. North America and Europe are strategically important for premium, automotive, aerospace, industrial and specialised applications, while South America and Middle East & Africa are primarily import- and project-led markets where distributor reach, local support and supply continuity shape vendor selection.
How does regional demand differ across this market?
For Wet Process Equipment, Asia Pacific holds the largest position, supported by an established customer base, supplier presence, and mature purchasing channels. Europe contributes regulation, industrial demand, and technical expertise, while Asia Pacific combines electronics manufacturing, large device populations, and expanding engineering capability. South America and the Middle East and Africa develop through targeted infrastructure, enterprise, research, consumer, or public-sector programs rather than uniform adoption.
| Region | Position |
|---|---|
| Asia Pacific | Largest and most established demand base |
| North America | Developing demand shaped by local applications, channels, and qualification conditions |
| Europe | Developing demand shaped by local applications, channels, and qualification conditions |
| South America | Developing demand shaped by local applications, channels, and qualification conditions |
| Middle East & Africa | Developing demand shaped by local applications, channels, and qualification conditions |
Key Wet Process Equipment Manufacturers and Competitive Landscape
The Wet Process Equipment competitive landscape includes global technology leaders, diversified semiconductor or component groups, RF and imaging specialists, and regional manufacturers. The report profiles every named company across product positioning, manufacturing footprint, application exposure, recent development activity and strategic strengths; the complete coverage list is reproduced below so the intended company universe is explicit.
The competitive landscape covers Shibaura Mechatronics, SCREEN Semiconductor Solutions, Tokyo Electron, Veeco Instruments, RENA Technologies, AP&S International, Modutek, Wafer Process Systems, Chemical Art Technology, Solstice, SiSTEM Technology, Amerimade Technology, PNC Process Systems, ACM Research, NAURA Technology Group, Asia Electronics, and Kingsemi. The group spans automated single-wafer cleaners, batch wet stations, electroplating tools, solvent platforms, laboratory benches, chemical-delivery systems, and application-specific equipment.
Suppliers compete on particle removal, selectivity, wafer-to-wafer uniformity, metal contamination, drying marks, chemical and water efficiency, throughput, footprint, automation, uptime, recipe portability, and service response. Installed-base credibility is decisive because a process change can affect device yield across many downstream steps. Emerging vendors can win through competitive ownership cost and local support, but qualification evidence, intellectual property, controls software, and reliable critical-component sourcing remain major entry barriers.
Key companies profiled
- Shibaura Mechatronics
- SCREEN Semiconductor Solutions
- Tokyo Electron
- Veeco Instruments
- RENA Technologies
- AP&S International GmbH
- Modutek
- Wafer Process Systems
- Chemical Art Technology
- Solstice
- SiSTEM Technology
- Amerimade Technology
- PNC Process Systems
- ACM Research
- NAURA Technology Group
- Asia Electronics
- Kingsemi
Wet Process Equipment Production Capacity Analysis
Production capacity is a material competitive factor in the Wet Process Equipment market because electrical performance depends on specialised processes, qualified materials, repeatable yields and application-specific test capability. Capacity cannot be assessed only by nominal factory floor area: effective supply is the output that passes dimensional, electrical, reliability and customer qualification requirements at the required product mix.
Production capacity depends on engineering, machining, fluid-system assembly, chemical-compatible materials, robotics, controls, chamber fabrication, software integration, factory acceptance testing, and field installation. A wet platform may contain hundreds of valves, pumps, filters, sensors, heaters, nozzles, tanks, exhaust interfaces, and safety interlocks. Capacity therefore cannot be judged by floor space alone; qualified suppliers, trained technicians, configuration discipline, and test-bay availability determine how many complete systems can ship and start production.
Tool configuration strongly influences throughput. Standardized frames, modular process chambers, common controls, and reusable chemical-delivery architectures shorten assembly and validation, whereas customer-specific wafer handling, uncommon chemistries, special materials, or local safety codes add engineering work. Manufacturers must also coordinate long-lead robotics, precision motion, high-purity fluid components, programmable controllers, and electronics so completed subsystems arrive in the right build sequence without creating idle work-in-process.
Field capacity is equally important because revenue conversion and customer output depend on installation, facilities hookup, recipe qualification, and acceptance. Service teams must support corrosive-chemical systems, contamination investigations, preventive maintenance, software changes, and spare-parts planning. Vendors with regional demonstration laboratories, applications engineers, remote diagnostics, and a large installed base can qualify new processes faster and sustain utilization after shipment, improving both customer confidence and repeat-order probability.
Wet Process Equipment Market Dynamics: Drivers, Restraints and Opportunities
Wet Process Equipment market growth reflects expanding electronic content and higher performance requirements, moderated by manufacturing complexity, long qualification cycles and competing technologies. The impact ranges below are directional analytical estimates rather than additive forecasts; they show the relative pressure each factor can place on the baseline CAGR when other assumptions remain broadly stable.
Market growth reflects rising wafer starts, additional cleaning steps at advanced nodes, more complex three-dimensional structures, and investment in advanced packaging and compound semiconductors. The opportunity is tempered by cyclical capital spending, long customer qualification, and the concentration of leading-edge purchases among a limited number of large fabs. Equipment suppliers must balance aggressive development with disciplined capacity planning because program timing can shift when customers revise construction, process, or utilization schedules.
Environmental performance is becoming a purchasing criterion alongside yield and throughput. Wet processing consumes high-purity water and hazardous or costly chemistries, creating demand for tighter dispense control, longer bath life, point-of-use recycling, reduced exhaust load, and better waste segregation. Improvements must preserve surface quality and contamination control; customers will not accept resource savings that reduce yield, accelerate corrosion, or create residue on critical device structures.
MARKET DRIVERS
Drivers Impact Analysis*
| Driver | (~) % impact on CAGR forecast | Geographic relevance | Impact timeline |
|---|---|---|---|
| More critical cleans in advanced devices | +1.2% | Taiwan, South Korea, United States, Japan | Long term (≥4 years) |
| New fab construction and equipment localization | +1.0% | Asia Pacific, North America, Europe | Medium term (2–4 years) |
| Advanced packaging and silicon photonics | +0.8% | Taiwan, United States, South Korea, Europe | Medium term (2–4 years) |
| Compound-semiconductor manufacturing | +0.6% | China, Europe, Japan, North America | Long term (≥4 years) |
| Water and chemical efficiency upgrades | +0.5% | All major semiconductor regions | Short term (≤2 years) |
| Predictive maintenance and process analytics | +0.4% | Leading fabs worldwide | Medium term (2–4 years) |
Advanced logic and memory devices require repeated removal of particles, residues, native oxides, metals, and sacrificial materials without damaging increasingly delicate structures. Gate-all-around transistors, high-layer-count NAND, advanced DRAM, and backside processing increase selectivity and uniformity demands. This creates replacement and upgrade opportunities for single-wafer cleaning, batch immersion, spray, drying, and chemical-management platforms capable of reproducible recipes at production throughput.
Geographic fab expansion supports equipment demand across the United States, Europe, Japan, South Korea, Taiwan, China, India, and Southeast Asia. New fabs need complete tool sets, while existing sites add modules or replace aging systems. Regional incentives can accelerate orders, but suppliers must meet local content expectations, export controls, safety rules, utilities specifications, and service-response requirements. A broad support network therefore becomes a commercial advantage alongside process performance.
Advanced packaging, silicon photonics, MEMS, and compound semiconductors broaden the addressable market beyond conventional front-end silicon. These applications require solvent cleans, photoresist removal, copper and metal etch, electroplating, surface activation, and handling of warped, thinned, bonded, or non-silicon substrates. Flexible wet platforms that accommodate multiple sizes and materials can secure development programs that later scale into repeat production orders.
MARKET RESTRAINTS
Restraints Impact Analysis*
| Restraint | (~) % impact on CAGR forecast | Geographic relevance | Impact timeline |
|---|---|---|---|
| High capital and facilities cost | −1.0% | New and expanding fabs | Persistent |
| Long process qualification cycles | −0.8% | Leading-edge and specialty production | Persistent |
| Chemical safety and wastewater obligations | −0.6% | All manufacturing regions | Long term (≥4 years) |
| Cyclical semiconductor capital spending | −0.5% | Global equipment programs | Medium term (2–4 years) |
| Export controls and critical-component concentration | −0.4% | Cross-border equipment supply | Medium term (2–4 years) |
Capital intensity and qualification time restrict purchasing. A production wet station requires facilities, chemical distribution, exhaust, wastewater treatment, automation interfaces, process recipes, and extensive safety review in addition to the equipment purchase. Customers may delay orders when utilization falls or technology plans change, while suppliers continue carrying engineering and inventory costs. Smaller fabs and research users may choose refurbished or semi-automatic equipment when a fully automated platform cannot be economically justified.
Chemical safety and environmental compliance increase design and operating complexity. Acids, bases, oxidizers, solvents, and metal-bearing waste require compatible materials, leak detection, ventilation, segregation, emergency controls, operator training, and documented maintenance. Requirements vary by jurisdiction and site. Equipment changes must be evaluated for emissions, wastewater, fire protection, worker exposure, and process contamination, extending approval cycles and raising lifecycle support expectations.
Trade controls, concentrated component supply, and intellectual-property restrictions can disrupt deliveries or market access. Precision valves, pumps, robotics, controllers, specialty polymers, and high-purity components may have limited qualified sources. Substitution is slow because materials and flow behavior can affect contamination and process results. Vendors must maintain configuration control and regional inventories while avoiding uncontrolled redesigns that would trigger customer requalification or compromise tool matching.
MARKET OPPORTUNITIES
Resource-efficient cleaning and etching platforms offer a strong opportunity as fabs seek lower water, chemical, energy, and abatement intensity per good wafer. Point-of-use concentration monitoring, adaptive dispense, chamber isolation, bath-life control, and selective recycling can reduce consumption. Suppliers can capture value by documenting both process performance and utility savings, enabling customers to compare total ownership cost without treating environmental objectives as separate from manufacturing economics.
Integrated sensing and analytics can improve uptime and yield. Pressure, flow, temperature, concentration, particle, exhaust, and equipment-state data can identify drift before wafers are affected. Predictive maintenance is valuable when models distinguish real component degradation from harmless process variation. Secure remote support, standardized data interfaces, chamber matching, and traceable software releases can turn installed tools into a recurring services and optimization relationship rather than a one-time capital sale.
Localized application laboratories and service hubs create market access in emerging semiconductor regions. Customers commissioning new fabs need process demonstrations, chemical trials, operator training, spare parts, and fast escalation. Suppliers that pair competitive equipment with experienced local engineers can reduce startup risk. Partnerships with chemical companies, automation providers, wastewater specialists, and research institutes can strengthen a complete solution for specialty devices and new materials.
Wet Process Equipment Supply Chain Analysis
The Wet Process Equipment supply chain links specialty materials and wafer or ceramic processing equipment to high-precision manufacturing, packaging, distribution and downstream system integration. Commercial resilience depends on qualified alternate materials, realistic yield assumptions, geographic redundancy and traceable process controls because a nominal second source is not interchangeable until the customer has validated electrical behaviour, reliability and package compatibility.
The supply chain begins with stainless steel and chemical-resistant polymers, quartz, tanks, precision pumps and valves, filters, heaters, nozzles, sensors, robotics, motion controls, programmable controllers, safety systems, software, and high-purity chemical-delivery components. Equipment manufacturers integrate these inputs into process modules and factory-ready platforms. Fabs then connect tools to ultrapure water, chemicals, exhaust, abatement, automation, metrology, and wastewater systems before recipe qualification and volume production.
Resilience depends on qualified alternates, documented materials, and lifecycle support. A replacement seal, tube, valve, filter, pump, or controller can change chemical compatibility, particle performance, flow stability, or software behavior. Strong vendors maintain approved bills of material, traceable revisions, obsolescence plans, regional spares, and rapid failure analysis. Close coordination with chemical suppliers and customers helps ensure that new chemistries are introduced without unexpected equipment degradation or contamination.
Recent Developments in the Wet Process Equipment Market
Developments tracked to September 2026 and linked to official company or industry sources.
- August 2026 Published
ACM Research announced expansion of its Ultra C Tahoe into a broader wet-processing platform, extending a product family that combines multiple cleaning and process functions for semiconductor manufacturing. Source - October 2025 Published
Veeco received multiple orders for WaferStorm, WaferEtch, and AP300 systems supporting advanced packaging and silicon-photonics production at a specialist semiconductor foundry. Source - October 2025 Published
Tokyo Electron completed a new development building in Kumamoto for coater/developers, cleaning systems, and advanced 3D-packaging equipment, expanding engineering infrastructure for future process requirements. Source - April 2025 Published
Veeco reported qualification of its WaferStorm and WaferEtch wet-processing platform for two additional advanced-packaging applications at a global semiconductor IDM, together with initial system orders. Source - 2025 Published
SCREEN continued to position the SU-3400 single-wafer cleaner around productivity and processing performance for 300 mm manufacturing, reflecting ongoing competition in high-volume automated cleaning systems. Source
REPORT SCOPE & SEGMENTATION
| Attribute | Details |
|---|---|
| Study Period | 2021–2034 |
| Base Year | 2025 |
| Estimated Year | 2026 |
| Forecast Year | 2034 |
| Historical Period | 2021–2025 |
| Market Size 2025 | USD 7.09 billion |
| Market Size 2034 | USD 11.37 billion |
| Growth Rate | CAGR of 5.4% from 2026–2034 |
| Unit | Value in USD billion and shipment or production volume where disclosed |
| Segmentation | By Type, By Application, additional technology axis and By Region |
| By Type | Fully Automatic · Semi-automatic · Manual |
| By Application | 150 mm Wafer · 200 mm Wafer · 300 mm Wafer · Other Specialized Applications |
| By Processing Technology and End User | Batch Spray Processing · Single-Wafer Processing · Immersion Processing · Integrated Device Manufacturers · Foundries · OSAT Providers · Research Institutes |
| By Region | Each region analysed by type, application and countryNorth AmericaU.S., Canada, MexicoEuropeGermany, France, U.K., Italy, Nordic Countries, BeneluxAsia PacificChina, Japan, South Korea, India, Southeast AsiaSouth AmericaBrazil, Argentina, Rest of South AmericaMiddle East & AfricaTurkey, Israel, Saudi Arabia, UAE, Rest of MEA |
| Key Companies Profiled | Shibaura Mechatronics; SCREEN Semiconductor Solutions; Tokyo Electron; Veeco Instruments; RENA Technologies; AP&S International GmbH; Modutek; Wafer Process Systems; Chemical Art Technology; Solstice; SiSTEM Technology; Amerimade Technology; PNC Process Systems; ACM Research; NAURA Technology Group; Asia Electronics; Kingsemi |
| Customization Scope | Free report customization equivalent to up to four analyst working days with purchase, including additions or alterations to country, regional and segment coverage. |
Frequently Asked Questions
What is wet process equipment?
The Wet Process Equipment Market is valued at USD 7.09 billion in the 2025 base year and is projected to reach USD 11.37 billion by 2034, expanding at a CAGR of 5.4% during 2026–2034. The outlook covers fully automatic, semi-automatic, and manual platforms used across 150 mm, 200 mm, 300 mm, and specialty-substrate processing, with Asia Pacific holding the leading regional position.
What is the market outlook through 2034?
Demand is expected to rise through 2034 as semiconductor manufacturers add wafer capacity, introduce more critical cleaning steps, and invest in advanced packaging, silicon photonics, compound semiconductors, MEMS, and power devices. Equipment upgrades will also target lower particle addition, better selectivity, automated handling, reduced chemical and water consumption, predictive maintenance, and dependable regional service across both leading-edge and mature-node factories.
Which equipment type leads?
Fully automatic equipment leads in high-volume manufacturing because robotic wafer handling, recipe control, chamber matching, contamination management, and factory connectivity improve repeatability and labor productivity. Semi-automatic and manual platforms remain important for research, pilot lines, specialty materials, low-volume production, and mature facilities where flexibility or lower capital cost outweighs maximum throughput. The optimal configuration depends on process risk, wafer volume, and product mix.
Which wafer size creates the largest demand?
The 300 mm segment creates the largest equipment value through leading logic, memory, and high-volume analog production, where sophisticated automated systems and stringent defect control are required. The 200 mm segment remains commercially important for power, analog, MEMS, radio-frequency, and automotive devices. Smaller and specialty substrates sustain demand for flexible tools in compound-semiconductor, research, photonics, and packaging applications.
Why does Asia Pacific lead?
Asia Pacific leads because Taiwan, South Korea, China, Japan, and Southeast Asia contain extensive foundry, memory, integrated-device, packaging, materials, and equipment ecosystems. Japan contributes major cleaning-tool and component suppliers, while regional fabs account for substantial wafer capacity and capital spending. North America and Europe remain strategically important for leading-edge technology, equipment development, power semiconductors, research, and government-supported manufacturing expansion.
What drives market growth?
Growth is driven by new fab construction, rising wafer starts, more cleaning steps per wafer, three-dimensional device architectures, advanced-node contamination limits, high-layer-count memory, compound semiconductors, silicon photonics, and advanced packaging. Customers are also upgrading equipment to reduce chemical and water use, improve automation, increase traceability, and obtain better process monitoring. Installed-base service, retrofits, software, and spares add recurring demand.
What restrains adoption?
High capital cost, long qualification, cyclical fab spending, chemical-safety requirements, wastewater obligations, export controls, and limited sources for critical components restrain adoption. Tools must integrate with site utilities, automation, recipes, metrology, and safety systems before production. A change to materials or fluid components can affect particles or chemistry, making substitution slower than ordinary industrial equipment procurement and increasing lifecycle inventory requirements.
How do suppliers compete?
Suppliers compete through defect performance, cleaning efficiency, etch selectivity, wafer uniformity, throughput, chemical use, water use, footprint, reliability, automation, process flexibility, and total ownership cost. Customer confidence also depends on application laboratories, installed-base history, intellectual property, recipe support, regional service, spare-parts availability, and disciplined change control. Qualification success and sustained yield determine repeat orders more than headline tool specifications alone.
Where are the best opportunities?
Attractive opportunities include advanced packaging, backside processing, silicon photonics, silicon carbide, gallium nitride, high-layer-count memory, gate-all-around logic, and resource-efficient cleaning. Digital monitoring, predictive maintenance, chemical concentration control, point-of-use recycling, and modular platforms can improve both yield and sustainability. Emerging semiconductor regions also need local demonstration, installation, training, and service capacity as new facilities move from construction into qualified production.
Which companies are covered?
The report covers Shibaura Mechatronics, SCREEN Semiconductor Solutions, Tokyo Electron, Veeco Instruments, RENA Technologies, AP&S International, Modutek, Wafer Process Systems, Chemical Art Technology, Solstice, SiSTEM Technology, Amerimade Technology, PNC Process Systems, ACM Research, NAURA Technology Group, Asia Electronics, and Kingsemi. Profiles examine technology, product range, process focus, manufacturing and service capability, geographic reach, partnerships, and recent developments.
Get Sample Report PDF for Exclusive Insights
Report Sample Includes
- Table of Contents
- List of Tables & Figures
- Charts, Research Methodology, and more...
 Download Sample Report PDF