
Key Statistics
Key Takeaways
- North America is the largest regional market because aerospace, defense, satellite, semiconductor test and high-end RF instrumentation create a dense installed base for programmable switch matrices and automated test systems.
- Fanout matrices remain central to satellite and broadcast signal distribution, while modular and solid-state matrix architectures are gaining importance where users need faster reconfiguration, higher port density or compact automated-test integration.
- ATE test stations are a major application because switch matrices reduce manual reconnection and allow multiple instruments and devices under test to share controlled RF paths, improving test repeatability and throughput.
- 5G and 6G test complexity expands the number of RF paths and frequency bands that laboratories must automate. Ericsson reported 3.3 billion 5G subscriptions by mid-2026 and more than 90 commercial 5G standalone launches, supporting continued investment in RF validation and network equipment.
- Defense and space spending provides a second independent demand engine. SIPRI reported global military expenditure of USD 2.887 trillion in 2025, while satellite and radar modernization require wideband, high-isolation routing and reliable automated test infrastructure.
RF Matrix Switch Market Overview
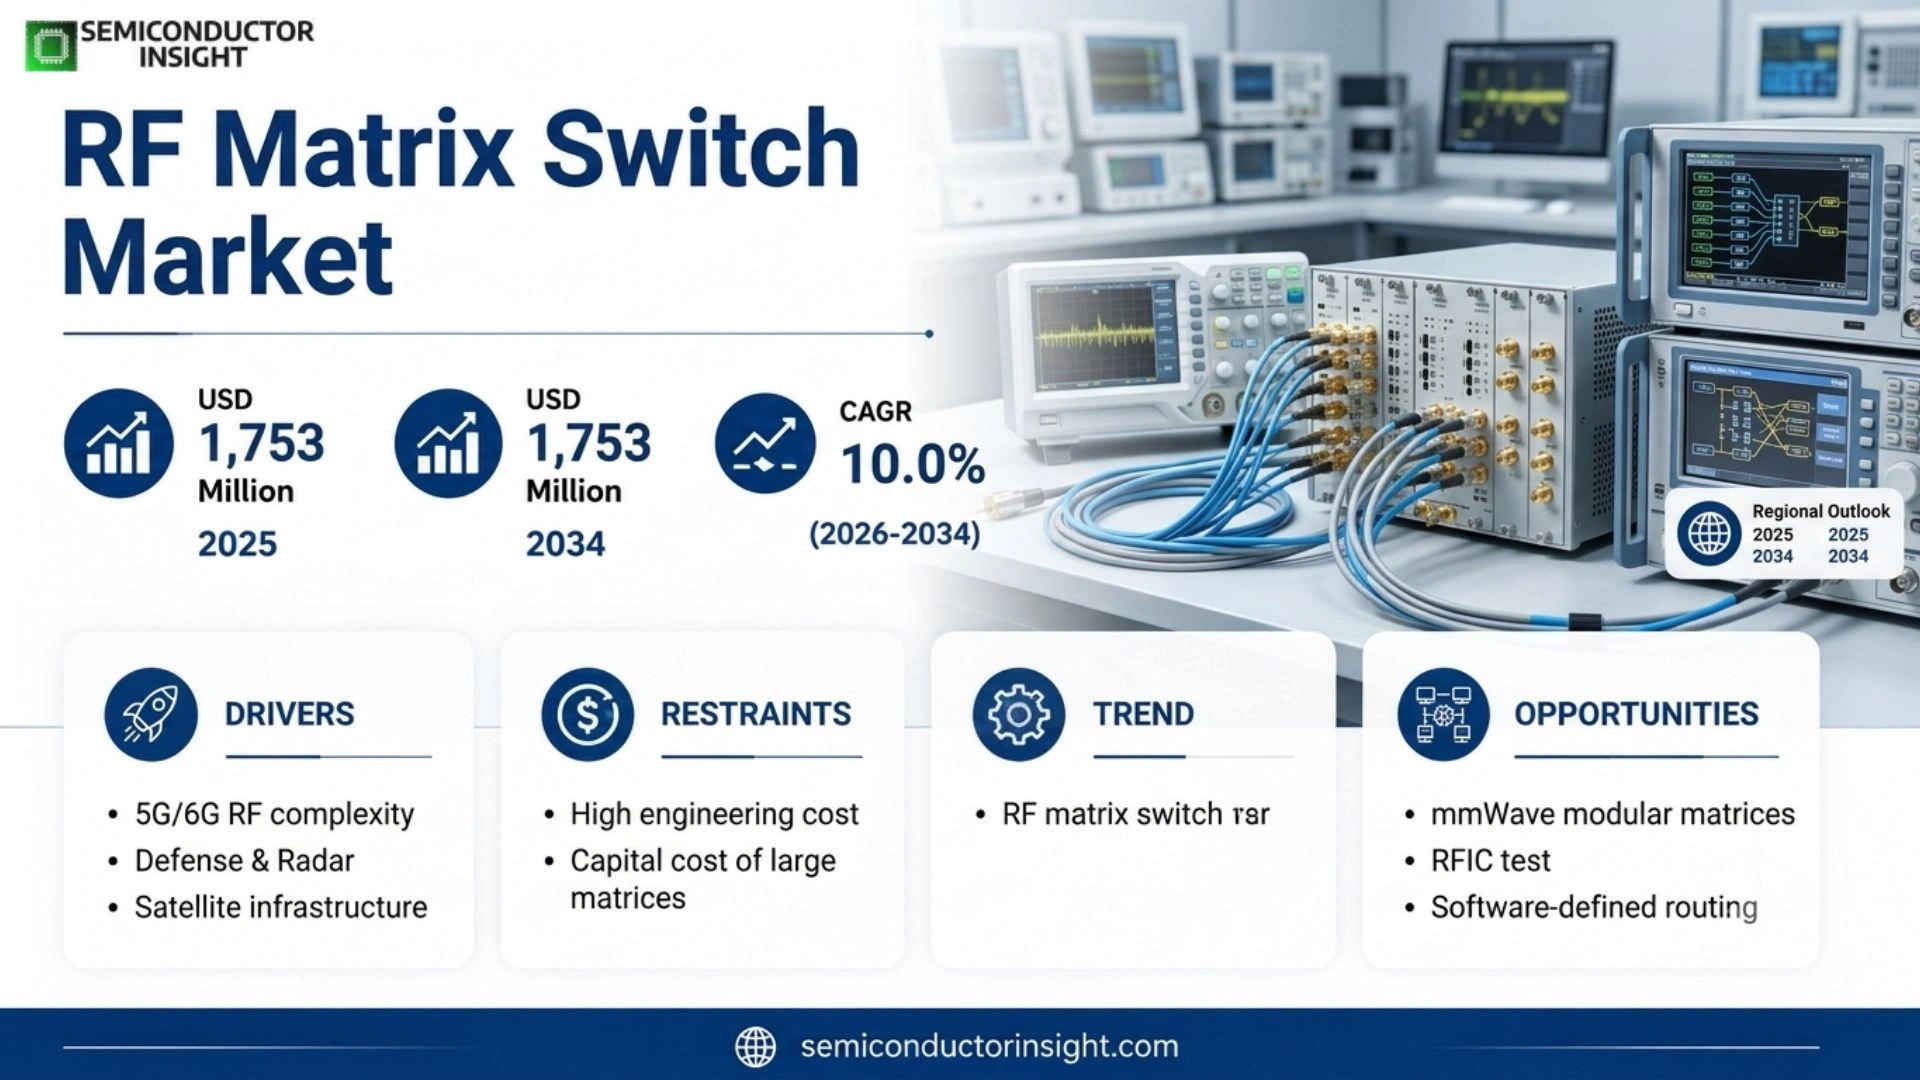
RF Matrix Switch Market is estimated at USD 746 million in 2025 and is projected to reach USD 1,753 million by 2034, representing a CAGR of 10.0% during 2026–2034. North America is the largest regional market, supported by aerospace and defense test, satellite communications, wireless R&D and a mature electronic-test ecosystem.
An RF matrix switch is an automated routing system that connects multiple RF or microwave inputs to multiple outputs without repeatedly moving physical cables. Depending on topology, the matrix can distribute one signal to many destinations, combine multiple sources toward selected receivers, or provide non-blocking crosspoint access between instruments and devices under test. Practical systems integrate switches, couplers, attenuators, amplifiers, filters, control electronics and software so signal paths remain repeatable across automated test sequences.
The technical buying criteria are insertion loss, isolation, return loss, frequency coverage, power handling, switching speed, repeatability, port density and long-term reliability. Keysight describes RF switch matrices as automated routing and signal-conditioning platforms for RF/microwave ATE and offers modular systems supporting frequencies up to 67 GHz, while ETL Systems provides satellite-oriented matrices from 4×4 to 256×256 and beyond. The market therefore spans compact modular instruments, large rack-scale distribution systems and fully customized test assemblies.
Demand is diversified across telecommunications, satellite communications, radar, defense electronics and semiconductor test. Ericsson reported that 5G subscriptions reached roughly 3.3 billion in 2026, while SIPRI put world military expenditure at USD 2.887 trillion in 2025. These independent investment cycles raise the number of RF chains that must be validated, monitored or redundantly routed, making automated matrix switching a productivity and system-availability component rather than a discretionary accessory.
Segment Analysis: By Type
By type, the market includes Fanout Matrix, Fanin Matrix, Modular RF Switch Matrix, Solid-State RF Matrix and other customized architectures. Fanout systems remain important for distributing satellite and broadcast signals, while modular and solid-state systems gain share where customers need faster switching, software-defined configuration and high test density.
| Type | Technical role | Market position |
|---|---|---|
| Fanout Matrix | Distributes one or more RF inputs to multiple destinations, often with amplification or conditioning. | Strong in satellite ground infrastructure, monitoring, broadcast and multi-receiver environments where one source must be shared across many endpoints. |
| Fanin Matrix | Selects or combines multiple source paths toward one or more destinations. | Used for antenna, modem, receiver and monitoring architectures that need controlled source selection and redundancy. |
| Modular RF Switch Matrix | Rack or PXI-style building blocks combine standardized switch modules under software control. | Fast-growing where laboratories want configurable port counts, easier maintenance and shorter lead times than a fully custom matrix. |
| Solid-State RF Matrix | Uses semiconductor switching technologies such as SOI, pHEMT, PIN-diode or related devices. | Favored for fast switching, long cycle life and compact size; insertion loss and power handling must be balanced against mechanical-relay alternatives. |
| Others / Custom | Application-specific non-blocking, hybrid electro-mechanical, optical-RF or conditioned routing assemblies. | High-value niche where signal conditioning, custom connectorization, calibration or unusual topology is integrated into one test or mission system. |
Frequency coverage and topology economics
Matrix architecture changes materially with frequency and topology. Keysight’s modular L8990M platform supports up to 30 switch channels in a 2U enclosure with frequencies up to 67 GHz, while ETL’s satellite matrices scale from 4×4 to 256×256 and beyond with IF, L-band and Ka-band-ready options. At higher frequencies, connector quality, cable length, path equalization and isolation become more difficult, so a system integrator can capture significant value by guaranteeing end-to-end path performance rather than simply assembling discrete switches.
Segment Analysis: By Application
By application, the market is segmented into Satellite Communication, Radar, ATE Test Station, Aerospace & Defense and Telecommunication. ATE test stations are a core growth application because every additional band, antenna path and device variant increases the number of connections that laboratories must automate while preserving repeatable RF performance.
| Application | Demand characteristics |
|---|---|
| Satellite Communication | Ground stations, gateways and monitoring centers use matrices for antenna-to-modem routing, redundancy, fanout distribution and carrier monitoring. High availability, remote control and scalability are central purchasing criteria because signal paths are part of live operational infrastructure. |
| Radar | Radar development and production test require routing among sources, receivers, calibration paths and phased-array channels. Systems emphasize isolation, repeatability, power handling and phase-stable performance across defined frequency bands. |
| ATE Test Station | Automated electronic test uses matrices to share expensive RF instruments across multiple devices under test and to eliminate manual cable changes. The economic value comes from higher throughput, repeatability and reconfigurability as product variants and frequency bands multiply. |
| Aerospace & Defense | Mission systems, electronic warfare, radios and avionics require rugged, traceable and often custom switching. Long qualification cycles support high margins but raise the cost of entry for suppliers without defense-grade engineering and lifecycle support. |
| Telecommunication | 5G radios, base stations, devices and emerging 6G research require automated path routing across sub-6 GHz and millimeter-wave bands. As MIMO channel counts rise, software-controlled switching reduces bench complexity and improves test reuse. |
Regional Analysis
North America leads the RF matrix switch market because it combines the largest concentration of aerospace and defense spending, satellite and wireless R&D, semiconductor test infrastructure and high-end instrumentation suppliers. Asia Pacific is the fastest-growing region as 5G, defense electronics and local test-equipment ecosystems expand.
How does regional demand differ across the RF matrix switch market?
Regional demand reflects the mix of live RF infrastructure and R&D intensity. North America emphasizes defense, space and high-end automated test. Europe combines satellite communications, aerospace and precision measurement. Asia Pacific adds the fastest growth in telecom, electronics manufacturing and local RF component capability. South America remains more concentrated in satellite, broadcast and industrial test, while Middle East & Africa demand is led by defense, satellite infrastructure and rapidly expanding Gulf telecommunications networks.
| Region | Position | Growth outlook | Demand profile | What decides supplier selection |
|---|---|---|---|---|
| North America | Largest | Strong | Defense, space and ATE led | Frequency performance, calibration, reliability and lifecycle support |
| Europe | Second tier | Strong | Satellite, aerospace and precision-test led | Path repeatability, documentation, integration and compliance |
| Asia Pacific | Fastest growing | Highest | 5G, electronics manufacturing and defense led | Cost-performance, local support and scalable port density |
| South America | Small base | Selective | Satellite, broadcast and industrial test led | Landed cost, serviceability and modular expansion |
| Middle East & Africa | Emerging | Strong project growth | Defense, satellite and telecom led | Ruggedness, remote management and supply assurance |
Competitive Landscape
Competition spans complete matrix-system integrators, RF component suppliers and test-instrument vendors. System-level winners differentiate through guaranteed path performance, software control, topology flexibility and long-term service, while component specialists supply the switches, attenuators, amplifiers and control ICs that determine bandwidth, isolation and switching speed.
ETL Systems is strongly positioned in satellite communications with matrix systems scaling from 4×4 to 256×256 and beyond, while Keysight competes in automated test through custom and modular matrix platforms. Rohde & Schwarz supplies switch matrices integrated with vector network analysis. These companies capture value by delivering complete routing architectures rather than individual RF switches, which reduces integration risk for customers that need calibrated, repeatable multiport performance.
The component layer includes Qorvo, Analog Devices, Murata, MACOM, Mini-Circuits and related RF specialists. Analog Devices highlights solid-state and MEMS switching matrices, including DC-to-14 GHz MEMS switch products, while Qorvo offers SOI, pHEMT, GaN and PIN-diode switching technologies across wide frequency and power ranges. Component technology influences matrix size, insertion loss, isolation, cycle life and power handling, so integrators often qualify several switch technologies for different path requirements.
Commercial differentiation increasingly shifts toward software and lifecycle support. A high-port-count matrix may remain in a production or mission system for many years, making APIs, remote monitoring, calibration workflows, replaceable modules and cybersecurity relevant to purchase decisions. Custom-system suppliers can therefore defend margins even when discrete RF switch prices fall, because customers are paying for verified end-to-end behavior and reduced engineering time.
Key Industry Players
- ETL Systems
- Quantic Corry
- Quintech Electronics & Communications, Inc.
- MPG Solutions
- Crecre
- Qorvo
- Murata
- NI
- Analog Devices
- NOVOTRONIK
- Mini-Circuits
- MACOM
- Peregrine
- JFW Industries
- Hongke Technology
Competitive capability map
| Competitive capability | Why it matters | Supplier implication |
|---|---|---|
| Frequency and path performance | Insertion loss, isolation, return loss and phase/amplitude repeatability determine whether the matrix preserves measurement accuracy. | Suppliers that guarantee end-to-end path specifications can capture system-level value beyond the price of individual switches. |
| Topology and port density | Fanout, fanin, non-blocking crosspoint and redundancy architectures serve very different network and test requirements. | Scalable modular platforms shorten lead time, while custom architectures win where conditioning or unusual routing is required. |
| Software and remote control | ATE and live communications systems need APIs, sequencing, monitoring and remote management. | Strong software integration increases switching utilization and reduces manual operations, raising customer switching costs. |
| Lifecycle and calibration support | Defense, satellite and production ATE systems can remain deployed for many years. | Long product availability, calibration, repair and module replacement become part of the commercial proposition. |
Production Capacity Analysis
RF matrix switch capacity is best understood as integration and test capacity rather than simple unit assembly. High-value systems require RF design, precision coaxial assembly, firmware, software, calibration and final verification across every path, so engineering throughput and automated calibration can constrain output before mechanical production does.
Discrete switch supply spans electromechanical relays, solid-state SOI and pHEMT devices, PIN-diode solutions and MEMS. Each technology trades switching speed, cycle life, insertion loss, isolation and power handling differently. Matrix manufacturers therefore need qualified multi-source component strategies but cannot substitute components casually because path performance, thermal behavior and control logic may change. At higher frequencies, connectors, cables, PCB materials and assembly tolerances become increasingly influential.
System integration creates a second capacity layer. Large matrices can contain dozens or hundreds of RF paths plus amplifiers, attenuators, filters, couplers, control cards and redundant power supplies. Every path may require insertion-loss and isolation verification. The manufacturing bottleneck therefore moves toward automated calibration, RF test equipment availability and skilled microwave engineering, especially for custom systems where a customer expects documented path-by-path performance before acceptance.
Modular architectures improve scalability by allowing standardized switch cards or modules to be combined inside common chassis and software frameworks. Keysight’s modular matrix approach and ETL’s scalable satellite matrices illustrate this strategy. Standardization lowers engineering content per order and supports field replacement, while fully custom systems remain important where topology, conditioning, connectors or frequency coverage cannot be met by catalogue modules.
| Capacity layer | Constraint | Market implication |
|---|---|---|
| RF switch components | Availability of qualified electromechanical, solid-state, MEMS, SOI, pHEMT or PIN-diode devices. | Component substitutions can alter insertion loss, isolation, power handling and lifetime, triggering redesign or requalification. |
| Mechanical/RF assembly | Connector quality, cable routing, shielding, PCB materials and thermal design. | Assembly precision becomes more critical as frequency and port density increase. |
| Firmware and software | Control APIs, switching logic, remote management and diagnostics. | Reusable software platforms increase manufacturing scalability and customer integration speed. |
| Calibration and final test | Path-by-path verification of loss, isolation, repeatability and control behavior. | High-port-count custom matrices can be test-equipment intensive, making automated calibration a key capacity multiplier. |
Market Dynamics
Market growth is supported by rising RF test complexity across 5G, satellite, radar and semiconductor applications. The main constraints are high-frequency engineering cost, signal-integrity tradeoffs, lengthy defense qualification and the risk that rapidly evolving standards make fixed-purpose matrix designs obsolete.
The core economic driver is test reuse. Expensive signal generators, analyzers and network analyzers can serve multiple devices or test nodes when a matrix routes signals automatically. As products add frequency bands, antennas and MIMO channels, manual cable changes become slower and less repeatable. Matrix switching converts connection management into software, allowing laboratories and factories to scale test coverage without multiplying every piece of RF instrumentation at the same rate.
Live network and satellite infrastructure create a different demand mechanism. Fanout and fanin matrices provide redundancy, monitoring and flexible carrier routing across antennas, modems and receivers. Here the value is system availability rather than laboratory throughput. Remote management, hot-swappable modules and redundant power supplies matter because the matrix can become part of an operational communications chain that must remain available around the clock.
Market Drivers
The strongest drivers are 5G/6G RF complexity, defense and radar modernization, satellite ground infrastructure and the automation economics of shared RF instrumentation.
| Factor | Estimated impact on CAGR forecast* | Commercial mechanism |
|---|---|---|
| 5G, mmWave and 6G test complexity | +2.8 pp | More bands, MIMO paths and protocol combinations increase automated routing requirements in R&D and production. |
| Defense, radar and electronic warfare | +2.1 pp | Higher global defense spending supports wideband, high-isolation test and mission-routing infrastructure. |
| Satellite communications expansion | +1.6 pp | Ground stations require scalable fanout/fanin, redundancy and remote signal management. |
| ATE productivity and instrument sharing | +1.2 pp | Matrices reduce manual reconnection and let multiple DUTs share expensive RF instruments. |
5G and 6G multiply automated RF test paths
Ericsson reported approximately 3.3 billion 5G subscriptions by mid-2026, with more than 90 service providers having launched or soft-launched 5G standalone networks. Wireless laboratories must validate more bands, carrier combinations, antennas and MIMO paths than earlier generations. A programmable matrix allows one test platform to serve many configurations through software, which reduces bench rewiring and improves repeatability as products move from sub-6 GHz into wider mmWave coverage.
Defense and radar modernization sustain high-value demand
SIPRI reported global military expenditure of USD 2.887 trillion in 2025, the eleventh consecutive year of growth. Modern radar, electronic-warfare, satellite and military-radio programs require RF routing both inside development laboratories and in production ATE. These applications tolerate premium pricing when a matrix offers wide bandwidth, high isolation, rugged construction, long lifecycle support and documentation aligned with defense procurement requirements.
Satellite ground systems need scalable redundancy and distribution
Satellite gateways and ground stations connect antennas, modems, receivers, monitoring equipment and backup paths. ETL Systems offers matrices from 4×4 to 256×256 and beyond, reflecting how quickly port counts can scale in operational networks. The purchasing requirement differs from lab ATE: remote control, redundant power, hot-swappable modules and failover behavior become as important as insertion loss because the matrix is part of live signal infrastructure.
ATE economics favor shared instruments and software-defined routing
High-end RF analyzers, sources and network analyzers are expensive assets. A switch matrix increases utilization by allowing several devices or test fixtures to share them under automated control. Keysight describes matrices as a way to route signals and conditioning automatically between test equipment and the unit under test, reducing manual connections and measurement time. The value grows with device variety and test-channel count.
Market Restraints
The main restraints are the engineering cost of preserving signal integrity at high frequency, the capital cost of large calibrated matrices, long qualification in defense and space, and lifecycle risk when standards or interface requirements evolve.
| Factor | Estimated impact on CAGR forecast* | Commercial mechanism |
|---|---|---|
| High-frequency signal-integrity complexity | -1.5 pp | Loss, isolation, reflections and phase stability become harder to control as frequency and port count increase. |
| Capital cost of high-port-count systems | -1.0 pp | Custom matrices can require expensive components, calibration and integration, limiting smaller laboratories. |
| Defense and space qualification cycles | -0.7 pp | Reliability, traceability and environmental testing delay program revenue and supplier changes. |
| Technology obsolescence risk | -0.5 pp | Rapid movement toward higher bands can shorten the useful life of fixed-frequency matrix designs. |
Signal integrity becomes harder as frequency and port density rise
Every connector, cable, switch and PCB transition contributes loss and reflection. At mmWave frequencies, mechanical tolerances that were negligible at lower bands can materially change path behavior, while high-density routing increases crosstalk and thermal concentration. Suppliers must invest in microwave design, simulation and automated verification, raising development cost and limiting the number of companies that can guarantee path-level performance across large custom matrices.
Large custom matrices require significant capital budgets
A matrix with many ports may contain hundreds of switching elements plus amplifiers, attenuators, couplers, filters, power supplies and control electronics. Calibration and documentation add further cost. Large defense, satellite and semiconductor customers can justify that investment through throughput or availability, but smaller laboratories may prefer manual patching, compact multiplexers or lower-port-count modular systems, limiting the addressable market for premium custom assemblies.
Qualification slows defense and space conversions
Aerospace and defense systems prioritize reliability, lifecycle support and traceability. New switching products can face environmental testing, configuration control and long customer qualification cycles before program adoption. This protects incumbent suppliers once specified, but it increases sales cost and delays return on R&D for new entrants. Component substitutions may also require customer review if they affect RF path performance or long-term support commitments.
Rapid standards evolution creates bandwidth risk
5G-Advanced and 6G research continue to push test frequencies and instantaneous bandwidth higher. A matrix optimized for one frequency range can become a bottleneck as laboratories move to new bands. Buyers therefore increasingly value modularity and broad frequency coverage, but those features raise cost. Suppliers must balance future-proofing against insertion loss, power handling and price, which can delay purchasing decisions when roadmaps are uncertain.
Market Opportunities
The strongest opportunities lie in mmWave modular matrices, semiconductor and RFIC test, satellite ground automation and software-defined routing platforms with health monitoring and remote orchestration.
Modular mmWave switching for 5G-Advanced and 6G research
Laboratories need to add channels and higher-frequency paths without replacing an entire test rack. Modular chassis that combine 18 GHz, 40 GHz, 67 GHz and future higher-band modules can preserve a common control plane while allowing staged hardware upgrades. Suppliers that minimize calibration burden between modules can capture recurring expansion revenue as test requirements evolve.
Semiconductor and RFIC automated test
RF front-end modules, beamformers, switches, filters and transceivers require multiport characterization. Keysight’s semiconductor-oriented low-leakage matrices and PXI RF switching products show how automated routing can be tailored to device characterization and reliability testing. As RFIC complexity grows, compact high-density matrices can increase tester utilization and reduce fixture change time in engineering and production environments.
Satellite gateway and ground-segment automation
Large LEO and multi-orbit satellite networks increase the number of antennas, gateways, modems and monitoring paths that must be managed. Scalable fanout and fanin matrices with redundancy, fiber interfaces and secure remote control can become core ground-segment infrastructure. The opportunity extends beyond hardware into network management software, preventive maintenance and lifecycle service contracts.
Predictive maintenance and software-defined matrix orchestration
Large switch matrices generate operating data such as cycle counts, path usage, alarms and RF level measurements. Integrating health monitoring and predictive maintenance can reduce unexpected failures and schedule service before a critical path degrades. Software-defined routing also allows one physical matrix to support multiple test profiles, increasing utilization and creating recurring value through control software and system updates.
Supply Chain Analysis
The supply chain begins with RF switching semiconductors, relays, connectors and microwave materials; moves through module and chassis assembly; and culminates in system calibration, software integration and field support. The highest-margin value is often captured after component assembly because customers pay for verified end-to-end path behavior.
RF switching components
Qorvo, Analog Devices, Murata, MACOM and Mini-Circuits supply technologies that integrators use to balance frequency, insertion loss, isolation, switching speed, cycle life and power handling. Solid-state devices offer speed and long mechanical life, while electromechanical switches can provide attractive low-loss or higher-power performance. No single technology dominates every application, so matrix makers maintain design libraries around several device classes.
Modules and control electronics
Reusable switch modules lower engineering cost and make field service easier. PXI, rack-card and proprietary modular formats combine switching elements with drivers, RF connectors and control logic. Standard modules also allow suppliers to configure a customer-specific port count without redesigning every RF path from first principles, improving delivery time and manufacturing repeatability compared with completely bespoke assemblies.
System integration and calibration
This is where much of the market’s value is created. Integrators determine topology, cable length, conditioning and shielding, then verify each path for insertion loss, isolation, return loss and switching behavior. High-port-count systems can require extensive automated calibration. Customers are willing to pay a premium for a documented matrix because it eliminates the engineering risk of integrating hundreds of discrete RF components themselves.
Deployment and lifecycle support
Operational matrices need software APIs, remote management, calibration records, spares and long-term configuration control. Satellite and defense users may require redundant power and hot-swappable modules, while production ATE customers prioritize minimal downtime and rapid replacement. Lifecycle support creates recurring service revenue and strengthens incumbent positions because replacing the matrix can require rewriting automation software and revalidating complete test sequences.
Recent Developments
Recent product and market developments point toward higher frequency coverage, greater port density and stronger demand from defense, satellite and 5G test environments.
Keysight’s current modular RF switch-matrix platform supports frequencies up to 67 GHz and offers 2U and 4U configurations with scalable channel counts. This reflects the market shift toward modular mmWave test infrastructure that can be configured faster than a fully custom matrix while still supporting 5G, aerospace, satellite and semiconductor validation workflows.
Rohde & Schwarz released updated specifications for its ZN-Z86 and ZN-Z86X switch matrices in January 2026. Continued development of multiport network-analysis switching highlights demand for scalable routing around vector network analyzers, where laboratories need more test ports without purchasing a separate analyzer receiver for every connection.
SIPRI reported that world military expenditure reached USD 2.887 trillion in 2025, with Europe up 14% and Asia and Oceania up 8.1% in real terms. The increase strengthens the demand environment for radar, electronic warfare, military communications and space systems, all of which require sophisticated RF validation and switching infrastructure during development and production.
Report Scope & Segmentation
The report covers RF matrix switch systems and related routing architectures across type, application, frequency range and end-user segments, with regional analysis across five major markets and the complete profiled company universe listed below.
| Attribute | Coverage |
|---|---|
| Base year | 2025 |
| Forecast period | 2026–2034 |
| Market size | USD 746 million in 2025; USD 1,753 million by 2034; CAGR 10.0% during 2026–2034. |
| By Type | Fanout Matrix; Fanin Matrix; Modular RF Switch Matrix; Solid-State RF Matrix; Others. |
| By Application | Satellite Communication; Radar; ATE Test Station; Aerospace & Defense; Telecommunication. |
| By Frequency Range | Below 1 GHz; 1–6 GHz; 6–18 GHz; Above 18 GHz. |
| By End User | Defense & Aerospace; Telecommunication; Electronics Manufacturing; Research & Development; Others. |
| Regions | North America; Europe; Asia Pacific; South America; Middle East & Africa. |
| Companies profiled | ETL Systems; Quantic Corry; Quintech Electronics & Communications, Inc.; MPG Solutions; Crecre; Qorvo; Murata; NI; Analog Devices; NOVOTRONIK; Mini-Circuits; MACOM; Peregrine; JFW Industries; Hongke Technology. |
Frequently Asked Questions
What is the 2025 RF Matrix Switch Market size?
The global RF Matrix Switch Market is estimated at USD 746 million in 2025. Revenue includes complete programmable RF and microwave routing matrices used in satellite communications, radar, ATE, aerospace and defense, telecommunications and research environments, with pricing influenced by port count, frequency range, topology, signal conditioning and calibration requirements.
What is the projected 2034 market size?
The market is projected to reach USD 1,753 million by 2034. Growth is supported by 5G and emerging 6G test complexity, rising defense and space expenditure, larger satellite ground infrastructures and increased use of automated test systems that share expensive RF instruments across many devices or signal paths.
What is the CAGR during 2026–2034?
The market is projected to grow at a CAGR of 10.0% during 2026–2034. The rate reflects simultaneous expansion across commercial wireless, satellite and defense applications, with modular and software-controlled architectures allowing customers to scale routing capacity as port counts and frequency requirements increase.
Which region leads the RF Matrix Switch Market?
North America is the largest regional market because it combines large aerospace and defense programs, satellite and space activity, semiconductor and wireless test infrastructure, and a mature high-end instrumentation ecosystem. Asia Pacific is the fastest-growing region as 5G, electronics manufacturing and defense modernization increase automated RF testing requirements.
Which product types are covered?
The report covers Fanout Matrix, Fanin Matrix, Modular RF Switch Matrix, Solid-State RF Matrix and other customized or hybrid architectures. The appropriate topology depends on whether a system distributes one source to many outputs, selects many sources toward receivers, requires full crosspoint access, or prioritizes switching speed and cycle life.
Which applications generate the strongest demand?
Core applications include Satellite Communication, Radar, ATE Test Station, Aerospace & Defense and Telecommunication. ATE and satellite infrastructure are particularly important because matrices provide measurable economic value: ATE users share expensive instruments and remove manual reconnection, while satellite operators gain redundancy, remote routing and scalable signal distribution.
How important is frequency range?
Frequency range is a primary design variable because insertion loss, isolation, return loss, connector choice and mechanical tolerance become increasingly difficult at higher frequencies. The report segments the market into Below 1 GHz, 1–6 GHz, 6–18 GHz and Above 18 GHz, with mmWave demand growing alongside 5G-Advanced, satellite and radar applications.
What is the difference between solid-state and electromechanical matrices?
Solid-state matrices typically offer faster switching, compact size and long cycle life because they do not depend on moving relay contacts. Electromechanical solutions can provide excellent low-loss, high-isolation and power-handling characteristics. Many high-performance systems use a mix of technologies, selecting the switch type according to frequency, speed, lifetime and power requirements for each path.
What are the main market restraints?
The main restraints are high engineering and calibration cost at microwave and mmWave frequencies, capital cost for large high-port-count systems, long aerospace and defense qualification cycles, and the risk that fast-moving wireless standards make narrowband or fixed-purpose architectures obsolete. Modular designs reduce some of these risks but usually carry a higher upfront cost.
Who are the key industry players?
The report profiles ETL Systems, Quantic Corry, Quintech Electronics & Communications, MPG Solutions, Crecre, Qorvo, Murata, NI, Analog Devices, NOVOTRONIK, Mini-Circuits, MACOM, Peregrine, JFW Industries and Hongke Technology. Competition spans complete system integrators, RF component suppliers and measurement-instrument vendors.
Get Sample Report PDF for Exclusive Insights
Report Sample Includes
- Table of Contents
- List of Tables & Figures
- Charts, Research Methodology, and more...




