Key Statistics
Key Takeaways
- Market scale: Passive optical mating interfaces form a distinct connectivity purchase category, with the 2025 base representing completed adapter units rather than the value of the host patch panel or active transceiver.
- Regional leadership: Asia-Pacific represents a modeled ~40% of 2025 revenue; manufacturing concentration and dense access-network construction make component availability especially important across China, Japan and India.
- Product mix: Single-mode adapters account for a modeled ~78% of the type axis, reflecting their role in access, metro and long-distance optical connections where alignment consistency matters.
- Application mix: Optical communication systems comprise a modeled ~62% of application demand, while passive signal distribution and test systems use adapters under different replacement and qualification cycles.
- Technology shift: LC, SC, SN and MPO interface choices increasingly determine rack density, maintenance access and compatibility; a smaller port does not automatically justify a higher total-system price.
- Commercial sensitivity: Fiber rollout, data-center interconnection and retrofit activity support demand, but supplier pricing, connector contamination and installation workmanship influence the realized unit economics.
Optical Fiber Adapter Market Overview
Optical Fiber Adapter Market is valued at USD 1,000.5 million in 2025, with an estimated USD 1,083.5 million in 2026 and a projected USD 2,050.5 million by 2034, corresponding to an 8.3% compound annual growth rate over the 2025–2034 valuation window. The relevant product is the passive mechanical alignment interface that mates two fiber connectors, not the cable, transceiver or entire rack. This distinction matters because a single distribution enclosure can incorporate numerous adapters while remaining one separate system-level purchase.
Demand for fiber mating hardware is driven by the number of usable optical ports, maintenance cycles and the reliability required at each demarcation point. A simplex housing joins one pair of connectors, whereas duplex, quad and multi-fiber assemblies concentrate additional connections in a fixed mounting area. LC and SC interfaces remain familiar in access and enterprise environments; SN and other compact formats target greater density. In this revenue boundary, the adapter unit is counted once at sale, whether it is delivered loose or subsequently mounted inside a larger passive enclosure.
Optical performance is governed by ferrule alignment, sleeve geometry and connector cleanliness. SENKO specifies a typical insertion loss of 0.10 dB, a maximum of 0.20 dB and an operating envelope from −40°C to +75°C for its standard LC adapter under defined test conditions. These are product-level specifications rather than market-wide performance averages. Ceramic alignment sleeves, latching strength, dust protection and repeatable mating can change the total cost of ownership because intermittent optical faults are often more expensive to diagnose than the passive component itself.
Regional demand is not identical to the location of adapter production. Asia-Pacific holds a modeled ~40% share of 2025 sales, North America ~30%, Europe ~19%, South America ~7% and Middle East & Africa ~4%. The North American calibration is informed by the publisher’s USD 255.02 million figure for 2023 relative to the global USD 853 million base. Other shares reflect analytical allocations based on fiber deployment, data-center concentration and component distribution rather than audited manufacturer revenue. The five regional weights add to 100% for the same base year.
The 2025 product mix is estimated at ~78% single-mode adapters and ~22% multimode adapters. The split is based on the installed role of single-mode fiber in long-reach carrier access and transport compared with shorter-reach multimode links. Connector style is a technical choice within these categories, not an additional publisher segmentation dimension. An LC adapter can be specified for different optical fiber modes, and a technician must still check connector polish, keyed orientation and ferrule compatibility before mating two cables.
Optical communication systems generate an estimated ~62% of application revenue, followed by optical power distribution systems at ~18%, optical test systems at ~13% and other uses at ~7%. The power-distribution label here refers to passive optical signal routing and splitting arrangements rather than electrical-grid transformers or power cables. Test applications include patching around optical time-domain reflectometers, power meters and laboratory characterization rigs. Industrial, medical and defense settings complete the smaller residual application group, with procurement requirements that can be stricter than their shipment volumes suggest.
Market expansion is linked to optical infrastructure construction but cannot be inferred directly from network investment announcements. Corning and Meta announced an up-to-USD 6 billion multiyear fiber, cable and connectivity agreement on 27 January 2026, followed by a manufacturing expansion groundbreaking on 31 March 2026. Neither statement isolates adapter sales, so both are used only to establish surrounding connectivity demand. In adapter purchasing, suppliers compete on tested loss, sleeve repeatability, connector footprint, environmental protection, availability and the ability to support consistent field installation at scale.
Segment Analysis: By Type
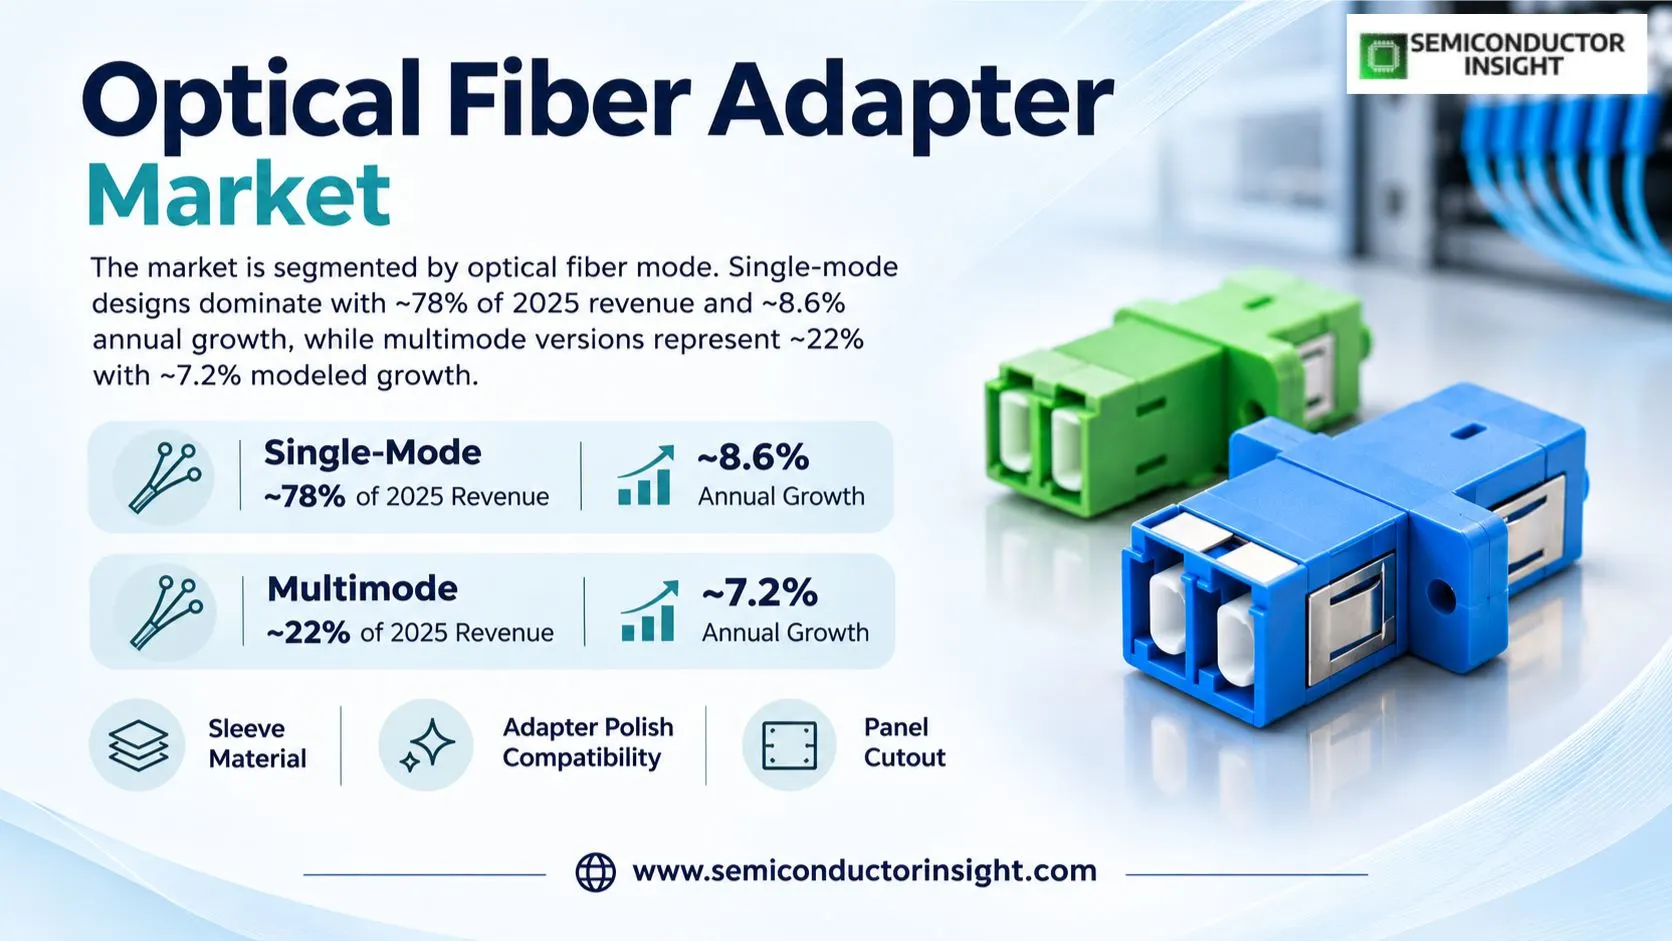
The publisher separates the market by optical fiber mode rather than by connector shape. Single-mode designs dominate with a modeled ~78% of 2025 revenue and a member growth assumption of ~8.6% annually, while multimode versions represent ~22% with ~7.2% modeled growth. The difference reflects the relative scale of carrier access and transport infrastructure, not a claim that multimode is technologically obsolete. Within each mode, sleeve material, adapter polish compatibility and panel cutout are purchase-level requirements.
| Type | 2025 modeled share | Technical and commercial positioning |
|---|---|---|
| Single Mode Adapter | ~78% of type revenue | Typically specified for OS2 access, distribution and longer-reach optical systems; common LC and SC mating interfaces rely on precise ferrule alignment, correct APC or UPC orientation and controlled insertion loss. The modeled ~8.6% member CAGR reflects recurring deployment and replacement demand rather than a direct vendor shipment series. |
| Multimode Adapter | ~22% of type revenue | Often deployed in OM3 and OM4 enterprise and data-center segments where shorter links and existing multimode assets shape purchasing. Mechanical interchangeability cannot substitute for optical compatibility checks. The modeled ~7.2% growth path incorporates rack changes, installed-base maintenance and the gradual mix shift toward single-mode connectivity. |
Single-mode adapters: precision matters across long-lived access links
In access networks, small component defects can disrupt a service circuit even when the surrounding fiber remains intact. The modeled ~78% share reflects broad OS2 deployment and frequent SC or LC termination at customer premises, distribution points and aggregation cabinets. Operators compare ceramic-sleeve repeatability, connector retention and APC versus UPC fit before qualifying a catalog item. An inexpensive adapter with a poorly controlled interface can impose truck-roll costs disproportionate to its purchase price.
Single-mode mating also becomes more demanding as dense rack designs compress working space. A port must remain accessible for cleaning, inspection and controlled insertion; higher faceplate density is useful only if technicians can maintain consistent optical margins. The ~8.6% modeled member growth rate assumes a continuing need for qualified passive components, while high-density SN and MPO products may redistribute sales among footprints rather than change the fiber-mode boundary.
Multimode adapters: installed enterprise networks sustain demand
Multimode installations are shaped by legacy OM3 and OM4 cabling, equipment-room upgrades and shorter in-building runs. The modeled ~22% base share is smaller than single-mode but remains relevant wherever existing structured cabling and transceiver choices make a complete migration uneconomic. Procurement must match adapter ferrule interfaces and connector color conventions with the installed plant; a passive mating sleeve does not itself convert an optical signal from one fiber mode to another.
A modeled ~7.2% annual path for multimode adapters assumes maintenance, selective densification and campus expansion, balanced by new single-mode designs in some greenfield deployments. In practice, buyers may prefer a low-loss replacement adapter to a large network recabling project when only a patching interface is worn or contaminated. This replacement behavior creates recurring sales but should not be mistaken for a corresponding increase in new fiber route length.
Interface families and mechanical formats cut across both types
LC, SC, FC, ST, SN and MPO describe mating formats or connector families, not separate revenue axes in the publisher classification. SENKO offers compact SN designs that place 6 or 12 fibers in legacy SC cutouts, showing how connector density can change without requiring the same number of new rack units. Some environments need shuttered ports, others prioritize an IP68 bulkhead or a keyed multi-fiber connection. The mode, connector interface and mounting geometry must all be specified together.
Segment Analysis: By Application
Application segmentation distinguishes where passive adapters perform their connection role. Optical communication systems represent a modeled ~62% of 2025 sales, optical power distribution systems ~18%, optical test systems ~13% and others ~7%. These percentages sum to 100% across one application axis and are not counts of individual end users. Against the USD 1,000.5 million global 2025 base, the allocation is a revenue split rather than a unit census. Each setting imposes a different balance of port density, insertion loss, cleaning access and environmental resistance.
| Application | Demand characteristics |
|---|---|
| Optical Communication System | Carrier access, metro aggregation, enterprise backbones and data-center cross-connects use adapters to create serviceable optical interfaces. The modeled ~62% share reflects the scale of recurring port provisioning and replacement; an ~8.8% member growth assumption emphasizes densification and broadband access rather than the sale of entire network systems. |
| Optical Power Distribution System | In this classification, the category refers to passive optical signal distribution in splitter cabinets and related optical routing assemblies. Its modeled ~18% share and ~7.5% member growth rate are distinct from electrical-power transmission equipment. Adapter choices depend on splitter packaging, connector polish, cabinet ingress protection and maintenance access. |
| Optical Test System | Laboratories and field-service benches use mating interfaces to connect light sources, power meters, OTDR instruments and reference cords. A modeled ~13% base share with ~7.8% growth reflects equipment refreshes, repeatability requirements and the cost of measurement error; the instrument itself is excluded from adapter revenue. |
| Others | Medical instruments, factory automation, defense links and specialist enclosures make up a modeled ~7% residual share. These applications can require unusual footprints, low particle generation or ruggedized housings. The ~7.1% modeled growth path is driven by design wins and replacement cycles rather than mass telecom rollouts. |
The application split matters because the same LC duplex adapter can be sold through very different procurement channels. A telecom operator may order standardized thousands of ports under a framework contract, whereas a calibration laboratory may buy small batches qualified against a traceable reference cord. Distribution cabinets emphasize sealed access and low maintenance; data-center panels emphasize port pitch and cable routing. These differing service requirements affect margins and product qualification even though all four groups buy a passive connector-mating component.
Demand should be measured at the adapter transaction rather than by counting every fiber or every splitter output as a separate market sale. A single 12-fiber compact adapter may serve several channels, and a replacement can occur without any new cable installation. The modeled ~62%, ~18%, ~13% and ~7% shares therefore allocate revenue across applications, not physical connector counts. This accounting distinction prevents double counting when adapter-equipped panels are purchased through system integrators.
Regional Analysis
Regional adapter demand depends on the number of installed optical interfaces and the serviceability of distribution equipment, rather than simply the length of newly laid fiber. Asia-Pacific is modeled at ~40% of 2025 revenue, North America ~30%, Europe ~19%, South America ~7% and Middle East & Africa ~4%. Member growth assumptions range from ~7.2% in Europe to ~9.0% in Asia-Pacific. These allocations are analytical estimates anchored by the publisher’s North American 2023 value, not independently reported regional adapter sales.
Which regional buying patterns determine the optical fiber adapter market?
The modeled regional ranking reflects differences in operator buildouts, installed port density, component manufacturing and maintenance practices. Dense Asian manufacturing clusters can shorten procurement lead times, while North American hyperscale and access projects favor qualification across repeat orders. European operators place particular weight on documented interoperability and lifecycle cost. Smaller South American and Middle Eastern markets may buy through distributors, with customs, currency and project sequencing shaping delivery schedules. These distinctions influence the adapter share of a connectivity bill of materials without altering the underlying product definition.
Across the 2025 base, the five regional shares total 100%, and each member has its own modeled growth rate to 2034. North America is calibrated near ~30% from the publisher’s USD 255.02 million 2023 regional figure against USD 853 million globally; the other allocations are inferred from fiber-access and data-center activity. Because vendor reporting often combines fiber, connectors, cable and cabinets, no company-wide optical revenue has been treated as an audited adapter-only regional denominator.
| Region | Position | Growth outlook | Demand profile | What decides supplier selection |
|---|---|---|---|---|
| Asia-Pacific | Largest (~40%) | ~9.0% CAGR | High port counts and regional manufacturing | Connector footprint, supply consistency and field-cleaning protocols |
| North America | Second (~30%) | ~7.5% CAGR | Hyperscale interconnect and access renewal | Supplier qualification, domestic lead time and insertion-loss control |
| Europe | Established (~19%) | ~7.2% CAGR | FTTH upgrades and standards-led procurement | IEC compatibility, cabinet fit and environmental durability |
| South America | Emerging (~7%) | ~8.8% CAGR | Urban fiber upgrades and operator expansion | Distributor reach, landed cost and replacement availability |
| Middle East & Africa | Developing (~4%) | ~8.6% CAGR | New access networks and harsh-site connectivity | Dust sealing, temperature tolerance and service support |
Competitive Landscape and Optical Fiber Adapter Suppliers
Competition spans precision adapter manufacturers, broad optical-connectivity vendors and industrial component distributors. Buyers compare sleeve material, optical loss, mating durability, mounting footprint and delivery consistency. SENKO, Corning, CommScope, Molex and Telegaertner publish product-level information relevant to passive adapters. The publisher also lists firms whose broader optical or electronic activities do not necessarily demonstrate direct adapter manufacturing. The relevant comparison is a qualified adapter SKU and its service support, not consolidated company revenue across unrelated systems.
SENKO competes through detailed LC, SN and rugged adapter families, including precision zirconia sleeves, shutter options and compact mounting. The standard LC product specifies 0.10 dB typical insertion loss, 0.20 dB maximum and 200 matings under a cited test framework. These values describe a particular component and test arrangement; they are not interchangeable with guaranteed field losses across every connector pair. High-density designs must also be evaluated for service access and cleaning, because packing more ports into a cabinet can increase handling risk.
Corning supplies LC and SC adapter products through its optical connectivity portfolio, including Everon ECO panel variants and ceramic sleeve assemblies. CommScope lists SC/UPC and SC/APC duplex interfaces with zirconia alignment, providing alternatives for established operator specifications. Molex offers LC, MPO and smaller form-factor adapter families across optical applications, while Telegaertner integrates connector interfaces into modular industrial distribution equipment. The common competitive thread is a tested mating interface, but each supplier differs in catalog breadth, mounting choices and end-market distribution.
Amphenol, CONEC, HellermannTyton, Phoenix Contact, TE Connectivity, Telegaertner and Optcore appear among the publisher’s profiled names and are relevant to connectivity procurement where specific adapter products can be substantiated. By contrast, a broad semiconductor or network-equipment portfolio is insufficient evidence of direct adapter manufacturing. The same caution applies to reseller listings: an electronics distributor can supply an adapter without designing its alignment sleeve. Supplier benchmarking therefore distinguishes manufacturer, brand owner, system integrator and channel reseller before drawing conclusions about competitive positioning.
Commercial differentiation is partly invisible in a simple unit-price comparison. An operator buying 10,000 standardized interfaces may require lot-level consistency, a fixed connector keying scheme and rapid access to identical replacement parts. A laboratory may prioritize low insertion-loss variation across repeated mating cycles, whereas an outdoor installation values sealing and cable-entry compatibility. The modeled market shares describe demand segments, not individual vendor market shares; there is no public adapter-only revenue series that would justify assigning precise global supplier percentages.
Tier structure
| Tier | Companies | Basis of competition |
|---|---|---|
| Precision specialists | SENKO; selected optical connector specialists | Sleeve alignment, compact port geometry, shutter mechanisms and cataloged insertion-loss testing. |
| Broad connectivity vendors | Corning; CommScope; Molex; TE Connectivity; Amphenol | Large component portfolios, customer qualification, integration with passive distribution hardware and global channel reach. |
| Industrial and channel suppliers | Telegaertner; CONEC; Phoenix Contact; HellermannTyton; Optcore | Industrial mounting variants, enclosure compatibility, local stocking and project-specific support. |
Key companies profiled
- SENKO Advanced Components
- Corning Optical Communications
- CommScope
- Molex
- Telegaertner
- Amphenol
- TE Connectivity
- CONEC
- HellermannTyton
- Phoenix Contact
- Optcore
Product Engineering, Connector Standards and Purchasing Criteria
An optical adapter is mechanically simple but its performance depends on micron-scale ferrule positioning and disciplined handling. Product selection requires matching connector family, polish geometry, fiber mode, sleeve construction, port orientation and panel mounting. Ceramic alignment sleeves are common in low-loss applications, while shuttered or sealed variants address service hazards. The market’s growth therefore comes from more optical interfaces and more demanding port configurations, not from the adapter adding active optical gain or converting one signal standard into another.
Connector interface standards provide the mechanical reference for mating, but they do not remove the need to inspect real components. Corning lists an LC duplex adapter with ceramic alignment sleeves conforming to IEC 61754-20 and TIA/EIA-604-10 interface specifications. The specification helps buyers screen compatibility, while actual optical loss depends on connector cleanliness, ferrule quality and the mated pair. For APC and UPC systems, mismatched polishing can cause avoidable reflection and damage; a color-coded housing should support, not replace, a documented compatibility check.
Panel density has become a design variable as data-center optical fabrics add interconnection points. SENKO’s SN compact SC-footprint family offers 6-fiber and 12-fiber arrangements in legacy opening formats, potentially increasing usable channels without replacing an entire cabinet. That benefit is conditional on matching SN connectors and respecting bend radius, access clearance and cable routing. High port count alone is not a measure of reliable network capacity, and a new adapter footprint may require new jumper inventory and technician procedures.
Outdoor and industrial applications require more than a low-loss indoor connector sleeve. SENKO describes an IP68-rated SC outdoor adapter, and Telegaertner offers protected distribution arrangements incorporating optical interfaces. The environmental rating applies to a specified assembly and installation, not every product sharing the same SC label. Purchasing teams should verify temperature range, ingress protection, material compatibility and service access against the actual enclosure, particularly where dust and moisture can affect mating surfaces between maintenance visits.
A technically acceptable adapter also needs a commercially workable supply plan. Procurement can specify acceptance testing, batch traceability, replacement interchangeability and qualified alternative part numbers for a 2026–2034 project horizon. These requirements reduce the risk of late-stage substitutions that fit the panel but change optical performance. Buyers should compare delivered cost and maintenance exposure alongside list price, because the adapter may represent a small percentage of system capital expenditure while remaining a frequent source of troubleshooting when connectors are dirty or poorly aligned.
Market Dynamics: Drivers, Restraints and Growth Opportunities
The forecast incorporates both infrastructure-led demand and practical limitations on passive interface sales. Six positive factors contribute a modeled +10.3 percentage points to the growth bridge, while four restraints remove a combined −2.0 points, producing the headline annual growth rate. These are analytical contributions, not statistically estimated causal coefficients. Their ordering reflects expected importance across 2026–2028, 2029–2031 and 2032–2034, with the impact windows showing how project maturity can change purchasing pressure.
MARKET DRIVERS
Drivers Impact Analysis*
| Market Drivers | Impact Rank | CAGR Contribution (%) | 2026–2028 | 2029–2031 | 2032–2034 |
|---|---|---|---|---|---|
| Fiber-to-premises port provisioning | High | +3.20% | High | High | Medium |
| AI data-center optical density | High | +2.50% | High | High | High |
| Legacy panel and connector retrofits | Medium-High | +1.80% | Medium | High | High |
| Passive signal distribution expansion | Medium | +1.20% | Medium | High | Medium |
| Optical testing and inspection needs | Low-Medium | +0.90% | Medium | Medium | High |
| Others (industrial and medical interfaces) | Low | +0.70% | Low | Medium | Medium |
FTTH termination points convert rollout into adapter orders
Fiber-to-the-premises construction adds customer termination boxes, splitter interfaces and distribution frames that require serviceable connector-mating hardware. Each installed location may need several ports, but the count depends on network architecture and whether a splice or connector is used. The +3.20-point modeled contribution reflects the broad installed-base expansion expected through the forecast, tempered by the fact that project budgets include civil works, cable and electronics beyond the passive adapter itself.
High-density AI facilities increase connector concentration
Optical interconnection in AI-focused data centers can raise the number of accessible ports per rack and create demand for compact LC, SN or MPO arrangements. Corning’s 2026 connectivity agreements show that large buyers are planning substantial optical infrastructure, although those commitments do not disclose adapter-only revenue. The modeled +2.50-point contribution reflects density, replacement and qualification needs. Successful adoption still depends on polarity control, cable routing and a technician’s ability to clean a port without disturbing neighboring connections.
Retrofitting distribution panels creates repeat purchases
Many optical networks retain cabinets and patching frames longer than the passive interfaces installed within them. An adapter may be replaced after mechanical wear, contamination or a connector-format change without rebuilding the entire fiber route. SENKO’s compact designs for SC-size cutouts demonstrate one route to improving port density in existing hardware. The +1.80-point contribution assumes continued retrofit activity, but customers must validate mounting, optical compatibility and maintenance tooling before changing the installed connector family.
Passive routing cabinets sustain a distinct application stream
Optical splitters and distribution cabinets create numerous connector points between feeder, distribution and customer-side fibers. The modeled +1.20-point contribution belongs to passive optical signal distribution rather than electrical-power transmission. Procurement may favor shuttered ports, low insertion-loss sleeves and consistent connector polish to simplify field operations. Growth depends on active projects and replacement demand; counting every splitter output as a separate adapter sale would overstate the addressable revenue.
Testing and specialist installations broaden the revenue base
Optical measurement benches, industrial controls and medical instruments need repeatable connector mating even when shipment volumes are smaller than telecom networks. The modeled +0.90-point testing contribution and +0.70-point residual contribution recognize these specialized use cases. Qualification may emphasize repeatability over hundreds of mating cycles, environmental tolerance or custom mounting. Such orders can support higher-value variants, but the value of OTDR instruments, medical systems and factory automation controllers is excluded from the adapter market.
MARKET RESTRAINTS
Restraints Impact Analysis*
| Market Restraints | Impact Rank | CAGR Contribution (%) | 2026–2028 | 2029–2031 | 2032–2034 |
|---|---|---|---|---|---|
| Commodity unit-price competition | High | -0.90% | High | High | Medium |
| Contamination and optical-loss failures | Medium-High | -0.50% | High | Medium | Medium |
| Standards and connector interoperability | Medium | -0.40% | Medium | Medium | High |
| Others (format migration and procurement delays) | Low | -0.20% | Low | Medium | Medium |
Pricing pressure limits revenue per optical port
Standard LC and SC adapters can be sourced from multiple suppliers, increasing price comparisons and margin pressure on undifferentiated housings. A modeled −0.90-point drag reflects the possibility that port volumes rise faster than revenue. Buyers still need to compare sleeve material, test conditions and replacement consistency, because a low quote does not guarantee a low service cost. Specialized shuttered, compact and sealed variants may defend pricing, but they require credible product-level performance evidence.
Contamination can erase the advantage of nominally low loss
Connector end-face debris and poorly maintained alignment sleeves introduce attenuation and reflection that may be mistaken for cable or transceiver faults. The modeled −0.50-point restraint captures inspection, cleaning and warranty friction, not a measured industry failure rate. SENKO’s cataloged insertion-loss values assume defined mating conditions; field results depend on handling. Operators can mitigate risk through protective shutters, dust caps, inspection protocols and technician training, yet those measures add operational cost and qualification steps.
Interface diversity complicates substitution and stocking
SC, LC, FC, ST, MPO and SN interfaces are not interchangeable simply because each joins optical connectors. APC and UPC polishing, keying, panel dimensions and fiber mode must be matched to avoid damage or performance degradation. The modeled −0.40-point drag reflects the burden of carrying multiple qualified SKUs and managing installation errors. Standards improve consistency within an interface family but cannot make every connector physically compatible with every adapter design.
Format transitions and project timing introduce uncertainty
A compact connector may improve rack density but require new patch cords, revised polarity documentation and installer training. The modeled −0.20-point residual restraint also covers delayed network tenders and distributor inventory adjustments. These effects can shift orders between quarters even when the long-term optical-port requirement remains. Suppliers that provide clear migration guides and stable part-number availability may reduce disruption, but no technology transition guarantees immediate conversion of an installed adapter base.
MARKET OPPORTUNITIES
Shuttered interfaces for safer field maintenance
Automatic shutters can protect optical ports from debris and reduce exposure to light when connectors are removed, making them attractive in frequently serviced distribution frames. SENKO’s shuttered LC family illustrates the product class. Commercial opportunity depends on verifying the exact dust and eye-protection properties of each design; some shutters address one hazard but not the other after a cap is removed. Suppliers can differentiate through serviceability rather than solely through nominal port count.
High-density retrofits in legacy cabinet footprints
Compact adapters that fit existing SC cutouts allow network owners to add more optical channels without immediately replacing all cabinet hardware. SENKO’s SN compact family demonstrates 6- and 12-fiber configurations in familiar openings, subject to connector compatibility. This creates a potentially attractive retrofit purchase cycle for data centers and distribution facilities. The financial case should include new jumpers, technician procedures and future replacement stock, not only the adapter’s per-port price.
Harsh-environment optical access and industry use
Protected bulkhead adapters can extend optical connectivity into exposed cabinets, industrial machinery and outdoor installations. An IP68-rated product can address moisture ingress when installed according to its specified conditions, but the rating is not transferable to an untested enclosure. Opportunities include reliable access for energy, transportation and industrial networks where connector inspection is difficult. Specialized mounting and sealing can support differentiated products, provided the revenue boundary remains the passive adapter rather than the complete system.
Qualification-led distribution services
Regional distributors can create value by stocking verified equivalent part numbers, documenting connector compatibility and supplying replacement adapters rapidly. This is particularly relevant where projects are small, geographically dispersed or import dependent. A buyer may pay more for a known-good sleeve and predictable delivery than for an unverified low-cost substitute. The resulting opportunity is a service-enabled component sale; separately billed installation or maintenance labor should not be counted as adapter revenue.
Supply Chain, Qualification and Route to Market
The adapter supply chain begins with precision ceramic or polymer alignment parts, continues through housing molding and assembly, and ends with qualification, channel stocking and field installation. Passive adapters have no active electronic function, but dimensional control and clean assembly are central to their performance. Manufacturers may supply a standalone LC or SC part, an adapter integrated into a passive panel, or a ruggedized bulkhead variant. Revenue analysis isolates the adapter value even when a broader equipment supplier bundles it into a complete installation. The USD 2,050.5 million 2034 forecast therefore excludes the installed system value.
Sleeve and housing quality. The alignment sleeve determines how consistently two ferrules meet, while the surrounding housing controls mechanical retention and panel fit. Ceramic sleeve dimensional tolerance can affect insertion loss even though the part itself is passive. Suppliers must also manage contamination during assembly and shipment. The manufacturing bill of materials includes materials and inspection processes that differ by connector family, so an LC duplex unit and an outdoor SC bulkhead cannot be treated as interchangeable price points.
Qualification and standards. Product qualification combines mechanical fit, mating durability, insertion-loss behavior and environmental tests appropriate to the installation. An IEC-compatible connector geometry reduces interface uncertainty but does not guarantee a clean field connection. Operators may specify 200 mating cycles or other vendor-declared test criteria for selected products, while laboratories can require tighter repeatability. Documenting test conditions is important because catalog performance values are not a blanket guarantee across every cable and connector combination.
Channel and inventory planning. Optical adapters frequently reach users through distributors or panel assemblers rather than directly from the sleeve manufacturer. This creates two different demand signals: original equipment purchases and replacement inventory replenishment. An operator with 100 remote cabinets may stock common SC and LC variants locally to avoid prolonged outages, whereas a hyperscale buyer may qualify a narrower list for large orders. Neither example should be converted mechanically into an audited global unit count without supporting procurement records.
Service lifecycle economics. The adapter’s cost is usually small relative to a complete optical network, but a failed mating point can consume expensive technician time. Cleaning, inspection, correct polish matching and controlled insertion reduce avoidable service visits. A supplier that maintains stable part numbers and provides clear technical documentation can lower lifecycle costs even without offering the lowest unit price. This creates a commercial rationale for qualified passive interfaces while keeping active electronics, patch cords and installation labor outside the market total.
Recent Developments in Optical Fiber Adapter Technology and Connectivity
- 27 Jan 2026 Connectivity agreement
Corning and Meta announced a multiyear agreement of up to USD 6 billion covering optical fiber, cable and connectivity products for U.S. data-center infrastructure. The announcement indicates a major adjacent procurement program, but it does not disclose optical adapter sales or unit shipments. Adapter suppliers may benefit from increased port requirements only where qualified passive mating hardware is ordered under separate bills of materials. Source - 31 Mar 2026 Capacity expansion
Corning and Meta marked construction of an optical cable manufacturing expansion in Hickory, North Carolina. The investment supports broader optical connectivity capacity and project continuity rather than identifying a new adapter factory. For passive interface manufacturers, the relevant follow-through is demand for qualified connector-mating components once data-center interconnect layouts, maintenance specifications and procurement schedules are confirmed. Source - 06 May 2026 Optical capacity
Corning and NVIDIA announced a long-term optical connectivity partnership, including plans to expand U.S. optical connectivity manufacturing capacity by 10 times and fiber capacity by more than 50%. Those capacity figures concern broad optical products rather than passive adapter-only output. They nonetheless show why data-center equipment makers are evaluating dense, maintainable optical connections across future hardware generations. Source - 2026 catalogue Compact connector design
SENKO documents SN compact adapters that provide 6-fiber or 12-fiber configurations within familiar SC panel cutouts. The catalog entry is an undated product specification, not evidence of a 2026 launch. Its relevance is the potential to increase channel density during cabinet retrofits, subject to correct SN connector use and appropriate cleaning and polarity procedures. Source - 2026 catalogue LC adapter performance
SENKO lists standard LC adapter specifications including 0.10 dB typical insertion loss, 0.20 dB maximum, a −40°C to +75°C operating range and 200 mating cycles under cited conditions. These are supplier test claims for a defined product. They help illustrate qualification criteria but should not be generalized into market-wide performance or adoption statistics. Source - 2026 catalogue Shutter protection
SENKO’s shuttered LC adapter family offers protective designs intended to reduce contamination or exposure risk when an optical port is unmated. Shutter features vary by product, and buyers must check whether a specific mechanism provides dust protection, laser safety or both. The undated listing is treated as a product-design reference rather than a dated launch announcement. Source
REPORT SCOPE & SEGMENTATION
| Attribute | Details |
|---|---|
| Study Period | 2021–2034 |
| Base Year | 2025 |
| Estimated Year | 2026 |
| Forecast Period | 2026–2034 |
| Historical Period | 2021–2024 |
| 2025 Market Size | USD 1,000.5 million |
| 2026 Market Estimate | USD 1,083.5 million |
| 2034 Market Forecast | USD 2,050.5 million |
| Growth Rate | 8.3% CAGR, 2025–2034 |
| Units | Adapter revenue in USD million; port count and loss in dB where relevant |
| Segmentation | By Type, Application and Region |
| By Type | Single Mode Adapter · Multimode Adapter |
| By Application | Optical Communication System · Optical Power Distribution System · Optical Test System · Others |
| By Region | Regional shares are modeled 2025 revenue allocations totaling 100% and are distinct from supplier manufacturing locations. North AmericaUnited States, Canada, Mexico EuropeGermany, United Kingdom, France, Rest of Europe Asia-PacificChina, Japan, India, South Korea, Southeast Asia, Rest of Asia-Pacific South AmericaBrazil, Argentina, Chile, Rest of South America Middle East & AfricaSaudi Arabia, United Arab Emirates, South Africa, Rest of Middle East & Africa |
| Key Companies Profiled | SENKO, Corning, CommScope, Molex, Telegaertner, Amphenol, TE Connectivity, CONEC, HellermannTyton, Phoenix Contact and Optcore |
| Customization Scope | Country-level adapter revenue scenarios, connector family crosswalks, OEM-versus-channel comparisons, environmental qualification and supplier-level port-density benchmarking may be commissioned. |
Frequently Asked Questions
What is the global Optical Fiber Adapter Market size?
The global market is assessed at USD 1,000.5 million in 2025, with USD 1,083.5 million as the 2026 estimate and USD 2,050.5 million as the 2034 forecast. The valuation counts passive optical connector-mating adapters rather than full cables, transceivers or installation work. These standardized figures derive from the publisher’s earlier monetary endpoints, and the 2026 value is an interpolation of the modeled growth path rather than a separately published sales observation.
What growth rate is used for the adapter forecast?
The forecast applies an 8.3% compound annual growth rate across the 2025–2034 valuation window. That rate follows the relationship between the publisher’s USD 853 million 2023 base and USD 1,748.26 million 2032 endpoint. Growth can be uneven in actual purchasing because operators buy adapters when optical interfaces are installed, refurbished or replaced. The annualized rate is therefore a planning measure, not a claim that every supplier will grow at the same pace.
Which region leads optical fiber adapter sales?
Asia-Pacific is the largest modeled regional market at ~40% of 2025 revenue, followed by North America at ~30% and Europe at ~19%. The two smaller modeled regional allocations are ~7% for South America and ~4% for Middle East & Africa, reflecting different deployment cycles. The North American proportion is informed by a published 2023 regional figure, while the other weights reflect deployment and manufacturing evidence. Regional shares are analytical allocations and should not be confused with where individual suppliers manufacture their products.
Why are single-mode adapters the largest type?
Single-mode adapters represent a modeled ~78% of 2025 type revenue because long-reach access, metro and transport networks use single-mode fiber extensively. Multimode adapters account for the remaining ~22%, especially in shorter enterprise and data-center installations. Connector shape is not the same as optical mode: LC and SC housings may serve different fiber types. Purchasers must verify connector polish, ferrule alignment and fiber compatibility before assuming a replacement adapter will perform correctly.
Which applications consume the most optical adapters?
Optical communication systems are modeled at ~62% of application revenue, ahead of passive optical power distribution at ~18%, test systems at ~13% and other specialist uses at ~7%. The distribution category concerns optical signal routing in passive cabinets, not electrical energy transmission. Application demand arises from ports that require serviceable connector mating. The price of a complete splitter, OTDR instrument or rack assembly is excluded from adapter-only revenue even when adapters are supplied alongside it.
What distinguishes an adapter from a fiber connector?
A connector is attached to a fiber end and presents a ferrule and mating geometry, whereas an adapter is the passive housing that aligns two compatible connectors. A duplex adapter may accommodate two fiber channels, and compact multi-fiber formats can concentrate more interfaces in a panel. Neither component is an active transceiver. Installation quality, cleanliness and the correct APC or UPC interface influence optical performance, so an adapter cannot be chosen solely from its external color or nominal port count.
How do LC and SN compact formats affect equipment density?
LC interfaces are widely used in dense structured cabling, while SN compact adapters can fit 6 or 12 fibers into specified legacy SC panel cutouts. Higher density can defer cabinet expansion, but a format change may also require different jumpers, polarity documentation and cleaning tools. The supplier’s stated port count is a product capability rather than a forecast of adoption. Operators should calculate accessible service ports and maintenance time before selecting a denser arrangement.
What risks can raise the cost of an optical adapter installation?
Low purchase price does not eliminate risks from connector contamination, incorrect polish matching, sleeve wear or unavailable replacement parts. A product may claim 0.10 dB typical insertion loss under a defined test, yet the installed connection can perform differently when handling conditions change. Project teams can reduce risk through inspection, dust protection, compatibility checks and lot traceability. These measures protect service reliability but add qualification and maintenance expenses that influence procurement decisions.
Which manufacturers provide relevant adapter products?
Product-specific optical adapter offerings are documented by SENKO, Corning, CommScope, Molex and Telegaertner, among others. The broader publisher company roster also contains connectivity vendors and distributors whose participation should be verified at the relevant SKU level. Consolidated optical communications revenue is not an adapter market share. Buyers typically compare connector families, sleeve materials, environmental ratings and channel support, then qualify products against the equipment and optical link already in service.
What assumptions matter most through 2034?
The outlook assumes continuing fiber-access terminations, higher data-center port density and replacement of aging passive interfaces, offset by price competition and qualification friction. The modeled growth bridge assigns +10.3 percentage points to six demand drivers and −2.0 points to four restraints, reconciling to the 8.3% headline. Regional and segment shares sum to 100% within their own axes. Actual outcomes will depend on project timing, connector format migration, component availability and field maintenance standards.
Research Sources & Evidence Base

Get Sample Report PDF for Exclusive Insights
Report Sample Includes
- Table of Contents
- List of Tables & Figures
- Charts, Research Methodology, and more...
 Download Sample Report PDF