Key Statistics
Key Takeaways
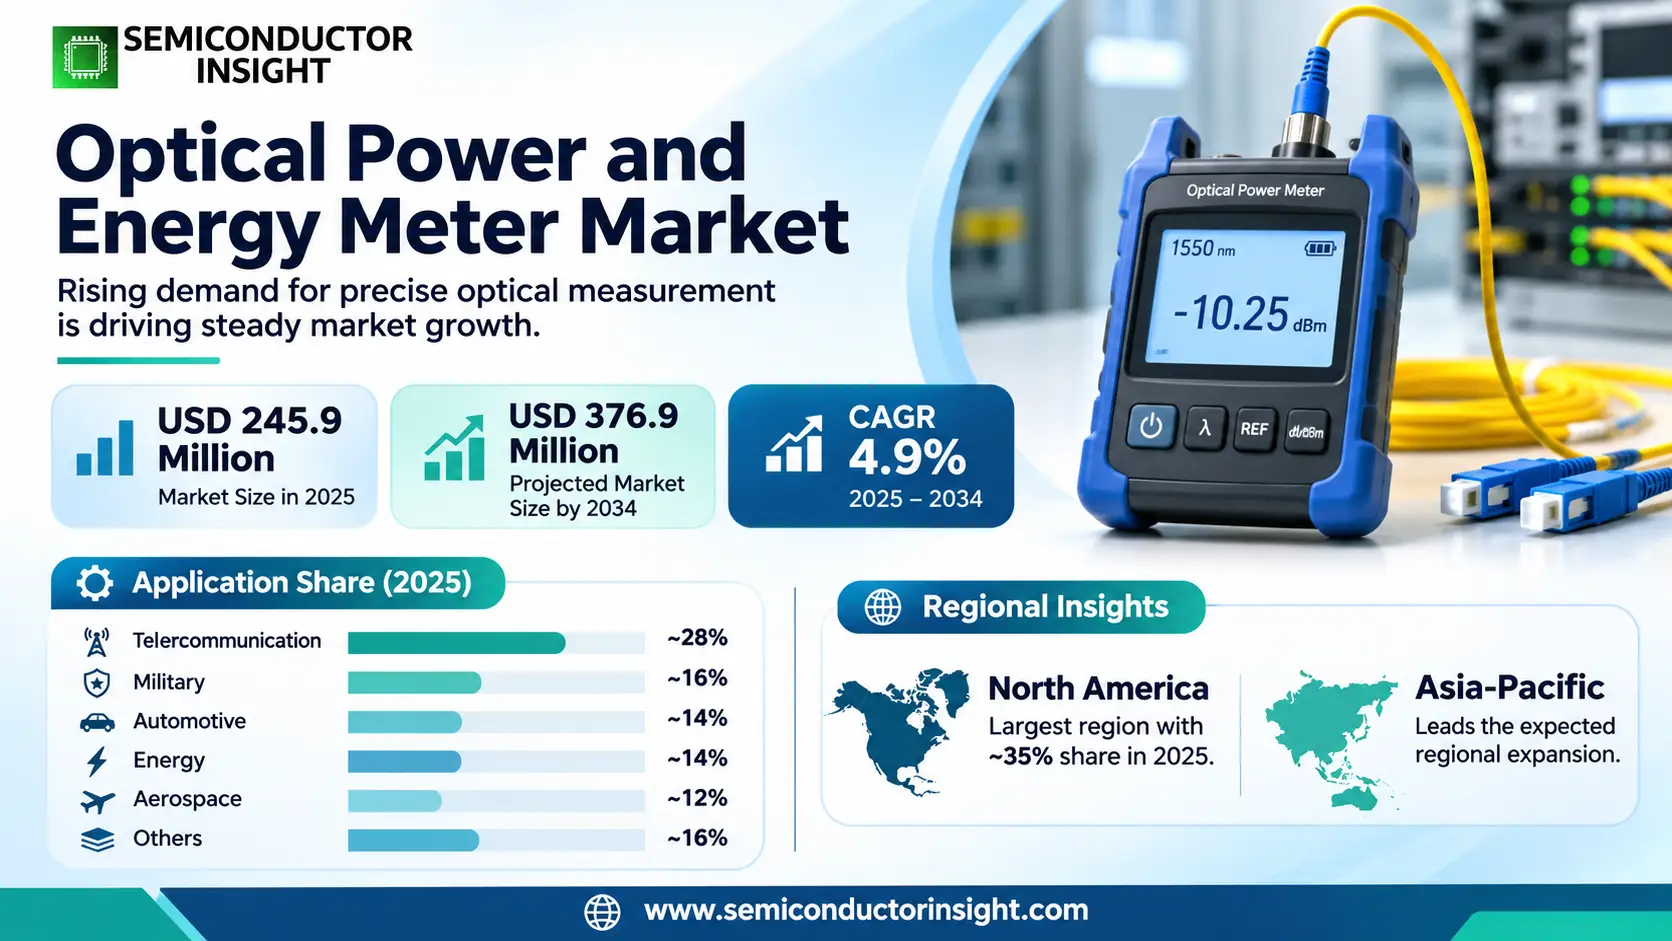
- Market trajectory: the global optical power and energy meter market reached USD 245.9 million in 2025 and is forecast to attain USD 376.9 million by 2034, implying a CAGR of 4.9% during 2025–2034; the 2026 estimate is USD 257.9 million.
- Pyroelectric instruments represent the largest detector-type segment at an estimated ~41% of 2025 revenue, because pulsed-laser quality control needs fast, calibrated energy capture; photodiodes contribute ~29% and thermopiles ~22%.
- Telecommunication testing accounts for an estimated ~28% of application revenue, followed by military testing at ~16%; demand spans optical-fiber link verification, industrial laser characterization and airborne electro-optical laboratories.
- North America holds the largest modeled regional position at ~35% in 2025, while Asia-Pacific at ~32% has the strongest projected growth at about ~5.9% annually as photonics manufacturing and factory metrology expand.
- Calibration traceability is the most persistent buying constraint: detector sensitivity, wavelength response, thermal damage thresholds and laboratory accreditation determine qualification, while recertification and instrument integration add lifetime cost.
Optical Power and Energy Meter Market Overview
Optical power and energy meter market was valued at USD 245.9 million in 2025 and is projected to reach USD 376.9 million by 2034, representing a CAGR of 4.9% over 2025–2034. North America is the largest modeled region with an estimated ~35% share in 2025, while Asia-Pacific leads expected regional expansion.
An optical power and energy meter measures light intensity or the energy delivered by a laser pulse, converting a detector response into a calibrated electrical reading. Continuous-wave power is expressed in watts, while individual pulse energy is expressed in joules; the same laboratory may need both measurements to qualify a laser source. A complete installation includes a sensor head, calibrated responsivity information, signal conditioning, display or computer interface, and often fixtures that keep beam geometry and detector exposure reproducible.
The revenue boundary covers finished optical power and energy meter instruments and the matched photodiode, thermopile, pyroelectric or hybrid detector heads used with them. It includes handheld consoles, benchtop systems, computer-connected sensor packages and application-specific high-power heads sold as measurement products. Laser sources, fiber cables, lidar equipment, general-purpose photodetectors without a metering role, unrelated electrical power meters and separately invoiced calibration services are excluded. This distinction prevents counting the large laser-equipment market as revenue from its much smaller diagnostic accessory category.
Detector physics determines both instrument cost and application fit. Silicon or indium-gallium-arsenide photodiodes resolve weak optical signals but require wavelength-specific responsivity correction; thermal heads absorb incident energy over a broad spectral range and tolerate stronger beams. Pyroelectric sensors convert transient heating into a signal suitable for pulses, but their repetition-rate and damage limits differ from those of photodiodes. Calibration against recognized radiometric references is essential because a displayed number is useful only when its uncertainty, wavelength and aperture conditions are known.
Purchasing is linked to laser qualification, optical network maintenance and production-test throughput rather than simply to the number of lasers sold. A fiber-optic installation needs source-power checks at specified wavelengths; a semiconductor or automotive production line needs repeatable checks at the beam delivered to the workpiece. Research laboratories use the instruments to compare sources, monitor drift and confirm experimental doses. Supplier catalogues show that a single digital console can support several sensor families, allowing customers to upgrade measurement capability without replacing the entire system.
Product development is shifting toward large-aperture detectors, faster pulse acquisition and networked measurement records. In 2026 suppliers offered new touchscreen meters with Ethernet and USB connectivity, while wide-beam thermal detectors addressed laser diode arrays and other sources that older compact heads could not intercept cleanly. High-power sensors now combine cooling, safety interlocks and reflected-light management for industrial environments. These changes make measurement equipment more closely integrated with automated production systems, while retaining the metrology requirements of a laboratory instrument.
Segment Analysis: By Type
By detector type, the market comprises Pyroelectric, Photodiode, Thermopile and Others. Pyroelectric instruments lead at an indicative ~41% of 2025 revenue, reflecting their role in pulse-energy measurement; photodiode meters represent ~29%, thermopile products ~22% and other sensor configurations ~8%. The modeled allocations describe meter-system revenue rather than the number of bare detector chips shipped.
| Type | Measurement function | Commercial position |
|---|---|---|
| Pyroelectric | A pyroelectric element produces an electrical response to a rapid temperature change when a laser pulse is absorbed. It is selected for pulse-energy testing, with head size, pulse repetition, spectral coating and damage threshold matched to the beam. Laboratories use it to characterize pulsed solid-state, medical and defense lasers without needing to infer pulse energy from average power alone. | Largest type (~41%). Pulse-energy heads carry calibration, absorber and acquisition requirements that can raise the price of a complete system. Gentec-EO QE detectors and Ophir energy-sensing products illustrate how aperture and maximum pulse energy segment this category. Buyers compare measurement uncertainty and lifetime replacement cost rather than selecting solely on the lowest instrument price. |
| Photodiode | Semiconductor photodiodes convert photons into current and are especially effective for low-power continuous-wave measurements in their specified spectral band. Silicon detectors cover much of the visible and near-infrared range, while InGaAs heads extend response into telecommunications wavelengths. Fiber adapters, attenuation and wavelength compensation are often necessary when comparing outputs from different sources or connectors. | Estimated ~29% share. This category is important in telecom link qualification, photonic component assembly and low-light research, where high sensitivity and repeatable wavelength correction matter more than large thermal capacity. Sensor-head interchangeability favors suppliers with compatible consoles and documented calibration files, while commoditized detector electronics place pressure on margins. Factory users also value connector fixtures. |
| Thermopile | A thermopile measures absorbed optical heating and is useful for continuous-wave laser power across broad wavelengths. High-power versions require water cooling, sufficient absorber area and protection against localized beam intensity. The slower thermal response is acceptable for stable industrial beams, but it is less suitable for resolving every pulse of a high-frequency source. | Estimated ~22% share. Thermal heads support welding, cutting and process-laser diagnostics, including kilowatt-class installations where an ordinary photodiode would saturate or be damaged. Large apertures and cooling hardware raise selling prices; high-end buyers also evaluate reflected-light handling, response time, interlock behavior and integration into production fixtures. Recalibration and safe handling influence ownership cost. |
| Others | Residual technologies include calorimetric reference instruments, hybrid sensor packages and specialized optical measurement arrangements that do not fit the three principal commercial detector families. They may prioritize absolute radiometric traceability, unusual wavelength coverage or combined measurement modes rather than compactness. Their use is concentrated in calibration laboratories and technically demanding experiments. | Estimated ~8% share. These systems sell in smaller quantities and can command higher project prices because qualification and support are customized. They should not be confused with the entire market for standalone photodetectors, optical spectrum analyzers or imaging sensors; only products performing calibrated optical power or pulse-energy metering belong here. |
Secondary segmentation: technology and wavelength range
The technology axis separates analog (~15%), digital (~68%) and hybrid (~17%) meter architectures. Digital instruments lead because stored calibration coefficients, traceable logging and remote interfaces make them easier to integrate into production quality systems. Hybrid equipment retains analog monitoring paths while adding digital acquisition, a practical option when a legacy test bench must communicate with newer automation software.
| Axis | Members | Commercial role |
|---|---|---|
| By Technology | Analog (~15%); Digital (~68%); Hybrid (~17%) | Digital acquisition dominates traceable measurement workflows, whereas analog displays remain attractive for simple field checks and hybrid systems bridge legacy test stands with computer records. USB and Ethernet interfaces reduce transcription errors and permit multi-station comparisons; their value increases when many calibrated heads must be maintained across a factory. |
| By Wavelength Range | Visible Spectrum (~22%); Near-Infrared (~49%); Mid-Infrared (~19%); Far-Infrared (~10%) | Near-infrared applications lead because fiber communications, diode lasers and many industrial sources operate in this band. Visible instruments support alignment and laboratory photonics; mid-infrared measurement requires appropriate thermal coatings and detector choices, while far-infrared work is a smaller specialty market with demanding calibration and environmental controls. |
Segment Analysis: By Application
By application, the market spans Telecommunication, Automotive, Military, Aerospace, Energy and Others. Telecommunications is the largest modeled use at ~28% of 2025 revenue, followed by military testing at ~16%, automotive and energy at ~14% each, aerospace at ~12% and other scientific or industrial uses at ~16%. These are application allocations for complete meters and sensor heads, not the value of the end-use lasers.
| Application | Demand characteristics |
|---|---|
| Telecommunication | Largest application (~28%). Technicians and manufacturers check optical power at fiber interfaces, transceiver outputs and passive-network components. Testing often occurs at 850, 1310 or 1550 nm, so wavelength-specific photodiode calibration and connector compatibility are central purchase criteria. Network operators need portable instruments for maintenance, while component factories need repeatable benchtop acquisition and traceable production records. A meter is an enabling test instrument, not a proxy for total network equipment spending. |
| Automotive | Estimated ~14% share. Automotive factories use laser sources in welding, cutting and precision joining, where delivered beam power must remain within process limits. Laser-based sensing components also require optical characterization during development. Thermopile heads and integrated digital logging are useful when equipment operates near production cells, but measurement frequency and beam safety are as important as absolute accuracy. Purchasing follows automation upgrades and quality-control budgets rather than vehicle production alone. |
| Military | Estimated ~16% share. Defense laboratories qualify pulsed optical sources, electro-optical subsystems and high-power directed-energy demonstrators. Wide apertures, high energy handling and controlled exposure time matter when test beams cannot be placed on ordinary laboratory detectors. Instruments must document calibration conditions and may need remote operation for safety. Specialized purchases are episodic, with technical acceptance testing and supplier qualification extending the sales cycle. |
| Aerospace | Estimated ~12% share. Aerospace engineering groups test optical communications components, laser altimetry sources and environmental sensing equipment before deployment. Measurement systems must support stable repeatability across prototypes and acceptance test fixtures, often with multiple detector technologies in the same laboratory. Buyers value calibration history and compatibility with existing optical benches because a change of sensor can invalidate a long-running qualification comparison. |
| Energy | Estimated ~14% share. Energy equipment suppliers use laser power measurements in industrial fabrication and in laboratories developing optical sensing and inspection techniques. Strong process beams require thermally robust detectors and safe mounting, while precision research may demand low-power photodiode instruments. Field conditions encourage portable displays and sealed connectors. Demand is sensitive to plant maintenance cycles and industrial investment rather than being directly proportional to energy consumption. |
| Others | Estimated ~16% share. Universities, medical laser laboratories, semiconductor process developers and general photonics research create a diverse residual demand base. A single site may buy several sensors for visible, ultraviolet and infrared sources while sharing one console across benches. These customers place a premium on flexibility, calibration documentation and training support; their small individual orders collectively sustain distribution channels and specialist instrument models. |
Sales channels differ sharply by use. Telecommunications technicians favor compact instruments supplied through test-equipment distributors, while laser factories often buy sensor heads as part of a machine acceptance package. Research organizations purchase directly from specialist photonics catalogues and expect broad accessory compatibility. This mix means that the number of active measurement sites, sensor replacement intervals and calibration policies are more informative demand indicators than laser production totals alone.
Regional Analysis
Regional demand for optical power and energy meters reflects the location of calibration laboratories, optical-component manufacturing, laser-intensive factories and defense photonics programs. North America leads with a modeled ~35% share in 2025, Asia-Pacific follows at ~32%, Europe contributes ~22%, Latin America ~6% and the Middle East & Africa ~5%. Asia-Pacific has the fastest indicative regional expansion at ~5.9% CAGR as optical manufacturing test capacity grows.
Where are calibrated optical measurement systems most widely purchased?
North America combines federal metrology infrastructure, university laboratories, photonics equipment development and defense procurement. Europe has a dense industrial laser and precision-instrument customer base, particularly in Germany and neighboring manufacturing economies. Asia-Pacific is distinguished by large volumes of component and electronics testing, making it more sensitive to production-line automation and export-oriented photonics investment. Smaller regions often depend on distributor support and the ability to return sensor heads for recalibration.
The modeled regional shares are not a direct survey of instrument shipments. They are a consistent 2025 revenue allocation informed by supplier distribution footprints, application intensity and the concentration of high-value calibration services. The forecast assumes regional growth differs with the pace of factory instrumentation, research budgets and optical network maintenance, while the worldwide market value follows the selected publisher headline anchors.
| Region | Position | Growth outlook | Demand profile | What decides supplier selection |
|---|---|---|---|---|
| North America | Largest; ~35% in 2025 | ~4.3% indicative CAGR | Defense photonics, research laboratories and telecom maintenance | Traceable calibration, broad sensor compatibility and documented uncertainty |
| Asia-Pacific | Second; ~32% in 2025 | Fastest; ~5.9% indicative CAGR | Optical component factories and industrial laser production | Production-line throughput, local service and digital interfaces |
| Europe | Third; ~22% in 2025 | ~4.1% indicative CAGR | Precision manufacturing and scientific instrumentation | Metrology certificates, machine integration and reliability |
| Latin America | Developing; ~6% in 2025 | ~5.3% indicative CAGR | Industrial maintenance and optical-network expansion | Distributor coverage, portable form factors and service cost |
| Middle East & Africa | Emerging; ~5% in 2025 | ~5.0% indicative CAGR | Telecom testing, energy infrastructure and defense laboratories | Environmental robustness, training and local calibration access |


Download Sample Report
Table of Content
1 Introduction to Research & Analysis Reports
1.1 Optical Power and Energy Meter Market Definition
1.2 Market Segments
1.2.1 Segment by Type
1.2.2 Segment by Application
1.3 Global Optical Power and Energy Meter Market Overview
1.4 Features & Benefits of This Report
1.5 Methodology & Sources of Information
1.5.1 Research Methodology
1.5.2 Research Process
1.5.3 Base Year
1.5.4 Report Assumptions & Caveats
2 Global Optical Power and Energy Meter Overall Market Size
2.1 Global Optical Power and Energy Meter Market Size: 2024 VS 2032
2.2 Global Optical Power and Energy Meter Market Size, Prospects & Forecasts: 2026-2034
2.3 Global Optical Power and Energy Meter Sales: 2026-2034
3 Company Landscape
3.1 Top Optical Power and Energy Meter Players in Global Market
3.2 Top Global Optical Power and Energy Meter Companies Ranked by Revenue
3.3 Global Optical Power and Energy Meter Revenue by Companies
3.4 Global Optical Power and Energy Meter Sales by Companies
3.5 Global Optical Power and Energy Meter Price by Manufacturer (2020-2025)
3.6 Top 3 and Top 5 Optical Power and Energy Meter Companies in Global Market, by Revenue in 2024
3.7 Global Manufacturers Optical Power and Energy Meter Product Type
3.8 Tier 1, Tier 2, and Tier 3 Optical Power and Energy Meter Players in Global Market
3.8.1 List of Global Tier 1 Optical Power and Energy Meter Companies
3.8.2 List of Global Tier 2 and Tier 3 Optical Power and Energy Meter Companies
4 Sights by Product
4.1 Overview
4.1.1 Segment by Type – Global Optical Power and Energy Meter Market Size Markets, 2024 & 2032
4.1.2 Pyroelectric
4.1.3 Photodiode
4.1.4 Others
4.2 Segment by Type – Global Optical Power and Energy Meter Revenue & Forecasts
4.2.1 Segment by Type – Global Optical Power and Energy Meter Revenue, 2020-2025
4.2.2 Segment by Type – Global Optical Power and Energy Meter Revenue, 2026-2032
4.2.3 Segment by Type – Global Optical Power and Energy Meter Revenue Market Share, 2026-2034
4.3 Segment by Type – Global Optical Power and Energy Meter Sales & Forecasts
4.3.1 Segment by Type – Global Optical Power and Energy Meter Sales, 2020-2025
4.3.2 Segment by Type – Global Optical Power and Energy Meter Sales, 2026-2032
4.3.3 Segment by Type – Global Optical Power and Energy Meter Sales Market Share, 2026-2034
4.4 Segment by Type – Global Optical Power and Energy Meter Price (Manufacturers Selling Prices), 2026-2034
5 Sights by Application
5.1 Overview
5.1.1 Segment by Application – Global Optical Power and Energy Meter Market Size, 2024 & 2032
5.1.2 Telecommunication
5.1.3 Automotive
5.1.4 Military
5.1.5 Aerospace
5.1.6 Energy
5.1.7 Others
5.2 Segment by Application – Global Optical Power and Energy Meter Revenue & Forecasts
5.2.1 Segment by Application – Global Optical Power and Energy Meter Revenue, 2020-2025
5.2.2 Segment by Application – Global Optical Power and Energy Meter Revenue, 2026-2032
5.2.3 Segment by Application – Global Optical Power and Energy Meter Revenue Market Share, 2026-2034
5.3 Segment by Application – Global Optical Power and Energy Meter Sales & Forecasts
5.3.1 Segment by Application – Global Optical Power and Energy Meter Sales, 2020-2025
5.3.2 Segment by Application – Global Optical Power and Energy Meter Sales, 2026-2032
5.3.3 Segment by Application – Global Optical Power and Energy Meter Sales Market Share, 2026-2034
5.4 Segment by Application – Global Optical Power and Energy Meter Price (Manufacturers Selling Prices), 2026-2034
6 Sights by Region
6.1 By Region – Global Optical Power and Energy Meter Market Size, 2024 & 2032
6.2 By Region – Global Optical Power and Energy Meter Revenue & Forecasts
6.2.1 By Region – Global Optical Power and Energy Meter Revenue, 2020-2025
6.2.2 By Region – Global Optical Power and Energy Meter Revenue, 2026-2032
6.2.3 By Region – Global Optical Power and Energy Meter Revenue Market Share, 2026-2034
6.3 By Region – Global Optical Power and Energy Meter Sales & Forecasts
6.3.1 By Region – Global Optical Power and Energy Meter Sales, 2020-2025
6.3.2 By Region – Global Optical Power and Energy Meter Sales, 2026-2032
6.3.3 By Region – Global Optical Power and Energy Meter Sales Market Share, 2026-2034
6.4 North America
6.4.1 By Country – North America Optical Power and Energy Meter Revenue, 2026-2034
6.4.2 By Country – North America Optical Power and Energy Meter Sales, 2026-2034
6.4.3 United States Optical Power and Energy Meter Market Size, 2026-2034
6.4.4 Canada Optical Power and Energy Meter Market Size, 2026-2034
6.4.5 Mexico Optical Power and Energy Meter Market Size, 2026-2034
6.5 Europe
6.5.1 By Country – Europe Optical Power and Energy Meter Revenue, 2026-2034
6.5.2 By Country – Europe Optical Power and Energy Meter Sales, 2026-2034
6.5.3 Germany Optical Power and Energy Meter Market Size, 2026-2034
6.5.4 France Optical Power and Energy Meter Market Size, 2026-2034
6.5.5 U.K. Optical Power and Energy Meter Market Size, 2026-2034
6.5.6 Italy Optical Power and Energy Meter Market Size, 2026-2034
6.5.7 Russia Optical Power and Energy Meter Market Size, 2026-2034
6.5.8 Nordic Countries Optical Power and Energy Meter Market Size, 2026-2034
6.5.9 Benelux Optical Power and Energy Meter Market Size, 2026-2034
6.6 Asia
6.6.1 By Region – Asia Optical Power and Energy Meter Revenue, 2026-2034
6.6.2 By Region – Asia Optical Power and Energy Meter Sales, 2026-2034
6.6.3 China Optical Power and Energy Meter Market Size, 2026-2034
6.6.4 Japan Optical Power and Energy Meter Market Size, 2026-2034
6.6.5 South Korea Optical Power and Energy Meter Market Size, 2026-2034
6.6.6 Southeast Asia Optical Power and Energy Meter Market Size, 2026-2034
6.6.7 India Optical Power and Energy Meter Market Size, 2026-2034
6.7 South America
6.7.1 By Country – South America Optical Power and Energy Meter Revenue, 2026-2034
6.7.2 By Country – South America Optical Power and Energy Meter Sales, 2026-2034
6.7.3 Brazil Optical Power and Energy Meter Market Size, 2026-2034
6.7.4 Argentina Optical Power and Energy Meter Market Size, 2026-2034
6.8 Middle East & Africa
6.8.1 By Country – Middle East & Africa Optical Power and Energy Meter Revenue, 2026-2034
6.8.2 By Country – Middle East & Africa Optical Power and Energy Meter Sales, 2026-2034
6.8.3 Turkey Optical Power and Energy Meter Market Size, 2026-2034
6.8.4 Israel Optical Power and Energy Meter Market Size, 2026-2034
6.8.5 Saudi Arabia Optical Power and Energy Meter Market Size, 2026-2034
6.8.6 UAE Optical Power and Energy Meter Market Size, 2026-2034
7 Manufacturers & Brands Profiles
7.1 Thorlabs
7.1.1 Thorlabs Company Summary
7.1.2 Thorlabs Business Overview
7.1.3 Thorlabs Optical Power and Energy Meter Major Product Offerings
7.1.4 Thorlabs Optical Power and Energy Meter Sales and Revenue in Global (2020-2025)
7.1.5 Thorlabs Key News & Latest Developments
7.2 Newport
7.2.1 Newport Company Summary
7.2.2 Newport Business Overview
7.2.3 Newport Optical Power and Energy Meter Major Product Offerings
7.2.4 Newport Optical Power and Energy Meter Sales and Revenue in Global (2020-2025)
7.2.5 Newport Key News & Latest Developments
7.3 Edmund Optics
7.3.1 Edmund Optics Company Summary
7.3.2 Edmund Optics Business Overview
7.3.3 Edmund Optics Optical Power and Energy Meter Major Product Offerings
7.3.4 Edmund Optics Optical Power and Energy Meter Sales and Revenue in Global (2020-2025)
7.3.5 Edmund Optics Key News & Latest Developments
7.4 Optosigma
7.4.1 Optosigma Company Summary
7.4.2 Optosigma Business Overview
7.4.3 Optosigma Optical Power and Energy Meter Major Product Offerings
7.4.4 Optosigma Optical Power and Energy Meter Sales and Revenue in Global (2020-2025)
7.4.5 Optosigma Key News & Latest Developments
7.5 Coherent
7.5.1 Coherent Company Summary
7.5.2 Coherent Business Overview
7.5.3 Coherent Optical Power and Energy Meter Major Product Offerings
7.5.4 Coherent Optical Power and Energy Meter Sales and Revenue in Global (2020-2025)
7.5.5 Coherent Key News & Latest Developments
7.6 Laserpoint
7.6.1 Laserpoint Company Summary
7.6.2 Laserpoint Business Overview
7.6.3 Laserpoint Optical Power and Energy Meter Major Product Offerings
7.6.4 Laserpoint Optical Power and Energy Meter Sales and Revenue in Global (2020-2025)
7.6.5 Laserpoint Key News & Latest Developments
7.7 Sintec Optronics
7.7.1 Sintec Optronics Company Summary
7.7.2 Sintec Optronics Business Overview
7.7.3 Sintec Optronics Optical Power and Energy Meter Major Product Offerings
7.7.4 Sintec Optronics Optical Power and Energy Meter Sales and Revenue in Global (2020-2025)
7.7.5 Sintec Optronics Key News & Latest Developments
7.8 Laser SOS
7.8.1 Laser SOS Company Summary
7.8.2 Laser SOS Business Overview
7.8.3 Laser SOS Optical Power and Energy Meter Major Product Offerings
7.8.4 Laser SOS Optical Power and Energy Meter Sales and Revenue in Global (2020-2025)
7.8.5 Laser SOS Key News & Latest Developments
8 Global Optical Power and Energy Meter Production Capacity, Analysis
8.1 Global Optical Power and Energy Meter Production Capacity, 2026-2034
8.2 Optical Power and Energy Meter Production Capacity of Key Manufacturers in Global Market
8.3 Global Optical Power and Energy Meter Production by Region
9 Key Market Trends, Opportunity, Drivers and Restraints
9.1 Market Opportunities & Trends
9.2 Market Drivers
9.3 Market Restraints
10 Optical Power and Energy Meter Supply Chain Analysis
10.1 Optical Power and Energy Meter Industry Value Chain
10.2 Optical Power and Energy Meter Upstream Market
10.3 Optical Power and Energy Meter Downstream and Clients
10.4 Marketing Channels Analysis
10.4.1 Marketing Channels
10.4.2 Optical Power and Energy Meter Distributors and Sales Agents in Global
11 Conclusion
12 Appendix
12.1 Note
12.2 Examples of Clients
12.3 DisclaimerList of Tables
Table 1. Key Players of Optical Power and Energy Meter in Global Market
Table 2. Top Optical Power and Energy Meter Players in Global Market, Ranking by Revenue (2024)
Table 3. Global Optical Power and Energy Meter Revenue by Companies, (US$, Mn), 2020-2025
Table 4. Global Optical Power and Energy Meter Revenue Share by Companies, 2020-2025
Table 5. Global Optical Power and Energy Meter Sales by Companies, (K Units), 2020-2025
Table 6. Global Optical Power and Energy Meter Sales Share by Companies, 2020-2025
Table 7. Key Manufacturers Optical Power and Energy Meter Price (2020-2025) & (US$/Unit)
Table 8. Global Manufacturers Optical Power and Energy Meter Product Type
Table 9. List of Global Tier 1 Optical Power and Energy Meter Companies, Revenue (US$, Mn) in 2024 and Market Share
Table 10. List of Global Tier 2 and Tier 3 Optical Power and Energy Meter Companies, Revenue (US$, Mn) in 2024 and Market Share
Table 11. Segment by Type Global Optical Power and Energy Meter Revenue, (US$, Mn), 2024 & 2032
Table 12. Segment by Type – Global Optical Power and Energy Meter Revenue (US$, Mn), 2020-2025
Table 13. Segment by Type – Global Optical Power and Energy Meter Revenue (US$, Mn), 2026-2032
Table 14. Segment by Type – Global Optical Power and Energy Meter Sales (K Units), 2020-2025
Table 15. Segment by Type – Global Optical Power and Energy Meter Sales (K Units), 2026-2032
Table 16. Segment by Application Global Optical Power and Energy Meter Revenue, (US$, Mn), 2024 & 2032
Table 17. Segment by Application – Global Optical Power and Energy Meter Revenue, (US$, Mn), 2020-2025
Table 18. Segment by Application – Global Optical Power and Energy Meter Revenue, (US$, Mn), 2026-2032
Table 19. Segment by Application – Global Optical Power and Energy Meter Sales, (K Units), 2020-2025
Table 20. Segment by Application – Global Optical Power and Energy Meter Sales, (K Units), 2026-2032
Table 21. By Region Global Optical Power and Energy Meter Revenue, (US$, Mn), 2025-2032
Table 22. By Region – Global Optical Power and Energy Meter Revenue, (US$, Mn), 2020-2025
Table 23. By Region – Global Optical Power and Energy Meter Revenue, (US$, Mn), 2026-2032
Table 24. By Region – Global Optical Power and Energy Meter Sales, (K Units), 2020-2025
Table 25. By Region – Global Optical Power and Energy Meter Sales, (K Units), 2026-2032
Table 26. By Country – North America Optical Power and Energy Meter Revenue, (US$, Mn), 2020-2025
Table 27. By Country – North America Optical Power and Energy Meter Revenue, (US$, Mn), 2026-2032
Table 28. By Country – North America Optical Power and Energy Meter Sales, (K Units), 2020-2025
Table 29. By Country – North America Optical Power and Energy Meter Sales, (K Units), 2026-2032
Table 30. By Country – Europe Optical Power and Energy Meter Revenue, (US$, Mn), 2020-2025
Table 31. By Country – Europe Optical Power and Energy Meter Revenue, (US$, Mn), 2026-2032
Table 32. By Country – Europe Optical Power and Energy Meter Sales, (K Units), 2020-2025
Table 33. By Country – Europe Optical Power and Energy Meter Sales, (K Units), 2026-2032
Table 34. By Region – Asia Optical Power and Energy Meter Revenue, (US$, Mn), 2020-2025
Table 35. By Region – Asia Optical Power and Energy Meter Revenue, (US$, Mn), 2026-2032
Table 36. By Region – Asia Optical Power and Energy Meter Sales, (K Units), 2020-2025
Table 37. By Region – Asia Optical Power and Energy Meter Sales, (K Units), 2026-2032
Table 38. By Country – South America Optical Power and Energy Meter Revenue, (US$, Mn), 2020-2025
Table 39. By Country – South America Optical Power and Energy Meter Revenue, (US$, Mn), 2026-2032
Table 40. By Country – South America Optical Power and Energy Meter Sales, (K Units), 2020-2025
Table 41. By Country – South America Optical Power and Energy Meter Sales, (K Units), 2026-2032
Table 42. By Country – Middle East & Africa Optical Power and Energy Meter Revenue, (US$, Mn), 2020-2025
Table 43. By Country – Middle East & Africa Optical Power and Energy Meter Revenue, (US$, Mn), 2026-2032
Table 44. By Country – Middle East & Africa Optical Power and Energy Meter Sales, (K Units), 2020-2025
Table 45. By Country – Middle East & Africa Optical Power and Energy Meter Sales, (K Units), 2026-2032
Table 46. Thorlabs Company Summary
Table 47. Thorlabs Optical Power and Energy Meter Product Offerings
Table 48. Thorlabs Optical Power and Energy Meter Sales (K Units), Revenue (US$, Mn) and Average Price (US$/Unit) & (2020-2025)
Table 49. Thorlabs Key News & Latest Developments
Table 50. Newport Company Summary
Table 51. Newport Optical Power and Energy Meter Product Offerings
Table 52. Newport Optical Power and Energy Meter Sales (K Units), Revenue (US$, Mn) and Average Price (US$/Unit) & (2020-2025)
Table 53. Newport Key News & Latest Developments
Table 54. Edmund Optics Company Summary
Table 55. Edmund Optics Optical Power and Energy Meter Product Offerings
Table 56. Edmund Optics Optical Power and Energy Meter Sales (K Units), Revenue (US$, Mn) and Average Price (US$/Unit) & (2020-2025)
Table 57. Edmund Optics Key News & Latest Developments
Table 58. Optosigma Company Summary
Table 59. Optosigma Optical Power and Energy Meter Product Offerings
Table 60. Optosigma Optical Power and Energy Meter Sales (K Units), Revenue (US$, Mn) and Average Price (US$/Unit) & (2020-2025)
Table 61. Optosigma Key News & Latest Developments
Table 62. Coherent Company Summary
Table 63. Coherent Optical Power and Energy Meter Product Offerings
Table 64. Coherent Optical Power and Energy Meter Sales (K Units), Revenue (US$, Mn) and Average Price (US$/Unit) & (2020-2025)
Table 65. Coherent Key News & Latest Developments
Table 66. Laserpoint Company Summary
Table 67. Laserpoint Optical Power and Energy Meter Product Offerings
Table 68. Laserpoint Optical Power and Energy Meter Sales (K Units), Revenue (US$, Mn) and Average Price (US$/Unit) & (2020-2025)
Table 69. Laserpoint Key News & Latest Developments
Table 70. Sintec Optronics Company Summary
Table 71. Sintec Optronics Optical Power and Energy Meter Product Offerings
Table 72. Sintec Optronics Optical Power and Energy Meter Sales (K Units), Revenue (US$, Mn) and Average Price (US$/Unit) & (2020-2025)
Table 73. Sintec Optronics Key News & Latest Developments
Table 74. Laser SOS Company Summary
Table 75. Laser SOS Optical Power and Energy Meter Product Offerings
Table 76. Laser SOS Optical Power and Energy Meter Sales (K Units), Revenue (US$, Mn) and Average Price (US$/Unit) & (2020-2025)
Table 77. Laser SOS Key News & Latest Developments
Table 78. Optical Power and Energy Meter Capacity of Key Manufacturers in Global Market, 2023-2025 (K Units)
Table 79. Global Optical Power and Energy Meter Capacity Market Share of Key Manufacturers, 2023-2025
Table 80. Global Optical Power and Energy Meter Production by Region, 2020-2025 (K Units)
Table 81. Global Optical Power and Energy Meter Production by Region, 2026-2032 (K Units)
Table 82. Optical Power and Energy Meter Market Opportunities & Trends in Global Market
Table 83. Optical Power and Energy Meter Market Drivers in Global Market
Table 84. Optical Power and Energy Meter Market Restraints in Global Market
Table 85. Optical Power and Energy Meter Raw Materials
Table 86. Optical Power and Energy Meter Raw Materials Suppliers in Global Market
Table 87. Typical Optical Power and Energy Meter Downstream
Table 88. Optical Power and Energy Meter Downstream Clients in Global Market
Table 89. Optical Power and Energy Meter Distributors and Sales Agents in Global Market
List of Figures
Figure 1. Optical Power and Energy Meter Product Picture
Figure 2. Optical Power and Energy Meter Segment by Type in 2024
Figure 3. Optical Power and Energy Meter Segment by Application in 2024
Figure 4. Global Optical Power and Energy Meter Market Overview: 2024
Figure 5. Key Caveats
Figure 6. Global Optical Power and Energy Meter Market Size: 2024 VS 2032 (US$, Mn)
Figure 7. Global Optical Power and Energy Meter Revenue: 2026-2034 (US$, Mn)
Figure 8. Optical Power and Energy Meter Sales in Global Market: 2026-2034 (K Units)
Figure 9. The Top 3 and 5 Players Market Share by Optical Power and Energy Meter Revenue in 2024
Figure 10. Segment by Type Global Optical Power and Energy Meter Revenue, (US$, Mn), 2024 & 2032
Figure 11. Segment by Type – Global Optical Power and Energy Meter Revenue Market Share, 2026-2034
Figure 12. Segment by Type – Global Optical Power and Energy Meter Sales Market Share, 2026-2034
Figure 13. Segment by Type – Global Optical Power and Energy Meter Price (US$/Unit), 2026-2034
Figure 14. Segment by Application Global Optical Power and Energy Meter Revenue, (US$, Mn), 2024 & 2032
Figure 15. Segment by Application – Global Optical Power and Energy Meter Revenue Market Share, 2026-2034
Figure 16. Segment by Application – Global Optical Power and Energy Meter Sales Market Share, 2026-2034
Figure 17. Segment by Application -Global Optical Power and Energy Meter Price (US$/Unit), 2026-2034
Figure 18. By Region Global Optical Power and Energy Meter Revenue, (US$, Mn), 2025 & 2032
Figure 19. By Region – Global Optical Power and Energy Meter Revenue Market Share, 2020 VS 2024 VS 2032
Figure 20. By Region – Global Optical Power and Energy Meter Revenue Market Share, 2026-2034
Figure 21. By Region – Global Optical Power and Energy Meter Sales Market Share, 2026-2034
Figure 22. By Country – North America Optical Power and Energy Meter Revenue Market Share, 2026-2034
Figure 23. By Country – North America Optical Power and Energy Meter Sales Market Share, 2026-2034
Figure 24. United States Optical Power and Energy Meter Revenue, (US$, Mn), 2026-2034
Figure 25. Canada Optical Power and Energy Meter Revenue, (US$, Mn), 2026-2034
Figure 26. Mexico Optical Power and Energy Meter Revenue, (US$, Mn), 2026-2034
Figure 27. By Country – Europe Optical Power and Energy Meter Revenue Market Share, 2026-2034
Figure 28. By Country – Europe Optical Power and Energy Meter Sales Market Share, 2026-2034
Figure 29. Germany Optical Power and Energy Meter Revenue, (US$, Mn), 2026-2034
Figure 30. France Optical Power and Energy Meter Revenue, (US$, Mn), 2026-2034
Figure 31. U.K. Optical Power and Energy Meter Revenue, (US$, Mn), 2026-2034
Figure 32. Italy Optical Power and Energy Meter Revenue, (US$, Mn), 2026-2034
Figure 33. Russia Optical Power and Energy Meter Revenue, (US$, Mn), 2026-2034
Figure 34. Nordic Countries Optical Power and Energy Meter Revenue, (US$, Mn), 2026-2034
Figure 35. Benelux Optical Power and Energy Meter Revenue, (US$, Mn), 2026-2034
Figure 36. By Region – Asia Optical Power and Energy Meter Revenue Market Share, 2026-2034
Figure 37. By Region – Asia Optical Power and Energy Meter Sales Market Share, 2026-2034
Figure 38. China Optical Power and Energy Meter Revenue, (US$, Mn), 2026-2034
Figure 39. Japan Optical Power and Energy Meter Revenue, (US$, Mn), 2026-2034
Figure 40. South Korea Optical Power and Energy Meter Revenue, (US$, Mn), 2026-2034
Figure 41. Southeast Asia Optical Power and Energy Meter Revenue, (US$, Mn), 2026-2034
Figure 42. India Optical Power and Energy Meter Revenue, (US$, Mn), 2026-2034
Figure 43. By Country – South America Optical Power and Energy Meter Revenue Market Share, 2026-2034
Figure 44. By Country – South America Optical Power and Energy Meter Sales, Market Share, 2026-2034
Figure 45. Brazil Optical Power and Energy Meter Revenue, (US$, Mn), 2026-2034
Figure 46. Argentina Optical Power and Energy Meter Revenue, (US$, Mn), 2026-2034
Figure 47. By Country – Middle East & Africa Optical Power and Energy Meter Revenue, Market Share, 2026-2034
Figure 48. By Country – Middle East & Africa Optical Power and Energy Meter Sales, Market Share, 2026-2034
Figure 49. Turkey Optical Power and Energy Meter Revenue, (US$, Mn), 2026-2034
Figure 50. Israel Optical Power and Energy Meter Revenue, (US$, Mn), 2026-2034
Figure 51. Saudi Arabia Optical Power and Energy Meter Revenue, (US$, Mn), 2026-2034
Figure 52. UAE Optical Power and Energy Meter Revenue, (US$, Mn), 2026-2034
Figure 53. Global Optical Power and Energy Meter Production Capacity (K Units), 2026-2034
Figure 54. The Percentage of Production Optical Power and Energy Meter by Region, 2024 VS 2032
Figure 55. Optical Power and Energy Meter Industry Value Chain
Figure 56. Marketing Channels