Key Statistics
Key Takeaways
- Fiber Optic is the dominant type on the source page because it offers the bandwidth, reach and electromagnetic immunity required for backbone, metro, access and data-center networks. Free-space optics remains a complementary niche where trenching or rights-of-way are difficult.
- Telecommunications is the leading application because FTTH, mobile fronthaul/midhaul/backhaul and long-haul backbone networks consume fiber, coherent transport and optical line systems at scale. Data Center Interconnect is the strongest strategic growth application as AI raises east-west traffic and inter-campus bandwidth.
- Asia Pacific is described in the page’s detailed regional analysis as the largest and fastest-growing market, led by China and followed by India, Japan and South Korea. The FAQ instead says Europe remains a dominant market, so this conflict is explicitly retained rather than silently overwritten.
- 1.6T optics are moving into production and deployment. Vodafone Idea deployed Ciena WaveLogic 6 Extreme at 1.6 Tb/s in India, Cisco announced 1.6T OSFP optics around its 102.4T G300 systems, and Lumentum demonstrated a 1.6T DR4 OSFP module for AI scale-out networks.
- The headline anchors imply about 5.3% annual growth. USD 34.7 billion in 2025 and USD 55 billion in 2034 mathematically imply approximately 5.25% CAGR, slightly below the page’s printed 5.5%; the anchor-derived series is used for the 2026 estimate.
Optical Communication Market Overview
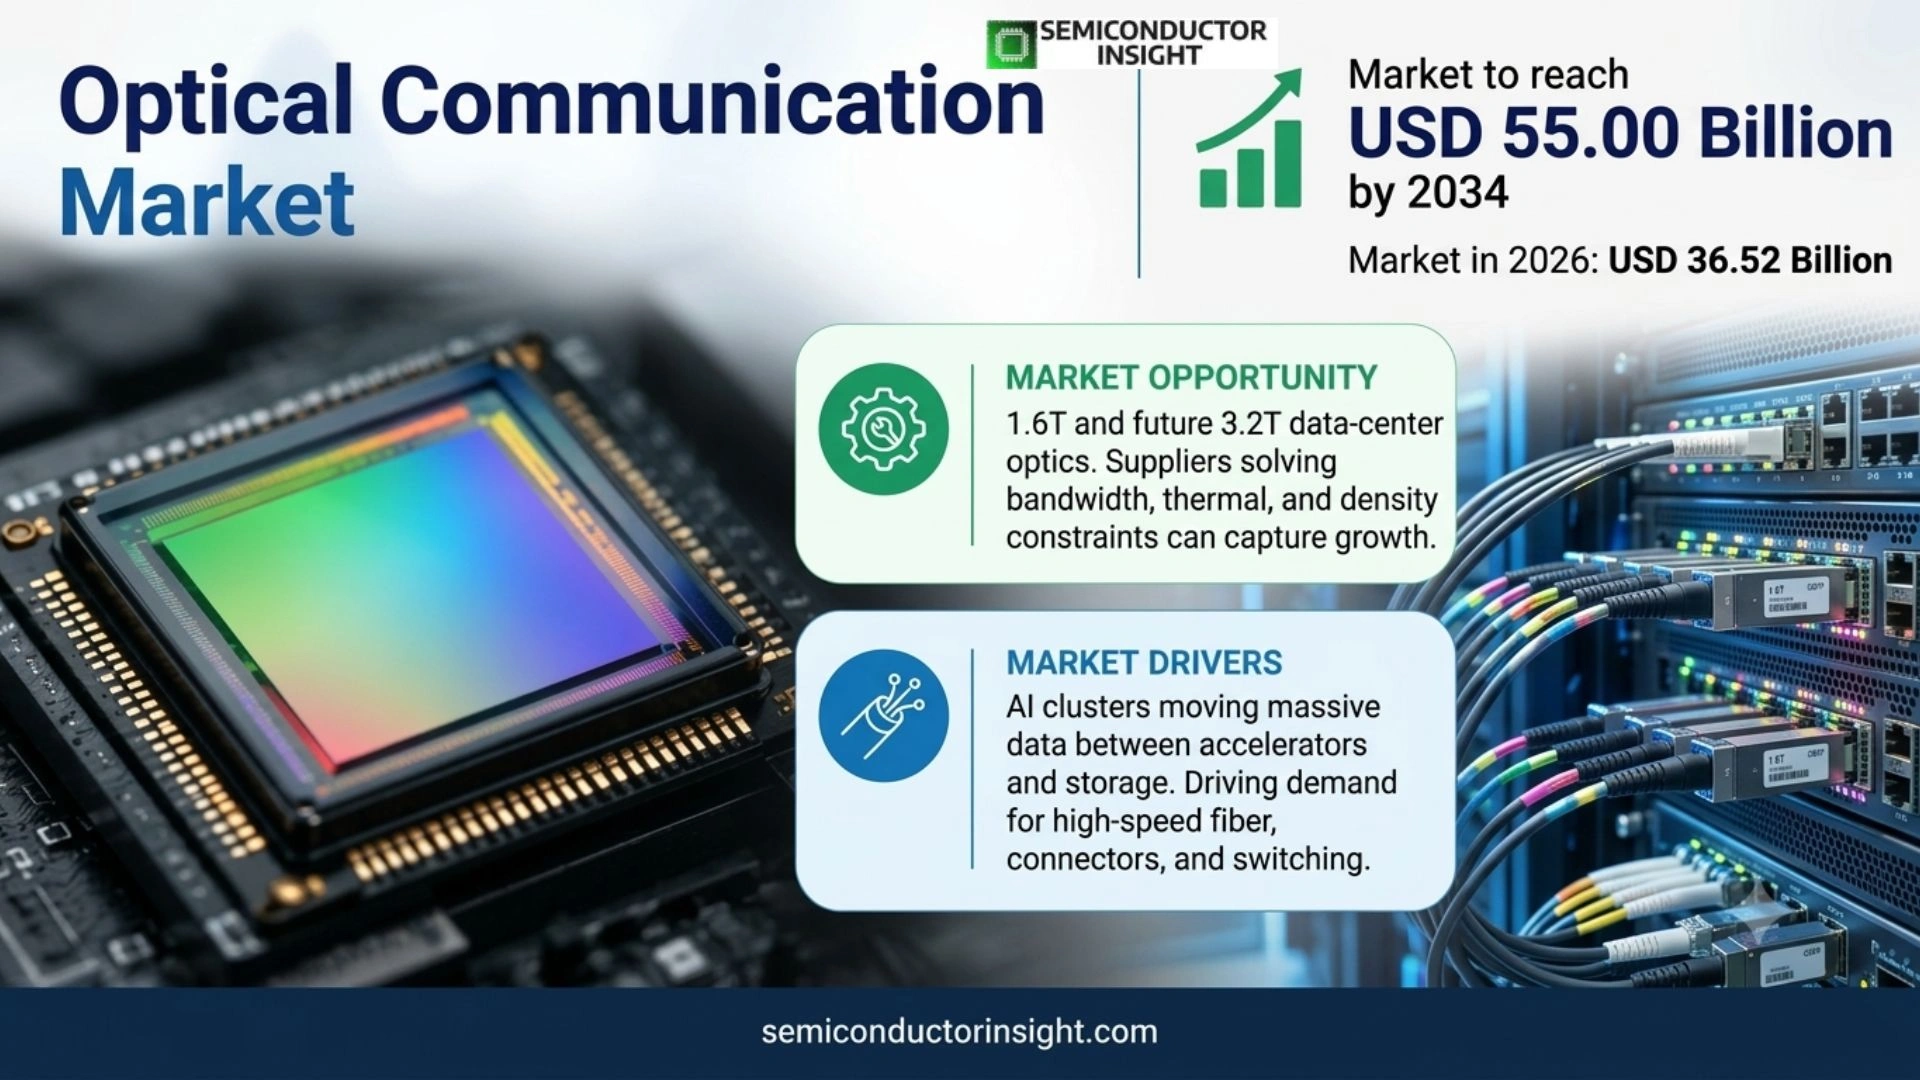
Optical Communication Market is rebased to USD 34.70 billion in 2025, increases to an estimated USD 36.52 billion in 2026, and is projected to reach USD 55.00 billion by 2034. The selected source-page size anchors imply a 5.3% CAGR during 2026–2034. Asia Pacific is the largest market in 2025 based on the source page’s detailed regional analysis, while its FAQ separately calls Europe a dominant mature market, while current demand is being reshaped by AI and cloud data-center bandwidth, 800G/1.6T coherent optics, FTTH expansion, 5G/6G transport, silicon photonics, co-packaged optics, data-center fiber-density requirements and continuing upgrades in WDM, optical amplification and metro/long-haul transport.
Optical communication transmits information by modulating light through fiber or free space and includes optical fiber, lasers, modulators, photodetectors, transceivers, WDM systems, amplifiers, coherent transport platforms and associated network-control software. The economic advantage is bandwidth over distance: optical networks move far more data per physical link than copper at metropolitan, backbone and data-center scale, while power per bit and spectral efficiency increasingly determine system value as AI traffic grows.
The market is entering another bandwidth transition. Ciena is deploying 1.6 Tb/s WaveLogic 6 Extreme in commercial networks, Cisco announced 1.6T OSFP optics with 102.4T Silicon One G300 systems, and Lumentum demonstrated 1.6T DR4 modules for AI scale-out. These products show that the commercial boundary is moving from 400G/800G toward 1.6T per optical interface, while future 3.2T systems are already shaping component and cooling requirements.
Physical fiber demand is also accelerating around data centers. Corning announced a multiyear agreement of up to USD 6 billion with Meta in January 2026 for optical fiber, cable and connectivity and a separate multibillion-dollar Amazon agreement in June 2026 that supports expanded North Carolina fiber manufacturing. These commitments demonstrate that AI growth is creating demand not only for high-end coherent transceivers but also for large volumes of cable, connectors and dense fiber-management infrastructure.
Segment Analysis: By Type
The source page segments the market into Fiber Optic and Free-Space Optics. Fiber optic dominates strategic deployments because it supports long-haul, submarine, metro, FTTH and data-center connectivity with very high bandwidth and immunity to electromagnetic interference. Free-space optics is more specialized and is used where rapid line-of-sight deployment can avoid trenching or provide backup connectivity.
| Type | Technical / commercial role | Market position |
|---|---|---|
| Fiber Optic | Fiber-optic systems transmit light through glass or specialty fiber and span access networks, metro transport, submarine systems and data-center links. Commercial performance depends on attenuation, dispersion, fiber count, connector density, optical power budget and the transceiver/coherent technology placed at each end. Existing fiber can also be upgraded by increasing wavelengths and bits per wavelength. | Dominant type. The source page explicitly identifies fiber optic as the strategic deployment leader. Current AI buildouts are increasing both physical fiber demand and optical interface speed, with Corning expanding cable capacity and network vendors moving toward 1.6T coherent and IMDD modules. |
| Free-Space Optics | FSO transmits optical beams through air between line-of-sight terminals. It can be deployed rapidly between buildings, across temporary sites or as a resilience path where trenching is slow or expensive. Atmospheric turbulence, fog, rain, alignment and beam tracking create reliability constraints that do not affect buried or aerial fiber in the same way. | Complementary niche. The source page highlights urban corridors and disaster-recovery use. FSO is most attractive where installation speed or right-of-way avoidance outweighs weather risk, and where adaptive optics or beam steering can maintain acceptable availability. |
Secondary segmentation: By Technology
The source page identifies Wavelength Division Multiplexing (WDM), Advanced Modulation Schemes and Optical Amplifiers. WDM is the leading technology because it allows many independent wavelengths to share one fiber, increasing capacity without laying additional fiber. Coherent modulation and amplification then extend reach and spectral efficiency across metro, long-haul and submarine links.
| Technology | Commercial implication |
|---|---|
| Wavelength Division Multiplexing | WDM carries multiple optical channels over one fiber and is central to metro and backbone economics. Flexible-grid ROADMs and coherent transponders allow operators to add capacity wavelength by wavelength, delaying the expense of new fiber construction. Supplier differentiation includes spectral efficiency, line-system flexibility and automation. |
| Advanced Modulation Schemes | Coherent QPSK/QAM and high-baud signaling raise bits per wavelength while DSP compensates for fiber impairments. Ciena’s 1.6T WaveLogic 6 Extreme and future 1600ZR/1600ZR+ designs illustrate how modulation, baud rate and semiconductor process advances jointly reduce cost and power per bit. |
| Optical Amplifiers | EDFA and other optical-amplifier systems extend transmission distance without electrical regeneration and can amplify many WDM channels simultaneously. Ciena’s 2026 hyper-rail photonics work targets much higher fiber-pair density with lower space and power, showing continued innovation in line-system infrastructure. |
Secondary segmentation: By End User
The page divides end users into Telecom Service Providers, Enterprise & IT, and Government & Defense. Telecom operators lead because they own access, metro and backbone networks, while hyperscale enterprises are becoming more influential as AI data centers create private optical fabrics and inter-campus connectivity requirements. For optical-network suppliers, the commercial consequence is that bandwidth density, watts per bit, fiber utilization and interoperability determine deployment economics more directly than the headline port speed alone.
| End user | Demand characteristics |
|---|---|
| Telecom Service Providers | Operators deploy FTTH, mobile transport, metro and long-haul systems and must maximize capacity on existing fiber. They evaluate coherent reach, spectral efficiency, ROADM flexibility, automation and lifecycle support. Network upgrades are typically multiyear programs with strong vendor qualification and interoperability requirements. |
| Enterprise & IT | Hyperscalers, cloud operators, financial firms and large enterprises use optical networks inside and between data centers. AI has increased demand for 800G/1.6T links, dense fiber and lower power per bit. This group increasingly shapes transceiver standards and can purchase optics directly at scale. |
| Government & Defense | Public-sector and defense users require secure, resilient long-distance communications and may deploy protected terrestrial, subsea or free-space optical links. Procurement emphasizes supply security, encryption compatibility and long support life rather than lowest cost per port. |
Secondary segmentation: By Deployment Mode
The source page lists Fiber-to-Home (FTTH), Metro Access and Long-Haul. FTTH is the leading access deployment because operators replace copper with gigabit-capable optical access, while metro and long-haul networks absorb the strongest coherent-optics innovation as traffic aggregates toward data centers and backbone routes. This distinction matters because optical links operate as part of a full network stack that includes fiber, connectors, transceivers, switching, cooling and automation, so one component cannot be optimized in isolation.
| Deployment mode | Market role |
|---|---|
| FTTH | FTTH places optical fiber directly at residences and small businesses, improving bandwidth and reducing copper maintenance. Demand includes feeder/distribution fiber, passive splitters, connectors, OLT/ONT optics and civil construction. Economics are highly sensitive to trenching, labor and take rate. |
| Metro Access | Metro networks aggregate access, enterprise and data-center traffic across cities. Coherent pluggables and compact line systems are increasingly used to scale links without large chassis, while ROADMs and automation improve wavelength utilization across dynamic traffic patterns. |
| Long-Haul | Long-haul systems use high-performance coherent optics, amplification and dispersion management across hundreds or thousands of kilometers. Fiber scarcity and regeneration cost make spectral efficiency especially valuable, supporting premium transponders such as 1.6T WaveLogic 6 Extreme. |
Segment Analysis: By Application
By application, the source page segments demand into Telecommunications, Data Center Interconnect, Enterprise Networking and Others. Telecommunications is the leading application because carrier-grade access and transport networks cover the largest physical footprint, while Data Center Interconnect is the strongest structural growth area as AI workloads create much higher east-west and inter-campus traffic.
| Application | Demand characteristics |
|---|---|
| Telecommunications | Carrier networks use optical communications for FTTH, mobile fronthaul/midhaul/backhaul, metro aggregation, long-haul and submarine routes. WDM allows operators to scale existing fiber, while coherent optics reduce the cost per transmitted bit. Deployment follows both subscriber broadband demand and network densification around 5G/6G and cloud gateways. |
| Data Center Interconnect | DCI links campuses, availability zones and hyperscale facilities using 400G, 800G and increasingly 1.6T coherent or direct-detect optics. AI clusters increase both bandwidth and fiber-pair counts, making power, port density, liquid cooling and low-loss connectivity central purchasing criteria. Ciena, Cisco, Lumentum and Corning are all investing around this demand. |
| Enterprise Networking | Large enterprises use fiber for campus backbones, storage networks, industrial facilities and private data centers. Deployment is smaller than telecom or hyperscale DCI but values reliability, simple operations and compatibility with Ethernet switching. Upgrades often occur alongside Wi-Fi, private 5G or data-center modernization. |
| Others | Other applications include government, defense, scientific networks, transport systems, utilities and free-space optical links. These markets can require unusual reach, security, environmental or redundancy specifications and therefore support specialized component and integration opportunities. |
Regional Analysis
The source page’s detailed regional section states that Asia Pacific is the largest and fastest-growing market, led by China and followed by India, Japan and South Korea. Its FAQ separately says Europe remains a dominant market because of mature telecom infrastructure. Asia Pacific is therefore used for the 2025 leadership card, while the workbook explicitly records the FAQ conflict rather than erasing it.
How do fiber rollout, AI data centers and vendor ecosystems create different regional demand patterns?
Asia Pacific combines massive subscriber bases, rapid 5G/FTTH rollout and large manufacturing ecosystems. North America leads hyperscale AI demand and is adding domestic fiber and photonics capacity. Europe has mature fiber infrastructure and a strong Nokia-led optical systems base. South America is expanding cloud and broadband from a smaller installed base, while Middle East & Africa growth is concentrated in Gulf data centers, submarine connectivity, telecom backbones and national digital-inclusion programs.
| Region | Position | Growth outlook | Demand profile | What decides supplier selection |
|---|---|---|---|---|
| Asia Pacific | Largest & fastest-growing | High | 5G, FTTH, cloud and manufacturing-led | Scale, cost, local partnerships and fiber deployment speed |
| North America | AI / hyperscale technology leader | High | Data-center, cloud and coherent optics-led | Power per bit, density, domestic capacity and interoperability |
| Europe | Mature dominant market | Moderate to high | Fiber upgrades, cloud and energy efficiency-led | Installed-base compatibility, efficiency and open networking |
| South America | Emerging | High from smaller base | Broadband and data-center-led | Capex, right-of-way and local operator partnerships |
| Middle East & Africa | Emerging | High from smaller base | Digital infrastructure and submarine/metro-led | Financing, coverage, resilience and regional support |
Competitive Landscape
The source page profiles a broad optical ecosystem spanning transport systems, routers, lasers, transceivers, fiber and cable. Ciena, Cisco and Nokia are major system vendors, while Lumentum and Coherent supply photonic components and Corning/Furukawa supply fiber infrastructure. Huawei and ZTE add strong Asian carrier-scale competition. Current analysis also notes that Nokia completed its acquisition of Infinera in February 2025 and that Finisar is now within Coherent rather than the older II-VI naming used on the page.
Ciena is strongly positioned in coherent transport and 1.6T technology. Its WaveLogic 6 Extreme is commercially deployed, and the company is also developing 1600ZR/ZR+ pluggables, hyper-rail photonics and co-packaged optical engines for AI data centers. This gives it exposure across carrier backbone, metro DCI and emerging intra-data-center optical architectures. For optical-network suppliers, the commercial consequence is that bandwidth density, watts per bit, fiber utilization and interoperability determine deployment economics more directly than the headline port speed alone.
Nokia’s acquisition of Infinera materially increased scale in optical networks and expanded its webscale and North American position. Cisco competes from the switching and routing side and integrates optics around Silicon One systems, while Juniper’s source-page presence reflects packet networking adjacency. Huawei and ZTE remain major carrier infrastructure competitors, particularly in Asia and emerging markets.
Lumentum and Coherent supply lasers, modulators and transceivers, while Corning and Furukawa provide fiber and cable. The market therefore has layered competition: no single company controls the full value chain from glass preform to coherent DSP to router, and partnerships between component makers, system vendors and hyperscalers increasingly determine time to market.
| Competitive tier | Companies | Why they matter |
|---|---|---|
| Coherent / optical system leaders | Ciena; Nokia (including Infinera); Cisco; Huawei; ZTE | These suppliers deliver transport, routing and carrier optical systems at global scale. Their advantage is installed base, coherent DSP, network software and long qualification with service providers and hyperscalers. |
| Photonics & transceiver specialists | Lumentum; Coherent (including Finisar); other module suppliers | These companies provide lasers, modulators, photodetectors and high-speed optical modules. AI growth increases demand for 800G/1.6T density, while packaging and thermal management become central competitive factors. |
| Fiber / cable infrastructure leaders | Corning; Furukawa Electric | Physical fiber and connectivity are foundational to FTTH and data centers. Large hyperscale agreements in 2026 show that fiber capacity and cable manufacturing can become strategic bottlenecks alongside transceiver supply. |
Companies profiled in the report
The source page profiles Ciena Corporation, Cisco Systems, Infinera Corporation, Nokia, ADVA Optical Networking, Lumentum, Finisar (II-VI Inc.), Huawei Technologies Co., Ltd., ZTE, Corning Incorporated, Furukawa Electric Co., Ltd. and Juniper Networks. Current-company analysis notes that Nokia completed its acquisition of Infinera in February 2025 and that II-VI adopted the Coherent name after acquiring Coherent, so the source labels are preserved but not treated as fully independent current entities.
Production Capacity Analysis
Optical communication production capacity spans fiber drawing, cable assembly, photonic semiconductor wafers, lasers, modulators, DSPs, transceiver packaging, optical line systems and network equipment. AI is stressing several layers simultaneously: hyperscalers need more fiber pairs, higher transceiver rates and more switches, so capacity planning must account for physical cable, advanced photonics and electronics rather than one universal manufacturing metric.
Corning’s 2026 agreements with Meta and Amazon are direct evidence of physical infrastructure capacity expansion. The company is adding manufacturing in North Carolina to supply optical fiber and cable for AI data centers. Because high-density architectures can use thousands of fiber connections per facility, cable and connector manufacturing can become a deployment bottleneck even when optical transceiver technology is available.
Transceiver capacity is constrained by laser, modulator, photodiode, DSP and advanced packaging supply. Lumentum’s 1.6T DR4 OSFP prototype uses four 400G differential EML lasers and is positioned as a bridge toward 3.2T modules. Moving from prototype to high volume requires yield and thermal management across both photonics and electrical interfaces.
Coherent transport systems add another layer of capacity through line cards, ROADMs, amplifiers and software. Ciena’s WaveLogic 6 Extreme is already deployed in commercial 1.6T networks, while future 1600ZR/ZR+ pluggables use advanced silicon to fit more coherent processing inside limited power envelopes. Qualified production therefore depends on semiconductor, optical and system assembly all scaling together.
Market Dynamics
The market is driven by AI data traffic, FTTH, 5G/6G transport and higher-speed data-center interconnect, while growth is restrained by civil deployment cost, photonics complexity, power and thermal constraints and skilled engineering requirements. The highest-value opportunities increasingly occur where optical technology reduces watts per bit or avoids laying additional fiber.
Market Drivers
| Driver | Directional impact* | Commercial mechanism |
|---|---|---|
| AI and cloud traffic | High | Training and inference increase bandwidth inside and between data centers, accelerating 800G/1.6T optics, fiber density and coherent DCI. |
| FTTH expansion | High | Operators replace copper with fiber to provide symmetric gigabit services and lower maintenance, creating long-duration access-network demand. |
| 5G/6G transport | Medium to High | Dense radio networks require fiber fronthaul, midhaul and backhaul with low latency and high capacity. |
| Spectral-efficiency upgrades | Medium to High | WDM and coherent optics increase capacity on existing fiber, delaying costly civil construction and new cable routes. |
AI increases optical bandwidth per data center
AI clusters move enormous amounts of data between accelerators, storage and geographically separated facilities. Cisco’s 1.6T OSFP roadmap, Lumentum’s 1.6T DR4 module and Ciena’s coherent products show that optical interface speed is rising in direct response. The resulting demand also increases fiber, connectors and switching capacity, creating a broad multiplier across the optical value chain.
FTTH creates a long-duration physical-fiber build cycle
Access networks require trenching, poles, feeder/distribution fiber, splitters and optical terminals. Once installed, fiber can support multi-generation bandwidth upgrades, making it a strategic infrastructure asset. Operators therefore continue replacing copper where subscriber density and civil economics support a positive return. This distinction matters because optical links operate as part of a full network stack that includes fiber, connectors, transceivers, switching, cooling and automation, so one component cannot be optimized in isolation.
5G and future 6G require dense optical transport
Mobile radios may be wireless, but traffic from cell sites must reach core networks through fiber or other high-capacity links. More radios and edge locations increase fronthaul, midhaul and backhaul requirements, supporting metro fiber, WDM and coherent pluggables even where consumer fixed broadband growth is moderate. Buyers therefore evaluate reach, spectral efficiency, power, port density, fiber count and lifecycle compatibility before selecting an optical architecture for carrier or hyperscale deployment.
WDM protects scarce fiber assets
In dense corridors, obtaining new rights of way can be expensive or slow. WDM allows operators to add wavelengths on existing fiber, while coherent modulation increases bits per wavelength. This creates a strong economic incentive to upgrade optical electronics before constructing new routes. Through 2034, suppliers that scale capacity while reducing power and civil-infrastructure requirements can capture the strongest value from AI, cloud, FTTH and mobile transport growth.
Market Restraints
| Restraint | Directional impact* | Commercial mechanism |
|---|---|---|
| High civil capex | High | Trenching, permits and labor can dominate FTTH and metro-fiber cost, especially where existing ducts are unavailable. |
| Power and thermal limits | Medium to High | 800G/1.6T modules and high-density switches must fit tight power envelopes, making cooling and photonic integration critical. |
| Engineering complexity | Medium | Coherent planning, fiber characterization, splicing and high-density connector management require specialized skills. |
| Technology transition risk | Medium | Operators must balance pluggable, embedded coherent and future CPO architectures without stranding installed systems. |
Civil construction can outweigh equipment cost
The source page correctly identifies high capital expenditure as a central challenge. In FTTH and metro builds, trenching, permits and labor can cost more than the fiber or electronics. Operators therefore need high take rates, shared ducts or government support before deploying to lower-density areas, limiting how quickly theoretical broadband demand converts into optical revenue.
Higher optical density creates power and cooling challenges
1.6T interfaces move more data per port but also place photonics and DSPs closer to thermal limits. Cisco’s liquid-cooled 102.4T systems and Ciena/Lumentum work on co-packaged or advanced modules show that the industry must reduce watts per bit as aggressively as it increases raw bandwidth. For optical-network suppliers, the commercial consequence is that bandwidth density, watts per bit, fiber utilization and interoperability determine deployment economics more directly than the headline port speed alone.
Optical networks require specialized engineering
Fiber splicing, connector cleanliness, coherent route planning, dispersion and optical power budgets all affect link performance. A shortage of trained technicians can delay deployments even when hardware is available, particularly in fast-growing emerging markets where infrastructure construction is scaling rapidly. This distinction matters because optical links operate as part of a full network stack that includes fiber, connectors, transceivers, switching, cooling and automation, so one component cannot be optimized in isolation.
Architecture choices can shorten product cycles
Operators are evaluating coherent pluggables, transponders, linear optics and co-packaged optics simultaneously. A supplier that invests heavily in one architecture can face slower adoption if customers standardize another. Flexible portfolios and interoperability therefore reduce technology-transition risk. Buyers therefore evaluate reach, spectral efficiency, power, port density, fiber count and lifecycle compatibility before selecting an optical architecture for carrier or hyperscale deployment.
Market Opportunities
1.6T and future 3.2T data-center optics
AI scale-out networks are moving rapidly toward 1.6T optical interfaces, and vendors are already discussing 3.2T building blocks. Suppliers that solve laser bandwidth, packaging, thermal and connector-density constraints can capture premium growth. Through 2034, suppliers that scale capacity while reducing power and civil-infrastructure requirements can capture the strongest value from AI, cloud, FTTH and mobile transport growth.
Co-packaged optics and near-packaged photonics
As switch bandwidth reaches hundreds of terabits per second, moving optical engines closer to switch silicon can reduce electrical reach and power. Ciena’s Vesta platform and broader industry work make CPO a strategic next-generation opportunity even though pluggables remain dominant today. For optical-network suppliers, the commercial consequence is that bandwidth density, watts per bit, fiber utilization and interoperability determine deployment economics more directly than the headline port speed alone.
Domestic fiber and photonics localization
Corning’s multibillion-dollar U.S. agreements and Nokia’s U.S. investment plans show that supply resilience is becoming a purchasing criterion. Regional manufacturing can win strategic contracts even when global capacity exists elsewhere. This distinction matters because optical links operate as part of a full network stack that includes fiber, connectors, transceivers, switching, cooling and automation, so one component cannot be optimized in isolation.
Free-space optical resilience links
FSO can provide rapid building-to-building or disaster-recovery capacity without trenching. Improved beam steering and atmospheric compensation can expand its role as a backup layer for dense urban, defense and temporary networks. Buyers therefore evaluate reach, spectral efficiency, power, port density, fiber count and lifecycle compatibility before selecting an optical architecture for carrier or hyperscale deployment.
Supply Chain Analysis
Fiber preform, drawing & cable
Photonic devices & optical components
Transceivers, coherent engines & line systems
Network deployment & service integration
Fiber preform, drawing & cable
Glass preforms are drawn into optical fiber, coated, colored and assembled into cables or high-density ribbons. Data-center growth is increasing fiber-pair counts and connector density, requiring manufacturing expansion and precise quality control. Through 2034, suppliers that scale capacity while reducing power and civil-infrastructure requirements can capture the strongest value from AI, cloud, FTTH and mobile transport growth.
Photonic devices & optical components
Lasers, modulators, photodetectors, amplifiers and filters convert and control light. Performance at 800G/1.6T depends on high-speed electro-optic materials, semiconductor yield and advanced packaging. For optical-network suppliers, the commercial consequence is that bandwidth density, watts per bit, fiber utilization and interoperability determine deployment economics more directly than the headline port speed alone.
Transceivers, coherent engines & line systems
DSPs, photonics and control electronics are integrated into pluggable modules, transponders, ROADMs and amplifiers. Thermal design, firmware and interoperability determine whether laboratory performance can scale in production networks. This distinction matters because optical links operate as part of a full network stack that includes fiber, connectors, transceivers, switching, cooling and automation, so one component cannot be optimized in isolation.
Network deployment & service integration
Telecom operators, hyperscalers and enterprises install fiber, configure wavelengths and manage capacity through network software. Route planning, splicing, commissioning and lifecycle support create significant service value beyond hardware manufacturing. Buyers therefore evaluate reach, spectral efficiency, power, port density, fiber count and lifecycle compatibility before selecting an optical architecture for carrier or hyperscale deployment.
Recent Developments
Recent developments show optical communication entering a 1.6T deployment cycle while hyperscalers lock in large fiber and cable supply. These events connect AI traffic directly to both photonic electronics and physical infrastructure, making them more informative than generic connectivity forecasts. Through 2034, suppliers that scale capacity while reducing power and civil-infrastructure requirements can capture the strongest value from AI, cloud, FTTH and mobile transport growth.
June 8, 2026 — Amazon signed a multibillion-dollar Corning fiber agreement
Amazon and Corning announced a multiyear, multibillion-dollar agreement to produce optical fiber for data centers and expand Corning’s North Carolina facilities, including 1,000 new advanced-manufacturing jobs. The deal shows that hyperscale AI infrastructure is creating strategic demand for domestic fiber and cable capacity, not only transceiver electronics. For optical-network suppliers, the commercial consequence is that bandwidth density, watts per bit, fiber utilization and interoperability determine deployment economics more directly than the headline port speed alone.
March 31, 2026 — Vodafone Idea deployed Ciena WaveLogic 6 Extreme
Vodafone Idea announced deployment of Ciena’s WaveLogic 6 Extreme on its 6500 platform after a successful 1.6 Tb/s single-channel trial across two data centers in India. The network is designed to support 400G/800G services and hyperscaler demand, demonstrating commercial 1.6T coherent adoption in Asia Pacific. This distinction matters because optical links operate as part of a full network stack that includes fiber, connectors, transceivers, switching, cooling and automation, so one component cannot be optimized in isolation.
March 17, 2026 — Lumentum demonstrated a 1.6T DR4 OSFP module
Lumentum showcased a 1.6T DR4 OSFP prototype using four 400G differential EML lasers for AI scale-out networks. The company positioned the four-lane 400G optical architecture as a stepping stone toward future 3.2T modules, highlighting the rapid increase in per-lane photonic performance and packaging density. Buyers therefore evaluate reach, spectral efficiency, power, port density, fiber count and lifecycle compatibility before selecting an optical architecture for carrier or hyperscale deployment.
February 2026 — Cisco announced 102.4T systems with 1.6T OSFP optics
Cisco announced Silicon One G300-based N9000 and Cisco 8000 systems delivering 102.4 Tb/s switching capacity together with 1.6T OSFP optics and 800G linear pluggable optics. The platform targets AI scale-out networks and illustrates how switch silicon, optical links and cooling are being co-designed for higher bandwidth density. Through 2034, suppliers that scale capacity while reducing power and civil-infrastructure requirements can capture the strongest value from AI, cloud, FTTH and mobile transport growth.
Report Scope & Segmentation
| Attribute | Coverage |
|---|---|
| Market | Optical Communication |
| Base Year | 2025 |
| Estimated Year | 2026 |
| Forecast Period | 2026–2034 |
| 2025 Market Size | USD 34.70 billion |
| 2034 Forecast Size | USD 55.00 billion |
| CAGR | 5.3% (2026–2034) |
| Largest Market in 2025 | Asia Pacific |
| By Type | Fiber Optic; Free-Space Optics |
| By Application | Telecommunications; Data Center Interconnect; Enterprise Networking; Others |
| By End User | Telecom Service Providers; Enterprise & IT; Government & Defense |
| By Technology | Wavelength Division Multiplexing (WDM); Advanced Modulation Schemes; Optical Amplifiers |
| By Deployment Mode | Fiber-to-Home (FTTH); Metro Access; Long-Haul |
| Regions | Asia Pacific; North America; Europe; South America; Middle East & Africa |
| Companies Profiled | Ciena Corporation; Cisco Systems; Infinera Corporation (source-page label; acquired by Nokia in 2025); Nokia; ADVA Optical Networking; Lumentum; Finisar (II-VI Inc. / current Coherent context); Huawei Technologies Co., Ltd.; ZTE; Corning Incorporated; Furukawa Electric Co., Ltd.; Juniper Networks |
Frequently Asked Questions
What is the Optical Communication market size in 2025?
The source page publishes USD 34.7 billion in 2025, so that base-year figure is preserved exactly. Using the USD 55 billion 2034 endpoint implies an estimated USD 36.52 billion in 2026 and a compound annual growth rate of approximately 5.25%. For optical-network suppliers, the commercial consequence is that bandwidth density, watts per bit, fiber utilization and interoperability determine deployment economics more directly than the headline port speed alone.
What is the projected market size by 2034?
The source-page endpoint is USD 55 billion in 2034. Because both the base year and forecast year are already supplied, no extrapolation beyond 2034 is required; the article only recalculates the annual growth factor to make the 2026 estimate consistent with the two endpoints. This distinction matters because optical links operate as part of a full network stack that includes fiber, connectors, transceivers, switching, cooling and automation, so one component cannot be optimized in isolation.
Why is the CAGR 5.3% instead of the page’s 5.5%?
USD 34.7 billion in 2025 and USD 55 billion in 2034 imply approximately 5.25% compound annual growth over nine years. The printed 5.5% is close but does not exactly reconcile, so the anchor-derived 5.3% rate is used for consistency. Buyers therefore evaluate reach, spectral efficiency, power, port density, fiber count and lifecycle compatibility before selecting an optical architecture for carrier or hyperscale deployment.
Which optical communication type leads the market?
Fiber Optic is the dominant type on the source page because it provides the bandwidth, reach and electromagnetic immunity needed for access, metro, backbone and data-center networks. Free-space optics is a complementary niche where rapid line-of-sight deployment can avoid trenching. Through 2034, suppliers that scale capacity while reducing power and civil-infrastructure requirements can capture the strongest value from AI, cloud, FTTH and mobile transport growth.
Which application is the largest?
Telecommunications is the leading application because carriers deploy optical systems across FTTH, mobile transport, metro and long-haul networks. Data Center Interconnect is the strongest strategic growth application as AI drives 800G and 1.6T links between high-capacity computing sites. For optical-network suppliers, the commercial consequence is that bandwidth density, watts per bit, fiber utilization and interoperability determine deployment economics more directly than the headline port speed alone.
Which region is the largest market?
The detailed source-page regional analysis explicitly calls Asia Pacific the largest and fastest-growing market. Its FAQ separately says Europe remains a dominant mature market. This article uses Asia Pacific for the leadership card and records the conflicting FAQ language in the workbook notes. This distinction matters because optical links operate as part of a full network stack that includes fiber, connectors, transceivers, switching, cooling and automation, so one component cannot be optimized in isolation.
How is AI changing optical communications?
AI increases bandwidth inside and between data centers, driving 800G/1.6T optics, higher switch capacity and denser fiber. It also creates physical infrastructure demand: Meta and Amazon have signed multibillion-dollar fiber and cable agreements with Corning to support U.S. data-center buildouts. Buyers therefore evaluate reach, spectral efficiency, power, port density, fiber count and lifecycle compatibility before selecting an optical architecture for carrier or hyperscale deployment.
What role does WDM play?
Wavelength Division Multiplexing allows many optical channels to share one fiber. Operators can therefore increase capacity without laying new fiber, making WDM a fundamental economic tool in metro and long-haul networks where right-of-way and civil construction are expensive. Through 2034, suppliers that scale capacity while reducing power and civil-infrastructure requirements can capture the strongest value from AI, cloud, FTTH and mobile transport growth.
Who are the major companies profiled?
The source page profiles Ciena, Cisco, Infinera, Nokia, ADVA, Lumentum, Finisar/II-VI, Huawei, ZTE, Corning, Furukawa Electric and Juniper. Current-company analysis notes that Nokia acquired Infinera in February 2025 and that II-VI now operates under the Coherent name. For optical-network suppliers, the commercial consequence is that bandwidth density, watts per bit, fiber utilization and interoperability determine deployment economics more directly than the headline port speed alone.
What is the main strategic opportunity through 2034?
The largest opportunity is the migration from 400G/800G toward 1.6T and eventually 3.2T optical connectivity while maintaining acceptable power per bit. Suppliers that combine photonic integration, advanced packaging, fiber density and network automation can capture value across both AI data centers and carrier transport. This distinction matters because optical links operate as part of a full network stack that includes fiber, connectors, transceivers, switching, cooling and automation, so one component cannot be optimized in isolation.
Get Sample Report PDF for Exclusive Insights
Report Sample Includes
- Table of Contents
- List of Tables & Figures
- Charts, Research Methodology, and more...
 Download Sample Report PDF