Key Statistics
Key Takeaways
- EDFA technology is the largest type, with the report page placing erbium-doped fiber amplifiers above 55% of the market because the 1550 nm transmission window is central to long-haul and metro optical networks.
- Telecommunication is the largest application, representing more than 44% in the report page’s segmentation as operators continue fiber, 5G transport, metro and backbone upgrades.
- Asia Pacific leads globally; China is reported at 38% of the market and its 2025 network base included 74.99 million km of optical cable and 1.21 billion FTTH/O access ports.
- Data-center interconnect is a major growth engine as AI clusters increase traffic between facilities and make optical transport capacity, amplifier density and power efficiency more valuable.
- C+L-band scaling is changing amplifier design: Coherent’s 2026 multi-rail platform placed four C+L transport rails in one 1RU in-line amplifier card, showing the drive toward greater capacity per rack unit.
- Manufacturing capacity is becoming strategic as high-power pump lasers, InP devices, erbium-doped fiber, precision packaging and thermal management all influence amplifier availability and cost.
Optical Amplifiers Market Overview
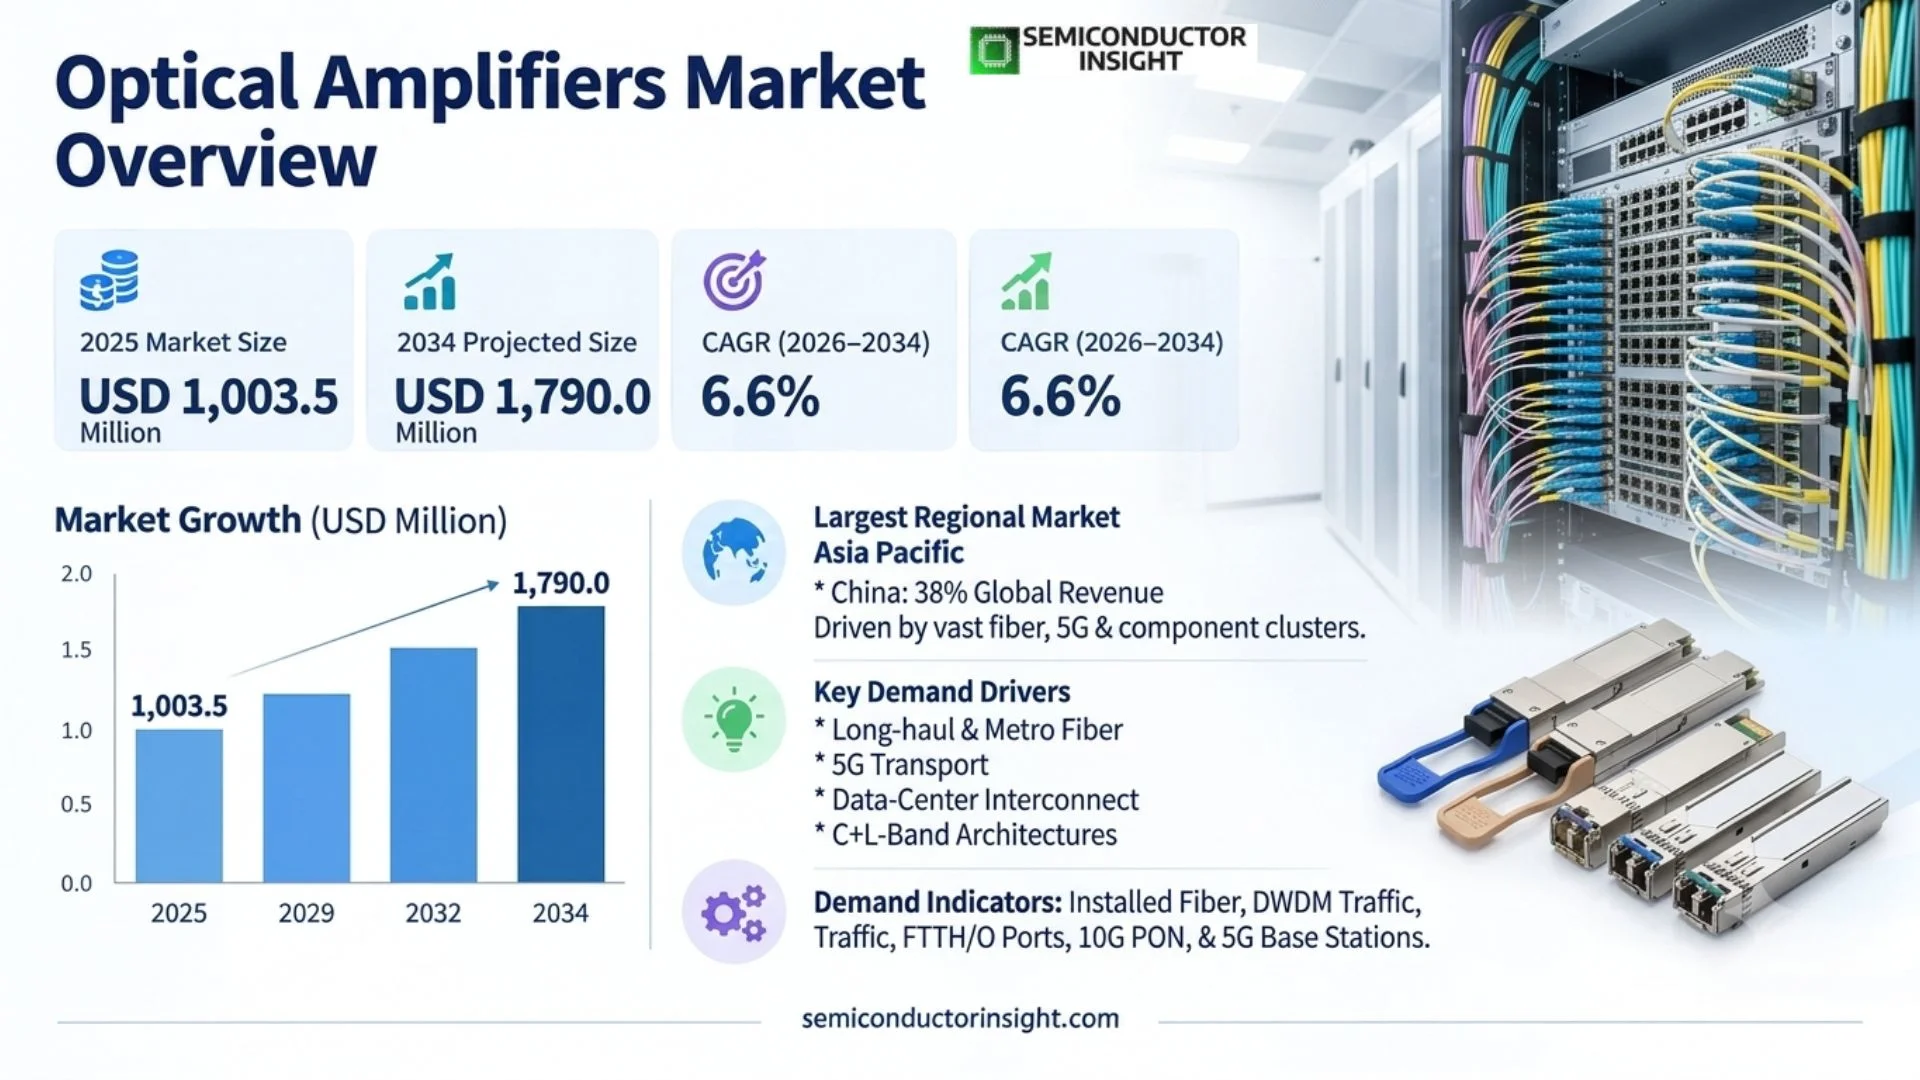
Optical Amplifiers Market was valued at USD 1,003.5 million in 2025 and is projected to reach USD 1,790.0 million by 2034, expanding at a 6.6% during 2026–2034. Asia Pacific is the largest regional market, with the report page identifying China alone at 38% of global revenue. Demand is anchored by long-haul and metro fiber, 5G transport, data-center interconnect and the transition from C-band systems toward higher-capacity C+L-band architectures.
Optical amplifiers increase the power of an optical signal directly in the photonic domain, avoiding repeated conversion from light to electrical data and back to light. In wavelength-division multiplexed networks this allows many channels to travel long distances across one fiber while compensating for transmission loss. The technology is therefore embedded in submarine, long-haul, metro, access, data-center interconnect and specialized photonic systems where reach and optical power budgets determine network architecture.
The commercial market includes several amplifier mechanisms. EDFAs dominate C-band and L-band telecom transport because erbium-doped fiber provides efficient gain around the low-loss window of silica fiber. Semiconductor optical amplifiers use compact semiconductor gain media and can support amplification, switching and integration in photonic systems. Nonlinear amplifiers remain more specialized, but they are relevant to research and future transmission architectures where conventional gain approaches do not meet bandwidth, wavelength or signal-processing requirements.
Demand is shifting from simple reach extension toward capacity scaling. Operators increasingly need wider usable spectrum, more channels per fiber, lower watts per transported bit and denser in-line equipment. AI data-center expansion adds another layer: traffic must move not only inside a facility but also between campuses and metro sites. This creates a market for amplifier platforms that can pool pump, monitoring and gain-equalization resources across multiple optical rails rather than scaling by stacking independent line systems.
Segment Analysis: By Type
By type, the market is segmented into EDFA (Erbium Doped Fiber Amplifier), SOA (Semiconductor Optical Amplifier), and Nonlinear Optical Amplifier. EDFA is the established volume leader because it provides efficient optical gain in the wavelength bands used by dense wavelength-division multiplexed telecom networks.
| Type | Technical role | Market position and purchasing logic |
|---|---|---|
| EDFA (Erbium Doped Fiber Amplifier) | Uses erbium-doped optical fiber pumped by a laser to amplify signals around the 1550 nm telecom window. EDFAs can be configured as boosters, in-line amplifiers or pre-amplifiers and are widely combined with gain flattening, monitoring and WDM transport functions. | The report page places EDFA above 55% of the market. Installed-base compatibility, mature reliability, multi-channel WDM amplification and long-haul performance protect its leading position. Competitive differentiation is moving toward C+L-band coverage, pump efficiency, compact form factors, lower noise and integrated monitoring rather than basic amplification alone. |
| SOA (Semiconductor Optical Amplifier) | Uses semiconductor gain media in a compact chip or packaged device. SOAs can support amplification, switching and photonic integration, offering small size and potentially attractive integration with transmitters, receivers or photonic circuits. | SOAs are relevant where compactness, fast response and integration are more important than the mature long-haul gain performance of EDFAs. Growth opportunities are strongest in photonic integration, access, switching and specialized interconnects, but thermal behavior, noise and saturation characteristics constrain direct substitution in conventional transport roles. |
| Nonlinear Optical Amplifier | Relies on nonlinear optical effects such as Raman or parametric processes to provide distributed or wavelength-flexible gain. These architectures can extend reach or usable spectrum in systems that need performance beyond conventional amplifier windows. | This is a smaller and more specialized segment. Raman amplification is commercially important in selected long-haul and submarine systems, while other nonlinear techniques remain research intensive. Purchasing is application-specific because pump requirements, complexity, fiber design and noise trade-offs can outweigh the bandwidth advantage in mainstream networks. |
Bandwidth, noise and system-cost logic
Amplifier selection is a system decision rather than a component-only comparison. Network designers evaluate wavelength range, gain, noise figure, output power, spectral flatness, pump efficiency, monitoring, redundancy and the cost of the line system around the amplifier. A higher-priced module can reduce total network cost when it increases fiber capacity, extends span reach, consolidates shelves or lowers power and cooling requirements. That system-level economics is why C+L-band and multi-rail designs can command investment even in a mature EDFA technology base.
Segment Analysis: By Application
By application, the market is segmented into Telecommunication, Data Center, Broadcast/CATV, and Others. Telecommunication remains the largest application, while data-center interconnect is increasing in strategic importance as hyperscale and AI infrastructure create higher traffic between sites and demand more capacity from metro fiber.
| Application | Demand characteristics and commercial trigger |
|---|---|
| Telecommunication | Carrier backbone, metro, submarine, mobile transport and access networks use amplifiers to extend reach and increase wavelength capacity. The report page places telecom above 44% of the market. Upgrades are driven by fiber traffic growth, 5G transport, spectrum expansion and the need to reuse installed fiber assets rather than construct new routes for every capacity increase. |
| Data Center | Data-center interconnect requires high-capacity optical links between buildings, campuses and metro facilities. AI infrastructure increases east-west traffic and creates demand for higher spectral efficiency and lower power per transported bit. Amplifiers become more important as operators scale coherent links across metro and regional distances or seek to pool optical resources across multiple transmission rails. |
| Broadcast/CATV | Cable television and RF-over-fiber distribution use optical amplification to serve many endpoints across hybrid fiber and access networks. The segment is mature in many developed markets, so growth depends more on network upgrades, node redesign and service modernization than greenfield deployment. Reliability, gain stability and cost remain important purchasing criteria. |
| Others | Specialized sensing, research, test, industrial laser and photonic applications use optical amplification across wavelength bands and power levels that may not match mainstream telecom products. These niches can support premium pricing because specifications are application-specific, volumes are lower and buyers often require custom packaging, wavelength coverage or instrumentation-grade stability. |
Additional segmentation dimensions
| End User | Commercial role |
|---|---|
| Telecommunication Service Providers | Operate long-haul, metro, mobile transport and access networks and therefore purchase amplifier-equipped line systems directly or through network equipment vendors. Reliability, remote monitoring, redundancy and lifecycle support are central requirements. |
| Cloud & Data Center Operators | Drive metro and campus interconnect capacity as AI and cloud workloads increase traffic between facilities. Power, rack density, fiber utilization and rapid capacity expansion strongly influence architecture selection. |
| Enterprises & Government | Use amplifiers in private fiber networks, research, defense, utilities and critical infrastructure. Procurement tends to be project-specific and can emphasize security, environmental qualification and long product support. |
| Wavelength Band | Market role |
|---|---|
| C-band (Conventional Band) | The established telecom operating band and the core installed base for EDFA-based DWDM systems. Component availability and network familiarity support continued dominance. |
| L-band (Long Band) | Adds spectrum beyond C-band to increase capacity on existing fiber. C+L systems are strategically important where operators need more bandwidth without adding new fiber routes. |
| Other Bands (S-band, O-band) | Serve specialized access, short-reach and emerging photonic applications. Amplifier technology is less standardized, creating opportunities for semiconductor, rare-earth and specialty-fiber solutions. |
| Function | Network position |
|---|---|
| Booster Amplifier | Raises optical power at the transmitter or line-system output so the signal can enter a long span or passive network with sufficient launch power. |
| In-line Amplifier | Compensates span loss along the route and is a core element of long-haul and metro transport. Density, reliability, monitoring and power efficiency are critical in network-scale deployment. |
| Pre-Amplifier | Improves received signal power before detection, helping extend link reach or support lower received optical levels where receiver sensitivity is the limiting factor. |
Regional Analysis
Asia Pacific is the largest optical amplifiers region, with the report page identifying China at 38% of global revenue. The region combines the world’s largest fiber access base, extensive mobile infrastructure and major optical-component manufacturing clusters. North America is heavily influenced by hyperscale and broadband investment, while Europe is focused on gigabit coverage and network modernization.
Which infrastructure indicators best explain regional optical-amplifier demand?
Optical-amplifier demand follows installed fiber length, DWDM traffic, mobile transport, data-center interconnect and the need to increase capacity on existing routes. China’s official 2025 statistics show 74.99 million km of optical cable, 1.21 billion FTTH/O ports, 31.62 million 10G PON ports and 4.838 million 5G base stations. Those numbers illustrate why Asia Pacific has the deepest volume base for transport and access optics.
| Region | Position | Growth outlook | Demand profile | What decides supplier selection |
|---|---|---|---|---|
| Asia Pacific | Largest | High | Fiber + 5G + manufacturing | Scale, cost, C/L-band capability, local supply |
| North America | High-value | High | AI data centers + broadband | Power density, coherent reach, supply resilience |
| Europe | Mature / upgrading | Steady | Gigabit + 5G + metro modernization | Energy efficiency, interoperability, lifecycle |
| South America | Growing | Moderate | 5G + backbone + submarine connectivity | Landed cost, support, deployment economics |
| Middle East & Africa | Emerging | Uneven | Backbone, mobile, data center, connectivity expansion | Reach, reliability, environmental tolerance |
Competitive Landscape
Competition is concentrated among diversified photonics companies and specialized optical-component suppliers. The leading vendors compete across pump lasers, gain media, amplifier modules, wavelength management, optical monitoring and line-system integration. This vertical breadth is becoming more important as customers seek denser C+L-band and multi-rail platforms rather than standalone amplifier boxes.
Coherent and Lumentum are central to high-performance telecom and data-center optics because they combine semiconductor lasers, photonic components and network-oriented product portfolios. Coherent’s multi-rail work illustrates a move toward pooling pumps, gain equalization and monitoring across multiple transport rails, allowing operators to increase capacity without a linear increase in rack space and power.
Chinese suppliers such as Accelink and Wuxi Taclink participate in a market supported by the world’s largest fiber and mobile infrastructure base. Local manufacturing scale and proximity to equipment vendors can be advantages, particularly for volume telecom deployments. Other specialists compete through high-power amplifiers, test and measurement, research-grade products or wavelength-specific expertise rather than broad carrier portfolios.
Switching costs arise from reliability qualification, gain profiles, noise performance, network-management interfaces and installed system compatibility. An operator does not select an amplifier on gain alone; it must work with transponders, ROADMs, fiber spans, monitoring systems and operational procedures. Suppliers that reduce integration risk can retain share even when nominal component specifications converge.
Key Participants
| Competitive group | Representative participants | Strategic position |
|---|---|---|
| Integrated telecom photonics leaders | Coherent (II-VI), Lumentum | Broad optical component and transport portfolios, advanced pump lasers, semiconductor devices and amplifier technologies for carrier and AI data-center networks. |
| Asia-based telecom component suppliers | Accelink, Wuxi Taclink, O-Net, Beijing Conquer Photonics | Proximity to major network equipment and fiber deployments supports volume supply, while product breadth spans amplifier modules and related optical components. |
| Specialist / instrumentation suppliers | VIAVI, IPG Photonics, Keopsys/Kylia, Nuphoton, Amonics, Inphenix, Bktel, Thorlabs, EMCORE, Cisco | Compete in testing, high-power amplification, research, network systems or specialized wavelength and application niches rather than one uniform product category. |
Companies profiled in the market scope include II-VI Incorporated (Coherent Corp.), Lumentum Holdings, Accelink Technology, Wuxi Taclink Optoelectronics, VIAVI Solutions, Cisco Systems, IPG Photonics, O-Net Technologies, Keopsys (Kylia), Nuphoton Technologies, Amonics, Inphenix, Bktel photonics, Thorlabs, EMCORE and Beijing Conquer Photonics. The competitive set spans component manufacturers, systems companies and specialists, so comparisons should be made by application and product role rather than treating every participant as a direct substitute.
Production Capacity Analysis
Optical-amplifier capacity depends on several specialized manufacturing steps: pump lasers, erbium-doped or specialty fiber, InP semiconductor devices, precision passive optics, electronics, packaging, calibration and burn-in. Capacity constraints can therefore arise upstream even when final module assembly is available, especially as AI infrastructure increases demand for high-power lasers and advanced photonic components.
EDFA production requires qualified gain fiber, pump lasers, wavelength combiners, isolators, monitors, control electronics and reliable optical packaging. The manufacturing challenge is not simply assembling these parts; vendors must deliver stable gain, low noise and long field life across temperature and optical loading. High-reliability telecom qualification makes yield and test capacity important contributors to cost and lead time.
Semiconductor optical amplifiers and related InP devices depend on compound-semiconductor wafer fabrication. Lumentum’s March 2026 plan for a 240,000-square-foot North Carolina facility using 6-inch InP wafers shows the strategic importance of expanding domestic photonics capacity. Although the site is focused broadly on advanced optical devices, additional InP capacity improves the supply base supporting next-generation optical networking.
Vertical integration can reduce supply risk. Coherent’s multi-rail platform draws on proprietary pump lasers, dynamic gain equalizers, optical channel monitors and other photonic building blocks, allowing the supplier to optimize a complete transport subsystem. Smaller amplifier vendors can still compete effectively, but they depend more heavily on stable upstream component supply and may differentiate through application engineering, custom wavelengths or faster product adaptation.
Market Dynamics
The market is moving from a reach-centric model toward a capacity-and-efficiency model. Operators still need amplifiers to overcome fiber loss, but the economic question is increasingly how much usable spectrum and transported traffic can be supported per fiber, per rack unit and per watt. C+L-band expansion, multi-rail resource pooling and AI data-center interconnect are therefore reshaping product roadmaps.
Installed fiber is a scarce asset in dense metro and inter-data-center corridors. Adding amplifiers and wider-band wavelength management can unlock more capacity from existing routes more quickly than constructing new ducts or acquiring new rights of way. This creates a strong system-level value proposition for amplifier upgrades even when the underlying EDFA technology is mature.
Market Drivers
Growth drivers and directional market impact
| Factor | Directional impact | Commercial mechanism |
|---|---|---|
| Fiber and DWDM capacity growth | High | More wavelengths and higher coherent line rates increase the value of efficient amplification and gain equalization. |
| AI data-center interconnect | High | Traffic between facilities raises metro transport demand and rewards dense, low-power amplifier platforms. |
| 5G and broadband expansion | Medium-High | Access and radio growth increase aggregation and backbone traffic that must be transported over fiber. |
| C+L-band modernization | Medium-High | Operators expand usable spectrum on existing fiber instead of building new routes wherever possible. |
Fiber traffic and DWDM capacity growth
Network traffic continues to increase while installed fiber routes are expensive to expand. Dense wavelength-division multiplexing allows operators to place more channels on one fiber, but every added channel must remain within optical power and noise budgets across multiple spans. Amplifier upgrades therefore become a direct method of increasing network capacity, particularly when C+L-band systems can extract more usable spectrum from existing infrastructure.
AI data-center interconnect
Large AI clusters generate traffic between buildings, campuses and metro locations as compute and storage resources are distributed across multiple sites. This creates demand for high-capacity coherent transport with strict power and rack constraints. Amplifier suppliers can capture value by combining higher output power, wider bandwidth, monitoring and resource pooling so capacity grows faster than supporting equipment footprint.
5G and broadband infrastructure
Mobile and fixed access networks ultimately aggregate traffic into metro and backbone fiber. China’s enormous FTTH and 5G installed base, U.S. broadband funding and European gigabit targets all increase the amount of data entering transport networks. The amplifier opportunity is therefore indirect but structural: access expansion creates upstream capacity requirements even when amplifiers are not used at every endpoint.
C+L-band spectrum expansion
Operators can increase fiber capacity by extending beyond conventional C-band into L-band rather than installing new cable. This strategy requires amplifier, gain equalization and monitoring functions across a wider spectrum. Products that manage both bands efficiently can reduce the number of shelves and separate optical subsystems needed, supporting premium pricing when the total cost of capacity is lower.
Market Restraints
Constraints and directional market impact
| Factor | Directional impact | Commercial mechanism |
|---|---|---|
| Price pressure in mature EDFA products | Medium-High | Standardized amplifier functions face procurement pressure as component performance converges. |
| Power and thermal constraints | Medium-High | Higher output power and denser transport can increase pump and cooling requirements if architectures do not improve efficiency. |
| Specialized component dependence | Medium | Pump lasers, gain fiber and InP devices can create upstream bottlenecks and qualification risk. |
| Network qualification cycles | Medium | Carrier systems require extensive reliability and interoperability testing before large-scale deployment. |
Mature-product price pressure
Conventional EDFA modules have a long commercial history, and buyers can compare gain, output power, noise and reliability across multiple qualified suppliers. This creates pricing pressure in standardized configurations. Vendors must therefore move value toward wider bandwidth, integrated monitoring, lower power, denser packaging or network-level functions rather than relying on basic amplification performance to sustain margins.
Power and thermal constraints
Adding capacity by simply stacking more amplifiers, pumps and shelves can increase electrical power and cooling faster than operators can support inside existing facilities. AI data-center interconnect makes this constraint more visible because network power competes with compute for limited site capacity. The restraint favors resource pooling and higher pump efficiency, but it raises engineering complexity and qualification requirements.
Dependence on specialized photonic components
Optical amplifiers use high-quality pump lasers, specialty fiber, isolators, filters, monitors and precision packaging. Semiconductor amplifier designs add dependence on InP wafer fabrication. A shortage or yield issue in one component can limit complete module output, and substitutes may require optical redesign or renewed reliability qualification. Multi-sourcing is therefore important but not always technically straightforward.
Carrier qualification and installed-system compatibility
Telecom operators prioritize field reliability and interoperability because amplifier failure can affect many channels on a network route. New products must work with existing ROADMs, transponders, monitoring and management systems. This lengthens qualification cycles and slows supplier switching even when a competing product offers better specifications, protecting incumbents but delaying adoption of new architectures.
Market Opportunities
Multi-rail optical transport
Pooling pumps, gain equalization, monitoring and management across multiple transmission rails allows transport capacity to scale with less duplication of optical resources. Coherent’s multi-rail developments demonstrate the architectural direction. Suppliers can capture more system value by providing modular amplification, metrology and control as an integrated platform rather than selling independent single-rail amplifier modules.
C+L-band upgrades on installed fiber
Fiber construction is expensive and slow in dense routes. Expanding from C-band into L-band can raise capacity without adding new cable, creating demand for wider-band amplification and channel management. The opportunity extends beyond amplifier gain to filters, pumps, monitoring and network software that maintain flat performance across the enlarged spectrum.
AI data-center interconnect
AI infrastructure is driving rapid growth in optical connectivity at multiple distances. While short-reach transceivers dominate inside facilities, metro and regional links between campuses require transport systems with amplification. Vendors that optimize power, footprint and automation for data-center operators can address a customer group that values faster capacity deployment and high equipment density.
Emerging wavelength and photonic-integration applications
SOAs and nontraditional amplifier bands can grow as silicon photonics, integrated photonics and new access architectures require compact gain outside conventional EDFA roles. The commercial opportunity is smaller than mainstream telecom today but can support high-value designs where integration, switching speed or wavelength coverage creates a performance advantage.
Supply Chain Analysis
Gain media and pump components
Upstream photonic materials and devices determine the performance envelope of the amplifier. Pump laser efficiency affects electrical power and thermal design, while gain fiber composition and length influence noise, output power and wavelength response. In semiconductor amplifiers, InP process capability and packaging are critical. Suppliers that control these technologies can optimize performance and reduce exposure to component shortages.
Amplifier module integration
Module manufacturers must combine optical parts with electronics and firmware while maintaining repeatable gain and reliability over years of field operation. Calibration, burn-in and environmental testing therefore create meaningful production cost. Higher-density multi-rail designs add integration complexity because shared resources must maintain isolation, redundancy and stable control across several optical paths.
Transport system integration
Amplifiers operate inside a larger optical line system with ROADMs, coherent transponders, channel monitors and network management. System vendors determine how much amplifier intelligence is exposed to operators and how automated power balancing becomes. This integration layer can capture significant value because it converts component specifications into route capacity, resiliency and operational simplicity.
Carrier and data-center deployment
Final value is realized when operators can increase route capacity without proportional expansion of fiber, racks or power. Deployment economics include spares, field replacement, remote diagnostics and interoperability with installed equipment. This makes lifecycle service and network-management compatibility important competitive factors alongside optical performance.
Recent Developments
Lumentum: Lumentum announced a new 240,000-square-foot manufacturing facility in Greensboro, North Carolina for advanced InP-based optical devices serving AI data centers. The company said the site will use 6-inch InP wafers and is expected to ramp production in mid-2028, strengthening domestic photonics capacity and supply resilience. Source
Coherent: Coherent enhanced its multi-rail optical transport platform to support four C+L-band transport rails within a single 1RU in-line amplifier card. The architecture pools pump lasers, dynamic gain equalization and optical monitoring resources, targeting higher transport capacity and power efficiency for AI-driven network expansion. Source
Coherent: Coherent introduced a Dynamic Gain Equalizer that combines C and L bands in one module, doubling transmission bandwidth while reducing footprint by 20%. The development illustrates how amplifier competition is moving toward integrated spectrum management and capacity density rather than standalone gain specifications. Source
Report Scope & Segmentation
| Attribute | Scope |
|---|---|
| Report title | Optical Amplifiers Market Size, Share & Industry Analysis, By Type (EDFA (Erbium Doped Fiber Amplifier), SOA (Semiconductor Optical Amplifier), Nonlinear Optical Amplifier), By Application (Telecommunication, Data Center, Broadcast/CATV, Others), By End User (Telecommunication Service Providers, Cloud & Data Center Operators, Enterprises & Government), By Wavelength Band (C-band, L-band, Other Bands), By Function (Booster Amplifier, In-line Amplifier, Pre-Amplifier), and Regional Forecast, 2026-2034 |
| Market size | USD 1,003.5 million in 2025; USD 1,070.1 million estimated for 2026; USD 1,790.0 million projected for 2034; 6.6% CAGR for 2026–2034. |
| By Type | EDFA (Erbium Doped Fiber Amplifier); SOA (Semiconductor Optical Amplifier); Nonlinear Optical Amplifier. |
| By Application | Telecommunication; Data Center; Broadcast/CATV; Others. |
| By End User | Telecommunication Service Providers; Cloud & Data Center Operators; Enterprises & Government. |
| By Wavelength Band | C-band (Conventional Band); L-band (Long Band); Other Bands (S-band, O-band). |
| By Function | Booster Amplifier; In-line Amplifier; Pre-Amplifier. |
| Regions | North America; Europe; Asia Pacific; South America; Middle East & Africa. |
| Companies profiled | II-VI Incorporated (Coherent Corp.); Lumentum Holdings; Accelink Technology; Wuxi Taclink Optoelectronics; VIAVI Solutions; Cisco Systems; IPG Photonics; O-Net Technologies; Keopsys (Kylia); Nuphoton Technologies; Amonics; Inphenix; Bktel photonics; Thorlabs; EMCORE; Beijing Conquer Photonics. |
Frequently Asked Questions
What is the Optical Amplifiers market size in 2025?
The global Optical Amplifiers market is valued at USD 1,003.5 million in 2025 on the rebased 2026–2034 series. The market includes EDFA, SOA and nonlinear amplification technologies used across telecommunications, data centers, broadcast/CATV and specialized photonic applications, with carrier transport remaining the largest established demand base.
What will the Optical Amplifiers market reach by 2034?
The market is projected to reach USD 1,790.0 million by 2034, expanding at a 6.6% compound annual growth rate during 2026–2034. Capacity growth in fiber networks, AI data-center interconnect, 5G transport and C+L-band modernization supports demand, while mature EDFA pricing and carrier qualification cycles moderate the growth rate.
Which region is the largest Optical Amplifiers market?
Asia Pacific is the largest region. The report page identifies China at 38% of global market revenue, and official 2025 infrastructure data show 74.99 million km of optical cable, 1.21 billion FTTH/O ports and 4.838 million 5G base stations in China, creating a very large installed transport and access ecosystem.
Which optical amplifier type leads the market?
EDFA is the leading technology, with the report page placing erbium-doped fiber amplifiers above 55% of the market. Their strength comes from efficient gain around the 1550 nm telecom window, compatibility with wavelength-division multiplexing and a large installed base in long-haul, metro and submarine optical transport systems.
Which application is the largest?
Telecommunication is the largest application and represents more than 44% of the market in the report page’s segmentation. Carrier backbones, metro networks, submarine routes, mobile transport and fiber aggregation use amplification to maintain optical power and support more wavelength channels across long fiber spans.
Why are data centers important to market growth?
AI and cloud infrastructure generate large amounts of traffic between buildings, campuses and metro sites. That traffic requires coherent optical transport beyond short-reach server links. Amplifier platforms that provide wider bandwidth, higher output power, integrated monitoring and lower watts per transported bit help operators expand inter-data-center capacity within fixed rack and power constraints.
What is the role of C+L-band amplification?
C+L-band systems increase the usable optical spectrum on an existing fiber by adding L-band capacity to the conventional C-band. This can raise route capacity without installing new cable, but it requires amplifier gain, equalization and monitoring across the wider spectrum. The strategy is especially attractive on congested long-haul and metro routes.
What are the main market restraints?
Key restraints include price pressure in mature EDFA products, power and thermal limits, dependence on specialized pump lasers and photonic components, and long carrier qualification cycles. A technically superior amplifier may still take time to gain share because operators must verify reliability, interoperability and network-management behavior before large-scale deployment.
Which companies are active in the Optical Amplifiers market?
The profiled company set includes Coherent, Lumentum, Accelink, Wuxi Taclink, VIAVI, Cisco, IPG Photonics, O-Net Technologies, Keopsys, Nuphoton, Amonics, Inphenix, Bktel photonics, Thorlabs, EMCORE and Beijing Conquer Photonics. These companies occupy different positions across telecom modules, systems, instrumentation, high-power and specialty amplification.
Where are the strongest opportunities through 2034?
The strongest opportunities are multi-rail optical transport, C+L-band upgrades, AI data-center interconnect and emerging photonic-integration applications. Suppliers that can pool optical resources, improve pump efficiency and integrate monitoring or wavelength management can capture more value because operators increasingly optimize capacity per fiber, rack unit and watt rather than gain alone.
Research Sources & Evidence Base
View research sources used for this overview.
- Ministry of Industry and Information Technology of China. 2025 Communications Industry Statistical Bulletin, optical cable, FTTH/O, 10G PON, 5G base station and data-center rack statistics.
- National Telecommunications and Information Administration. Broadband Equity, Access, and Deployment (BEAD) Program, USD 42.45 billion U.S. broadband deployment program.
- European Commission. Digital Decade 2026 – 5G Observatory Report, EU 5G household and rural coverage indicators.
- Brazilian National Telecommunications Agency (Anatel). 2025 strategic planning results, Brazil 5G coverage and fixed-broadband performance.
- International Telecommunication Union. Facts and Figures 2025 – Internet use and urban/rural divide, Africa connectivity and urban-rural usage context.
- Lumentum. New U.S. manufacturing facility for advanced lasers, 2026 InP capacity expansion for AI optical infrastructure.
- Coherent. Multi-Rail Transport Platform enhancements, four C+L transport rails in a single 1RU in-line amplifier card.
- Coherent. Next-Generation Multi-Rail Technology, 2025 C+L dynamic gain equalizer and bandwidth-density improvements.
Get Sample Report PDF for Exclusive Insights
Report Sample Includes
- Table of Contents
- List of Tables & Figures
- Charts, Research Methodology, and more...
 Download Sample Report PDF