SEMICONDUCTOR INSIGHT
MARKET RESEARCH REPORT

Super-Junction MOSFET Market

2026 to 2034
MARKET INTELLIGENCE
ACROSS KEY REGIONS
2026 EDITION
POWER ELECTRONICS Semiconductor Market Research

Super-Junction MOSFET Market

◷
UPDATED 23 October 2026
▤
REPORT LENGTH Detailed Report
▣
REPORT CODE 4197080b8811
▯
FORMATS PDF

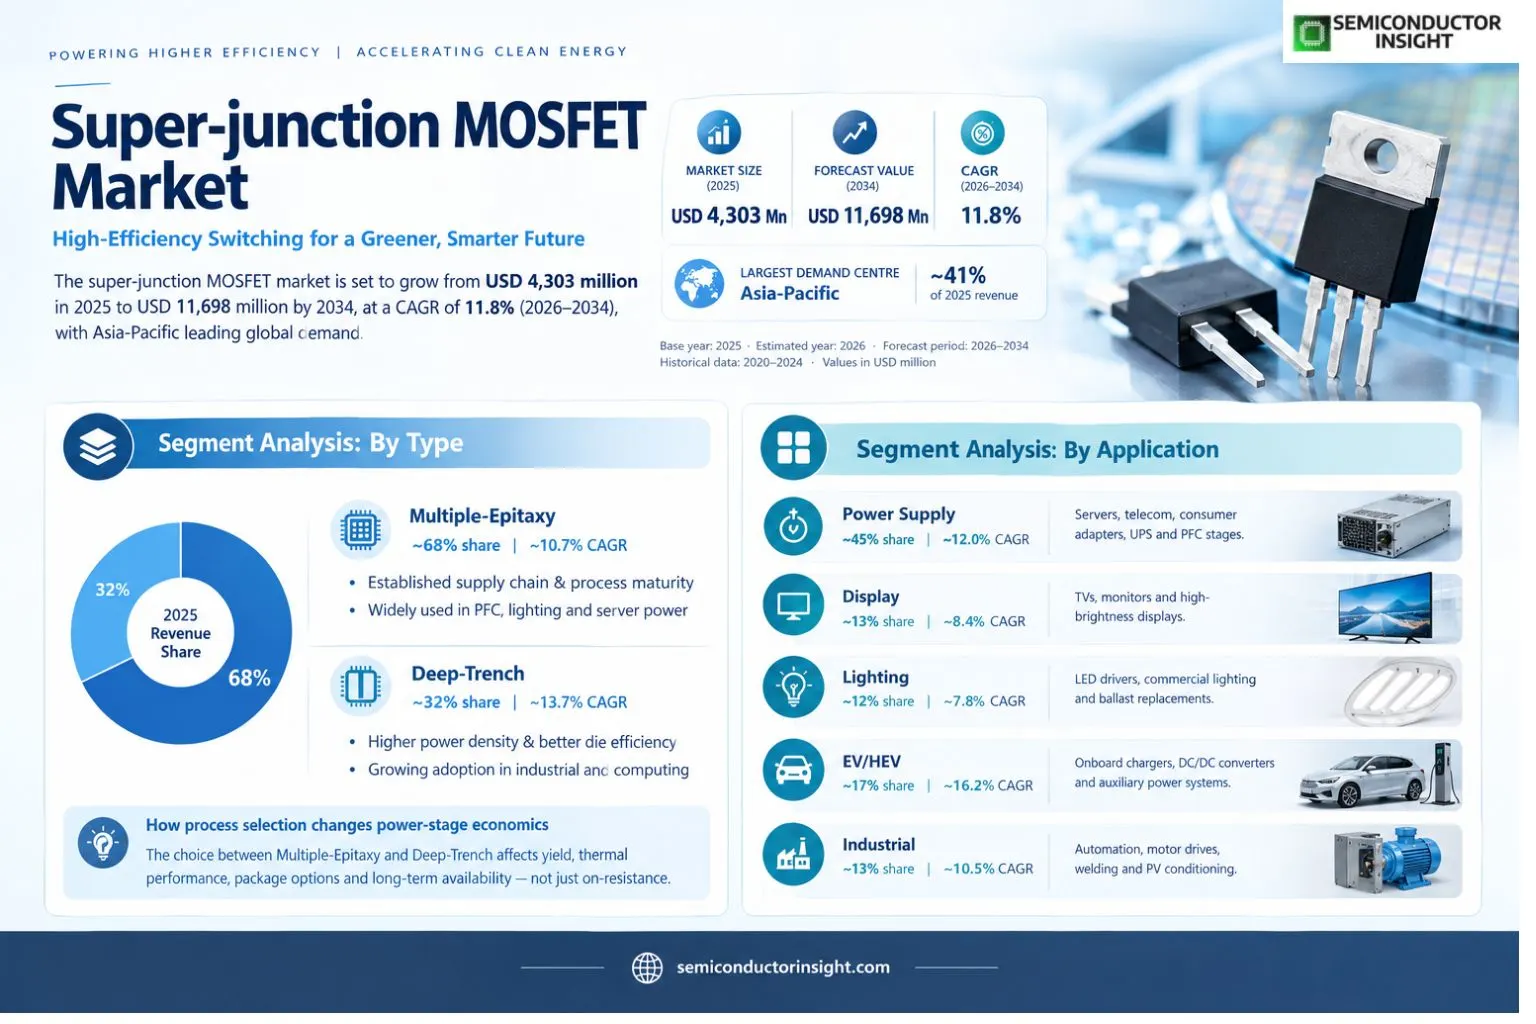
Super-junction MOSFET market reached USD 4,303 million in 2025 and is expected to attain USD 11,698 million by 2034, registering a CAGR of 11.8% from 2026 to 2034. Asia-Pacific represents the largest demand centre with an estimated ~41% of 2025 revenue, supported by high-volume power supply manufacturing, inverter assembly and electronic equipment production in China, Japan, South Korea and Southeast Asia.

Get the sample PDF with study scope, segmentation and methodology details.

Key Statistics

2025 Market Size
USD 4,303 million
2034 Projected Size
USD 11,698 million
CAGR (2026–2034)
11.8%
Largest Market in 2025
Asia-Pacific (~41%)

Key Takeaways

  • Market trajectory:  revenue for high-voltage silicon charge-compensated transistors reached USD 4,303 million in 2025 and is forecast to rise to USD 11,698 million by 2034, representing a 11.8% compound annual growth rate during 2026–2034. Demand is tied to the electrical conversion stage rather than to shipments of finished electronics alone.
  • Multiple-Epitaxy devices retain an estimated ~68% of 2025 value because mature charge-balanced silicon pillars already qualify in server supplies, consumer adapters and industrial converters; Deep-Trench variants hold the remaining ~32% but expand faster at an estimated ~13.7% CAGR as larger wafers and simpler mask flows improve economics.
  • Power Supply applications account for an estimated ~45% of the revenue base and grow around ~12.0% annually, while EV/HEV power electronics contribute an estimated ~17% and advance at a faster ~16.2% CAGR as auxiliary conversion and charging equipment electrify.
  • Asia-Pacific leads with an estimated ~41% share and the fastest regional growth near ~13.3% CAGR; North America follows at ~34%, with substantial exposure to high-efficiency computing, UPS replacement and industrial power conversion.
  • Competitive and technical shifts centre on lower resistance-charge product, fast body-diode recovery, Kelvin-source packaging and cost-efficient 12-inch deep-trench manufacturing; manufacturers must still defend silicon against gallium nitride and silicon carbide in premium designs.

Super-Junction MOSFET Market Overview

Super-junction MOSFET market reached USD 4,303 million in 2025 and is expected to attain USD 11,698 million by 2034, registering a CAGR of 11.8% from 2026 to 2034. Asia-Pacific represents the largest demand centre with an estimated ~41% of 2025 revenue, supported by high-volume power supply manufacturing, inverter assembly and electronic equipment production in China, Japan, South Korea and Southeast Asia.

Base year: 2025 · Estimated year: 2026 · Forecast period: 2026–2034 · Historical data: 2020–2024 · Values in USD million

A super-junction MOSFET is a high-voltage silicon transistor that uses alternating P-type and N-type columns to balance electric charge across the drift region. This structure permits a lower drain-source on-resistance than a conventional planar high-voltage MOSFET at a comparable breakdown voltage, reducing conduction loss in switched-mode power supplies. Buyers compare the resistance-charge figure of merit, output capacitance, reverse-recovery behaviour and thermal packaging rather than simply choosing the device with the lowest catalogue resistance.

The revenue boundary comprises super-junction MOSFET devices sold for Power Supply, Display, Lighting, EV/HEV and Industrial applications, with the two published process types, Multiple-Epitaxy and Deep-Trench, treated as alternative manufacturing approaches. Finished servers, chargers, LED luminaires, electric vehicles, complete inverters, power modules based on other switch technologies and gate-driver integrated circuits are outside this device market. A discrete MOSFET may be packaged for board mounting, but the surrounding system value is not included in transistor revenue.

A typical 600 V or 650 V part operates in the power-factor-correction stage or primary switching bridge, where designers need low switching energy and robust avalanche capability. STMicroelectronics offers 550 V and 650 V MDmesh M5 devices for hard-switched PFC and PWM circuits, while Infineon offers 650 V CoolMOS CFD7 variants with fast body diodes for resonant power conversion. The coexistence of these product families demonstrates that no single switching topology dictates the entire product mix.

Equipment makers now request higher power density from the same mechanical envelope. Kelvin-source terminals isolate the gate return from load current, improving switching stability when high di/dt would otherwise cause unwanted gate voltage excursions. Toshiba introduced a 600 V DTMOSVI device in a compact DFN8x8 package during November 2025, while Magnachip added 650 V TOLL devices with Kelvin-source construction for display adapters and other premium consumer electronics. Packaging choices can determine the winning design even when silicon die specifications are close.

Demand also has a replacement component. Power supplies, industrial motor controls and lighting ballasts remain in service for years, and maintenance teams prefer pin-compatible parts that preserve thermal margins and electromagnetic compliance. At the same time, new data-centre power architectures are moving toward higher efficiency, and electrified transport expands charger and auxiliary-converter sockets. This combination of long-life replacement demand and new design wins supports silicon super-junction products while creating pressure to lower manufacturing cost per ampere.

Segment Analysis: By Type

By fabrication type, the global super-junction MOSFET market comprises Multiple-Epitaxy and Deep-Trench technologies. Multiple-Epitaxy leads with an estimated ~68% share in 2025, reflecting a broad installed qualification base and established charge-balance processing, whereas Deep-Trench accounts for ~32% and is projected to grow at about ~13.7% annually as equipment manufacturers seek tighter cell pitch, larger wafers and improved die-area efficiency.

Type Device architecture and engineering use Market position
Multiple-Epitaxy Repeated epitaxial deposition and selective doping build alternating charge-balanced pillars within the drift region. Process maturity makes the architecture familiar to automotive and industrial qualification teams, which helps designers compare 600 V and 650 V parts against previously approved footprints. Device selection remains dependent on gate charge, capacitance and diode recovery rather than a nominal breakdown-voltage rating alone. Largest type at ~68% of 2025 revenue; modeled ~10.7% CAGR. Established supply chains favour this class in power-factor-correction stages, lighting drivers and server AC/DC conversion. Its growth is more moderate than trench alternatives because mature platforms face pricing pressure and design teams increasingly demand higher switching frequency. Nonetheless, repeatability, second-source availability and qualification history preserve a significant commercial advantage in long-lived equipment.
Deep-Trench Deep etched structures form the complementary charge columns through trench processing rather than numerous epitaxial growth steps. ST described its first STMESH deep-trench 600 V transistor as using a 12-inch wafer and fewer masks than the prior approach, highlighting the potential for shorter process flows. The architecture can reduce silicon area and support high-current packages when etch depth and charge balance are tightly controlled. Fastest-growing type at ~32% share and ~13.7% CAGR. Deep-trench adoption benefits from cost-per-die gains, compact package demand and improved high-voltage silicon performance in industrial and computing supplies. Yield at deep features, charge-balance precision and qualification across temperature remain challenges. Early volume programs therefore concentrate where higher power density offsets the expense of validating a new process and associated electromagnetic behaviour.

How process selection changes power-stage economics

The two architectures address the same functional requirement but have different manufacturing trade-offs. Multiple-Epitaxy platforms rely on repeatable deposition and doping steps with a substantial field history, while Deep-Trench technology concentrates process complexity in etch, fill and charge control. A purchasing team evaluating a 600 V PFC switch will therefore consider production yield, package thermal resistance and long-term availability alongside switching losses. The estimated ~68% versus ~32% split captures this commercial maturity gap rather than an absolute physical performance ranking.

A process migration is rarely a direct transistor substitution. Differences in output capacitance, gate threshold, body-diode charge and switching slew rate can alter transformer loss and electromagnetic interference. Engineers must recheck snubbers, dead time, heat sinks and board parasitics before qualifying a new die. This qualification burden explains why older silicon platforms remain attractive even when a deep-trench design offers a stronger resistance-area figure of merit and lower mask count.

Segment Analysis: By Application

By application, demand is allocated among Power Supply, Display, Lighting, EV/HEV and Industrial systems. Power Supply is the largest end use at an estimated ~45% of 2025 revenue; EV/HEV grows most rapidly at ~16.2% CAGR from an estimated ~17% base, while Display (~13%), Lighting (~12%) and Industrial (~13%) serve distinct converter topologies and replacement cycles.

Application Demand characteristics
Power Supply Leading application, estimated ~45% share and ~12.0% CAGR. High-voltage MOSFETs populate active PFC, LLC resonant and flyback stages in servers, telecom rectifiers, consumer adapters and UPS electronics. The IEA expects global data-centre electricity demand to more than double by 2030, creating incentives to reduce losses at each AC/DC conversion step. Device suppliers compete on switching efficiency, thermal management and packaging compatibility with automated assembly.
Display Estimated ~13% share, ~8.4% CAGR. Large televisions, gaming monitors and professional displays need compact primary-side power supplies with stable efficiency across standby and high-brightness modes. Magnachip introduced 650 V Kelvin-source TOLL super-junction MOSFETs for premium display power during October 2025, showing that package footprint and reduced gate ringing can outweigh the need for a headline increase in output wattage. Mature consumer volumes temper revenue growth.
Lighting Estimated ~12% share, ~7.8% CAGR. LED drivers, commercial lighting supplies and legacy high-intensity-discharge ballast replacements demand high-voltage switches with low standby losses and predictable switching behaviour. Vishay identifies lighting ballasts among the use cases for its 650 V E Series. Longer LED fixture life reduces replacement frequency, and integrated low-power controllers compete with discrete transistor solutions in small drivers, constraining value growth despite continued efficiency upgrades.
EV/HEV Estimated ~17% share, fastest application growth at ~16.2% CAGR. Onboard chargers, DC/DC converters, charging-station auxiliary supplies and vehicle support electronics provide silicon super-junction sockets. The IEA recorded electric-car sales above 20 million in 2025, but not every vehicle power stage uses these devices: traction inverters increasingly adopt SiC and other switch technologies. Silicon remains particularly competitive in cost-sensitive charger and auxiliary architectures with proven qualification.
Industrial Estimated ~13% share and ~10.5% CAGR. Factory automation, welding power supplies, industrial motor drives and photovoltaic conditioning equipment require rugged switching devices across wide operating temperatures. Customers value long product availability and tolerance to transient stress, making qualification and package robustness important purchasing criteria. Industrial demand can be cyclical with capital expenditure, while maintenance of installed converters supports a steadier replacement market independent of new factory construction.

Application mix also determines channel economics. Consumer power supply manufacturers buy large volumes through contract assembly and negotiate aggressively on unit price; automotive buyers require documented reliability and longer production support; industrial integrators often buy smaller lots with stronger demand for second sources. Consequently, a nominally identical 650 V MOSFET may face different testing, traceability and commercial terms depending on the destination product, limiting the usefulness of a single average selling price across applications.
 Super-Junction MOSFET Market Size & Growth Outlook 2035

Regional Analysis

Asia-Pacific leads global super-junction MOSFET demand at an estimated ~41% of 2025 revenue and ~13.3% annual growth, followed by North America at ~34% and Europe at ~18%. South America represents ~4% and the Middle East & Africa ~3%. The shares reflect the concentration of power-supply manufacturing, the United States demand calibration and differing rates of equipment electrification, rather than the regional location of every silicon fabrication step.

Why does super-junction MOSFET demand vary by region?

The regional comparison separates equipment demand from semiconductor fabrication. Asia-Pacific has a dense network of adapter, display, inverter and automotive-electronics assemblers; North America contains large computing and industrial end markets; Europe emphasizes efficient industrial equipment and vehicle charging. South America and the Middle East & Africa depend more heavily on imported finished power equipment, so their transistor demand is often embedded in converter shipments rather than purchased by domestic design teams. These distinctions affect channel strategy, device qualification and the ability to support customers with local applications engineers.

Region Position Growth outlook Demand profile What decides supplier selection
Asia-Pacific Largest (~41%) Fastest (~13.3% CAGR) Electronics assembly and charger output Local design support, cost, factory scale and process yields
North America Second (~34%) Strong (~11.0% CAGR) AI servers, UPS and industrial power Reliability data, lead times and package efficiency
Europe Third (~18%) Established (~10.1% CAGR) Industrial drives and efficiency rules Documentation, thermal behaviour and second sources
South America Smaller (~4%) Developing (~9.2% CAGR) Imported converters and energy projects Distribution inventory and landed system cost
Middle East & Africa Emerging (~3%) Selective (~9.8% CAGR) UPS, telecom and solar balance of system Environmental robustness and project qualification

Asia-Pacific LARGEST · ~41% SHARE · FASTEST-GROWING

Why is Asia-Pacific the largest market for super-junction MOSFETs?

Asia-Pacific captures an estimated ~41% of 2025 revenue and expands at roughly ~13.3% CAGR because the region combines a large share of finished power supply manufacturing with substantial demand for charging, displays and industrial electronics. China dominates assembly scale, Japan contributes high-performance device technology, and South Korea and Southeast Asia host important electronics production. Device sourcing is influenced by local engineering support, price competitiveness and the ability to deliver stable performance across many converter designs.

Market positionLargest (~41%)
Growth outlookFastest (~13.3% CAGR)
Demand profileManufacturing-scale led
Market access gateCost and qualification
Country Position in region What drives demand
China Largest manufacturing base China combines export-oriented adapters, display power boards, telecom rectifiers and industrial inverter production, so many transistor design decisions are made close to contract manufacturers. Suppliers compete for 600 V and 650 V sockets using low gate charge, robust diode behaviour and surface-mount footprints. Domestic competition compresses prices, but frequent redesigns for higher efficiency create opportunities for differentiated packages and charge-balance structures.
Japan Technology-intensive Japanese demand is shaped by industrial automation, power conditioners, consumer electronics and established device manufacturers. Toshiba introduced DTMOSVI 600 V products with a 0.047 ohm typical resistance in November 2025, while subsequent diode-recovery variants targeted compact supplies. Customers often prioritize thermal design margins and component continuity over the lowest immediate price, making supplier documentation and reliable process control important selection factors.
South Korea and Southeast Asia Regional assembly network South Korea supports display and semiconductor equipment power supplies, while Vietnam, Thailand and Malaysia host electronics assembly and manufacturing services. The growing geographical spread of assembly does not mean that every country fabricates super-junction silicon locally; imported dies and packaged devices remain important. Engineers assess customs lead times, traceability and multi-site qualification when a product platform is transferred from one manufacturing location to another.

Market instances

  • Toshiba moved DTMOSVI into compact DFN packaging. The company announced the 600 V TK057V60Z on 27 November 2025 with 0.047 ohm typical on-resistance and a Kelvin-source connection in DFN8x8. The significance for Asia-Pacific assemblers is a route to smaller power stages without immediately abandoning established silicon. Customers still need to validate board parasitics, switching transitions and heat removal before adopting a new package in production.
  • ROHM expanded the surface-mount super-junction selection. On 9 July 2026 ROHM introduced R60xxXNx and PrestoMOS R60xxWNx families in DFN8080 and TOLL formats, including options intended for AI-server and industrial supplies. The release adds competitive pressure on traditional through-hole packages and makes second sourcing easier for compatible footprints. Its impact is strongest where Japanese device specifications are adopted by electronics factories elsewhere in Asia.
  • Magnachip targeted high-current consumer converter boards. Magnachip announced 650 V super-junction MOSFETs in Kelvin-source TOLL packages on 29 October 2025 for gaming monitors, premium televisions and laptop adapters. The design reduces common-source inductance effects during rapid switching, a meaningful advantage for thin consumer products with limited heat-sink space. This development supports a regional move toward power-dense, surface-mount conversion without implying that display unit sales directly equal transistor revenue.
In the full report: country-level demand and supplier participation for China, Japan, South Korea, India, Taiwan and Southeast Asia, with the two fabrication types and five equipment applications tracked separately.

North America SECOND LARGEST · ~34% SHARE

What makes North American super-junction demand distinctive?

North America accounts for an estimated ~34% of 2025 revenue, growing near ~11.0% CAGR. The United States forms the principal demand anchor, with the publisher reporting USD 1.15 billion for 2024, which is calibrated within the regional share model. Server power, UPS systems, industrial automation and charging infrastructure create diverse high-voltage switch requirements. Engineers focus on efficiency at partial load, fast availability of qualified replacements and reliable thermal operation in equipment designed for long service lives.

Market positionSecond (~34%)
Growth outlookStrong (~11.0% CAGR)
Demand profileServer and UPS led
Market access gateQualification and supply
Country Position in region What drives demand
United States Largest demand centre The United States contains hyperscale computing installations, telecom power systems, industrial plants and charging infrastructure that use many classes of high-voltage converters. Schneider Electric announced a USD 373 million supply capacity agreement with Digital Realty in November 2025 for UPS, switchgear and prefabricated electrical equipment. That contract concerns systems, not MOSFET sales, but illustrates the expanding installed base in which efficient power stages matter.
Canada Industrial and infrastructure Canadian demand is distributed across data-centre electrical infrastructure, industrial equipment and charging facilities, with procurement often coordinated by North American equipment manufacturers. High seasonal temperature variation and long service expectations favour devices with clear thermal derating and documented switching ruggedness. Imported power boards and completed rectifiers account for part of the embedded component demand, while domestic engineering groups influence specifications for local projects.
Mexico Manufacturing-linked Mexico is a manufacturing base for electronics, automotive subsystems and industrial power equipment sold across North America. Super-junction MOSFET purchases may be placed through multinational contract manufacturers rather than local device makers, making supply-chain traceability and qualified alternative packages particularly important. New automotive electronics programs support charger and auxiliary power conversion, although the final choice between silicon, GaN and SiC depends on system voltage, power and cost.

Market instances

  • A major US data-centre power procurement highlighted conversion demand. Schneider Electric and Digital Realty disclosed a USD 373 million supply capacity agreement on 19 November 2025 covering UPS, low-voltage switchgear and prefabricated skids. The order is not a measure of transistor sales. It instead indicates the scale of electrical infrastructure procurement, where losses in rectifiers, standby power and auxiliary supplies can influence equipment lifetime costs and component specifications.
  • Vishay refreshed its 650 V E Series in Pennsylvania. On 26 March 2025 Vishay announced the SiHK050N65E with a 48.2% reduction in on-resistance compared with a previous generation, targeting power conversion in computing, telecom and industrial systems. The announcement demonstrates the value of incremental silicon improvements where customers prefer familiar circuit topologies. North American designers can trade lower conduction losses against package and gate-drive compatibility during design-in.
  • onsemi retained Fairchild technology under a single corporate owner. The company history records the acquisition of Fairchild Semiconductor on 19 September 2016, making Fairchild a historical brand rather than an independent competitor today. onsemi SUPERFET III automotive-qualified 650 V parts show the continuing role of charge-balanced silicon in onboard charging. Supplier lists must therefore count current ownership correctly while acknowledging the installed designs that still reference legacy Fairchild part numbers.
In the full report: market demand and product selection by the United States, Canada and Mexico, including server power conversion, automotive auxiliaries, lighting systems and industrial equipment design activity.

Europe THIRD LARGEST · ~18% SHARE

How do European efficiency policies influence super-junction MOSFET adoption?

Europe contributes an estimated ~18% of 2025 revenue and is projected to advance at about ~10.1% CAGR. Demand is rooted in industrial drives, high-efficiency adapters, solar conditioning and transport-related power electronics. The European Commission regulates active and no-load efficiency of external power supplies, giving designers a reason to evaluate lower-loss switching devices. Regional suppliers compete on qualification evidence, availability of pin-compatible parts and the ability to demonstrate energy savings in the complete converter rather than in an isolated transistor.

Market positionThird (~18%)
Growth outlookSteady (~10.1% CAGR)
Demand profileEfficiency and industry
Market access gateCompliance and lifetime
Country Position in region What drives demand
Germany Industrial engineering Germany combines automation equipment, industrial power supplies, energy conversion and automotive electronics. Infineon develops high-voltage CoolMOS families used in server and industrial systems, and its 600 V CoolMOS 8 deployment with LITEON in April 2025 demonstrated a commercial server application. Design teams often benchmark power loss over multiple operating points, since a device that excels at rated current may behave differently under standby or light-load conditions.
France and Italy Power conversion engineering French and Italian equipment makers support industrial automation, energy management, professional lighting and transport systems. STMicroelectronics offers MDmesh high-voltage MOSFET families covering hard-switching and resonant topologies, giving European customers a broad choice of charge-balanced silicon. Selection depends on body-diode recovery, capacitance and thermal package rather than national demand totals alone; many finished assemblies are sourced through cross-border European and Asian suppliers.
United Kingdom and Nordics Infrastructure and specialist use The United Kingdom and Nordic countries have requirements in industrial controls, UPS, renewable integration and specialist electrical equipment. Lower ambient temperatures can reduce some thermal stresses but do not eliminate junction-temperature constraints at full load. Buyers commonly require documentation for reliability, electromagnetic compatibility and component longevity, especially where repairs involve replacing a switch in an installed converter instead of redesigning the whole power stage.

Market instances

  • The EU updated its external power supply efficiency framework. The European Commission adopted Regulation 2025/2052 in October 2025, with future application dates for revised external supply requirements. The policy addresses active conversion efficiency and no-load consumption rather than prescribing a specific transistor chemistry. Its significance is that device makers can win sockets through measured system efficiency gains, provided that the finished adapter also satisfies safety and interoperability obligations.
  • Infineon disclosed a server customer using CoolMOS 8. On 30 April 2025 Infineon said LITEON had adopted its 600 V CoolMOS 8 silicon super-junction family for server power designs, citing an 18% lower gate charge versus earlier MOSFET models and improved thermal performance. The announcement links European device development with international computing power demand. It does not establish a market-wide supplier share, but supports the importance of efficiency-driven design wins.
  • ST detailed the economics of deep-trench processing. On 18 February 2025 ST described the 600 V STWA60N028T as its first 12-inch deep-trench STMESH device, with a 28 milliohm resistance and fewer mask layers than its earlier approach. The process shift matters because wafer area and manufacturing cycle time influence silicon cost. Its broader commercial significance depends on qualification yield and the ability to maintain charge balance at volume.
In the full report: European country coverage for Germany, France, Italy, the United Kingdom, Benelux and Nordic markets, with efficiency regulation, industrial power and supplier qualification treated as separate demand mechanisms.

South America DEVELOPING · ~4% SHARE

What drives South American purchases of super-junction MOSFET devices?

South America holds an estimated ~4% of global 2025 revenue with a modeled ~9.2% CAGR. Demand is linked to imported power supplies, industrial maintenance, lighting replacements, solar equipment and charging infrastructure, with Brazil the main market. Many switches reach users already fitted to complete boards, so local component procurement is smaller than the value of all power equipment installed. Distributor stock, exchange rates and access to qualified replacement devices shape purchasing decisions.

Market positionSmaller (~4%)
Growth outlookDeveloping (~9.2% CAGR)
Demand profileImported equipment led
Market access gateLanded cost and stock
Country Position in region What drives demand
Brazil Largest regional buyer Brazil purchases industrial drives, telecom supplies, charging equipment and solar conversion hardware through a mix of local assemblers and imported systems. Electric vehicle adoption provides an adjacent signal: the IEA reported strong Latin American growth in 2025, but those vehicle figures cannot be treated as transistor shipments. Local engineering teams emphasize parts that can be sourced reliably for repair, and high-voltage devices often enter through authorized distribution channels.
Argentina Industrial replacement Argentina has an installed base of industrial motors, electronic controls and backup power systems that generates replacement demand for high-voltage MOSFETs. Import costs and currency movements can delay new equipment investment, making repairs of existing converters relatively important. Engineers may prefer a qualified 600 V through-hole device over a new surface-mount variant when board redesign would create disproportionate expense or introduce untested switching noise.
Chile and Colombia Project-oriented demand Chile and Colombia offer applications in renewable energy balance-of-system equipment, telecom infrastructure and industrial electrical systems. Component orders often follow individual projects rather than sustained high-volume consumer electronics manufacturing. Designers compare switching efficiency with availability, operating temperature and serviceability, while import logistics can make an established part more attractive than a newer device with marginally better electrical characteristics but uncertain delivery.

Market instances

  • Electric vehicle sales strengthened the regional demand backdrop. The IEA Global Energy Review 2026 described close to 350,000 electric cars sold across Latin America and the Caribbean in 2025, with Brazil and Mexico contributing important growth. This is adjacent evidence for chargers and auxiliary electronics, not a measure of super-junction MOSFET revenue. It suggests opportunities for device distributors supplying charging infrastructure where silicon remains economical for supporting conversion stages.
  • Industrial maintenance favours familiar voltage classes. A 600 V or 650 V MOSFET removed from a failed industrial converter must be replaced with a device compatible with gate-drive timing, package thermal resistance and transient stress. That engineering constraint can support continued sales of established Multiple-Epitaxy designs despite newer trench alternatives. In South American service markets, availability of documented substitutes is often more important than the smallest possible die area.
  • Solar and backup systems create intermittent procurement waves. Photovoltaic conditioners and UPS equipment require efficient auxiliary power supplies and switching stages, but their bill of materials differs from a full traction inverter. Orders may therefore arrive in batches tied to project construction and replacement cycles rather than smoothly each quarter. Device manufacturers serving the region benefit from stocking 650 V products in several packages and providing reference designs to distributors.
In the full report: regional country analysis of Brazil, Argentina, Chile, Colombia and neighbouring markets, with imported equipment, industrial service channels, EV charging and solar-related conversion tracked by application.

Middle East & Africa EMERGING · ~3% SHARE

Which electrical systems support super-junction MOSFET demand in the Middle East and Africa?

The Middle East & Africa region represents an estimated ~3% of 2025 revenue and a projected ~9.8% CAGR. The market is driven by telecom rectifiers, uninterruptible power, industrial electronics, commercial lighting and auxiliary converters in solar projects. Large infrastructure investments do not translate directly into device sales because most converter assemblies are imported. Buyers focus on reliable operation under elevated ambient temperatures, maintenance availability and stable sourcing for equipment deployed at remote sites.

Market positionEmerging (~3%)
Growth outlookSelective (~9.8% CAGR)
Demand profileUPS and telecom led
Market access gateThermal robustness
Country Position in region What drives demand
Saudi Arabia and UAE Infrastructure purchasers Saudi Arabia and the United Arab Emirates procure data-centre electrical systems, telecom equipment and industrial power supplies for large infrastructure projects. Super-junction MOSFET demand is concentrated in supporting conversion circuits and installed electronics rather than in all high-power equipment. Ambient heat and dust make enclosure cooling and component derating important, so customers assess thermal performance and surge tolerance before selecting a lower-cost alternative.
South Africa Backup power and industry South Africa has demand from industrial motor controls, backup electricity equipment and commercial electronics, with repair and replacement significant in the channel mix. A 650 V MOSFET may be used in the AC/DC front end of a backup system even when the main inverter uses different switches. Distributor availability and field support determine whether a component can be adopted broadly across maintenance networks.
Egypt and Morocco Manufacturing and energy Egypt and Morocco have expanding industrial and electrical infrastructure activity alongside imported consumer electronics. Local manufacturers and service businesses buy high-voltage silicon devices for power supplies, lighting controls and auxiliary converters, although the largest wafer fabrication and package assembly bases remain elsewhere. Price sensitivity favours mature Multiple-Epitaxy parts, while more demanding applications justify better thermal packages and lower switching losses.

Market instances

  • Data-centre energy growth increases attention to conversion losses. The IEA Energy and AI assessment expects global data-centre electricity use to reach roughly 945 TWh in 2030, but the distribution of that demand is uneven. New facilities in Gulf countries create a reason to specify efficient UPS and auxiliary conversion equipment. The data-centre electricity figure is an energy-system forecast, not a transistor market estimate or regional MOSFET sales number.
  • Harsh operating environments affect device qualification. Power converters installed near desert industrial facilities face high ambient temperatures and frequent thermal cycling. A transistor that meets its 650 V voltage rating may still fail a design review if package resistance and switching losses produce excessive junction temperatures. This pushes procurement toward tested thermal models, conservative derating and long-lived replacement parts rather than selecting purely on nominal current capability.
  • Imported power boards shape the local component channel. Many telecom rectifiers, LED supplies and industrial controllers arrive as completed assemblies, so local demand for individual super-junction MOSFETs is concentrated in service depots and limited electronics production. Suppliers can expand access by offering equivalent packages and published application notes, but changes in global equipment sourcing may shift where the component is purchased without changing the ultimate region of use.
In the full report: country-level opportunities across Saudi Arabia, the UAE, South Africa, Egypt, Morocco and other markets, with telecom power, backup systems, industrial applications and environmental qualification analyzed separately.

Key Super-Junction MOSFET Manufacturers and Competitive Landscape

The competitive field combines integrated semiconductor manufacturers with specialized high-voltage device portfolios. Infineon, STMicroelectronics, Toshiba, onsemi and Vishay form the verified publisher company set; Fairchild Semiconductor belongs to onsemi following its 2016 acquisition. ROHM and Magnachip provide additional evidence of active technology competition. Commercial strength depends on manufacturing scale, device reliability, package selection and customer qualification rather than a single universal market-share ranking.

Infineon competes through broad CoolMOS voltage classes, application-specific body-diode options and packaging innovations. Its CoolMOS 8 collaboration with LITEON shows the importance of supplier engineering support for server designs, where gate charge, thermal performance and output capacitance must work together. A broad product family helps customers maintain similar gate-drive approaches across different power ratings, but individual design wins are determined by the converter topology and the measured efficiency profile.

STMicroelectronics positions MDmesh and STMESH products across hard-switched, resonant and automotive-related power circuits. The company’s 12-inch deep-trench process adds a manufacturing cost dimension to its performance claims, while DM9 and M5 devices address different recovery and capacitance requirements. Its customers need detailed simulation models and package options, since a nominally low-resistance switch can cause excessive electromagnetic interference if the gate drive is not matched to the actual power board.

Toshiba competes through DTMOS process improvements and compact surface-mount packages. The 2026 high-speed-diode additions targeted bridge and inverter circuits in which reverse recovery affects both switching loss and system reliability. Vishay’s 650 V E Series emphasizes resistance-charge performance and applications spanning telecom, computing and industrial conversion. These product positions overlap, but their electrical characteristics and manufacturing supply arrangements are not interchangeable without qualification.

onsemi supplies SUPERFET III devices with automotive-qualified variants and fast-recovery diode designs. Fairchild Semiconductor remains relevant to historical product catalogues but should not be counted as a separate current manufacturer. Competitive pressure is also rising from alternative switch materials: onsemi announced a 650 V GaN development collaboration with GlobalFoundries in December 2025, demonstrating how suppliers are broadening portfolios while silicon super-junction devices retain established cost and qualification advantages.

Tier structure

Tier Companies Basis of competition
Tier 1 Infineon Technologies; STMicroelectronics; Toshiba; onsemi Broad high-voltage device families, substantial manufacturing and qualification resources, multiple package options and dedicated applications support underpin this group. Each company offers silicon charge-balanced products with different optimization priorities, and their customer bases extend from computing power supplies to industrial or automotive conversion. Tier placement reflects technical breadth and market access, not a measured revenue-share league table.
Tier 2 Vishay Intertechnology; ROHM These suppliers offer differentiated high-voltage silicon choices that challenge incumbent sockets through resistance-charge improvements, thermal packaging and familiar replacement footprints. Vishay’s 650 V E Series serves higher-power conversion, while ROHM’s PrestoMOS designs emphasize body-diode recovery. Device availability, technical documentation and application fit are more informative for purchasing decisions than an unsupported estimate of supplier market percentage.
Specialized and emerging Magnachip Semiconductor; regional device distributors and contract assemblers Specialized suppliers target high-volume consumer power boards or defined converter niches, often competing with compact TOLL or DFN packages and attractive unit economics. Magnachip’s Kelvin-source 650 V launches illustrate this route. Distributors and assembly partners shape access to local customers but are not automatically manufacturers of the semiconductor die; the distinction matters when mapping the competitive value chain.

Key companies profiled

  • onsemi (Fairchild Semiconductor legacy)
  • Infineon Technologies AG
  • STMicroelectronics N.V.
  • Toshiba Electronic Devices & Storage Corporation
  • Vishay Intertechnology, Inc.

Super-Junction MOSFET Production Capacity Analysis

Production economics depend on silicon wafer diameter, deep-etch or epitaxial process control, wafer yield, backend package assembly and final electrical testing. Unlike finished power supplies, semiconductor capacity is not measured in watts of equipment output. Suppliers may fabricate dies in one country and assemble packages in another, so the geographic location of end-user demand should not be mistaken for the location of all transistor manufacturing operations.

Deep-trench manufacturing changes the cost structure of high-voltage charge-balanced silicon. Wafer-diameter scaling and process simplification can improve manufacturing economics when trench etch uniformity, cell pitch and high-voltage test yield are maintained across the production line. A larger wafer can deliver more potential die sites, but actual output depends on defect density, trench fill, charge balance and final test yield. A technology announcement alone therefore does not quantify sellable device capacity.

Multiple-Epitaxy devices continue to benefit from installed equipment, stable process recipes and qualified backend flows. The cost advantage is particularly valuable in price-sensitive adapters, lighting drivers and industrial replacements. However, maintaining a high-voltage rating while reducing on-resistance requires tight dopant control, and the testing burden increases when customers demand fast diode recovery and strong avalanche robustness. Manufacturing decisions balance process cost with the cost of device failures in the field.

Backend packaging is becoming a stronger source of differentiation. Toshiba’s DFN8x8 600 V device, Magnachip’s TOLL 650 V products and Infineon’s surface-mount CoolMOS portfolio show how a smaller footprint and improved source connection can unlock design wins without changing the equipment power rating. Package thermal resistance, solder reliability and lead-frame geometry influence practical performance. Capacity constraints can therefore arise in specialized packaging or qualification lines even when bare silicon wafer supply is adequate.

Super-Junction MOSFET Market Dynamics: Drivers, Restraints and Opportunities

The main growth forces are more efficient server power conversion, expansion of charging and auxiliary electronics, process advances in charge-balanced silicon and stricter equipment efficiency expectations. The principal counterweights are silicon price competition, substitution by wide-bandgap switches in demanding applications, qualification expense and industrial demand cycles. The modeled contribution table separates these influences by their effect on the 2026–2034 compound growth rate, with stronger near-term support from computing and electrification.

MARKET DRIVERS

Drivers Impact Analysis*

Market Drivers Impact Rank CAGR Contribution (%) 2026–2028 2029–2031 2032–2034
Server and telecom power supply efficiency High +4.80% High High Medium
EV charging and auxiliary conversion High +3.70% High High High
Deep-trench yield and package advances Medium-High +3.20% Medium High High
Industrial replacement and inverter upgrades Medium +2.40% Medium High Medium
Others (lighting and regulation) Low +1.70% Medium Medium Low

AI computing raises the value of every watt saved

Data centres install multiple conversion stages between grid supply and semiconductor loads, making conduction and switching losses a recurring operating expense. The IEA expects global data-centre electricity use to rise to about 945 TWh by 2030, a context that supports high-efficiency power-supply investment. Silicon super-junction MOSFETs compete for primary AC/DC and PFC positions, where their cost and established reliability can be compelling even when downstream stages use other transistor technologies.

Vehicle charging adds diversified converter sockets

Electrification increases demand for onboard chargers, charging-station auxiliary supplies and high-voltage DC/DC conversion. The IEA projected 23 million electric-car sales in 2026 after a record 2025, but these vehicle counts do not measure silicon transistor shipments. Designers choose a super-junction MOSFET when the switching frequency, voltage and thermal requirements suit silicon, while high-power traction conversion increasingly uses other materials. The opportunity therefore comes from a defined subset of the electrical architecture.

Process innovation improves power density without changing material

Manufacturing improvements can extend the competitiveness of silicon against more expensive alternatives. ST’s deep-trench work illustrates how fewer mask layers and larger wafer processing can lower cost per functional switch, while new package designs reduce source inductance and improve heat flow. Such gains support thinner power supplies and higher operating frequency. The benefit is not automatic: customer adoption requires new simulation, thermal testing and electromagnetic compatibility work.

Installed industrial systems sustain replacement purchasing

Factories, solar power conditioners and telecom power systems operate over long service periods, creating an ongoing requirement for compatible high-voltage switching devices. Maintenance organizations value documented pinouts, avalanche ruggedness and consistent sourcing, even when a newer transistor offers superior laboratory performance. This installed-base effect softens demand volatility and helps suppliers maintain established Multiple-Epitaxy products alongside more advanced families. The trade-off is that mature replacement sockets often carry lower selling prices.

MARKET RESTRAINTS

Restraints Impact Analysis*

Market Restraints Impact Rank CAGR Contribution (%) 2026–2028 2029–2031 2032–2034
Silicon MOSFET selling-price pressure High -1.50% High High Medium
GaN and SiC substitution in premium stages Medium-High -1.20% Medium High High
Design qualification and thermal constraints Medium -0.80% High Medium Medium
Others (industrial cycle and supply volatility) Low -0.50% Medium Medium Low
*CAGR contribution shows the percentage points each factor adds to or removes from the forecast CAGR for 2026–2034; driver contributions less restraint contributions equal the market CAGR. Period columns rate the strength of each factor in that window.

Mature device competition compresses realized prices

High-voltage silicon MOSFETs are sold into large-volume equipment programs where purchasing teams benchmark electrical performance against several vendors. As established process families move down the cost curve, improved die efficiency can be offset by lower average selling prices. Suppliers must invest in packaging and reliability to preserve differentiation. A growing number of devices shipped therefore does not necessarily imply the same percentage increase in semiconductor revenue.

Wide-bandgap devices capture some high-performance designs

Gallium nitride can offer faster switching in compact power stages, while silicon carbide is attractive at higher voltages and demanding thermal conditions. onsemi’s December 2025 collaboration with GlobalFoundries for 650 V GaN illustrates a supplier response to this technology transition. Silicon super-junction devices retain an important role because they are economical and familiar, but premium converters may migrate away when efficiency gains justify new drivers, protection schemes and qualification costs.

Switching speed complicates electromagnetic compliance

Lower gate charge and reduced parasitic inductance can improve switching performance but may also create sharper voltage transitions and ringing in poorly optimized layouts. Engineers must verify electromagnetic emissions, insulation margins, diode recovery and thermal cycling before releasing a new power board. These costs are especially important in industrial and automotive systems, where a component substitution can require extensive testing even if the device carries the same nominal 600 V or 650 V rating.

Capital spending and channel inventories can distort orders

Industrial automation projects, display manufacturing and renewable installations do not purchase semiconductor components at a perfectly even pace. Inventory corrections at distributors can temporarily reduce orders even while end-user equipment remains in service. Exchange-rate changes and longer lead times may also shift procurement between quarters or package alternatives. Suppliers with diversified application exposure and clear stock visibility are better positioned to manage these swings than those tied to one equipment cycle.

MARKET OPPORTUNITIES

Fast-recovery body diodes for resonant conversion

Toshiba’s March 2026 DTMOSVI HSD variants reduced reverse-recovery charge in its published comparison, addressing a weakness that can limit silicon devices in bridge and resonant applications. Better diode behavior can simplify component choices and improve system reliability where designers previously needed an external recovery path. The commercial opportunity lies in carefully matched topology and device qualification, not in claiming that every fast-recovery MOSFET fits every inverter architecture.

Kelvin-source packages for space-constrained equipment

TOLL, DFN and top-side-cooled packages allow higher current density when the PCB layout and thermal stack are designed accordingly. A separate source-sense path can reduce gate ringing and make switching more repeatable. Suppliers offering pin-compatible alternatives may win second-source positions in server and display power boards. However, mechanical compatibility is not enough; engineers still need to check solder joint fatigue, creepage distances and heatsink attachment.

Ecodesign compliance in external power supplies

European rules on external power supply efficiency and standby consumption encourage manufacturers to revisit converter designs and component choices. A better super-junction MOSFET can reduce losses in a primary switch, but total adapter performance also depends on magnetics, controller operation and secondary rectification. Suppliers that provide reference circuits and efficiency measurements across load conditions can support customers seeking compliance without requiring a wholesale move to a different semiconductor material.

Localized technical support and qualified second sources

Power equipment companies increasingly want multiple approved component suppliers to reduce supply disruption. Device vendors can compete by offering equivalent 600 V and 650 V packages, transparent reliability data and local application engineering for converter optimization. A second-source win may begin with a small industrial service program before scaling into original equipment production. This channel opportunity rewards documentation and continuity as much as absolute transistor performance.

Super-Junction MOSFET Supply Chain Analysis

The supply chain moves from high-purity silicon wafers and epitaxial or trench processing through metallization, wafer testing, package assembly and final electrical qualification. A finished power supply adds controllers, magnetic components, capacitors and thermal hardware, but those downstream items are not counted in transistor market revenue. Device manufacturers coordinate process technology, packaging partners and distributors to support equipment platforms over multiple product generations.

UpstreamSilicon substrates, dopants, epitaxial deposition equipment, deep-trench etching tools and wafer metrology.
FabricationCharge-balanced P/N columns, gate structures, termination, passivation and high-voltage wafer test.
AssemblyTO-220, TO-247, TOLL, DFN and top-side-cooled packages with reliability and thermal qualification.
End usersServer and telecom supplies, displays, LED drivers, EV chargers and industrial power converters.

Upstream. Silicon wafer quality and process tool control set the foundation for charge-balanced devices. Multiple-Epitaxy platforms require precise dopant and thickness control over repeated growth steps, while Deep-Trench structures place greater demands on etch geometry and filling uniformity. Wafer defects can reduce the number of dies meeting a 600 V or 650 V breakdown target. The manufacturing bottleneck is therefore often process yield rather than the gross quantity of silicon purchased.

Wafer fabrication. A super-junction transistor must maintain balanced charge columns across a high-voltage drift region, which is difficult to achieve uniformly over a large wafer. Manufacturers optimize resistance, output capacitance and diode recovery for particular power topologies, not just for a single catalogue specification. ST’s 12-inch trench introduction demonstrates a potential cost route, but the economics depend on yield and electrical test performance. Process changes can also alter customer qualification requirements.

Packaging and test. After wafer sorting, devices are assembled in through-hole or surface-mount packages and tested for leakage, resistance, breakdown voltage and switching ruggedness. Kelvin-source pins and low-profile packages can reduce board area and switching instability, while package thermal resistance determines practical current capability. Automotive or industrial applications may require extended reliability evidence. A package shortage can therefore delay shipments even when qualified wafers are available in inventory.

Distribution and equipment integration. Power-supply manufacturers typically procure devices through direct contracts or authorized distribution and then qualify the complete switching stage. Buyers examine alternate suppliers, lot traceability, product-change notices and lifecycle commitments. Field replacement channels prioritize compatibility with older layouts, whereas new server power designs can justify a different footprint. This downstream distinction shapes price negotiation and inventory policy without changing the fundamental market boundary at the transistor device level.

Recent Developments in the Super-Junction MOSFET Market

  • 9 July 2026 Product launch
    ROHM expanded its 600 V super-junction MOSFET portfolio with R60xxXNx and PrestoMOS R60xxWNx surface-mount devices, targeting compact server and industrial power supplies. The new DFN8080 and TOLL package options address thermal performance and second-source compatibility. Their market relevance lies in more flexible package selection for silicon power stages, where designers want lower losses without redesigning the entire converter around a different switch technology. Source
  • 19 March 2026 Technology release
    Toshiba announced seven DTMOSVI 600 V HSD super-junction MOSFETs incorporating fast-recovery body diodes, including compact DFN8x8 and TOLL variants. Its published comparison reported reverse-recovery charge reduced by about 85% versus standard DTMOSVI devices under specified test conditions. This addresses bridge and inverter designs where diode behavior affects efficiency and switching stress, while leaving full-circuit qualification to the equipment manufacturer. Source
  • 18 December 2025 Technology competition
    onsemi and GlobalFoundries announced collaboration on 650 V GaN-on-silicon power devices for computing, automotive and industrial applications. This is not a new silicon super-junction MOSFET launch; it illustrates substitution pressure at overlapping voltage ratings. Established silicon suppliers may need to strengthen resistance-charge performance, cost and package reliability to retain sockets where buyers compare charge-balanced MOSFETs against faster-switching alternatives. Source
  • 27 November 2025 Device introduction
    Toshiba launched the TK057V60Z, a 600 V DTMOSVI super-junction transistor with 0.047 ohm typical on-resistance in a DFN8x8 package. The part targets server power supplies, UPS and photovoltaic conditioning equipment where board space and conduction loss are constrained. Its Kelvin-source connection can improve gate control, but customers must still validate their switching layout and thermal stack to realize the benefits. Source
  • 29 October 2025 Packaging development
    Magnachip introduced two 650 V super-junction MOSFETs in four-pin Kelvin-source TOLL packages for high-current consumer electronics including premium displays and laptop adapters. The package is intended to reduce common-source inductance effects during rapid switching and to support higher power density. This development expands the choice of surface-mount silicon devices for contract manufacturers working within thin equipment enclosures. Source
  • 30 April 2025 Design win
    Infineon disclosed that LITEON was using its 600 V CoolMOS 8 super-junction MOSFET family in server power designs. Infineon highlighted lower gate charge and better thermal performance than previous devices, positioning silicon as a cost-effective route to efficient computing infrastructure. The announcement provides evidence of commercial adoption in a demanding application but does not reveal a supplier revenue share for the wider transistor market. Source
  • 26 March 2025 Portfolio update
    Vishay introduced the SiHK050N65E Gen 4.5 650 V E Series super-junction MOSFET for computing, telecom and industrial power conversion. The company cited a 48.2% reduction in on-resistance compared with its earlier device and improved resistance-charge figures of merit. These parameters can reduce losses in PFC and DC/DC stages, although actual system savings depend on switching frequency, thermal design and operating load. Source
  • 18 February 2025 Process milestone
    STMicroelectronics described its STWA60N028T as the first STMESH deep-trench super-junction MOSFET manufactured on a 12-inch wafer. The 600 V device has a published on-resistance of 28 milliohms and uses fewer mask steps than an earlier process. This provides a concrete manufacturing route toward better die economics, subject to production yield and application qualification rather than guaranteed cost savings in every power supply. Source

REPORT SCOPE & SEGMENTATION

Attribute Details
Study Period 2020–2034
Base Year 2025
Estimated Year 2026
Forecast Period 2026–2034
Historical Period 2020–2024
Market Size 2025 USD 4,303 million
Market Size 2026 USD 4,808 million
Market Size 2034 USD 11,698 million
Growth Rate CAGR of 11.8% from 2026–2034
Unit Value (USD Million) and Volume (Million Units)
Segmentation By Type, By Application and By Region
By Type Multiple-Epitaxy · Deep-Trench
By Application Power Supply · Display · Lighting · EV/HEV · Industrial
By Region Each region analyzed by type, application and country
North AmericaUnited States, Canada, Mexico
EuropeGermany, France, Italy, United Kingdom, Nordic Countries, Rest of Europe
Asia-PacificChina, Japan, South Korea, India, Taiwan, Southeast Asia, Rest of Asia-Pacific
South AmericaBrazil, Argentina, Chile, Colombia, Rest of South America
Middle East & AfricaSaudi Arabia, UAE, South Africa, Egypt, Morocco, Rest of Middle East & Africa
Key Companies Profiled onsemi (Fairchild Semiconductor legacy), Infineon Technologies, STMicroelectronics, Toshiba Electronic Devices & Storage, Vishay Intertechnology
Customization Scope Free report customization equivalent to up to four analyst working days with purchase, including additional country breakouts, converter application splits or manufacturing process comparisons.

Frequently Asked Questions

How large is the global super-junction MOSFET market?

The global super-junction MOSFET market was valued at USD 4,303 million in 2025 and is forecast to reach USD 11,698 million by 2034, at a CAGR of 11.8% during 2026–2034. The outlook captures the expanding number of switching positions within electrified equipment and the gradual replacement of older, higher-loss devices. These values refer to charge-balanced transistor devices, not the total selling price of the systems in which they operate.

What is a super-junction MOSFET and why is it used?

Unlike an ordinary high-voltage field-effect transistor, this silicon switch uses deliberately opposed dopant pillars so the drift region can withstand voltage without excessive resistance. That architecture lowers conduction resistance at a given breakdown voltage compared with conventional high-voltage designs. It is used in power-factor correction, switching supplies and certain converter bridges because engineers can trade conduction loss, gate charge, output capacitance and diode recovery to optimize the whole electrical stage.

Which fabrication type has the largest market share?

Multiple-Epitaxy leads with an estimated ~68% of 2025 value because it is a mature, widely qualified process for 600 V and 650 V switching devices. Deep-Trench holds about ~32% and is the faster-growing alternative at ~13.7% CAGR, supported by potential mask-count and die-area efficiencies. Neither technology automatically outperforms the other in every topology; package design and switching behavior remain decisive.

Which applications generate the most demand?

Power Supply systems are the largest application at an estimated ~45% of 2025 revenue, spanning computing, telecom, consumer adapters and UPS equipment. EV/HEV contributes about ~17% and grows faster at ~16.2% CAGR, particularly in charging and auxiliary conversion. Display, Lighting and Industrial applications collectively provide a diverse installed base, with different service lives and qualification requirements that influence replacement demand.

Which geographical region leads the market?

Asia-Pacific leads at an estimated ~41% of 2025 demand and grows near ~13.3% CAGR, supported by electronics assembly, charger manufacturing and industrial power systems. North America follows at ~34%, with strong server and UPS exposure, while Europe represents ~18% through efficiency-focused industrial applications. Smaller shares in South America and the Middle East & Africa are influenced by imported equipment and local distribution.

Which companies compete in super-junction MOSFETs?

The principal profiled companies are Infineon, STMicroelectronics, Toshiba, Vishay and onsemi, which owns the historical Fairchild Semiconductor business acquired in 2016. ROHM and Magnachip also supply active high-voltage silicon families, illustrating broader competition. The firms differ in wafer process, fast-recovery capability, voltage range and packaging, so a buyer should compare qualified devices for a specific power stage rather than rely on an unsupported universal ranking.

What factors are driving market growth?

Three major forces are higher-efficiency server and telecom power supplies, expanding vehicle charging electronics and improvements in silicon device architecture. Demand is reinforced by industrial equipment replacement and regulatory attention to energy consumption in external supplies. New trench processes and Kelvin-source packages can lower losses or improve power density, but commercial adoption still depends on customer testing and the cost of redesigning existing converters.

What are the main restraints on super-junction MOSFET sales?

Mature silicon competition puts pressure on selling prices, while GaN and SiC can displace silicon in applications requiring unusually high switching speed or voltage. New packages and processes create additional qualification costs because gate ringing, thermal behavior and electromagnetic emissions must be retested. Industrial capital spending and channel inventory adjustments can also interrupt orders, so unit demand and reported semiconductor revenue need not move in parallel.

How does deep-trench technology differ from multiple epitaxy?

Multiple-Epitaxy devices form charge-balanced regions through repeated growth and doping, whereas Deep-Trench structures use etched features to create complementary columns. The trench route can reduce mask count and benefit from larger wafer production, as ST demonstrated in its 2025 process announcement. Multiple-Epitaxy remains attractive for stable manufacturing and established qualifications. The best option depends on yield, switching parameters, thermal packaging and total design-in cost.

What period and segments does the study cover?

The study uses 2025 as the base year, 2026 as the estimated year and 2026–2034 as the forecast period, with historical coverage from 2020 through 2024. It examines two fabrication types, Multiple-Epitaxy and Deep-Trench, and five applications: Power Supply, Display, Lighting, EV/HEV and Industrial. Geographic analysis covers North America, Europe, Asia-Pacific, South America and the Middle East & Africa.

Research Sources & Evidence Base

View research sources used for this overview
  1. Infineon Technologies. CoolMOS 8 in LITEON server supplies, Technology news dated 30 April 2025; 600 V super-junction performance and commercial design use.
  2. Vishay Intertechnology. Gen 4.5 650 V E Series introduction, Press release dated 26 March 2025; resistance-charge figures and high-efficiency conversion applications.
  3. STMicroelectronics. MDmesh M5 high-voltage family, Official product portfolio describing 550 V and 650 V PFC, PWM and lighting applications.
  4. Toshiba Electronic Devices & Storage. DTMOSVI DFN8x8 release, Product announcement dated 27 November 2025; 600 V package, resistance and power supply uses.
  5. STMicroelectronics. STMESH deep-trench 12-inch process, Official engineering blog dated 18 February 2025; 600 V device and manufacturing process details.
  6. Toshiba Electronic Devices & Storage. DTMOSVI fast-recovery body-diode family, Product announcement dated 19 March 2026; reverse-recovery improvement and package options.
  7. Magnachip Semiconductor. Kelvin-source TOLL super-junction devices, Product news dated 29 October 2025; 650 V display and adapter applications.
  8. Infineon Technologies. 650 V CoolMOS CFD7 portfolio, Official product range for resonant switching, solar and charging infrastructure.
  9. onsemi. Corporate acquisition history, Company record of Fairchild Semiconductor acquisition on 19 September 2016.
  10. European Commission. External power supplies ecodesign requirements, Regulatory information for efficiency and no-load consumption in external adapters.
  11. United States Department of Energy. External power supply energy standards, US regulatory definitions and efficiency rulemaking information.
  12. International Energy Agency. Global EV Outlook 2026, Electric-car sales and forecast demand context for charging electronics; not MOSFET market revenue.
  13. Semiconductor Industry Association. Global semiconductor sales 2025, February 2026 association statistics used only as broad industry context.
  14. International Energy Agency. Energy and AI executive summary, 2025 assessment of data-centre electricity use to 2030 and conversion efficiency pressures.
  15. Schneider Electric. Digital Realty supply capacity agreement, 19 November 2025 infrastructure announcement for UPS and switchgear; adjacent demand evidence.
  16. United States Department of Energy. Data centre resource hub, US electricity demand scenarios and power system context for efficient conversion.
  17. ROHM Semiconductor. 600 V surface-mount super-junction launch, 9 July 2026 launch of EcoMOS and PrestoMOS package variants.
  18. onsemi. SUPERFET III FRFET technical datasheet, Official 650 V automotive-qualified high-voltage silicon device characteristics.
  19. STMicroelectronics. MDmesh DM9 device specifications, Active 600 V MOSFET product with fast-recovery body diode.
  20. Infineon Technologies. CoolMOS family selection guide, Product class and application map from adapters to industrial UPS.
  21. onsemi. GaN collaboration with GlobalFoundries, 18 December 2025 technology competition context for 650 V switching devices.
  22. European Commission. Common charger regulatory overview, USB-C and efficiency context for adapter equipment purchasing.
Super-Junction MOSFET Market

Get Sample Report PDF for Exclusive Insights

Report Sample Includes

  • Table of Contents
  • List of Tables & Figures
  • Charts, Research Methodology, and more...

PDF Icon Download Sample Report PDF

Download Sample Report

Table of Content

Table of Contents
1 Research Methodology and Statistical Scope
1.1 Market Definition and Statistical Scope of Super-Junction MOSFET
1.2 Key Market Segments
1.2.1 Super-Junction MOSFET Segment by Type
1.2.2 Super-Junction MOSFET Segment by Application
1.3 Methodology & Sources of Information
1.3.1 Research Methodology
1.3.2 Research Process
1.3.3 Market Breakdown and Data Triangulation
1.3.4 Base Year
1.3.5 Report Assumptions & Caveats
2 Super-Junction MOSFET Market Overview
2.1 Global Market Overview
2.1.1 Global Super-Junction MOSFET Market Size (M USD) Estimates and Forecasts (2026-2034)
2.1.2 Global Super-Junction MOSFET Sales Estimates and Forecasts (2026-2034)
2.2 Market Segment Executive Summary
2.3 Global Market Size by Region
3 Super-Junction MOSFET Market Competitive Landscape
3.1 Global Super-Junction MOSFET Sales by Manufacturers (2019-2024)
3.2 Global Super-Junction MOSFET Revenue Market Share by Manufacturers (2019-2024)
3.3 Super-Junction MOSFET Market Share by Company Type (Tier 1, Tier 2, and Tier 3)
3.4 Global Super-Junction MOSFET Average Price by Manufacturers (2019-2024)
3.5 Manufacturers Super-Junction MOSFET Sales Sites, Area Served, Product Type
3.6 Super-Junction MOSFET Market Competitive Situation and Trends
3.6.1 Super-Junction MOSFET Market Concentration Rate
3.6.2 Global 5 and 10 Largest Super-Junction MOSFET Players Market Share by Revenue
3.6.3 Mergers & Acquisitions, Expansion
4 Super-Junction MOSFET Industry Chain Analysis
4.1 Super-Junction MOSFET Industry Chain Analysis
4.2 Market Overview of Key Raw Materials
4.3 Midstream Market Analysis
4.4 Downstream Customer Analysis
5 The Development and Dynamics of Super-Junction MOSFET Market
5.1 Key Development Trends
5.2 Driving Factors
5.3 Market Challenges
5.4 Market Restraints
5.5 Industry News
5.5.1 New Product Developments
5.5.2 Mergers & Acquisitions
5.5.3 Expansions
5.5.4 Collaboration/Supply Contracts
5.6 Industry Policies
6 Super-Junction MOSFET Market Segmentation by Type
6.1 Evaluation Matrix of Segment Market Development Potential (Type)
6.2 Global Super-Junction MOSFET Sales Market Share by Type (2019-2024)
6.3 Global Super-Junction MOSFET Market Size Market Share by Type (2019-2024)
6.4 Global Super-Junction MOSFET Price by Type (2019-2024)
7 Super-Junction MOSFET Market Segmentation by Application
7.1 Evaluation Matrix of Segment Market Development Potential (Application)
7.2 Global Super-Junction MOSFET Market Sales by Application (2019-2024)
7.3 Global Super-Junction MOSFET Market Size (M USD) by Application (2019-2024)
7.4 Global Super-Junction MOSFET Sales Growth Rate by Application (2019-2024)
8 Super-Junction MOSFET Market Segmentation by Region
8.1 Global Super-Junction MOSFET Sales by Region
8.1.1 Global Super-Junction MOSFET Sales by Region
8.1.2 Global Super-Junction MOSFET Sales Market Share by Region
8.2 North America
8.2.1 North America Super-Junction MOSFET Sales by Country
8.2.2 U.S.
8.2.3 Canada
8.2.4 Mexico
8.3 Europe
8.3.1 Europe Super-Junction MOSFET Sales by Country
8.3.2 Germany
8.3.3 France
8.3.4 U.K.
8.3.5 Italy
8.3.6 Russia
8.4 Asia Pacific
8.4.1 Asia Pacific Super-Junction MOSFET Sales by Region
8.4.2 China
8.4.3 Japan
8.4.4 South Korea
8.4.5 India
8.4.6 Southeast Asia
8.5 South America
8.5.1 South America Super-Junction MOSFET Sales by Country
8.5.2 Brazil
8.5.3 Argentina
8.5.4 Columbia
8.6 Middle East and Africa
8.6.1 Middle East and Africa Super-Junction MOSFET Sales by Region
8.6.2 Saudi Arabia
8.6.3 UAE
8.6.4 Egypt
8.6.5 Nigeria
8.6.6 South Africa
9 Key Companies Profile
9.1 Fairchild Semiconductor International
9.1.1 Fairchild Semiconductor International Super-Junction MOSFET Basic Information
9.1.2 Fairchild Semiconductor International Super-Junction MOSFET Product Overview
9.1.3 Fairchild Semiconductor International Super-Junction MOSFET Product Market Performance
9.1.4 Fairchild Semiconductor International Business Overview
9.1.5 Fairchild Semiconductor International Super-Junction MOSFET SWOT Analysis
9.1.6 Fairchild Semiconductor International Recent Developments
9.2 Infineon Technologies
9.2.1 Infineon Technologies Super-Junction MOSFET Basic Information
9.2.2 Infineon Technologies Super-Junction MOSFET Product Overview
9.2.3 Infineon Technologies Super-Junction MOSFET Product Market Performance
9.2.4 Infineon Technologies Business Overview
9.2.5 Infineon Technologies Super-Junction MOSFET SWOT Analysis
9.2.6 Infineon Technologies Recent Developments
9.3 STMicroelectronics
9.3.1 STMicroelectronics Super-Junction MOSFET Basic Information
9.3.2 STMicroelectronics Super-Junction MOSFET Product Overview
9.3.3 STMicroelectronics Super-Junction MOSFET Product Market Performance
9.3.4 STMicroelectronics Super-Junction MOSFET SWOT Analysis
9.3.5 STMicroelectronics Business Overview
9.3.6 STMicroelectronics Recent Developments
9.4 Toshiba
9.4.1 Toshiba Super-Junction MOSFET Basic Information
9.4.2 Toshiba Super-Junction MOSFET Product Overview
9.4.3 Toshiba Super-Junction MOSFET Product Market Performance
9.4.4 Toshiba Business Overview
9.4.5 Toshiba Recent Developments
9.5 Vishay Intertechnology
9.5.1 Vishay Intertechnology Super-Junction MOSFET Basic Information
9.5.2 Vishay Intertechnology Super-Junction MOSFET Product Overview
9.5.3 Vishay Intertechnology Super-Junction MOSFET Product Market Performance
9.5.4 Vishay Intertechnology Business Overview
9.5.5 Vishay Intertechnology Recent Developments
10 Super-Junction MOSFET Market Forecast by Region
10.1 Global Super-Junction MOSFET Market Size Forecast
10.2 Global Super-Junction MOSFET Market Forecast by Region
10.2.1 North America Market Size Forecast by Country
10.2.2 Europe Super-Junction MOSFET Market Size Forecast by Country
10.2.3 Asia Pacific Super-Junction MOSFET Market Size Forecast by Region
10.2.4 South America Super-Junction MOSFET Market Size Forecast by Country
10.2.5 Middle East and Africa Forecasted Consumption of Super-Junction MOSFET by Country
11 Forecast Market by Type and by Application (2025-2030)
11.1 Global Super-Junction MOSFET Market Forecast by Type (2025-2030)
11.1.1 Global Forecasted Sales of Super-Junction MOSFET by Type (2025-2030)
11.1.2 Global Super-Junction MOSFET Market Size Forecast by Type (2025-2030)
11.1.3 Global Forecasted Price of Super-Junction MOSFET by Type (2025-2030)
11.2 Global Super-Junction MOSFET Market Forecast by Application (2025-2030)
11.2.1 Global Super-Junction MOSFET Sales (K Units) Forecast by Application
11.2.2 Global Super-Junction MOSFET Market Size (M USD) Forecast by Application (2025-2030)
12 Conclusion and Key FindingsList of Tables
Table 1. Introduction of the Type
Table 2. Introduction of the Application
Table 3. Market Size (M USD) Segment Executive Summary
Table 4. Super-Junction MOSFET Market Size Comparison by Region (M USD)
Table 5. Global Super-Junction MOSFET Sales (K Units) by Manufacturers (2019-2024)
Table 6. Global Super-Junction MOSFET Sales Market Share by Manufacturers (2019-2024)
Table 7. Global Super-Junction MOSFET Revenue (M USD) by Manufacturers (2019-2024)
Table 8. Global Super-Junction MOSFET Revenue Share by Manufacturers (2019-2024)
Table 9. Company Type (Tier 1, Tier 2, and Tier 3) & (based on the Revenue in Super-Junction MOSFET as of 2022)
Table 10. Global Market Super-Junction MOSFET Average Price (USD/Unit) of Key Manufacturers (2019-2024)
Table 11. Manufacturers Super-Junction MOSFET Sales Sites and Area Served
Table 12. Manufacturers Super-Junction MOSFET Product Type
Table 13. Global Super-Junction MOSFET Manufacturers Market Concentration Ratio (CR5 and HHI)
Table 14. Mergers & Acquisitions, Expansion Plans
Table 15. Industry Chain Map of Super-Junction MOSFET
Table 16. Market Overview of Key Raw Materials
Table 17. Midstream Market Analysis
Table 18. Downstream Customer Analysis
Table 19. Key Development Trends
Table 20. Driving Factors
Table 21. Super-Junction MOSFET Market Challenges
Table 22. Global Super-Junction MOSFET Sales by Type (K Units)
Table 23. Global Super-Junction MOSFET Market Size by Type (M USD)
Table 24. Global Super-Junction MOSFET Sales (K Units) by Type (2019-2024)
Table 25. Global Super-Junction MOSFET Sales Market Share by Type (2019-2024)
Table 26. Global Super-Junction MOSFET Market Size (M USD) by Type (2019-2024)
Table 27. Global Super-Junction MOSFET Market Size Share by Type (2019-2024)
Table 28. Global Super-Junction MOSFET Price (USD/Unit) by Type (2019-2024)
Table 29. Global Super-Junction MOSFET Sales (K Units) by Application
Table 30. Global Super-Junction MOSFET Market Size by Application
Table 31. Global Super-Junction MOSFET Sales by Application (2019-2024) & (K Units)
Table 32. Global Super-Junction MOSFET Sales Market Share by Application (2019-2024)
Table 33. Global Super-Junction MOSFET Sales by Application (2019-2024) & (M USD)
Table 34. Global Super-Junction MOSFET Market Share by Application (2019-2024)
Table 35. Global Super-Junction MOSFET Sales Growth Rate by Application (2019-2024)
Table 36. Global Super-Junction MOSFET Sales by Region (2019-2024) & (K Units)
Table 37. Global Super-Junction MOSFET Sales Market Share by Region (2019-2024)
Table 38. North America Super-Junction MOSFET Sales by Country (2019-2024) & (K Units)
Table 39. Europe Super-Junction MOSFET Sales by Country (2019-2024) & (K Units)
Table 40. Asia Pacific Super-Junction MOSFET Sales by Region (2019-2024) & (K Units)
Table 41. South America Super-Junction MOSFET Sales by Country (2019-2024) & (K Units)
Table 42. Middle East and Africa Super-Junction MOSFET Sales by Region (2019-2024) & (K Units)
Table 43. Fairchild Semiconductor International Super-Junction MOSFET Basic Information
Table 44. Fairchild Semiconductor International Super-Junction MOSFET Product Overview
Table 45. Fairchild Semiconductor International Super-Junction MOSFET Sales (K Units), Revenue (M USD), Price (USD/Unit) and Gross Margin (2019-2024)
Table 46. Fairchild Semiconductor International Business Overview
Table 47. Fairchild Semiconductor International Super-Junction MOSFET SWOT Analysis
Table 48. Fairchild Semiconductor International Recent Developments
Table 49. Infineon Technologies Super-Junction MOSFET Basic Information
Table 50. Infineon Technologies Super-Junction MOSFET Product Overview
Table 51. Infineon Technologies Super-Junction MOSFET Sales (K Units), Revenue (M USD), Price (USD/Unit) and Gross Margin (2019-2024)
Table 52. Infineon Technologies Business Overview
Table 53. Infineon Technologies Super-Junction MOSFET SWOT Analysis
Table 54. Infineon Technologies Recent Developments
Table 55. STMicroelectronics Super-Junction MOSFET Basic Information
Table 56. STMicroelectronics Super-Junction MOSFET Product Overview
Table 57. STMicroelectronics Super-Junction MOSFET Sales (K Units), Revenue (M USD), Price (USD/Unit) and Gross Margin (2019-2024)
Table 58. STMicroelectronics Super-Junction MOSFET SWOT Analysis
Table 59. STMicroelectronics Business Overview
Table 60. STMicroelectronics Recent Developments
Table 61. Toshiba Super-Junction MOSFET Basic Information
Table 62. Toshiba Super-Junction MOSFET Product Overview
Table 63. Toshiba Super-Junction MOSFET Sales (K Units), Revenue (M USD), Price (USD/Unit) and Gross Margin (2019-2024)
Table 64. Toshiba Business Overview
Table 65. Toshiba Recent Developments
Table 66. Vishay Intertechnology Super-Junction MOSFET Basic Information
Table 67. Vishay Intertechnology Super-Junction MOSFET Product Overview
Table 68. Vishay Intertechnology Super-Junction MOSFET Sales (K Units), Revenue (M USD), Price (USD/Unit) and Gross Margin (2019-2024)
Table 69. Vishay Intertechnology Business Overview
Table 70. Vishay Intertechnology Recent Developments
Table 71. Global Super-Junction MOSFET Sales Forecast by Region (2025-2030) & (K Units)
Table 72. Global Super-Junction MOSFET Market Size Forecast by Region (2025-2030) & (M USD)
Table 73. North America Super-Junction MOSFET Sales Forecast by Country (2025-2030) & (K Units)
Table 74. North America Super-Junction MOSFET Market Size Forecast by Country (2025-2030) & (M USD)
Table 75. Europe Super-Junction MOSFET Sales Forecast by Country (2025-2030) & (K Units)
Table 76. Europe Super-Junction MOSFET Market Size Forecast by Country (2025-2030) & (M USD)
Table 77. Asia Pacific Super-Junction MOSFET Sales Forecast by Region (2025-2030) & (K Units)
Table 78. Asia Pacific Super-Junction MOSFET Market Size Forecast by Region (2025-2030) & (M USD)
Table 79. South America Super-Junction MOSFET Sales Forecast by Country (2025-2030) & (K Units)
Table 80. South America Super-Junction MOSFET Market Size Forecast by Country (2025-2030) & (M USD)
Table 81. Middle East and Africa Super-Junction MOSFET Consumption Forecast by Country (2025-2030) & (Units)
Table 82. Middle East and Africa Super-Junction MOSFET Market Size Forecast by Country (2025-2030) & (M USD)
Table 83. Global Super-Junction MOSFET Sales Forecast by Type (2025-2030) & (K Units)
Table 84. Global Super-Junction MOSFET Market Size Forecast by Type (2025-2030) & (M USD)
Table 85. Global Super-Junction MOSFET Price Forecast by Type (2025-2030) & (USD/Unit)
Table 86. Global Super-Junction MOSFET Sales (K Units) Forecast by Application (2025-2030)
Table 87. Global Super-Junction MOSFET Market Size Forecast by Application (2025-2030) & (M USD)
List of Figures
Figure 1. Product Picture of Super-Junction MOSFET
Figure 2. Data Triangulation
Figure 3. Key Caveats
Figure 4. Global Super-Junction MOSFET Market Size (M USD), 2026-2034
Figure 5. Global Super-Junction MOSFET Market Size (M USD) (2026-2034)
Figure 6. Global Super-Junction MOSFET Sales (K Units) & (2026-2034)
Figure 7. Evaluation Matrix of Segment Market Development Potential (Type)
Figure 8. Evaluation Matrix of Segment Market Development Potential (Application)
Figure 9. Evaluation Matrix of Regional Market Development Potential
Figure 10. Super-Junction MOSFET Market Size by Country (M USD)
Figure 11. Super-Junction MOSFET Sales Share by Manufacturers in 2023
Figure 12. Global Super-Junction MOSFET Revenue Share by Manufacturers in 2023
Figure 13. Super-Junction MOSFET Market Share by Company Type (Tier 1, Tier 2 and Tier 3): 2023
Figure 14. Global Market Super-Junction MOSFET Average Price (USD/Unit) of Key Manufacturers in 2023
Figure 15. The Global 5 and 10 Largest Players: Market Share by Super-Junction MOSFET Revenue in 2023
Figure 16. Evaluation Matrix of Segment Market Development Potential (Type)
Figure 17. Global Super-Junction MOSFET Market Share by Type
Figure 18. Sales Market Share of Super-Junction MOSFET by Type (2019-2024)
Figure 19. Sales Market Share of Super-Junction MOSFET by Type in 2023
Figure 20. Market Size Share of Super-Junction MOSFET by Type (2019-2024)
Figure 21. Market Size Market Share of Super-Junction MOSFET by Type in 2023
Figure 22. Evaluation Matrix of Segment Market Development Potential (Application)
Figure 23. Global Super-Junction MOSFET Market Share by Application
Figure 24. Global Super-Junction MOSFET Sales Market Share by Application (2019-2024)
Figure 25. Global Super-Junction MOSFET Sales Market Share by Application in 2023
Figure 26. Global Super-Junction MOSFET Market Share by Application (2019-2024)
Figure 27. Global Super-Junction MOSFET Market Share by Application in 2023
Figure 28. Global Super-Junction MOSFET Sales Growth Rate by Application (2019-2024)
Figure 29. Global Super-Junction MOSFET Sales Market Share by Region (2019-2024)
Figure 30. North America Super-Junction MOSFET Sales and Growth Rate (2019-2024) & (K Units)
Figure 31. North America Super-Junction MOSFET Sales Market Share by Country in 2023
Figure 32. U.S. Super-Junction MOSFET Sales and Growth Rate (2019-2024) & (K Units)
Figure 33. Canada Super-Junction MOSFET Sales (K Units) and Growth Rate (2019-2024)
Figure 34. Mexico Super-Junction MOSFET Sales (Units) and Growth Rate (2019-2024)
Figure 35. Europe Super-Junction MOSFET Sales and Growth Rate (2019-2024) & (K Units)
Figure 36. Europe Super-Junction MOSFET Sales Market Share by Country in 2023
Figure 37. Germany Super-Junction MOSFET Sales and Growth Rate (2019-2024) & (K Units)
Figure 38. France Super-Junction MOSFET Sales and Growth Rate (2019-2024) & (K Units)
Figure 39. U.K. Super-Junction MOSFET Sales and Growth Rate (2019-2024) & (K Units)
Figure 40. Italy Super-Junction MOSFET Sales and Growth Rate (2019-2024) & (K Units)
Figure 41. Russia Super-Junction MOSFET Sales and Growth Rate (2019-2024) & (K Units)
Figure 42. Asia Pacific Super-Junction MOSFET Sales and Growth Rate (K Units)
Figure 43. Asia Pacific Super-Junction MOSFET Sales Market Share by Region in 2023
Figure 44. China Super-Junction MOSFET Sales and Growth Rate (2019-2024) & (K Units)
Figure 45. Japan Super-Junction MOSFET Sales and Growth Rate (2019-2024) & (K Units)
Figure 46. South Korea Super-Junction MOSFET Sales and Growth Rate (2019-2024) & (K Units)
Figure 47. India Super-Junction MOSFET Sales and Growth Rate (2019-2024) & (K Units)
Figure 48. Southeast Asia Super-Junction MOSFET Sales and Growth Rate (2019-2024) & (K Units)
Figure 49. South America Super-Junction MOSFET Sales and Growth Rate (K Units)
Figure 50. South America Super-Junction MOSFET Sales Market Share by Country in 2023
Figure 51. Brazil Super-Junction MOSFET Sales and Growth Rate (2019-2024) & (K Units)
Figure 52. Argentina Super-Junction MOSFET Sales and Growth Rate (2019-2024) & (K Units)
Figure 53. Columbia Super-Junction MOSFET Sales and Growth Rate (2019-2024) & (K Units)
Figure 54. Middle East and Africa Super-Junction MOSFET Sales and Growth Rate (K Units)
Figure 55. Middle East and Africa Super-Junction MOSFET Sales Market Share by Region in 2023
Figure 56. Saudi Arabia Super-Junction MOSFET Sales and Growth Rate (2019-2024) & (K Units)
Figure 57. UAE Super-Junction MOSFET Sales and Growth Rate (2019-2024) & (K Units)
Figure 58. Egypt Super-Junction MOSFET Sales and Growth Rate (2019-2024) & (K Units)
Figure 59. Nigeria Super-Junction MOSFET Sales and Growth Rate (2019-2024) & (K Units)
Figure 60. South Africa Super-Junction MOSFET Sales and Growth Rate (2019-2024) & (K Units)
Figure 61. Global Super-Junction MOSFET Sales Forecast by Volume (2026-2034) & (K Units)
Figure 62. Global Super-Junction MOSFET Market Size Forecast by Value (2026-2034) & (M USD)
Figure 63. Global Super-Junction MOSFET Sales Market Share Forecast by Type (2025-2030)
Figure 64. Global Super-Junction MOSFET Market Share Forecast by Type (2025-2030)
Figure 65. Global Super-Junction MOSFET Sales Forecast by Application (2025-2030)
Figure 66. Global Super-Junction MOSFET Market Share Forecast by Application (2025-2030)