SEMICONDUCTOR INSIGHT
MARKET RESEARCH REPORT

Global SiC Metrology and Inspection Equipment Market

2026 to 2034
MARKET INTELLIGENCE
ACROSS KEY REGIONS
2026 EDITION
POWER ELECTRONICS Semiconductor Market Research

Global SiC Metrology and Inspection Equipment Market

Emerging Trends, Technological Advancements, and Business Strategies 2026-2034

◷
UPDATED 29 October 2026
▤
REPORT LENGTH Detailed Report
▣
REPORT CODE 451b6f1e51a3
▯
FORMATS PDF

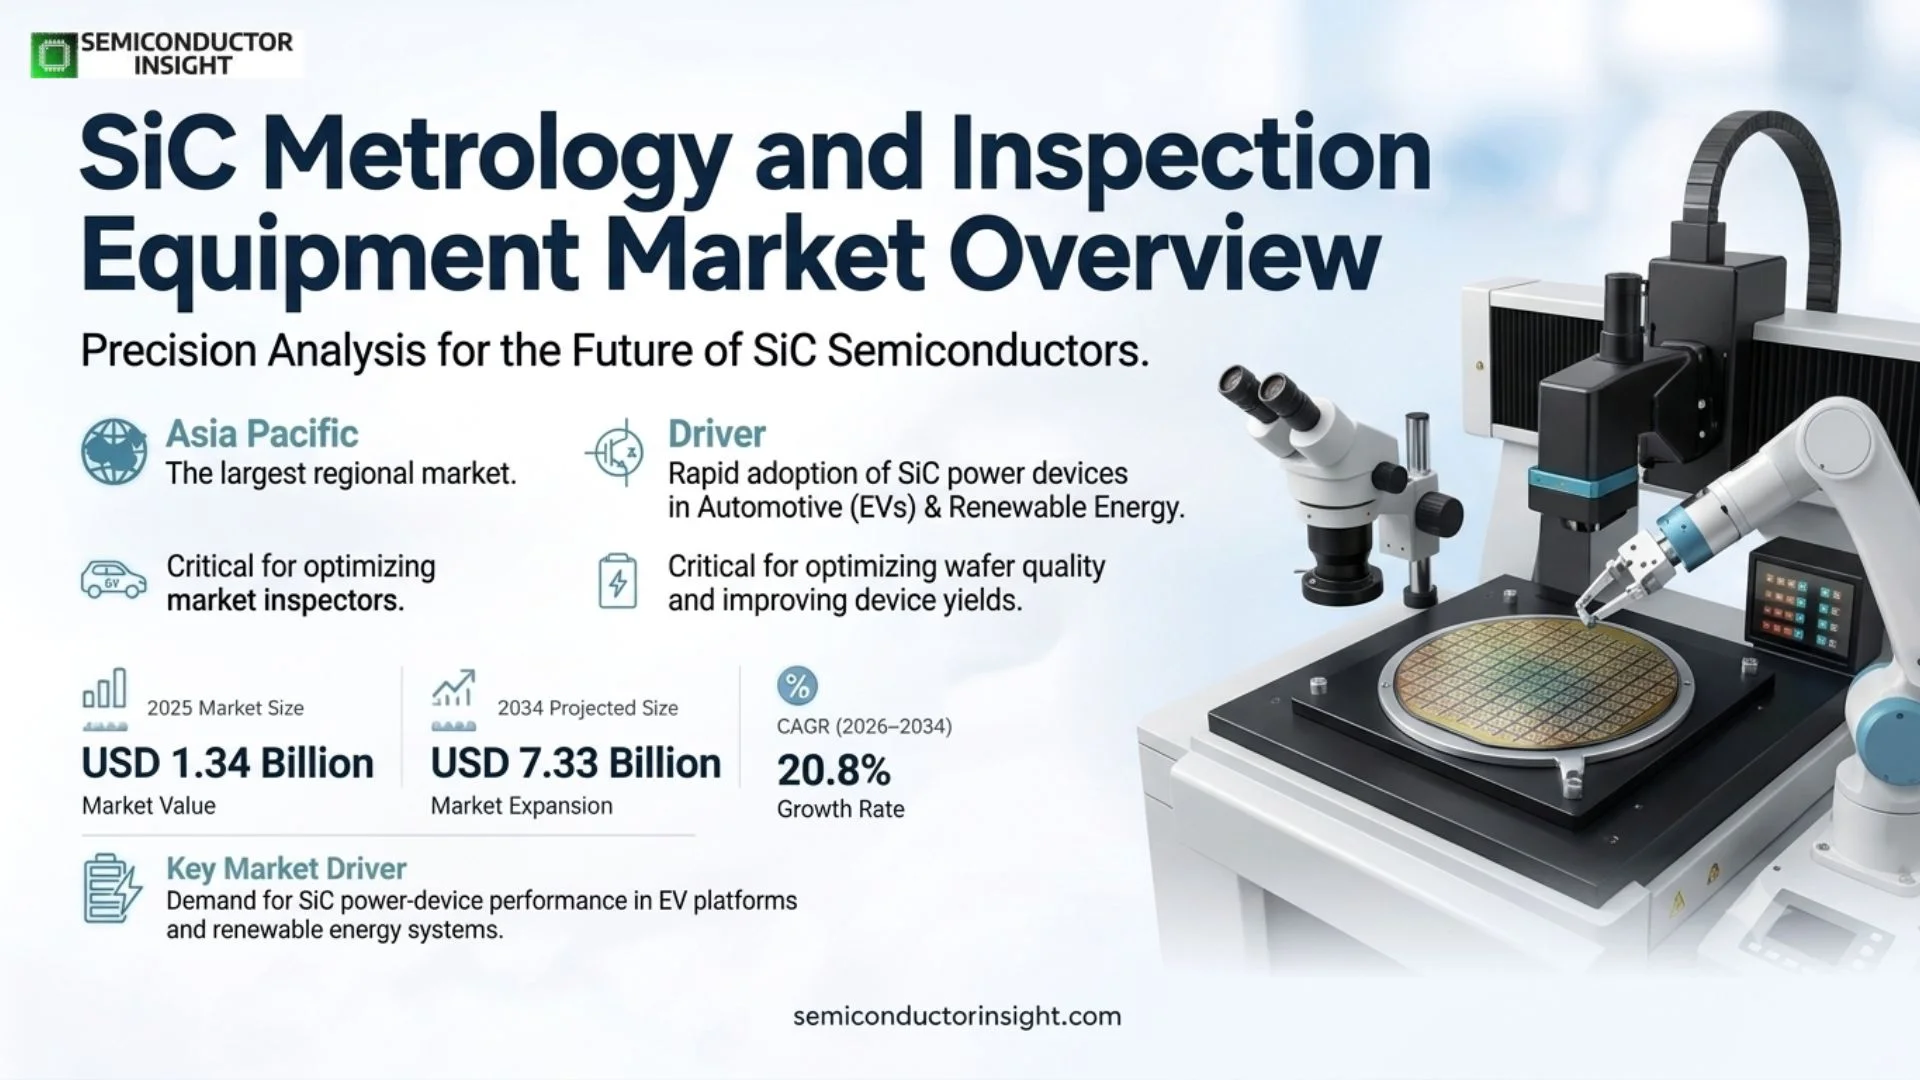
SiC metrology and inspection equipment market was valued at USD 1,338.15 million in 2025 and is projected to reach USD 7,330.03 million by 2034, expanding at a 20.8% CAGR during 2026–2034. Asia Pacific is the largest regional market, supported by a dense concentration of SiC materials, power-device and semiconductor-equipment activity.

Get the sample PDF with study scope, segmentation and methodology details.

Key Statistics

2025 Market Size
USD 1,338.15 million
2034 Projected Market Size
USD 7,330.03 million
CAGR (2026–2034)
20.8%
Largest Market in 2025
Asia Pacific

Key Takeaways

  • Defect inspection equipment is the larger of the two principal product groups because SiC substrate, epitaxy and device makers must find micropipes, basal-plane dislocations, stacking faults, particles and surface defects before expensive downstream processing turns them into yield loss. The commercial emphasis is moving from simple imaging toward automated classification and wafer-level traceability.
  • SiC substrate and wafer inspection remains the anchor application, while epitaxial-wafer metrology is becoming more strategically important as 200 mm production scales and device makers demand tighter control of thickness, doping, surface morphology and defect propagation. Inspection intensity rises as wafer value and process complexity increase.
  • Asia Pacific is the largest market because the region combines a dense semiconductor equipment supply base with major SiC wafer, epitaxy and power-device investments in China, Japan, South Korea and Southeast Asia. Europe is also strategically important because vertically integrated SiC programs are expanding around Italy and Austria.
  • The 150 mm to 200 mm transition is the strongest structural driver. Infineon has reported first customer products from 200 mm SiC, Wolfspeed has launched a commercial 200 mm materials portfolio, and STMicroelectronics is building 200 mm SiC capability, creating new inspection steps and tighter tool repeatability requirements.
  • Qualification burden and capital intensity restrain adoption because metrology tools must prove correlation to device yield, manage optical contrast challenges in wide-bandgap materials and integrate with factory automation. Established suppliers therefore benefit from application know-how, reference installations and service coverage rather than hardware specifications alone.

Global SiC Metrology and Inspection Equipment Market Overview

SiC metrology and inspection equipment market was valued at USD 1,338.15 million in 2025 and is projected to reach USD 7,330.03 million by 2034, expanding at a 20.8% CAGR during 2026–2034. Asia Pacific is the largest regional market, supported by a dense concentration of SiC materials, power-device and semiconductor-equipment activity.

Base year: 2025 · Estimated year: 2026 · Forecast period: 2026–2034 · Values in USD million

Silicon carbide metrology and inspection equipment covers production and development systems used to detect defects and measure wafer, surface and epitaxial characteristics before those conditions become downstream yield loss. The market includes defect inspection platforms and metrology systems applied to SiC substrates and epitaxial wafers. Commercial value is created by finding crystal, polishing, epitaxial or process-related excursions early enough to prevent expensive device processing on material that is unlikely to meet electrical performance targets.

SiC requires a different process-control approach from conventional silicon because defect mechanisms can originate in bulk crystal growth and propagate through wafering, polishing and epitaxy. Micropipes, basal-plane dislocations, stacking faults, scratches, pits, particles, thickness non-uniformity, bow and warp can each affect manufacturability or device performance. Equipment therefore competes on more than optical sensitivity: classification accuracy, nuisance-event control, wafer handling, recipe stability and the ability to correlate results with electrical yield are central buying criteria.

The market is changing quickly as the industry moves from 150 mm toward 200 mm SiC. Larger wafers raise potential die output, but they also increase the value exposed to a single wafer-level excursion. Manufacturers consequently need stronger geometry control, high-throughput surface inspection and data systems that can compare results across substrate, epitaxy and device process steps. This transition also creates qualification work because inspection recipes, edge handling and sensitivity thresholds must be proven again at the larger diameter.

Segment Analysis: By Type

By type, the market is segmented into SiC Defect Inspection Equipment and SiC Metrology Equipment. Defect inspection equipment represents the larger commercial pool because every substrate and epitaxy line needs systematic defect screening, while metrology is gaining strategic weight as 200 mm manufacturing raises requirements for wafer geometry, layer uniformity and closed-loop process control.

Type Technical function Market position
SiC Defect Inspection Equipment Optical and laser-based inspection systems identify surface and near-surface defects, particles, scratches, pits, crystallographic imperfections and process-induced anomalies across SiC substrates and epitaxial layers. The economic role is preventive: every defect detected before device fabrication avoids spending lithography, etch, deposition and metallization cost on material that is already unlikely to meet electrical yield targets. Largest product group. Demand is supported by the high value of SiC wafers and the sensitivity of high-voltage devices to crystal and epitaxial defects. Competitive differentiation centers on detection sensitivity, nuisance-event suppression, classification accuracy, throughput and the ability to maintain stable recipes across 150 mm and 200 mm production without creating an inspection bottleneck.
SiC Metrology Equipment Metrology systems measure wafer geometry, bow and warp, surface topography, film and epitaxial thickness, roughness, critical dimensions and other parameters that determine whether a wafer can move to the next process step. These tools are increasingly linked to statistical process control so excursions can be traced back to crystal growth, polishing, epitaxy or device-fabrication conditions. Fastest-expanding strategic segment. The move to 200 mm raises the cost of non-uniformity and makes wafer geometry, epitaxial uniformity and overlay-sensitive parameters more consequential. Tool suppliers that combine non-contact measurement, automated wafer handling, recipe portability and data interfaces can capture more value as customers seek closed-loop control rather than stand-alone measurements.

Technology and pricing position

Production-grade pricing is determined by detection sensitivity, throughput, wafer diameter, automation and software depth rather than by one instrument specification. Laboratory systems can satisfy engineering or root-cause work, but high-volume customers pay a premium for automated loading, repeatable wafer maps, recipe governance and uptime support. The premium is strongest where the tool directly protects expensive 200 mm material or where its data is used for process disposition, because the customer’s cost of a missed excursion exceeds the equipment’s incremental acquisition cost.

Segment Analysis: By Application

By application, the market is segmented into SiC Substrate/Wafer and SiC Epitaxial Wafer. Substrate and wafer inspection is the larger installed base because quality control begins before epitaxy, while epitaxial-wafer inspection and metrology are expanding rapidly as device manufacturers demand tighter control of surface defects, layer uniformity and defect propagation for high-voltage power devices.

Application Demand characteristics
SiC Substrate/Wafer Largest application base. Incoming and outgoing inspection at substrate plants covers crystal-related defects, polishing damage, particles, geometry and surface condition before epitaxy. As 200 mm substrate manufacturing moves from pilot to commercial supply, customers need higher throughput without sacrificing sensitivity. That favors automated platforms capable of recipe standardization, edge handling and comprehensive wafer maps that can follow material through later process stages.
SiC Epitaxial Wafer Fastest-growing application. Epitaxy adds substantial value to the substrate and can propagate or create defects that directly affect device leakage, breakdown voltage and yield. Producers therefore inspect surface morphology and defect signatures while measuring layer thickness and uniformity. Higher-voltage devices and larger wafer diameters increase the economic penalty of excursions, supporting more frequent metrology and stronger integration with run-to-run process control.

Global SiC Metrology and Inspection Equipment Market Share

Regional Analysis

Asia Pacific is the largest SiC metrology and inspection equipment market in 2025, supported by manufacturing and equipment ecosystems spanning China, Japan and South Korea. Europe and North America are also high-value markets because major suppliers are scaling 200 mm SiC materials and device production, while South America and the Middle East & Africa remain more selective and research- or project-led.

How does regional demand differ across the SiC metrology and inspection equipment market?

Regional demand is defined by where SiC materials and devices are actually being manufactured and qualified. Asia Pacific combines the broadest production ecosystem and localization push; Europe is shaped by vertically integrated power-semiconductor programs and automotive qualification; North America is strong in materials technology, process-control suppliers and domestic semiconductor investment. The other regions buy primarily for research, engineering and selective advanced-manufacturing projects, so throughput and service requirements differ materially from a high-volume wafer fab.

Region Position Growth outlook Demand profile Supplier-selection logic
Asia Pacific Largest Highest New capacity and localization Dense SiC materials, device and equipment ecosystem across China, Japan, South Korea and Southeast Asia supports broad inspection demand.
Europe Strategic second tier High Vertically integrated power semiconductor expansion 200 mm SiC investments by leading power semiconductor companies raise demand for production-qualified metrology and yield-control tools.
North America Technology-led High Materials scale-up and power-device capacity Commercial 200 mm material supply and domestic semiconductor investment support advanced inspection, analytics and factory integration.
South America Niche Moderate Imported equipment and research demand The market is smaller and concentrated in laboratories, university programs and electronics manufacturing that relies on imported SiC materials and tools.
Middle East & Africa Emerging Selective Research, advanced manufacturing and diversification Demand is project-led, with opportunities tied to semiconductor ecosystem investments, research institutions and industrial diversification rather than a mature SiC production base.
Asia Pacific LARGEST MARKET

What defines the Asia Pacific market?

Asia Pacific leads because the region contains the broadest concentration of SiC substrate, epitaxy, power-device and semiconductor-equipment activity. China is investing across the SiC chain, Japan retains deep materials and equipment expertise, South Korea is expanding power-semiconductor production, and Southeast Asia is attracting backend and advanced-manufacturing investment. This combination creates demand from R&D qualification through high-volume inline inspection.

Market positionLargest region
Growth outlookHighest in market
Demand profileCapacity expansion and localization
Access gateQualification, local service and automation compatibility
Country/Market Role in region Commercial evidence
China Largest demand pool Domestic SiC substrate, epitaxy and power-device projects are expanding the addressable tool base. Buyers increasingly evaluate inspection sensitivity, throughput and local service together because new fabs need rapid recipe development and production support rather than laboratory-only measurement capability.
Japan High-value technology market Long-standing expertise in wafers, ceramics, optics and semiconductor equipment supports demanding metrology requirements. Supplier selection emphasizes repeatability, clean automation, long-term support and integration with established process-control practices.
South Korea Fast capacity expansion onsemi’s completed SiC facility expansion in Bucheon illustrates the region’s move toward larger power-semiconductor manufacturing footprints. New production raises requirements for incoming wafer control, process metrology and final defect screening.

200 mm manufacturing transition

Infineon reported in February 2025 that the first customer products based on its 200 mm SiC technology were being manufactured, with manufacturing activities linked to Villach and Kulim. Larger wafers increase the amount of die exposed to a single material or process excursion, making wafer-wide defect maps, geometry control and stable high-throughput inspection more valuable to production economics.

South Korea capacity expansion

onsemi completed an expansion of its silicon carbide production facility in Bucheon, South Korea, adding manufacturing scale for SiC power products. A larger installed manufacturing base creates recurring inspection demand across substrate acceptance, epitaxy, front-end device processing and process monitoring, while also raising the importance of service response and recipe transfer across multiple production lines.

Japan equipment ecosystem

Japan combines major semiconductor-equipment suppliers with mature precision optics, materials and automation capabilities. For SiC inspection vendors, this produces a demanding customer environment where measurement correlation, uptime and contamination control can matter as much as nominal sensitivity, particularly when tools are qualified into long-lived automotive and industrial power-semiconductor programs.

The full report evaluates country-level demand, supplier positioning, application mix, technology transitions and commercial entry conditions across this region.

Europe VERTICALLY INTEGRATED GROWTH

What defines the Europe market?

Europe’s market is shaped by vertically integrated power-semiconductor strategies and industrial-policy support rather than by the sheer number of fabs. STMicroelectronics is building a fully integrated SiC campus in Catania, while Infineon is scaling 200 mm SiC. These programs increase the need for metrology that links substrate quality, epitaxy and device yield across tightly controlled production flows.

Market positionStrategic high-value region
Growth outlookHigh
Demand profileIntegrated SiC manufacturing
Access gateAutomotive qualification and process correlation
Country/Market Role in region Commercial evidence
Italy Major expansion hub STMicroelectronics announced a new integrated SiC manufacturing campus in Catania designed around 200 mm technology, linking substrate development, epitaxy, device fabrication and related manufacturing. This vertically integrated structure favors metrology platforms that can provide consistent data across multiple process stages.
Austria Power semiconductor center Infineon’s Villach activities are central to its power-semiconductor manufacturing network and its 200 mm SiC transition. Equipment vendors must support high-volume production, stringent automotive quality requirements and cross-site process matching.
Germany Engineering and equipment demand Germany’s automotive, industrial and power-electronics base drives qualification and application engineering for SiC devices. Metrology demand often follows reliability, traceability and advanced-packaging requirements even when wafer fabrication occurs elsewhere in Europe.

STMicroelectronics Catania campus

STMicroelectronics announced in May 2024 a new high-volume 200 mm silicon carbide manufacturing facility and broader SiC campus in Catania, with a program valued at about EUR 5 billion and production targeted from 2026. Such vertical integration increases the number of points where substrate, epitaxy and device data can be correlated, strengthening the value of interoperable inspection platforms.

European 200 mm qualification

The transition from 150 mm to 200 mm SiC requires fresh qualification of wafer handling, edge exclusion, defect sensitivity and geometry measurement. European automotive and industrial customers also demand long product lifecycles, so equipment suppliers gain an advantage when they can demonstrate measurement stability and service continuity over extended production programs.

Automotive quality requirements

Europe’s strong automotive power-electronics base makes defect escape particularly costly because SiC MOSFETs and diodes are used in traction inverters, onboard chargers and high-voltage systems. The commercial implication is sustained spending on inspection steps that can reduce latent-defect risk and document process capability rather than only maximize raw wafer throughput.

The full report evaluates country-level demand, supplier positioning, application mix, technology transitions and commercial entry conditions across this region.

North America MATERIALS AND TECHNOLOGY LED

What defines the North America market?

North America is driven by advanced SiC materials, domestic power-semiconductor capacity and a strong process-control supplier base. Wolfspeed’s commercial launch of 200 mm SiC materials broadens access to larger-diameter substrates, while U.S. semiconductor investment supports additional device capacity. Buyers place high value on analytics, automation interfaces and rapid application support during technology ramps.

Market positionTechnology-led region
Growth outlookHigh
Demand profileMaterials scale-up and domestic fabs
Access gateYield correlation and service depth
Country/Market Role in region Commercial evidence
United States Regional anchor Wolfspeed’s 200 mm material commercialization and domestic SiC manufacturing footprint make the United States the primary regional demand center. Inspection requirements span substrate quality, epitaxy, device-fab process control and failure analysis.
Canada Research and specialty demand University, photonics and power-electronics programs create smaller but technically demanding opportunities for flexible metrology tools. Purchases favor broad measurement capability and research support over the throughput requirements of a volume fab.
Mexico Downstream electronics linkage Electronics and automotive manufacturing support downstream demand for SiC-based power systems. Direct wafer-metrology demand remains limited, but regional supply-chain localization can increase engineering and quality-control requirements over time.

Wolfspeed 200 mm materials launch

Wolfspeed announced the commercial launch of a 200 mm silicon carbide materials portfolio in September 2025. Commercial substrate availability is a prerequisite for broad 200 mm device scaling, and it creates new inspection demand because customers must characterize larger surfaces, manage wafer geometry and confirm defect performance before committing expensive epitaxy and device processing.

Process-control supplier depth

KLA’s portfolio includes wafer inspection, metrology and wafer-geometry platforms used across semiconductor manufacturing, while its historical filings discuss compound-semiconductor and SiC inspection applications. This local supplier depth accelerates application development because tool makers can work directly with materials and device customers during recipe creation and production qualification.

Domestic semiconductor investment

U.S. semiconductor policy and private capital spending are increasing domestic fab and materials investment. Although not every new fab processes SiC, the broader investment expands the local engineering, automation and service ecosystem that inspection suppliers use to support wide-bandgap customers, reducing adoption friction for high-value tools.

The full report evaluates country-level demand, supplier positioning, application mix, technology transitions and commercial entry conditions across this region.

South America NICHE AND IMPORT LED

What defines the South America market?

South America remains a comparatively small market for production-grade SiC metrology because the region has limited front-end SiC wafer fabrication. Demand is concentrated in research institutions, power-electronics development, universities and imported device supply chains. Commercial opportunities therefore favor versatile instruments, distributor support and shared laboratory use rather than dedicated high-throughput inline systems.

Market positionNiche region
Growth outlookModerate
Demand profileResearch and imported technology
Access gateDistributor coverage and total cost
Country/Market Role in region Commercial evidence
Brazil Largest regional opportunity Brazil’s university system, industrial electronics base and renewable-energy deployment support research and reliability work around wide-bandgap power devices. Tool demand is more likely to come from laboratories and engineering centers than from high-volume SiC wafer fabs.
Argentina Research-led Semiconductor and materials activity is primarily academic and institutional. Flexible microscopy, surface metrology and characterization systems are more relevant than specialized high-throughput production inspection.
Chile Application-driven Renewable energy, mining electrification and power conversion create downstream interest in SiC performance. Direct wafer inspection remains limited, but application laboratories can require materials and device characterization capability.

Research-centered procurement

Because the region lacks a large installed base of SiC substrate and epitaxy lines, purchasing decisions prioritize tool flexibility, serviceability and the ability to support multiple research programs. Vendors can compete through modular configurations and local applications support instead of the factory automation packages demanded by high-volume Asian fabs.

Power-electronics pull

Solar, wind, mining and industrial electrification expand the use cases for high-efficiency power semiconductors. That downstream pull does not automatically create wafer-fab equipment demand, but it supports device qualification, reliability testing and university-industry research that can justify selective metrology purchases.

Import dependence

Most advanced inspection platforms and specialized SiC materials are imported, exposing buyers to currency, freight, service and spare-parts constraints. Suppliers with regional distributors and remote diagnostic capability can reduce total ownership risk, which is often more decisive than marginal improvements in measurement performance.

The full report evaluates country-level demand, supplier positioning, application mix, technology transitions and commercial entry conditions across this region.

Middle East & Africa PROJECT-LED EMERGING

What defines the Middle East & Africa market?

Middle East and Africa demand is project-led and concentrated in countries building semiconductor research, advanced-manufacturing and technology-diversification capabilities. The addressable market is smaller than in established wafer-producing regions, yet greenfield laboratories can adopt current-generation metrology without carrying legacy platforms. Vendors benefit when they combine training, applications support and long-term service commitments.

Market positionEmerging region
Growth outlookSelective
Demand profileGreenfield research and diversification
Access gateLocal partnerships and service
Country/Market Role in region Commercial evidence
Israel Technology and R&D hub A mature semiconductor design and manufacturing ecosystem supports advanced materials and device research. Purchases emphasize technical capability and integration with established semiconductor development workflows.
United Arab Emirates Investment-led opportunity Technology diversification programs and research institutions support selective demand for advanced semiconductor characterization equipment. Greenfield projects can favor modern automation and data systems from the outset.
Saudi Arabia Emerging research market Industrial diversification and university research create early-stage opportunities in power electronics and materials science. Supplier success depends on training, local support and project execution rather than installed-base replacement.

Greenfield laboratory advantage

New research laboratories can specify automated wafer handling, digital data capture and current software interfaces without maintaining legacy compatibility. For metrology suppliers this can create attractive high-value projects, although volumes remain lower and procurement cycles longer than in established manufacturing regions.

Energy and power-electronics relevance

The region’s solar generation, grid modernization, data infrastructure and industrial projects create a strong application case for efficient power conversion. As local research moves toward wide-bandgap devices, demand can expand from general materials characterization into more specialized SiC wafer and epitaxy inspection.

Service as a market-access requirement

Specialized inspection equipment needs calibration, applications engineering and rapid troubleshooting. Limited local installed bases make service coverage a purchasing gate, so vendors often need distributor or partner networks that can provide first-line support and coordinate factory specialists when production or research schedules are at risk.

The full report evaluates country-level demand, supplier positioning, application mix, technology transitions and commercial entry conditions across this region.

Key SiC Metrology and Inspection Equipment Manufacturers and Competitive Landscape

Competition is split between broad semiconductor process-control leaders and specialized inspection or metrology suppliers. Large vendors can leverage installed service networks, automation platforms and relationships with global device makers, while specialists compete through defect-specific optics, faster application development and lower cost. Production wins depend on correlation to yield, repeatability and service response more than on a single headline resolution number.

KLA occupies a strong position because its semiconductor process-control portfolio spans defect inspection, metrology, wafer geometry and analytics. That breadth matters in SiC because customers increasingly want to connect substrate, epitaxy and device-process data rather than operate isolated tools. Lasertec, Onto Innovation, ZEISS, Camtek, Bruker and Japanese equipment suppliers bring complementary inspection, optical and measurement capabilities, while Chinese suppliers are expanding rapidly alongside domestic SiC capacity.

The commercial barrier to entry is production qualification. A new supplier may demonstrate excellent detection in a laboratory comparison yet still face months of work to build defect libraries, establish wafer-handling reliability, tune nuisance suppression and show correlation with downstream electrical results. Once qualified, a tool becomes embedded in process recipes and statistical-control procedures. This creates meaningful switching costs and supports recurring revenue from service, upgrades, software and application support.

The 200 mm transition creates a window for share movement because customers must qualify new handling, recipes and process windows. Incumbents benefit from installed relationships, but a technology change can reopen purchasing decisions when existing tools cannot maintain sensitivity or throughput at the larger diameter. Suppliers that combine 200 mm readiness with local engineering resources in China, Japan, South Korea, Europe and the United States are best positioned to convert technology ramps into sustained production placements.

Tier structure

Competitive tier Representative companies How they compete
Broad process-control leaders KLA Corporation; Applied Materials; Onto Innovation Compete through broad semiconductor installed bases, factory automation, analytics, application engineering and the ability to connect SiC measurements with wider process-control workflows. Their advantage is strongest at customers that value multi-site support and long-term platform continuity.
Inspection and optical specialists Lasertec; ZEISS; Camtek; Hitachi High-Technologies; SCREEN; Bruker Compete through specialized optical architectures, surface and defect expertise, precision measurement and application-specific solutions. These suppliers can win where a particular defect class or surface parameter requires a dedicated approach that general-purpose platforms cannot address efficiently.
Regional and emerging specialists TASMIT; LAZIN; EtaMax; Angkun Vision; Spirox; Shenzhen Glint Vision; CASI Vision; CETC Fenghua; T-Vision.AI Benefit from proximity to fast-growing Asian customers, local service and aggressive product development. Their opportunity is strongest in new domestic fabs where cost, delivery time and on-site engineering can outweigh the installed-base advantage of larger multinational suppliers.

Key companies profiled

The companies profiled in the market include KLA Corporation, Lasertec, Tokyo Electron Ltd. (TEL), Applied Materials, Hitachi High-Technologies, Onto Innovation, SCREEN, ZEISS, Camtek, Visiontec Group, Nanotronics, TASMIT, Inc. (Toray Engineering), Bruker, LAZIN CO., LTD, EtaMax, Angkun Vision (Beijing) Technology, Spirox Corporation, Shenzhen Glint Vision, confovis GmbH, CASI Vision Technology (Luoyang) Co., Ltd., CETC Fenghua Information Equipment, and T-Vision.AI (Hangzhou) Tech Co., Ltd.. The list spans large semiconductor-equipment companies, precision-optics and metrology specialists, and emerging regional suppliers, reflecting a market in which process-control capability is distributed across several equipment categories rather than dominated by a single instrument architecture.

SiC Metrology and Inspection Equipment Production Capacity Analysis

Production capacity for SiC inspection equipment is constrained less by raw factory floor space than by precision optics, motion systems, detectors, automation modules, software engineering and applications talent. The highest-value systems require calibration, clean assembly and customer-specific process development, so suppliers scale through engineering capacity and qualified component supply as much as through conventional manufacturing expansion.

The tool supply base is concentrated in semiconductor-equipment centers in the United States, Japan, Europe and increasingly China. Critical subsystems can include high-stability stages, lasers and illumination, imaging sensors, precision optics, vibration-control components and wafer-handling robotics. A disruption in one specialized subsystem can delay finished tools even when the vendor has adequate assembly capacity. Suppliers therefore manage capacity through dual sourcing, standardized platform designs and closer coordination with strategic component partners.

Customer-side capacity is expanding faster than the historical SiC equipment base. STMicroelectronics’ planned 200 mm Catania campus, Infineon’s 200 mm transition, Wolfspeed’s commercial 200 mm material portfolio and onsemi’s expanded South Korean facility demonstrate that material and device scale is increasing across several regions. Each capacity ramp requires inspection recipes and tool availability ahead of volume output, which means metrology orders often precede full production and can be lumpy around fab construction and process qualification.

The key supply-side risk is not simply whether a vendor can ship another instrument; it is whether the vendor can install, qualify and support it quickly enough for a customer’s ramp. Applications engineers, field-service specialists and spare-part logistics therefore function as effective capacity constraints. Vendors that localize service close to Asia’s expanding SiC fabs can convert manufacturing capacity into revenue faster and reduce the downtime risk that makes customers hesitant to adopt newer platforms.

SiC Metrology and Inspection Equipment Market Dynamics: Drivers, Restraints and Opportunities

Market growth is being driven by the 200 mm SiC transition, the high cost of yield loss, greater automation and global power-semiconductor capacity investment. The same forces raise technical and commercial barriers because tools must prove production correlation, handle difficult defect physics and survive cyclical capital spending. The most attractive opportunities sit where inspection data becomes part of closed-loop process control rather than a stand-alone quality check.

MARKET DRIVERS

Driver Impact Commercial implication
200 mm SiC manufacturing transition High Larger wafers increase the economic value at risk in each process step and require fresh qualification of inspection sensitivity, wafer geometry, handling and automated recipe control.
High cost of SiC yield loss High SiC substrates and epitaxial wafers carry substantial value before device fabrication, so defect escape has a direct and visible impact on cost per good die.
Automated defect classification and traceability High Factories are moving from manual image review toward automated classification, wafer maps and linked process histories that reduce engineering time and accelerate root-cause analysis.
Power-electronics capacity expansion Medium to High New or expanded SiC device manufacturing in Asia, Europe and North America creates additional tool placements and recurring service demand.

200 mm SiC manufacturing transition

The shift from 150 mm toward 200 mm silicon carbide is changing both the technical requirement and the commercial value of process control. Infineon has reported first customer products from 200 mm SiC technology, Wolfspeed has launched 200 mm materials commercially, and STMicroelectronics is building 200 mm capability in Catania. A larger wafer carries more die and more downstream processing value, so an undetected defect or geometry excursion can destroy more value per wafer. That strengthens spending on defect inspection, surface metrology and data systems that can identify excursions before expensive device processing.

High cost of SiC yield loss

Yield economics are unusually powerful in silicon carbide because defects can originate in crystal growth, wafering, polishing, epitaxy or front-end processing and may not become electrically visible until later. Producers therefore have an incentive to screen material at multiple points rather than rely on final electrical test. Inspection vendors benefit when they can demonstrate correlation between detected defect classes and downstream yield, because that converts a metrology purchase from an engineering expense into a measurable cost-avoidance tool.

Automated defect classification and traceability

As SiC volume increases, manual review does not scale economically. Production teams need software that separates nuisance events from yield-relevant defects, classifies recurring signatures and connects wafer-level results with crystal, polishing, epitaxy and device-processing history. The strongest commercial opportunity therefore sits in systems that combine optical hardware with stable analytics and factory integration. This also raises switching costs because recipes, defect libraries and historical datasets become embedded in the customer’s yield-learning workflow.

Power-electronics capacity expansion

Investment by power-semiconductor suppliers broadens the installed base for SiC process control. onsemi’s Bucheon expansion, STMicroelectronics’ Catania campus and other vertically integrated programs add substrate, epitaxy and device-process steps that require inspection or metrology. Capacity expansion creates an initial equipment opportunity, but it also creates recurring revenue through service, calibration, software and application engineering. Vendors with global support coverage can follow customers across multiple sites and capture more lifetime value than suppliers limited to one hardware sale.

MARKET RESTRAINTS

Restraint Impact Commercial implication
Tool qualification and correlation burden High A metrology result has commercial value only when it correlates reliably with yield or process capability, which lengthens evaluation cycles and favors proven platforms.
Optical and material complexity Medium to High Wide-bandgap materials, transparent or semi-transparent layers and varied defect morphologies complicate high-speed detection and classification.
Cyclical capital spending Medium Inspection demand is tied to fab and materials expansion, so order timing can move sharply when customers delay capacity projects or digest prior equipment purchases.
Localization and price pressure Medium Regional equipment vendors are improving rapidly, particularly in China, creating competition on lead time, service and acquisition cost.

Tool qualification and correlation burden

SiC defect signatures can be material-specific and process-specific, and the same optical event may not have the same device consequence across customers. Equipment therefore requires extensive recipe development and correlation against electrical yield, destructive analysis or complementary metrology. That can delay purchase decisions and makes customers reluctant to replace a qualified tool simply for incremental performance. Suppliers must invest heavily in applications engineering and joint development to win production sockets.

Optical and material complexity

Silicon carbide presents inspection challenges that differ from conventional silicon, including crystallographic defects, surface morphology, subsurface features and contrast behavior that can depend on polytype, doping and process condition. A tool optimized for one defect class may miss another or generate excessive nuisance events. Meeting production throughput while preserving sensitivity requires specialized optics, illumination, algorithms and calibration, which increases development cost and can limit the number of suppliers able to compete at the highest performance tier.

Cyclical capital spending

The long-term SiC demand story can coexist with short-term capital-spending volatility. Automotive inventory corrections, electric-vehicle demand changes or customer qualification delays can push out equipment orders even when the underlying technology roadmap remains intact. Metrology suppliers with exposure across silicon, compound semiconductors and multiple process steps are better positioned to absorb these cycles, while narrow specialists may face greater quarterly volatility and working-capital pressure.

Localization and price pressure

China’s SiC investment has encouraged domestic suppliers to develop inspection and metrology systems tailored to local substrate and device makers. Even where leading global systems retain an advantage in sensitivity or installed-base references, local vendors can compete through faster service, local language support and lower acquisition cost. This puts pressure on premium suppliers to prove yield value rather than rely on brand recognition, and it encourages more local applications and service investment.

MARKET OPPORTUNITIES

200 mm substrate and epitaxy qualification

The transition to 200 mm creates a multiyear qualification cycle across substrate geometry, defect inspection, epitaxial thickness and surface morphology. Tool makers that secure early-development sockets can establish recipes and defect libraries before customers move to high-volume manufacturing, giving them an advantage when pilot lines expand. The commercial opportunity extends beyond hardware to automation modules, software, service contracts and cross-site matching as manufacturers replicate qualified processes.

Closed-loop process control

SiC factories increasingly need measurement data to drive process decisions rather than simply document wafer quality. Linking inspection results to polishing, epitaxy or etch recipes can shorten root-cause analysis and improve run-to-run control. Vendors that expose stable data interfaces and analytics can move from a stand-alone equipment role into the customer’s process-control architecture, increasing software value and making installed platforms harder to displace.

China localization and service expansion

China’s broad SiC investment creates an opportunity for both domestic suppliers and global vendors that can localize service, parts and applications support. New customers often require rapid recipe development because they are still stabilizing materials and processes. A supplier that can place engineers close to production sites and support local automation standards can win business even against competitors with similar nominal measurement specifications.

Compound-semiconductor platform reuse

Inspection platforms developed for SiC can often be adapted to gallium nitride, sapphire, compound semiconductor substrates and advanced packaging with changes in optics, recipes or handling. This platform leverage improves supplier economics because R&D and service infrastructure can support multiple adjacent markets. Customers also benefit when a common software environment spans several materials, creating a broader strategic opportunity than SiC-only hardware sales.

SiC Metrology and Inspection Equipment Supply Chain Analysis

Precision subsystems

Optics, illumination, detectors, stages, robotics and compute

Tool integration

Mechanical, optical and software integration with factory automation

Applications & qualification

Defect libraries, recipes, correlation and process acceptance

Fab deployment

Inline inspection, data analysis, service and lifecycle upgrades

Upstream value is concentrated in precision optical and motion components whose stability determines measurement repeatability. Semiconductor inspection platforms depend on specialized detectors, illumination, high-accuracy stages, automation and computing hardware that may come from a limited supplier base. Equipment companies reduce risk by standardizing subsystems across product families and securing strategic component relationships, but technology transitions can still create bottlenecks when a new wavelength, detector or handling architecture is required for SiC.

Tool integrators create value by turning those components into a stable measurement system that can operate in a fab environment. The integration challenge includes contamination control, vibration management, wafer handling, calibration, user software and factory communications. A platform that performs well in a laboratory but generates unstable results after thousands of wafers has limited commercial value, so reliability engineering and maintainability are central parts of the product rather than downstream service features.

Applications and qualification are the most knowledge-intensive stage. Engineers build recipes, classify defect signatures and correlate measurements with complementary analysis or electrical yield. This stage creates customer-specific intellectual property and can determine whether a tool becomes part of a production disposition rule. Because the resulting workflow is difficult to replace, successful qualification creates recurring service and upgrade opportunities and raises the lifetime value of each installed system.

Fab deployment converts equipment capability into ongoing market revenue through service contracts, software updates, replacement subsystems and additional tool placements as capacity grows. High-volume SiC customers need predictable uptime and cross-tool matching, so local service organizations are commercially important. Vendors that can support multiple customer sites and transfer qualified recipes from one fab to another are better positioned to capture follow-on orders when manufacturers replicate 200 mm production across regions.

Recent Developments in the SiC Metrology and Inspection Equipment Market

September 2025 — Wolfspeed commercialized 200 mm SiC materials

Wolfspeed announced the commercial launch of its 200 mm silicon carbide materials portfolio. The move broadens the supply base for larger-diameter SiC wafers and increases the need for production inspection of wafer geometry, surface condition and defect performance before customers commit high-value epitaxy and device processing. It also gives equipment suppliers a wider set of customers on which to qualify 200 mm handling and recipes.

Source document

February 2025 — Infineon reported first customer products on 200 mm SiC

Infineon reported the first customer products based on its 200 mm silicon carbide technology, marking a shift from development toward commercial production. For metrology suppliers, this transition validates the need for higher-throughput wafer inspection, geometry control and data systems capable of supporting volume manufacturing. It also raises the value of cross-site recipe matching as production is distributed across Infineon’s manufacturing network.

Source document

May 2024 — STMicroelectronics announced integrated 200 mm SiC campus in Catania

STMicroelectronics announced a fully integrated silicon carbide manufacturing campus in Catania centered on 200 mm technology. Integration from substrate-related activities through device manufacturing creates multiple measurement points where defect and metrology data can be linked. This structure favors equipment platforms that support traceability and common data frameworks rather than isolated inspection stations operating without process context.

Source document

South Korea — onsemi expanded SiC production in Bucheon

onsemi completed an expansion of its silicon carbide production facility in Bucheon, increasing the regional footprint for SiC power-semiconductor manufacturing. Additional production capacity raises recurring demand for wafer acceptance, process monitoring and final defect control, while also increasing the importance of local field service. The development reinforces Asia Pacific’s role as the largest addressable region for production-oriented SiC inspection equipment.

Source document

REPORT SCOPE & SEGMENTATION

Attribute Coverage
Market definition Production and development equipment used to inspect SiC substrates and epitaxial wafers for defects and to measure wafer, surface and layer characteristics relevant to process control and yield.
Base / estimate / forecast 2025 base year; 2026 estimated year; forecast through 2034.
Market size USD 1,338.15 million in 2025; USD 7,330.03 million in 2034; 20.8% CAGR during 2026–2034.
By Type SiC Defect Inspection Equipment; SiC Metrology Equipment.
By Application SiC Substrate/Wafer; SiC Epitaxial Wafer.
Regions North America; Europe; Asia Pacific; South America; Middle East & Africa.
Companies profiled KLA Corporation, Lasertec, Tokyo Electron Ltd. (TEL), Applied Materials, Hitachi High-Technologies, Onto Innovation, SCREEN, ZEISS, Camtek, Visiontec Group, Nanotronics, TASMIT, Inc. (Toray Engineering), Bruker, LAZIN CO., LTD, EtaMax, Angkun Vision (Beijing) Technology, Spirox Corporation, Shenzhen Glint Vision, confovis GmbH, CASI Vision Technology (Luoyang) Co., Ltd., CETC Fenghua Information Equipment, T-Vision.AI (Hangzhou) Tech Co., Ltd.

Frequently Asked Questions

What is the 2025 size of the SiC metrology and inspection equipment market?

The global sic metrology and inspection equipment market is valued at USD 1,338.15 million in 2025. The market is being pulled by higher inspection intensity in SiC substrate, epitaxy and power-device production, particularly as 200 mm manufacturing moves into commercial use. Because larger wafers carry more die and more cumulative process value, defect escape and geometry excursions become more expensive, strengthening the economic case for inline inspection and metrology.

What is the projected market size in 2034?

The market is projected to reach USD 7,330.03 million by 2034, corresponding to a 20.8% CAGR during 2026–2034. The expansion reflects both new equipment placements and deeper process-control intensity within existing lines. Commercial growth is therefore not dependent on a single fab cycle: it is supported by larger wafer diameters, more demanding epitaxial control, automated classification and the need to trace defects across multiple SiC manufacturing stages.

Which region leads the market?

Asia Pacific is the largest regional market in 2025 because it combines major SiC material, device and equipment ecosystems across China, Japan and South Korea with continuing semiconductor capacity investment in Southeast Asia. The region contains both established precision-equipment suppliers and fast-growing local competitors, making it the broadest market for production inspection, applications engineering and service. Europe and North America remain strategically important for 200 mm technology ramps.

Which product type has the largest market position?

SiC defect inspection equipment holds the larger product position because manufacturers must identify crystal, surface and process-related defects before additional value is added through epitaxy and device fabrication. The equipment’s commercial importance is tied to yield protection rather than visual quality alone. Systems that combine high sensitivity, low nuisance rates, rapid wafer mapping and automated defect classification are best placed to win production applications as throughput requirements rise.

Why is metrology demand increasing with 200 mm SiC?

Moving from 150 mm to 200 mm increases wafer area and the number of potential die processed on each wafer, so a geometry or uniformity excursion can affect more output at once. The transition also requires new handling, edge exclusion, recipe and process-window qualification. That increases demand for wafer geometry, surface, thickness and defect measurements that can demonstrate process stability before manufacturers commit expensive epitaxy and device-fabrication steps.

What are the main applications for these tools?

The principal applications are SiC substrate/wafer and SiC epitaxial wafer inspection and metrology. Substrate applications focus on crystal defects, polishing damage, particles, bow, warp and surface condition before epitaxy. Epitaxial applications emphasize thickness and uniformity, surface morphology and defect propagation because these parameters directly influence high-voltage device performance. Both applications increasingly use automated wafer maps and statistical process-control data.

Which companies compete in the market?

The competitive field includes KLA Corporation, Lasertec, Tokyo Electron, Applied Materials, Hitachi High-Technologies, Onto Innovation, SCREEN, ZEISS, Camtek, Bruker and a growing group of specialized Asian and European suppliers. Competition is not determined by hardware sensitivity alone. Production customers weigh throughput, nuisance-defect performance, recipe stability, automation compatibility, installed-base references and the availability of local applications engineers who can correlate measurements to yield.

What is the strongest market driver?

The strongest structural driver is the commercial transition toward 200 mm SiC manufacturing. Infineon has reported first customer products based on 200 mm SiC technology, Wolfspeed has launched a commercial 200 mm materials portfolio, and STMicroelectronics is building 200 mm capability in Catania. Each of these moves increases the need for larger-wafer handling, geometry measurement, defect inspection and process correlation across substrate, epitaxy and device manufacturing.

What are the main restraints on growth?

The main restraints are long qualification cycles, the technical complexity of SiC defect detection, capital-spending volatility and increasing price competition from regional equipment suppliers. Customers will not replace a qualified process-control tool simply because another platform has better laboratory specifications; they require demonstrated correlation to production yield and stable performance over time. That favors suppliers with strong applications engineering, reference installations and long-term service resources.

How is the competitive landscape changing?

The market is shifting from isolated measurement tools toward integrated process-control platforms that combine automated handling, inspection, classification, wafer maps, statistical analysis and factory connectivity. At the same time, regional suppliers are improving and competing on service response and acquisition cost. Leading vendors are therefore differentiating through data quality, application-specific algorithms, multi-site support and software ecosystems that become embedded in customers’ yield-learning processes.

Research Sources & Evidence Base

View research sources used for this overview.
  1. Infineon Technologies. First customer products on 200 mm SiC technology, evidence for the 200 mm silicon carbide manufacturing transition and related production scaling, February 2025.
  2. STMicroelectronics. STMicroelectronics to build the world’s first fully integrated silicon carbide facility in Italy, evidence for the 200 mm Catania SiC campus, vertical integration and planned high-volume capacity, May 2024.
  3. Wolfspeed. Commercial launch of 200 mm silicon carbide materials portfolio, evidence for commercial availability of 200 mm SiC materials and industry scaling, September 2025.
  4. onsemi. Expansion of silicon carbide production facility in Bucheon, South Korea, evidence for Asia-Pacific SiC manufacturing expansion and the regional production footprint.
  5. KLA Corporation. Annual Report / Form 10-K for fiscal 2025, evidence for KLA’s wafer inspection, metrology, wafer geometry and process-control portfolio.
  6. KLA Corporation. Annual Report / Form 10-K for fiscal 2020, evidence for compound-semiconductor inspection applications, including silicon carbide process control.
  7. SEMI. SEMI projects double-digit growth in global 300 mm fab equipment spending for 2026 and 2027, broader evidence for semiconductor fab-equipment investment, automation intensity and production expansion.
Global SiC Metrology and Inspection Equipment Market, Emerging Trends, Technological Advancements, and Business Strategies 2026-2034

Get Sample Report PDF for Exclusive Insights

Report Sample Includes

  • Table of Contents
  • List of Tables & Figures
  • Charts, Research Methodology, and more...

PDF Icon Download Sample Report PDF

Download Sample Report

Table of Content

Table of Contents
1 Research Methodology and Statistical Scope
1.1 Market Definition and Statistical Scope of SiC Metrology and Inspection Equipment
1.2 Key Market Segments
1.2.1 SiC Metrology and Inspection Equipment Segment by Type
1.2.2 SiC Metrology and Inspection Equipment Segment by Application
1.3 Methodology & Sources of Information
1.3.1 Research Methodology
1.3.2 Research Process
1.3.3 Market Breakdown and Data Triangulation
1.3.4 Base Year
1.3.5 Report Assumptions & Caveats
2 SiC Metrology and Inspection Equipment Market Overview
2.1 Global Market Overview
2.1.1 Global SiC Metrology and Inspection Equipment Market Size (M USD) Estimates and Forecasts (2026-2034)
2.1.2 Global SiC Metrology and Inspection Equipment Sales Estimates and Forecasts (2026-2034)
2.2 Market Segment Executive Summary
2.3 Global Market Size by Region
3 SiC Metrology and Inspection Equipment Market Competitive Landscape
3.1 Global SiC Metrology and Inspection Equipment Sales by Manufacturers (2019-2025)
3.2 Global SiC Metrology and Inspection Equipment Revenue Market Share by Manufacturers (2019-2025)
3.3 SiC Metrology and Inspection Equipment Market Share by Company Type (Tier 1, Tier 2, and Tier 3)
3.4 Global SiC Metrology and Inspection Equipment Average Price by Manufacturers (2019-2025)
3.5 Manufacturers SiC Metrology and Inspection Equipment Sales Sites, Area Served, Product Type
3.6 SiC Metrology and Inspection Equipment Market Competitive Situation and Trends
3.6.1 SiC Metrology and Inspection Equipment Market Concentration Rate
3.6.2 Global 5 and 10 Largest SiC Metrology and Inspection Equipment Players Market Share by Revenue
3.6.3 Mergers & Acquisitions, Expansion
4 SiC Metrology and Inspection Equipment Industry Chain Analysis
4.1 SiC Metrology and Inspection Equipment Industry Chain Analysis
4.2 Market Overview of Key Raw Materials
4.3 Midstream Market Analysis
4.4 Downstream Customer Analysis
5 The Development and Dynamics of SiC Metrology and Inspection Equipment Market
5.1 Key Development Trends
5.2 Driving Factors
5.3 Market Challenges
5.4 Market Restraints
5.5 Industry News
5.5.1 New Product Developments
5.5.2 Mergers & Acquisitions
5.5.3 Expansions
5.5.4 Collaboration/Supply Contracts
5.6 Industry Policies
6 SiC Metrology and Inspection Equipment Market Segmentation by Type
6.1 Evaluation Matrix of Segment Market Development Potential (Type)
6.2 Global SiC Metrology and Inspection Equipment Sales Market Share by Type (2019-2025)
6.3 Global SiC Metrology and Inspection Equipment Market Size Market Share by Type (2019-2025)
6.4 Global SiC Metrology and Inspection Equipment Price by Type (2019-2025)
7 SiC Metrology and Inspection Equipment Market Segmentation by Application
7.1 Evaluation Matrix of Segment Market Development Potential (Application)
7.2 Global SiC Metrology and Inspection Equipment Market Sales by Application (2019-2025)
7.3 Global SiC Metrology and Inspection Equipment Market Size (M USD) by Application (2019-2025)
7.4 Global SiC Metrology and Inspection Equipment Sales Growth Rate by Application (2019-2025)
8 SiC Metrology and Inspection Equipment Market Consumption by Region
8.1 Global SiC Metrology and Inspection Equipment Sales by Region
8.1.1 Global SiC Metrology and Inspection Equipment Sales by Region
8.1.2 Global SiC Metrology and Inspection Equipment Sales Market Share by Region
8.2 North America
8.2.1 North America SiC Metrology and Inspection Equipment Sales by Country
8.2.2 U.S.
8.2.3 Canada
8.2.4 Mexico
8.3 Europe
8.3.1 Europe SiC Metrology and Inspection Equipment Sales by Country
8.3.2 Germany
8.3.3 France
8.3.4 U.K.
8.3.5 Italy
8.3.6 Russia
8.4 Asia Pacific
8.4.1 Asia Pacific SiC Metrology and Inspection Equipment Sales by Region
8.4.2 China
8.4.3 Japan
8.4.4 South Korea
8.4.5 India
8.4.6 Southeast Asia
8.5 South America
8.5.1 South America SiC Metrology and Inspection Equipment Sales by Country
8.5.2 Brazil
8.5.3 Argentina
8.5.4 Columbia
8.6 Middle East and Africa
8.6.1 Middle East and Africa SiC Metrology and Inspection Equipment Sales by Region
8.6.2 Saudi Arabia
8.6.3 UAE
8.6.4 Egypt
8.6.5 Nigeria
8.6.6 South Africa
9 SiC Metrology and Inspection Equipment Market Production by Region
9.1 Global Production of SiC Metrology and Inspection Equipment by Region (2019-2025)
9.2 Global SiC Metrology and Inspection Equipment Revenue Market Share by Region (2019-2025)
9.3 Global SiC Metrology and Inspection Equipment Production, Revenue, Price and Gross Margin (2019-2025)
9.4 North America SiC Metrology and Inspection Equipment Production
9.4.1 North America SiC Metrology and Inspection Equipment Production Growth Rate (2019-2025)
9.4.2 North America SiC Metrology and Inspection Equipment Production, Revenue, Price and Gross Margin (2019-2025)
9.5 Europe SiC Metrology and Inspection Equipment Production
9.5.1 Europe SiC Metrology and Inspection Equipment Production Growth Rate (2019-2025)
9.5.2 Europe SiC Metrology and Inspection Equipment Production, Revenue, Price and Gross Margin (2019-2025)
9.6 Japan SiC Metrology and Inspection Equipment Production (2019-2025)
9.6.1 Japan SiC Metrology and Inspection Equipment Production Growth Rate (2019-2025)
9.6.2 Japan SiC Metrology and Inspection Equipment Production, Revenue, Price and Gross Margin (2019-2025)
9.7 China SiC Metrology and Inspection Equipment Production (2019-2025)
9.7.1 China SiC Metrology and Inspection Equipment Production Growth Rate (2019-2025)
9.7.2 China SiC Metrology and Inspection Equipment Production, Revenue, Price and Gross Margin (2019-2025)
10 Key Companies Profile
10.1 KLA Corporation
10.1.1 KLA Corporation SiC Metrology and Inspection Equipment Basic Information
10.1.2 KLA Corporation SiC Metrology and Inspection Equipment Product Overview
10.1.3 KLA Corporation SiC Metrology and Inspection Equipment Product Market Performance
10.1.4 KLA Corporation Business Overview
10.1.5 KLA Corporation SiC Metrology and Inspection Equipment SWOT Analysis
10.1.6 KLA Corporation Recent Developments
10.2 Lasertec
10.2.1 Lasertec SiC Metrology and Inspection Equipment Basic Information
10.2.2 Lasertec SiC Metrology and Inspection Equipment Product Overview
10.2.3 Lasertec SiC Metrology and Inspection Equipment Product Market Performance
10.2.4 Lasertec Business Overview
10.2.5 Lasertec SiC Metrology and Inspection Equipment SWOT Analysis
10.2.6 Lasertec Recent Developments
10.3 Tokyo Electron Ltd. (TEL)
10.3.1 Tokyo Electron Ltd. (TEL) SiC Metrology and Inspection Equipment Basic Information
10.3.2 Tokyo Electron Ltd. (TEL) SiC Metrology and Inspection Equipment Product Overview
10.3.3 Tokyo Electron Ltd. (TEL) SiC Metrology and Inspection Equipment Product Market Performance
10.3.4 Tokyo Electron Ltd. (TEL) SiC Metrology and Inspection Equipment SWOT Analysis
10.3.5 Tokyo Electron Ltd. (TEL) Business Overview
10.3.6 Tokyo Electron Ltd. (TEL) Recent Developments
10.4 Applied Materials
10.4.1 Applied Materials SiC Metrology and Inspection Equipment Basic Information
10.4.2 Applied Materials SiC Metrology and Inspection Equipment Product Overview
10.4.3 Applied Materials SiC Metrology and Inspection Equipment Product Market Performance
10.4.4 Applied Materials Business Overview
10.4.5 Applied Materials Recent Developments
10.5 Hitachi High-Technologies
10.5.1 Hitachi High-Technologies SiC Metrology and Inspection Equipment Basic Information
10.5.2 Hitachi High-Technologies SiC Metrology and Inspection Equipment Product Overview
10.5.3 Hitachi High-Technologies SiC Metrology and Inspection Equipment Product Market Performance
10.5.4 Hitachi High-Technologies Business Overview
10.5.5 Hitachi High-Technologies Recent Developments
10.6 Onto Innovation
10.6.1 Onto Innovation SiC Metrology and Inspection Equipment Basic Information
10.6.2 Onto Innovation SiC Metrology and Inspection Equipment Product Overview
10.6.3 Onto Innovation SiC Metrology and Inspection Equipment Product Market Performance
10.6.4 Onto Innovation Business Overview
10.6.5 Onto Innovation Recent Developments
10.7 SCREEN
10.7.1 SCREEN SiC Metrology and Inspection Equipment Basic Information
10.7.2 SCREEN SiC Metrology and Inspection Equipment Product Overview
10.7.3 SCREEN SiC Metrology and Inspection Equipment Product Market Performance
10.7.4 SCREEN Business Overview
10.7.5 SCREEN Recent Developments
10.8 ZEISS
10.8.1 ZEISS SiC Metrology and Inspection Equipment Basic Information
10.8.2 ZEISS SiC Metrology and Inspection Equipment Product Overview
10.8.3 ZEISS SiC Metrology and Inspection Equipment Product Market Performance
10.8.4 ZEISS Business Overview
10.8.5 ZEISS Recent Developments
10.9 Camtek
10.9.1 Camtek SiC Metrology and Inspection Equipment Basic Information
10.9.2 Camtek SiC Metrology and Inspection Equipment Product Overview
10.9.3 Camtek SiC Metrology and Inspection Equipment Product Market Performance
10.9.4 Camtek Business Overview
10.9.5 Camtek Recent Developments
10.10 Visiontec Group
10.10.1 Visiontec Group SiC Metrology and Inspection Equipment Basic Information
10.10.2 Visiontec Group SiC Metrology and Inspection Equipment Product Overview
10.10.3 Visiontec Group SiC Metrology and Inspection Equipment Product Market Performance
10.10.4 Visiontec Group Business Overview
10.10.5 Visiontec Group Recent Developments
10.11 Nanotronics
10.11.1 Nanotronics SiC Metrology and Inspection Equipment Basic Information
10.11.2 Nanotronics SiC Metrology and Inspection Equipment Product Overview
10.11.3 Nanotronics SiC Metrology and Inspection Equipment Product Market Performance
10.11.4 Nanotronics Business Overview
10.11.5 Nanotronics Recent Developments
10.12 TASMIT
10.12.1 TASMIT SiC Metrology and Inspection Equipment Basic Information
10.12.2 TASMIT SiC Metrology and Inspection Equipment Product Overview
10.12.3 TASMIT SiC Metrology and Inspection Equipment Product Market Performance
10.12.4 TASMIT Business Overview
10.12.5 TASMIT Recent Developments
10.13 Inc. (Toray Engineering)
10.13.1 Inc. (Toray Engineering) SiC Metrology and Inspection Equipment Basic Information
10.13.2 Inc. (Toray Engineering) SiC Metrology and Inspection Equipment Product Overview
10.13.3 Inc. (Toray Engineering) SiC Metrology and Inspection Equipment Product Market Performance
10.13.4 Inc. (Toray Engineering) Business Overview
10.13.5 Inc. (Toray Engineering) Recent Developments
10.14 Bruker
10.14.1 Bruker SiC Metrology and Inspection Equipment Basic Information
10.14.2 Bruker SiC Metrology and Inspection Equipment Product Overview
10.14.3 Bruker SiC Metrology and Inspection Equipment Product Market Performance
10.14.4 Bruker Business Overview
10.14.5 Bruker Recent Developments
10.15 LAZIN CO.,LTD
10.15.1 LAZIN CO.,LTD SiC Metrology and Inspection Equipment Basic Information
10.15.2 LAZIN CO.,LTD SiC Metrology and Inspection Equipment Product Overview
10.15.3 LAZIN CO.,LTD SiC Metrology and Inspection Equipment Product Market Performance
10.15.4 LAZIN CO.,LTD Business Overview
10.15.5 LAZIN CO.,LTD Recent Developments
10.16 EtaMax
10.16.1 EtaMax SiC Metrology and Inspection Equipment Basic Information
10.16.2 EtaMax SiC Metrology and Inspection Equipment Product Overview
10.16.3 EtaMax SiC Metrology and Inspection Equipment Product Market Performance
10.16.4 EtaMax Business Overview
10.16.5 EtaMax Recent Developments
10.17 Angkun Vision (Beijing) Technology
10.17.1 Angkun Vision (Beijing) Technology SiC Metrology and Inspection Equipment Basic Information
10.17.2 Angkun Vision (Beijing) Technology SiC Metrology and Inspection Equipment Product Overview
10.17.3 Angkun Vision (Beijing) Technology SiC Metrology and Inspection Equipment Product Market Performance
10.17.4 Angkun Vision (Beijing) Technology Business Overview
10.17.5 Angkun Vision (Beijing) Technology Recent Developments
10.18 Spirox Corporation
10.18.1 Spirox Corporation SiC Metrology and Inspection Equipment Basic Information
10.18.2 Spirox Corporation SiC Metrology and Inspection Equipment Product Overview
10.18.3 Spirox Corporation SiC Metrology and Inspection Equipment Product Market Performance
10.18.4 Spirox Corporation Business Overview
10.18.5 Spirox Corporation Recent Developments
10.19 Shenzhen Glint Vision
10.19.1 Shenzhen Glint Vision SiC Metrology and Inspection Equipment Basic Information
10.19.2 Shenzhen Glint Vision SiC Metrology and Inspection Equipment Product Overview
10.19.3 Shenzhen Glint Vision SiC Metrology and Inspection Equipment Product Market Performance
10.19.4 Shenzhen Glint Vision Business Overview
10.19.5 Shenzhen Glint Vision Recent Developments
10.20 confovis GmbH
10.20.1 confovis GmbH SiC Metrology and Inspection Equipment Basic Information
10.20.2 confovis GmbH SiC Metrology and Inspection Equipment Product Overview
10.20.3 confovis GmbH SiC Metrology and Inspection Equipment Product Market Performance
10.20.4 confovis GmbH Business Overview
10.20.5 confovis GmbH Recent Developments
10.21 CASI Vision Technology (Luoyang) Co.
10.21.1 CASI Vision Technology (Luoyang) Co. SiC Metrology and Inspection Equipment Basic Information
10.21.2 CASI Vision Technology (Luoyang) Co. SiC Metrology and Inspection Equipment Product Overview
10.21.3 CASI Vision Technology (Luoyang) Co. SiC Metrology and Inspection Equipment Product Market Performance
10.21.4 CASI Vision Technology (Luoyang) Co. Business Overview
10.21.5 CASI Vision Technology (Luoyang) Co. Recent Developments
10.22 Ltd
10.22.1 Ltd SiC Metrology and Inspection Equipment Basic Information
10.22.2 Ltd SiC Metrology and Inspection Equipment Product Overview
10.22.3 Ltd SiC Metrology and Inspection Equipment Product Market Performance
10.22.4 Ltd Business Overview
10.22.5 Ltd Recent Developments
10.23 CETC Fenghua Information Equipment
10.23.1 CETC Fenghua Information Equipment SiC Metrology and Inspection Equipment Basic Information
10.23.2 CETC Fenghua Information Equipment SiC Metrology and Inspection Equipment Product Overview
10.23.3 CETC Fenghua Information Equipment SiC Metrology and Inspection Equipment Product Market Performance
10.23.4 CETC Fenghua Information Equipment Business Overview
10.23.5 CETC Fenghua Information Equipment Recent Developments
10.24 T-Vision.AI (Hangzhou) Tech Co.,Ltd.
10.24.1 T-Vision.AI (Hangzhou) Tech Co.,Ltd. SiC Metrology and Inspection Equipment Basic Information
10.24.2 T-Vision.AI (Hangzhou) Tech Co.,Ltd. SiC Metrology and Inspection Equipment Product Overview
10.24.3 T-Vision.AI (Hangzhou) Tech Co.,Ltd. SiC Metrology and Inspection Equipment Product Market Performance
10.24.4 T-Vision.AI (Hangzhou) Tech Co.,Ltd. Business Overview
10.24.5 T-Vision.AI (Hangzhou) Tech Co.,Ltd. Recent Developments
11 SiC Metrology and Inspection Equipment Market Forecast by Region
11.1 Global SiC Metrology and Inspection Equipment Market Size Forecast
11.2 Global SiC Metrology and Inspection Equipment Market Forecast by Region
11.2.1 North America Market Size Forecast by Country
11.2.2 Europe SiC Metrology and Inspection Equipment Market Size Forecast by Country
11.2.3 Asia Pacific SiC Metrology and Inspection Equipment Market Size Forecast by Region
11.2.4 South America SiC Metrology and Inspection Equipment Market Size Forecast by Country
11.2.5 Middle East and Africa Forecasted Consumption of SiC Metrology and Inspection Equipment by Country
12 Forecast Market by Type and by Application (2025-2032)
12.1 Global SiC Metrology and Inspection Equipment Market Forecast by Type (2025-2032)
12.1.1 Global Forecasted Sales of SiC Metrology and Inspection Equipment by Type (2025-2032)
12.1.2 Global SiC Metrology and Inspection Equipment Market Size Forecast by Type (2025-2032)
12.1.3 Global Forecasted Price of SiC Metrology and Inspection Equipment by Type (2025-2032)
12.2 Global SiC Metrology and Inspection Equipment Market Forecast by Application (2025-2032)
12.2.1 Global SiC Metrology and Inspection Equipment Sales (K Units) Forecast by Application
12.2.2 Global SiC Metrology and Inspection Equipment Market Size (M USD) Forecast by Application (2025-2032)
13 Conclusion and Key FindingsList of Tables
Table 1. Introduction of the Type
Table 2. Introduction of the Application
Table 3. Market Size (M USD) Segment Executive Summary
Table 4. SiC Metrology and Inspection Equipment Market Size Comparison by Region (M USD)
Table 5. Global SiC Metrology and Inspection Equipment Sales (K Units) by Manufacturers (2019-2025)
Table 6. Global SiC Metrology and Inspection Equipment Sales Market Share by Manufacturers (2019-2025)
Table 7. Global SiC Metrology and Inspection Equipment Revenue (M USD) by Manufacturers (2019-2025)
Table 8. Global SiC Metrology and Inspection Equipment Revenue Share by Manufacturers (2019-2025)
Table 9. Company Type (Tier 1, Tier 2, and Tier 3) & (based on the Revenue in SiC Metrology and Inspection Equipment as of 2022)
Table 10. Global Market SiC Metrology and Inspection Equipment Average Price (USD/Unit) of Key Manufacturers (2019-2025)
Table 11. Manufacturers SiC Metrology and Inspection Equipment Sales Sites and Area Served
Table 12. Manufacturers SiC Metrology and Inspection Equipment Product Type
Table 13. Global SiC Metrology and Inspection Equipment Manufacturers Market Concentration Ratio (CR5 and HHI)
Table 14. Mergers & Acquisitions, Expansion Plans
Table 15. Industry Chain Map of SiC Metrology and Inspection Equipment
Table 16. Market Overview of Key Raw Materials
Table 17. Midstream Market Analysis
Table 18. Downstream Customer Analysis
Table 19. Key Development Trends
Table 20. Driving Factors
Table 21. SiC Metrology and Inspection Equipment Market Challenges
Table 22. Global SiC Metrology and Inspection Equipment Sales by Type (K Units)
Table 23. Global SiC Metrology and Inspection Equipment Market Size by Type (M USD)
Table 24. Global SiC Metrology and Inspection Equipment Sales (K Units) by Type (2019-2025)
Table 25. Global SiC Metrology and Inspection Equipment Sales Market Share by Type (2019-2025)
Table 26. Global SiC Metrology and Inspection Equipment Market Size (M USD) by Type (2019-2025)
Table 27. Global SiC Metrology and Inspection Equipment Market Size Share by Type (2019-2025)
Table 28. Global SiC Metrology and Inspection Equipment Price (USD/Unit) by Type (2019-2025)
Table 29. Global SiC Metrology and Inspection Equipment Sales (K Units) by Application
Table 30. Global SiC Metrology and Inspection Equipment Market Size by Application
Table 31. Global SiC Metrology and Inspection Equipment Sales by Application (2019-2025) & (K Units)
Table 32. Global SiC Metrology and Inspection Equipment Sales Market Share by Application (2019-2025)
Table 33. Global SiC Metrology and Inspection Equipment Sales by Application (2019-2025) & (M USD)
Table 34. Global SiC Metrology and Inspection Equipment Market Share by Application (2019-2025)
Table 35. Global SiC Metrology and Inspection Equipment Sales Growth Rate by Application (2019-2025)
Table 36. Global SiC Metrology and Inspection Equipment Sales by Region (2019-2025) & (K Units)
Table 37. Global SiC Metrology and Inspection Equipment Sales Market Share by Region (2019-2025)
Table 38. North America SiC Metrology and Inspection Equipment Sales by Country (2019-2025) & (K Units)
Table 39. Europe SiC Metrology and Inspection Equipment Sales by Country (2019-2025) & (K Units)
Table 40. Asia Pacific SiC Metrology and Inspection Equipment Sales by Region (2019-2025) & (K Units)
Table 41. South America SiC Metrology and Inspection Equipment Sales by Country (2019-2025) & (K Units)
Table 42. Middle East and Africa SiC Metrology and Inspection Equipment Sales by Region (2019-2025) & (K Units)
Table 43. Global SiC Metrology and Inspection Equipment Production (K Units) by Region (2019-2025)
Table 44. Global SiC Metrology and Inspection Equipment Revenue (US$ Million) by Region (2019-2025)
Table 45. Global SiC Metrology and Inspection Equipment Revenue Market Share by Region (2019-2025)
Table 46. Global SiC Metrology and Inspection Equipment Production (K Units), Revenue (US$ Million), Price (USD/Unit) and Gross Margin (2019-2025)
Table 47. North America SiC Metrology and Inspection Equipment Production (K Units), Revenue (US$ Million), Price (USD/Unit) and Gross Margin (2019-2025)
Table 48. Europe SiC Metrology and Inspection Equipment Production (K Units), Revenue (US$ Million), Price (USD/Unit) and Gross Margin (2019-2025)
Table 49. Japan SiC Metrology and Inspection Equipment Production (K Units), Revenue (US$ Million), Price (USD/Unit) and Gross Margin (2019-2025)
Table 50. China SiC Metrology and Inspection Equipment Production (K Units), Revenue (US$ Million), Price (USD/Unit) and Gross Margin (2019-2025)
Table 51. KLA Corporation SiC Metrology and Inspection Equipment Basic Information
Table 52. KLA Corporation SiC Metrology and Inspection Equipment Product Overview
Table 53. KLA Corporation SiC Metrology and Inspection Equipment Sales (K Units), Revenue (M USD), Price (USD/Unit) and Gross Margin (2019-2025)
Table 54. KLA Corporation Business Overview
Table 55. KLA Corporation SiC Metrology and Inspection Equipment SWOT Analysis
Table 56. KLA Corporation Recent Developments
Table 57. Lasertec SiC Metrology and Inspection Equipment Basic Information
Table 58. Lasertec SiC Metrology and Inspection Equipment Product Overview
Table 59. Lasertec SiC Metrology and Inspection Equipment Sales (K Units), Revenue (M USD), Price (USD/Unit) and Gross Margin (2019-2025)
Table 60. Lasertec Business Overview
Table 61. Lasertec SiC Metrology and Inspection Equipment SWOT Analysis
Table 62. Lasertec Recent Developments
Table 63. Tokyo Electron Ltd. (TEL) SiC Metrology and Inspection Equipment Basic Information
Table 64. Tokyo Electron Ltd. (TEL) SiC Metrology and Inspection Equipment Product Overview
Table 65. Tokyo Electron Ltd. (TEL) SiC Metrology and Inspection Equipment Sales (K Units), Revenue (M USD), Price (USD/Unit) and Gross Margin (2019-2025)
Table 66. Tokyo Electron Ltd. (TEL) SiC Metrology and Inspection Equipment SWOT Analysis
Table 67. Tokyo Electron Ltd. (TEL) Business Overview
Table 68. Tokyo Electron Ltd. (TEL) Recent Developments
Table 69. Applied Materials SiC Metrology and Inspection Equipment Basic Information
Table 70. Applied Materials SiC Metrology and Inspection Equipment Product Overview
Table 71. Applied Materials SiC Metrology and Inspection Equipment Sales (K Units), Revenue (M USD), Price (USD/Unit) and Gross Margin (2019-2025)
Table 72. Applied Materials Business Overview
Table 73. Applied Materials Recent Developments
Table 74. Hitachi High-Technologies SiC Metrology and Inspection Equipment Basic Information
Table 75. Hitachi High-Technologies SiC Metrology and Inspection Equipment Product Overview
Table 76. Hitachi High-Technologies SiC Metrology and Inspection Equipment Sales (K Units), Revenue (M USD), Price (USD/Unit) and Gross Margin (2019-2025)
Table 77. Hitachi High-Technologies Business Overview
Table 78. Hitachi High-Technologies Recent Developments
Table 79. Onto Innovation SiC Metrology and Inspection Equipment Basic Information
Table 80. Onto Innovation SiC Metrology and Inspection Equipment Product Overview
Table 81. Onto Innovation SiC Metrology and Inspection Equipment Sales (K Units), Revenue (M USD), Price (USD/Unit) and Gross Margin (2019-2025)
Table 82. Onto Innovation Business Overview
Table 83. Onto Innovation Recent Developments
Table 84. SCREEN SiC Metrology and Inspection Equipment Basic Information
Table 85. SCREEN SiC Metrology and Inspection Equipment Product Overview
Table 86. SCREEN SiC Metrology and Inspection Equipment Sales (K Units), Revenue (M USD), Price (USD/Unit) and Gross Margin (2019-2025)
Table 87. SCREEN Business Overview
Table 88. SCREEN Recent Developments
Table 89. ZEISS SiC Metrology and Inspection Equipment Basic Information
Table 90. ZEISS SiC Metrology and Inspection Equipment Product Overview
Table 91. ZEISS SiC Metrology and Inspection Equipment Sales (K Units), Revenue (M USD), Price (USD/Unit) and Gross Margin (2019-2025)
Table 92. ZEISS Business Overview
Table 93. ZEISS Recent Developments
Table 94. Camtek SiC Metrology and Inspection Equipment Basic Information
Table 95. Camtek SiC Metrology and Inspection Equipment Product Overview
Table 96. Camtek SiC Metrology and Inspection Equipment Sales (K Units), Revenue (M USD), Price (USD/Unit) and Gross Margin (2019-2025)
Table 97. Camtek Business Overview
Table 98. Camtek Recent Developments
Table 99. Visiontec Group SiC Metrology and Inspection Equipment Basic Information
Table 100. Visiontec Group SiC Metrology and Inspection Equipment Product Overview
Table 101. Visiontec Group SiC Metrology and Inspection Equipment Sales (K Units), Revenue (M USD), Price (USD/Unit) and Gross Margin (2019-2025)
Table 102. Visiontec Group Business Overview
Table 103. Visiontec Group Recent Developments
Table 104. Nanotronics SiC Metrology and Inspection Equipment Basic Information
Table 105. Nanotronics SiC Metrology and Inspection Equipment Product Overview
Table 106. Nanotronics SiC Metrology and Inspection Equipment Sales (K Units), Revenue (M USD), Price (USD/Unit) and Gross Margin (2019-2025)
Table 107. Nanotronics Business Overview
Table 108. Nanotronics Recent Developments
Table 109. TASMIT SiC Metrology and Inspection Equipment Basic Information
Table 110. TASMIT SiC Metrology and Inspection Equipment Product Overview
Table 111. TASMIT SiC Metrology and Inspection Equipment Sales (K Units), Revenue (M USD), Price (USD/Unit) and Gross Margin (2019-2025)
Table 112. TASMIT Business Overview
Table 113. TASMIT Recent Developments
Table 114. Inc. (Toray Engineering) SiC Metrology and Inspection Equipment Basic Information
Table 115. Inc. (Toray Engineering) SiC Metrology and Inspection Equipment Product Overview
Table 116. Inc. (Toray Engineering) SiC Metrology and Inspection Equipment Sales (K Units), Revenue (M USD), Price (USD/Unit) and Gross Margin (2019-2025)
Table 117. Inc. (Toray Engineering) Business Overview
Table 118. Inc. (Toray Engineering) Recent Developments
Table 119. Bruker SiC Metrology and Inspection Equipment Basic Information
Table 120. Bruker SiC Metrology and Inspection Equipment Product Overview
Table 121. Bruker SiC Metrology and Inspection Equipment Sales (K Units), Revenue (M USD), Price (USD/Unit) and Gross Margin (2019-2025)
Table 122. Bruker Business Overview
Table 123. Bruker Recent Developments
Table 124. LAZIN CO.,LTD SiC Metrology and Inspection Equipment Basic Information
Table 125. LAZIN CO.,LTD SiC Metrology and Inspection Equipment Product Overview
Table 126. LAZIN CO.,LTD SiC Metrology and Inspection Equipment Sales (K Units), Revenue (M USD), Price (USD/Unit) and Gross Margin (2019-2025)
Table 127. LAZIN CO.,LTD Business Overview
Table 128. LAZIN CO.,LTD Recent Developments
Table 129. EtaMax SiC Metrology and Inspection Equipment Basic Information
Table 130. EtaMax SiC Metrology and Inspection Equipment Product Overview
Table 131. EtaMax SiC Metrology and Inspection Equipment Sales (K Units), Revenue (M USD), Price (USD/Unit) and Gross Margin (2019-2025)
Table 132. EtaMax Business Overview
Table 133. EtaMax Recent Developments
Table 134. Angkun Vision (Beijing) Technology SiC Metrology and Inspection Equipment Basic Information
Table 135. Angkun Vision (Beijing) Technology SiC Metrology and Inspection Equipment Product Overview
Table 136. Angkun Vision (Beijing) Technology SiC Metrology and Inspection Equipment Sales (K Units), Revenue (M USD), Price (USD/Unit) and Gross Margin (2019-2025)
Table 137. Angkun Vision (Beijing) Technology Business Overview
Table 138. Angkun Vision (Beijing) Technology Recent Developments
Table 139. Spirox Corporation SiC Metrology and Inspection Equipment Basic Information
Table 140. Spirox Corporation SiC Metrology and Inspection Equipment Product Overview
Table 141. Spirox Corporation SiC Metrology and Inspection Equipment Sales (K Units), Revenue (M USD), Price (USD/Unit) and Gross Margin (2019-2025)
Table 142. Spirox Corporation Business Overview
Table 143. Spirox Corporation Recent Developments
Table 144. Shenzhen Glint Vision SiC Metrology and Inspection Equipment Basic Information
Table 145. Shenzhen Glint Vision SiC Metrology and Inspection Equipment Product Overview
Table 146. Shenzhen Glint Vision SiC Metrology and Inspection Equipment Sales (K Units), Revenue (M USD), Price (USD/Unit) and Gross Margin (2019-2025)
Table 147. Shenzhen Glint Vision Business Overview
Table 148. Shenzhen Glint Vision Recent Developments
Table 149. confovis GmbH SiC Metrology and Inspection Equipment Basic Information
Table 150. confovis GmbH SiC Metrology and Inspection Equipment Product Overview
Table 151. confovis GmbH SiC Metrology and Inspection Equipment Sales (K Units), Revenue (M USD), Price (USD/Unit) and Gross Margin (2019-2025)
Table 152. confovis GmbH Business Overview
Table 153. confovis GmbH Recent Developments
Table 154. CASI Vision Technology (Luoyang) Co. SiC Metrology and Inspection Equipment Basic Information
Table 155. CASI Vision Technology (Luoyang) Co. SiC Metrology and Inspection Equipment Product Overview
Table 156. CASI Vision Technology (Luoyang) Co. SiC Metrology and Inspection Equipment Sales (K Units), Revenue (M USD), Price (USD/Unit) and Gross Margin (2019-2025)
Table 157. CASI Vision Technology (Luoyang) Co. Business Overview
Table 158. CASI Vision Technology (Luoyang) Co. Recent Developments
Table 159. Ltd SiC Metrology and Inspection Equipment Basic Information
Table 160. Ltd SiC Metrology and Inspection Equipment Product Overview
Table 161. Ltd SiC Metrology and Inspection Equipment Sales (K Units), Revenue (M USD), Price (USD/Unit) and Gross Margin (2019-2025)
Table 162. Ltd Business Overview
Table 163. Ltd Recent Developments
Table 164. CETC Fenghua Information Equipment SiC Metrology and Inspection Equipment Basic Information
Table 165. CETC Fenghua Information Equipment SiC Metrology and Inspection Equipment Product Overview
Table 166. CETC Fenghua Information Equipment SiC Metrology and Inspection Equipment Sales (K Units), Revenue (M USD), Price (USD/Unit) and Gross Margin (2019-2025)
Table 167. CETC Fenghua Information Equipment Business Overview
Table 168. CETC Fenghua Information Equipment Recent Developments
Table 169. T-Vision.AI (Hangzhou) Tech Co.,Ltd. SiC Metrology and Inspection Equipment Basic Information
Table 170. T-Vision.AI (Hangzhou) Tech Co.,Ltd. SiC Metrology and Inspection Equipment Product Overview
Table 171. T-Vision.AI (Hangzhou) Tech Co.,Ltd. SiC Metrology and Inspection Equipment Sales (K Units), Revenue (M USD), Price (USD/Unit) and Gross Margin (2019-2025)
Table 172. T-Vision.AI (Hangzhou) Tech Co.,Ltd. Business Overview
Table 173. T-Vision.AI (Hangzhou) Tech Co.,Ltd. Recent Developments
Table 174. Global SiC Metrology and Inspection Equipment Sales Forecast by Region (2025-2032) & (K Units)
Table 175. Global SiC Metrology and Inspection Equipment Market Size Forecast by Region (2025-2032) & (M USD)
Table 176. North America SiC Metrology and Inspection Equipment Sales Forecast by Country (2025-2032) & (K Units)
Table 177. North America SiC Metrology and Inspection Equipment Market Size Forecast by Country (2025-2032) & (M USD)
Table 178. Europe SiC Metrology and Inspection Equipment Sales Forecast by Country (2025-2032) & (K Units)
Table 179. Europe SiC Metrology and Inspection Equipment Market Size Forecast by Country (2025-2032) & (M USD)
Table 180. Asia Pacific SiC Metrology and Inspection Equipment Sales Forecast by Region (2025-2032) & (K Units)
Table 181. Asia Pacific SiC Metrology and Inspection Equipment Market Size Forecast by Region (2025-2032) & (M USD)
Table 182. South America SiC Metrology and Inspection Equipment Sales Forecast by Country (2025-2032) & (K Units)
Table 183. South America SiC Metrology and Inspection Equipment Market Size Forecast by Country (2025-2032) & (M USD)
Table 184. Middle East and Africa SiC Metrology and Inspection Equipment Consumption Forecast by Country (2025-2032) & (Units)
Table 185. Middle East and Africa SiC Metrology and Inspection Equipment Market Size Forecast by Country (2025-2032) & (M USD)
Table 186. Global SiC Metrology and Inspection Equipment Sales Forecast by Type (2025-2032) & (K Units)
Table 187. Global SiC Metrology and Inspection Equipment Market Size Forecast by Type (2025-2032) & (M USD)
Table 188. Global SiC Metrology and Inspection Equipment Price Forecast by Type (2025-2032) & (USD/Unit)
Table 189. Global SiC Metrology and Inspection Equipment Sales (K Units) Forecast by Application (2025-2032)
Table 190. Global SiC Metrology and Inspection Equipment Market Size Forecast by Application (2025-2032) & (M USD)
List of Figures
Figure 1. Product Picture of SiC Metrology and Inspection Equipment
Figure 2. Data Triangulation
Figure 3. Key Caveats
Figure 4. Global SiC Metrology and Inspection Equipment Market Size (M USD), 2026-2034
Figure 5. Global SiC Metrology and Inspection Equipment Market Size (M USD) (2026-2034)
Figure 6. Global SiC Metrology and Inspection Equipment Sales (K Units) & (2026-2034)
Figure 7. Evaluation Matrix of Segment Market Development Potential (Type)
Figure 8. Evaluation Matrix of Segment Market Development Potential (Application)
Figure 9. Evaluation Matrix of Regional Market Development Potential
Figure 10. SiC Metrology and Inspection Equipment Market Size by Country (M USD)
Figure 11. SiC Metrology and Inspection Equipment Sales Share by Manufacturers in 2023
Figure 12. Global SiC Metrology and Inspection Equipment Revenue Share by Manufacturers in 2023
Figure 13. SiC Metrology and Inspection Equipment Market Share by Company Type (Tier 1, Tier 2 and Tier 3): 2023
Figure 14. Global Market SiC Metrology and Inspection Equipment Average Price (USD/Unit) of Key Manufacturers in 2023
Figure 15. The Global 5 and 10 Largest Players: Market Share by SiC Metrology and Inspection Equipment Revenue in 2023
Figure 16. Evaluation Matrix of Segment Market Development Potential (Type)
Figure 17. Global SiC Metrology and Inspection Equipment Market Share by Type
Figure 18. Sales Market Share of SiC Metrology and Inspection Equipment by Type (2019-2025)
Figure 19. Sales Market Share of SiC Metrology and Inspection Equipment by Type in 2023
Figure 20. Market Size Share of SiC Metrology and Inspection Equipment by Type (2019-2025)
Figure 21. Market Size Market Share of SiC Metrology and Inspection Equipment by Type in 2023
Figure 22. Evaluation Matrix of Segment Market Development Potential (Application)
Figure 23. Global SiC Metrology and Inspection Equipment Market Share by Application
Figure 24. Global SiC Metrology and Inspection Equipment Sales Market Share by Application (2019-2025)
Figure 25. Global SiC Metrology and Inspection Equipment Sales Market Share by Application in 2023
Figure 26. Global SiC Metrology and Inspection Equipment Market Share by Application (2019-2025)
Figure 27. Global SiC Metrology and Inspection Equipment Market Share by Application in 2023
Figure 28. Global SiC Metrology and Inspection Equipment Sales Growth Rate by Application (2019-2025)
Figure 29. Global SiC Metrology and Inspection Equipment Sales Market Share by Region (2019-2025)
Figure 30. North America SiC Metrology and Inspection Equipment Sales and Growth Rate (2019-2025) & (K Units)
Figure 31. North America SiC Metrology and Inspection Equipment Sales Market Share by Country in 2023
Figure 32. U.S. SiC Metrology and Inspection Equipment Sales and Growth Rate (2019-2025) & (K Units)
Figure 33. Canada SiC Metrology and Inspection Equipment Sales (K Units) and Growth Rate (2019-2025)
Figure 34. Mexico SiC Metrology and Inspection Equipment Sales (Units) and Growth Rate (2019-2025)
Figure 35. Europe SiC Metrology and Inspection Equipment Sales and Growth Rate (2019-2025) & (K Units)
Figure 36. Europe SiC Metrology and Inspection Equipment Sales Market Share by Country in 2023
Figure 37. Germany SiC Metrology and Inspection Equipment Sales and Growth Rate (2019-2025) & (K Units)
Figure 38. France SiC Metrology and Inspection Equipment Sales and Growth Rate (2019-2025) & (K Units)
Figure 39. U.K. SiC Metrology and Inspection Equipment Sales and Growth Rate (2019-2025) & (K Units)
Figure 40. Italy SiC Metrology and Inspection Equipment Sales and Growth Rate (2019-2025) & (K Units)
Figure 41. Russia SiC Metrology and Inspection Equipment Sales and Growth Rate (2019-2025) & (K Units)
Figure 42. Asia Pacific SiC Metrology and Inspection Equipment Sales and Growth Rate (K Units)
Figure 43. Asia Pacific SiC Metrology and Inspection Equipment Sales Market Share by Region in 2023
Figure 44. China SiC Metrology and Inspection Equipment Sales and Growth Rate (2019-2025) & (K Units)
Figure 45. Japan SiC Metrology and Inspection Equipment Sales and Growth Rate (2019-2025) & (K Units)
Figure 46. South Korea SiC Metrology and Inspection Equipment Sales and Growth Rate (2019-2025) & (K Units)
Figure 47. India SiC Metrology and Inspection Equipment Sales and Growth Rate (2019-2025) & (K Units)
Figure 48. Southeast Asia SiC Metrology and Inspection Equipment Sales and Growth Rate (2019-2025) & (K Units)
Figure 49. South America SiC Metrology and Inspection Equipment Sales and Growth Rate (K Units)
Figure 50. South America SiC Metrology and Inspection Equipment Sales Market Share by Country in 2023
Figure 51. Brazil SiC Metrology and Inspection Equipment Sales and Growth Rate (2019-2025) & (K Units)
Figure 52. Argentina SiC Metrology and Inspection Equipment Sales and Growth Rate (2019-2025) & (K Units)
Figure 53. Columbia SiC Metrology and Inspection Equipment Sales and Growth Rate (2019-2025) & (K Units)
Figure 54. Middle East and Africa SiC Metrology and Inspection Equipment Sales and Growth Rate (K Units)
Figure 55. Middle East and Africa SiC Metrology and Inspection Equipment Sales Market Share by Region in 2023
Figure 56. Saudi Arabia SiC Metrology and Inspection Equipment Sales and Growth Rate (2019-2025) & (K Units)
Figure 57. UAE SiC Metrology and Inspection Equipment Sales and Growth Rate (2019-2025) & (K Units)
Figure 58. Egypt SiC Metrology and Inspection Equipment Sales and Growth Rate (2019-2025) & (K Units)
Figure 59. Nigeria SiC Metrology and Inspection Equipment Sales and Growth Rate (2019-2025) & (K Units)
Figure 60. South Africa SiC Metrology and Inspection Equipment Sales and Growth Rate (2019-2025) & (K Units)
Figure 61. Global SiC Metrology and Inspection Equipment Production Market Share by Region (2019-2025)
Figure 62. North America SiC Metrology and Inspection Equipment Production (K Units) Growth Rate (2019-2025)
Figure 63. Europe SiC Metrology and Inspection Equipment Production (K Units) Growth Rate (2019-2025)
Figure 64. Japan SiC Metrology and Inspection Equipment Production (K Units) Growth Rate (2019-2025)
Figure 65. China SiC Metrology and Inspection Equipment Production (K Units) Growth Rate (2019-2025)
Figure 66. Global SiC Metrology and Inspection Equipment Sales Forecast by Volume (2026-2034) & (K Units)
Figure 67. Global SiC Metrology and Inspection Equipment Market Size Forecast by Value (2026-2034) & (M USD)
Figure 68. Global SiC Metrology and Inspection Equipment Sales Market Share Forecast by Type (2025-2032)
Figure 69. Global SiC Metrology and Inspection Equipment Market Share Forecast by Type (2025-2032)
Figure 70. Global SiC Metrology and Inspection Equipment Sales Forecast by Application (2025-2032)
Figure 71. Global SiC Metrology and Inspection Equipment Market Share Forecast by Application (2025-2032)