Global Semiconductor OHT (Overhead Hoist Transport) Market, Trends, Business Strategies 2026-2034

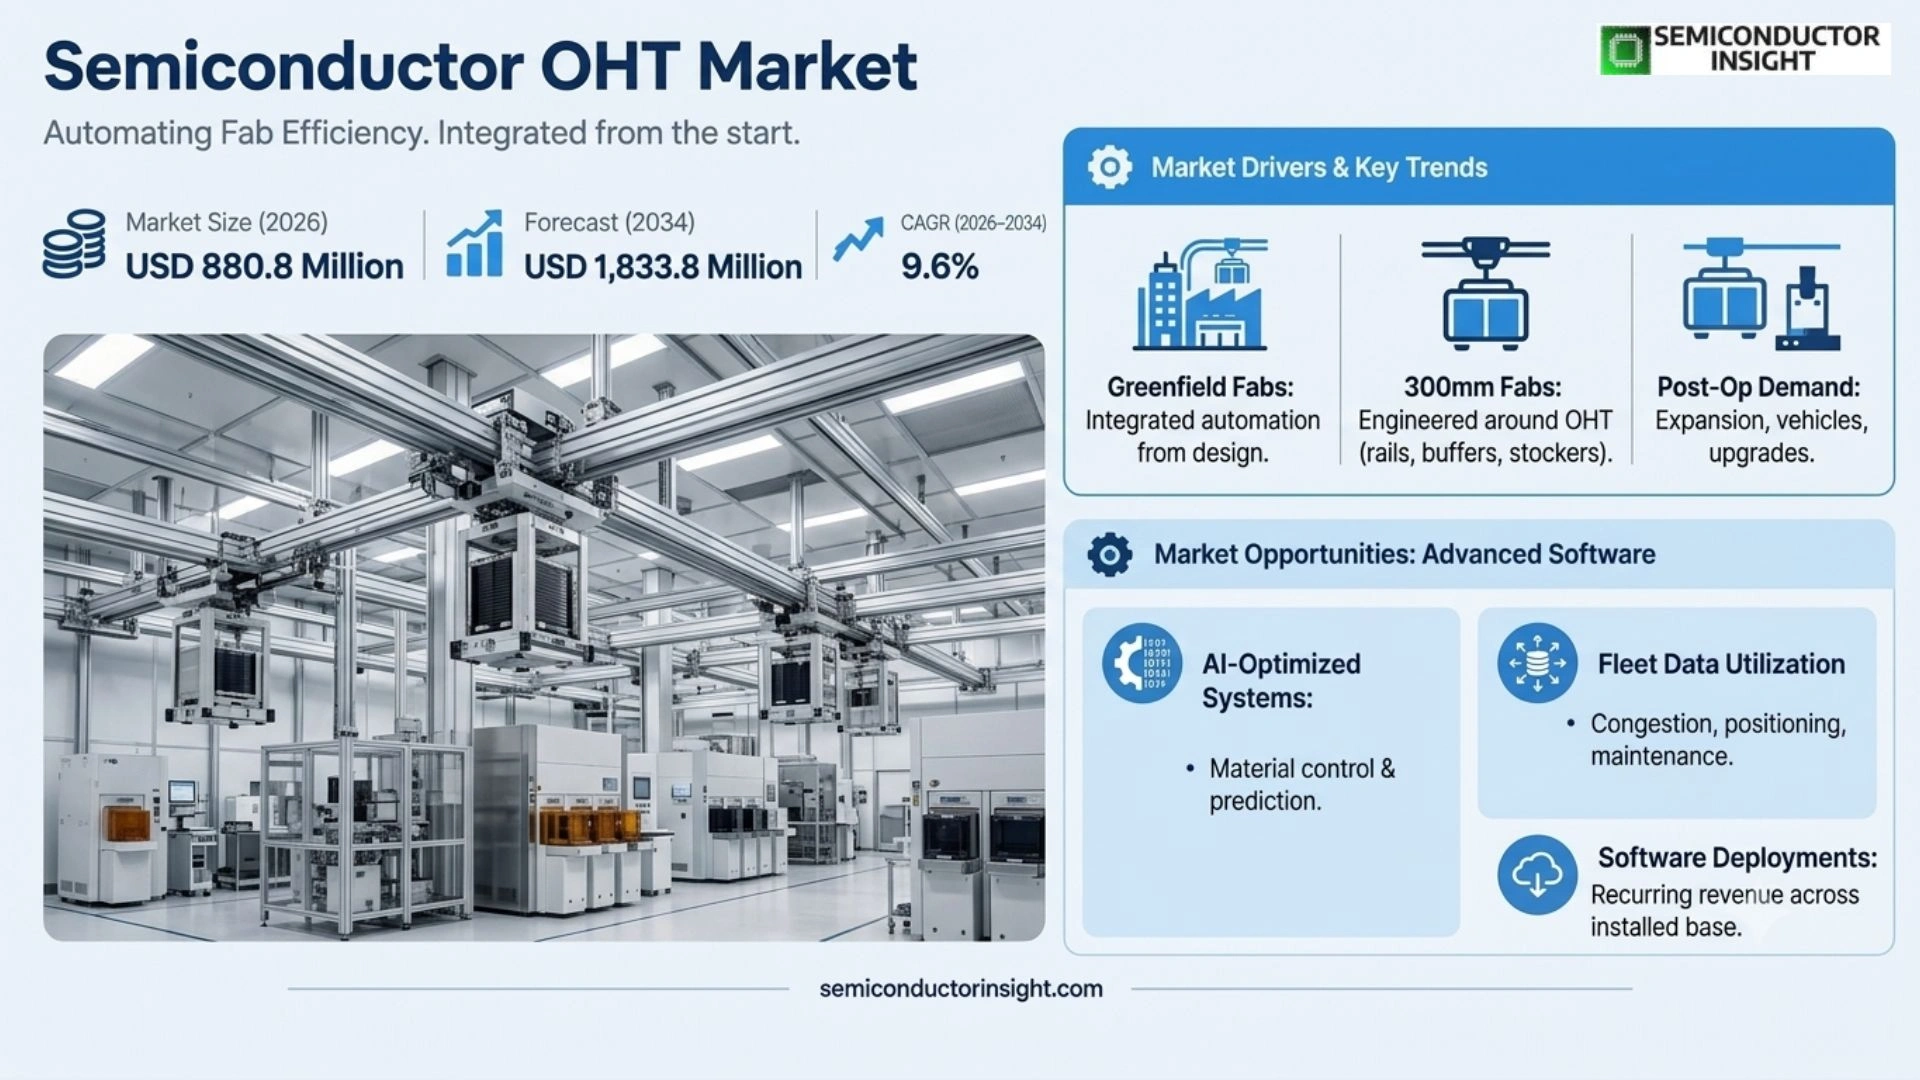
Semiconductor OHT Market is estimated at USD 880.8 million in 2026, and is projected to reach USD 1,833.8 million by 2034, representing a CAGR of 9.6% during 2026–2034.

PDF Icon Download Sample Report PDF
  • Quick Dispatch

    All Orders

  • Secure Payment

    100% Secure Payment

Price range: $1,500.00 through $4,250.00

Clear

Key Statistics

2025 Market Size
USD 803.6 million
2026 Estimated Size
USD 880.8 million
2034 Projected Size
USD 1,833.8 million
CAGR (2026–2034)
9.6%
Largest Market in 2025
Asia Pacific

Key Takeaways

  • Asia Pacific leads the market because Taiwan, South Korea, China and Japan operate dense clusters of 300mm fabs and advanced memory, foundry and logic capacity where automated FOUP transport is essential to continuous production.
  • Double-track OHT gains importance in large fabs because parallel routing and bypass capability can reduce congestion and improve recovery from localized failures, while single-track systems remain effective in lower-density or retrofit layouts.
  • 300mm wafer fabs generate the largest application demand because modern high-volume manufacturing relies on FOUP-based material handling and hundreds of automated moves between lithography, deposition, etch, clean, metrology and inspection tools.
  • AI semiconductor investment is increasing OHT demand indirectly by driving new advanced-node and HBM capacity, where high tool density and expensive work-in-process make transport delays more costly and increase the value of predictive routing.
  • System integration is the principal barrier because OHT networks must coordinate rails, vehicles, stockers, buffers, load ports, factory host software and safety controls while maintaining 24/7 uptime inside a contamination-sensitive environment.
  • Supplier differentiation is shifting toward software and controls. Vehicle speed and load handling remain important, but advanced dispatching, traffic simulation, predictive maintenance and digital-twin tools increasingly determine fab throughput.

Semiconductor OHT (Overhead Hoist Transport) Market Overview

Semiconductor OHT Market was valued at USD 803.6 million in 2025, is estimated at USD 880.8 million in 2026, and is projected to reach USD 1,833.8 million by 2034, representing a CAGR of 9.6% during 2026–2034. Asia Pacific is the largest regional market in 2025, while the commercial growth mechanism is increasingly shaped by new 300mm fabs, AI-driven advanced-node investment, cleanroom automation, denser FOUP traffic, and the need to move wafers with less contamination and shorter cycle time.

Base year: 2025 · Estimated year: 2026 · Forecast period: 2026–2034 · Values in USD million unless otherwise stated

Semiconductor overhead hoist transport is a cleanroom automated material handling system that moves FOUPs, reticle pods and other carriers above the production floor on ceiling-mounted rails. The hoist raises or lowers the carrier directly to equipment load ports, stockers or buffers. By moving work-in-process overhead, fabs preserve valuable floor area, reduce manual handling and keep wafer carriers inside a controlled material-flow environment throughout highly automated manufacturing sequences.

The business case is tied directly to cycle time and fab utilization. A leading-edge wafer can pass through hundreds of process and metrology steps over several months, and each tool handoff creates a material movement requirement. If carriers queue in the wrong location or an OHT route becomes congested, an expensive process tool can wait idle for material. Large fabs therefore model transport traffic as carefully as equipment capacity and increasingly use dispatch software, overhead buffers and redundant routes to prevent logistics from limiting wafer output.

Technology requirements rise as fabs become larger and product mixes become more complex. Advanced logic and HBM production can create bursty movement patterns between clustered process tools, while reticle and wafer carriers may require different contamination controls. OHT suppliers must combine mechanical reliability, non-contact power, precise hoisting, factory-control interfaces and global service capability. Long qualification and installation cycles favor suppliers with proven deployments at major chipmakers.

Segment Analysis: By Type

By type, the market is segmented into Single Track OHT and Double Track OHT. Single-track layouts remain common where routes are straightforward or space is constrained, while double-track systems are increasingly favored in large high-throughput fabs because they provide additional routing flexibility, traffic capacity and recovery options.

Type Technical role Market position
Single Track OHT Vehicles travel on a single overhead rail path and access load ports, buffers or stockers through vertical hoist movement. The architecture is mechanically simpler and can fit well in established bays where floor and ceiling services limit routing changes. A durable configuration for mature fabs, smaller cleanroom areas and selected retrofit projects. Capital cost can be lower, but congestion becomes more important as carrier traffic grows, so routing software and buffer placement must compensate for limited overtaking or alternate paths.
Double Track OHT Parallel tracks create greater route capacity and can allow bypass, directional separation or alternative paths around busy tool clusters. The design is suited to mega-fabs with large numbers of vehicles and intensive FOUP movement. A higher-growth configuration in advanced 300mm facilities. The additional rail and control complexity increases project cost, but improved traffic flow can protect tool utilization and reduce the operational impact of maintenance or local bottlenecks.

Why does traffic control matter as much as vehicle speed?

An OHT fleet with fast vehicles can still underperform if too many carriers converge on the same intersection, buffer or process bay. Dispatch logic must account for tool priority, carrier destination, empty-vehicle positioning, maintenance states and route congestion. In large fabs, the value of the system therefore depends on whole-network optimization rather than top vehicle speed. Simulation before installation and continuous tuning after ramp-up help ensure material movement supports the planned wafer cycle time.

Segment Analysis: By Application

By application, the market is segmented into 200mm Wafer FAB and 300mm Wafer FAB. The 300mm segment is the dominant application because leading logic, memory and foundry plants use standardized FOUP handling and very high automation levels. The 200mm market remains relevant for analog, power, MEMS, sensors and specialty devices, particularly where existing fabs modernize material handling.

Application Demand characteristics
200mm Wafer FAB Many 200mm facilities were built before full overhead automation became standard, so demand often comes from brownfield modernization, selective bay automation and capacity expansions. Analog, MEMS, power and specialty fabs value systems that can be integrated without disrupting established equipment layouts. Replacement and retrofit driven. Lower carrier volumes can reduce the economic case for a full-fab network, but labor reduction, contamination control and aging workforce concerns support targeted automation.
300mm Wafer FAB 300mm manufacturing uses FOUPs and highly automated tool interfaces as a standard operating model. Advanced logic, DRAM, NAND and foundry fabs can require extensive OHT networks with hundreds of vehicles, stockers and buffers coordinated by factory software. The largest demand segment. New mega-fabs and capacity expansions create large project values, while AI, HBM and advanced-node investment increase the need for high throughput, redundancy and software-based traffic management.

Why are new mega-fabs particularly intensive users of OHT?

New 300mm plants are designed around automated carrier movement from the beginning, allowing OHT rails, stockers and control systems to be integrated into the building and tool layout. Large fab campuses also create longer travel distances and more intersections than earlier facilities. The cost of waiting time rises because process equipment is increasingly expensive, so transport systems must deliver carriers to the correct load port with minimal delay. This makes OHT a critical production infrastructure layer rather than a peripheral logistics system.
Global Semiconductor OHT (Overhead Hoist Transport) Market Trends

Regional Analysis

Asia Pacific leads the Semiconductor OHT market because the region contains the largest concentration of 300mm wafer capacity and the deepest cleanroom equipment supply chain. North America is expanding through domestic fab construction, Europe is adding advanced and automotive semiconductor capacity, and other regions are at earlier stages of semiconductor manufacturing development.

How does regional fab investment translate into OHT demand?

OHT demand follows the number, size and automation intensity of wafer fabs rather than end-market electronics consumption. Asia Pacific combines high installed capacity with continuing advanced-node and memory investment. North America is adding greenfield fabs that require new material-handling systems. Europe emphasizes automotive, power and strategic semiconductor capacity. South America and the Middle East have smaller wafer-fab footprints, so demand is more likely to arise through pilot lines, packaging facilities or future localization programs.

Region Position Growth outlook Demand profile What decides supplier selection
Asia Pacific Largest Strong Foundry, memory and logic mega-fabs Installed base, local service, system reliability and traffic-control capability
North America Fast-expanding greenfield market Strong Advanced logic, memory and strategic onshoring Project execution, software integration and long-term service
Europe Specialized growth market Moderate Automotive, power and advanced-node projects Reliability, standards, retrofit capability and lifecycle support
South America Early-stage market Selective Research, packaging and limited front-end capacity Cost, scalability and local technical support
Middle East & Africa Emerging strategic market Long-term Technology diversification and pilot fabs Partnerships, training and scalable automation
Asia Pacific LARGEST MARKET

Why does Asia Pacific dominate semiconductor OHT installations?

Taiwan, South Korea, China and Japan operate dense clusters of advanced and mature-node fabs, and many of the world’s major OHT suppliers manufacture and service systems within the region. The combination of large installed 300mm capacity, new fab construction and local supplier engineering creates recurring demand for new networks, fleet expansion, software upgrades and replacement vehicles.

Market positionLargest region
Growth outlookStrong
Demand profileMega-fab and high-volume production
Market access gateLocal service, uptime and traffic optimization
Country / market Position in region Evidence-led demand logic
Taiwan Advanced foundry hub Leading-edge foundry capacity and continued investment in sub-3nm and advanced packaging create intensive automated material-flow requirements. Large fab campuses require high vehicle counts, overhead buffers and close coordination between production planning and AMHS control.
South Korea Memory and foundry center HBM, DRAM, NAND and logic capacity create heavy FOUP traffic and continuous operation. Large fabs value redundant routes and rapid maintenance because transport interruptions can affect many expensive process tools.
China Large mature-node and expanding advanced capacity A broad fab build-out supports demand for OHT systems across logic, power, display-related semiconductors and memory. Local equipment suppliers are improving capabilities, increasing price competition while global leaders retain advantages in large-scale reliability.
Japan Major equipment and specialty semiconductor market New fabs, advanced foundry initiatives and long-established semiconductor equipment manufacturing support high-value OHT projects. Japanese suppliers also serve export markets from domestic production bases.

2026 – Daifuku expands cleanroom production in Japan

Daifuku completed a new Shiga factory dedicated to transport and storage systems for semiconductor production lines, increasing domestic cleanroom production capacity by 30%.

Market relevance: The expansion signals sustained order visibility for semiconductor AMHS and provides more capacity for large OHT projects and backend automation.

2026 – global 300mm equipment spending accelerates

SEMI projected worldwide 300mm fab equipment spending of $133 billion in 2026 and $151 billion in 2027, with China, Korea and Taiwan remaining major spending centers.

Market relevance: Higher fab equipment investment expands the addressable installed base for OHT networks, stockers, buffers and control software.

2025–2026 – AI and HBM capacity increases

Memory and foundry companies across Korea and Taiwan continued expanding HBM and advanced-node production to serve AI accelerators.

Market relevance: Higher wafer values and dense tool clusters raise the cost of material delays, increasing the importance of reliable automated FOUP transport.

Full-report coverage: Country-level revenue, sales, supplier positioning and forecast detail are retained in the full study; this overview highlights the countries with the clearest, independently supportable demand mechanisms.
North America GREENFIELD EXPANSION MARKET

Why is North American OHT demand rising?

The United States is adding advanced semiconductor manufacturing capacity through large greenfield projects in Arizona, Ohio, New York and other locations. New fabs are designed around automated FOUP movement from the start, creating full-system opportunities rather than isolated retrofit demand. Local commissioning, software integration and service coverage therefore become critical supplier-selection factors.

Market positionFast-expanding
Growth outlookStrong
Demand profileNew fabs and strategic onshoring
Market access gateProject execution and service coverage
Country / market Position in region Evidence-led demand logic
United States Primary regional market Advanced logic, memory and foundry projects create large AMHS requirements. New campuses require OHT rails, stockers, buffers, host interfaces and sustained field support throughout installation and ramp.
Canada Research and specialty manufacturing niche Semiconductor research, photonics and specialty manufacturing create smaller opportunities, typically tied to pilot lines or specialized cleanroom automation rather than mega-fab networks.
Mexico Downstream electronics manufacturing base Front-end wafer fabrication remains limited, so direct OHT demand is small. Future opportunities depend on semiconductor localization and advanced packaging investment.

2025 – Intel updates Ohio One construction

Intel continued construction of two leading-edge Ohio fabs within a planned investment of more than $28 billion.

Market relevance: Greenfield wafer fabs create new cleanroom transport networks and long-duration installation work for AMHS suppliers.

2025–2026 – U.S. fab regionalization continues

Federal and state incentives support additional logic, memory and foundry capacity across several U.S. regions.

Market relevance: More domestic wafer capacity increases demand for locally supported OHT, stocker and factory-automation systems.

2026 – Americas 300mm investment rises

SEMI projected strong 300mm equipment spending in the Americas as advanced capacity expands.

Market relevance: OHT suppliers benefit because material handling is installed alongside front-end process equipment during fab build-out.

Full-report coverage: Country-level revenue, sales, supplier positioning and forecast detail are retained in the full study; this overview highlights the countries with the clearest, independently supportable demand mechanisms.
Europe SPECIALIZED CAPACITY MARKET

What drives OHT demand in Europe?

European semiconductor investment is concentrated in automotive, power electronics, industrial devices and selected advanced-node projects. New or expanded fabs increasingly require high levels of automation to offset labor cost and protect process cleanliness. OHT demand is therefore smaller than in Asia but technically demanding, with strong emphasis on reliability, interoperability and long equipment lifecycles.

Market positionSpecialized market
Growth outlookModerate
Demand profileAutomotive, power and strategic capacity
Market access gateReliability and integration
Country / market Position in region Evidence-led demand logic
Germany Automotive and power semiconductor hub Large industrial and automotive semiconductor plants support automated wafer handling, particularly as 300mm power-device and analog capacity expands.
Ireland Advanced logic manufacturing center Existing leading-edge manufacturing supports sophisticated cleanroom automation and creates upgrade demand as process generations evolve.
France & Italy Specialty and power semiconductor markets Power, analog and industrial semiconductor programs create selective demand for new material-handling infrastructure and brownfield modernization.

2025–2026 – European semiconductor sovereignty projects progress

Public and private investments continued supporting new semiconductor manufacturing capacity across Europe.

Market relevance: Each new automated wafer line creates associated demand for load-port transport, stockers and cleanroom logistics.

2026 – 300mm spending remains elevated

SEMI projected sustained equipment spending in Europe and the Middle East through the second half of the decade.

Market relevance: Long-lived capital programs support steady demand for AMHS suppliers with regional service capability.

2025–2026 – power semiconductor capacity expands

European suppliers continued investing in SiC, GaN and automotive semiconductor production.

Market relevance: Specialty fabs increasingly adopt automated wafer transport to improve cleanliness, traceability and labor productivity.

Full-report coverage: Country-level revenue, sales, supplier positioning and forecast detail are retained in the full study; this overview highlights the countries with the clearest, independently supportable demand mechanisms.
South America EARLY-STAGE MARKET

Where can OHT demand emerge in South America?

South America has limited front-end wafer fabrication, so current OHT demand is small and concentrated in research, pilot manufacturing and selected electronics facilities. Brazil offers the strongest long-term opportunity if semiconductor localization and packaging programs deepen. Suppliers entering the region need scalable systems and local support rather than ultra-large fleet capability.

Market positionEarly-stage
Growth outlookSelective
Demand profilePilot and localization led
Market access gateCost and local support
Country / market Position in region Evidence-led demand logic
Brazil Largest long-term opportunity Semiconductor policy, electronics manufacturing and research infrastructure create the strongest regional base for future wafer automation.
Argentina Research niche Scientific and technology institutions can support small cleanroom automation projects, but commercial front-end capacity remains limited.
Other South America Limited direct demand Most semiconductor consumption is through imported chips and electronics, so OHT demand depends on future localization of wafer manufacturing.

2025–2026 – Brazil strengthens semiconductor policy

Industrial policy continued supporting domestic semiconductor and electronics capability.

Market relevance: If front-end capacity expands, automated wafer handling becomes a required infrastructure layer for competitive production.

2026 – packaging and electronics localization continues

Regional programs focused more heavily on assembly, packaging and electronics than on mega-fab construction.

Market relevance: Near-term OHT demand remains limited, favoring modular systems and smaller cleanroom automation projects.

Long-term – front-end investment remains the key trigger

Meaningful OHT growth requires new wafer-fab projects rather than end-market electronics demand alone.

Market relevance: Suppliers are likely to enter through partnerships and scalable automation packages when projects reach execution.

Full-report coverage: Country-level revenue, sales, supplier positioning and forecast detail are retained in the full study; this overview highlights the countries with the clearest, independently supportable demand mechanisms.
Middle East & Africa STRATEGIC EMERGING MARKET

What could create future OHT demand in the Middle East and Africa?

The region has a small current wafer-fab footprint but several governments are pursuing technology diversification, advanced manufacturing and AI infrastructure. Early semiconductor projects are more likely to involve research, design, packaging or pilot production. OHT demand will therefore emerge only where wafer fabrication reaches sufficient scale to justify automated FOUP transport.

Market positionEmerging
Growth outlookLong-term
Demand profileTechnology diversification
Market access gatePartnerships and scalable design
Country / market Position in region Evidence-led demand logic
Israel Established semiconductor manufacturing niche Existing wafer manufacturing and semiconductor R&D create the strongest direct regional base for advanced cleanroom automation.
United Arab Emirates Technology diversification market Investment in AI and advanced technology creates long-term semiconductor ambitions, but wafer-fab OHT demand depends on future manufacturing commitments.
Saudi Arabia Industrial diversification opportunity National technology programs could create future semiconductor manufacturing projects, with automation likely embedded from the start if greenfield fabs are developed.

2025–2026 – regional AI infrastructure expands

Gulf countries increased investment in AI data centers and advanced technology ecosystems.

Market relevance: Semiconductor manufacturing ambitions may follow, but OHT demand requires physical wafer-fab projects rather than digital infrastructure alone.

2026 – global fab regionalization broadens

SEMI forecasts show increasing equipment investment outside the traditional East Asian centers.

Market relevance: This trend improves the long-term opportunity for AMHS suppliers in new semiconductor geographies.

Long-term – greenfield design favors high automation

Any new leading-edge fab in the region would be designed with automated FOUP transport, buffers and host control from the outset.

Market relevance: Greenfield projects can create high-value system opportunities even if regional unit volumes remain low.

Full-report coverage: Country-level revenue, sales, supplier positioning and forecast detail are retained in the full study; this overview highlights the countries with the clearest, independently supportable demand mechanisms.

Competitive Landscape

The market is led by Daifuku and Murata Machinery, supported by Korean, Taiwanese and Chinese automation suppliers including SMCore, SYNUS Tech, Shinsung E&G, Mirle Automation, SFA Engineering, TOTA and KENMEC. Large semiconductor customers place high value on installed-base reliability, 24/7 service and the ability to engineer a complete material-flow network.

Daifuku has a large global cleanroom business with production and service footprints in Japan, Taiwan, China, South Korea and North America. Its systems combine OHT, stockers, buffers and control software, allowing the company to serve entire fab material-flow architectures rather than individual vehicles. Continued cleanroom capacity expansion in 2026 strengthens its ability to support AI-driven fab investment.

Murata Machinery is another established Japanese supplier with OHT, stocker, AGV and cleanroom transport experience. Korean suppliers such as SMCore, SYNUS Tech, Shinsung E&G and SFA Engineering compete strongly near major memory and display customers, while Mirle and KENMEC bring regional automation capability in Taiwan and China.

Competitive barriers are created by qualification history and service scale. A fab operator cannot tolerate extended AMHS downtime, so customer confidence in controls software, spare-parts availability and field engineering is often more important than the initial vehicle price. As networks become larger, simulation, traffic analytics and predictive maintenance strengthen the advantage of suppliers with extensive installed data.

Competitive tier Representative companies Commercial basis
Global cleanroom AMHS leaders Daifuku; Murata Machinery Large installed bases, full-fab integration, global service, software control and proven operation in leading 300mm fabs.
Korean automation specialists SMCore; SYNUS Tech; Shinsung E&G; SFA Engineering Corporation Close relationships with Korean semiconductor manufacturers, strong local service and competitive project execution.
Regional automation suppliers Mirle Automation; TOTA; KENMEC Mechanical Engineering Flexible engineering, regional cost structures and support for selected fabs and localized projects.

Key Market Participants

DAIFUKU, Murata Machinery, SMCore, SYNUS Tech, Shinsung E&G, Mirle Automation Inter, SFA Engineering Corporation, TOTA, KENMEC MECHANICAL ENGINEERING.

Production Capacity Analysis

OHT production combines precision mechanical fabrication, non-contact or contact power systems, vehicle controls, rail assemblies, hoist mechanisms and factory-control software. Manufacturing capacity is concentrated in Japan, South Korea, Taiwan and China, but final installation occurs at the customer fab and can require months of onsite integration. The practical capacity constraint is therefore engineering and commissioning bandwidth as much as factory output.

Vehicle production requires lightweight structures, drive units, hoists, sensors, controls and cleanroom-compatible materials that generate minimal particles. Reliability must be proven over continuous operation because a vehicle failure inside a busy rail network can affect wider traffic. Suppliers therefore conduct endurance tests and increasingly use full-scale cleanroom test tracks before delivery.

Rail and structural production scales differently from vehicle manufacturing. Large fabs can require kilometers of overhead track, switches and buffer locations tailored to the building and tool layout. Design changes late in fab construction can create schedule risk, so AMHS suppliers work closely with facility engineers and process-equipment installation teams.

Software and commissioning are critical capacity layers. The material control system must exchange data with factory hosts, route hundreds of vehicles and recover safely from faults. Daifuku’s 2026 Shiga investment included a complex test line that replicates a semiconductor cleanroom environment, illustrating the industry’s need to validate controls before onsite ramp.

Capacity layer Where it concentrates Commercial constraint
Vehicles and hoists Japan, South Korea, Taiwan, China Cleanroom reliability, sensor precision, motor supply and long endurance qualification.
Rails, switches and buffers Near major system manufacturing and fab projects Project-specific engineering, structural tolerances and installation sequencing.
Control software Japan, Korea, Taiwan, China and global engineering centers Traffic optimization, host integration, fault recovery and cyber-secure operation.
Installation and service At fab sites worldwide Skilled commissioning teams, spare parts and 24/7 response capacity can limit project throughput.

Market Dynamics

Semiconductor OHT growth is driven by rising wafer-fab automation and the increasing cost of material delays. The largest opportunities come from greenfield 300mm projects and mega-fab expansions, while risks come from semiconductor capital-spending cycles, long project timelines and the complexity of integrating a transport network into a live cleanroom.

Market Drivers

Factor Directional impact Why it matters
300mm fab construction High New logic, memory and foundry capacity creates full-system demand for rails, vehicles, buffers and controls.
AI and HBM investment High High-value wafers and dense process flows make logistics delays more expensive and favor advanced traffic management.
Labor and contamination reduction Medium-High Automated FOUP movement reduces manual handling, particles and operator exposure inside cleanrooms.
Factory digitalization Medium-High Simulation, predictive maintenance and data-driven dispatch improve transport utilization and uptime.

Greenfield fabs embed OHT from the building-design stage

New 300mm fabs are engineered around FOUP-based automation, so transport rails, buffers and stockers are planned alongside process tools and utilities. This creates large, multi-year projects that include equipment, controls, installation and service. Once the network becomes operational, expansion and replacement demand continues through additional vehicles, route modifications and software upgrades.

AI raises the cost of every logistics interruption

Advanced-node and HBM wafers carry high process value and move through expensive toolsets. When a tool waits for a FOUP, the lost utilization can exceed the direct cost of the transport system. This strengthens the business case for redundant routing, higher buffer density and predictive control that keeps material positioned near the next process step.

Cleanroom automation reduces manual risk

Manual wafer-carrier movement consumes labor, increases ergonomic exposure and introduces contamination risk. OHT removes much of that activity and allows fabs to operate with fewer operators inside critical production zones. The advantage is especially important in markets facing skilled-labor shortages or building new fabs far from established semiconductor clusters.

Digital controls improve fleet productivity

Modern AMHS control systems use traffic history, tool states and carrier priorities to reduce empty travel and congestion. AI-assisted dispatch and predictive maintenance can extend this capability by anticipating failures or hotspots before throughput is affected. Software therefore creates recurring upgrade revenue even when the physical rail network remains unchanged.

Market Restraints

Factor Directional impact Why it matters
High initial system cost High Full-fab OHT networks require vehicles, rail, stockers, controls and installation, creating significant capital commitment.
Complex integration and commissioning High Changes to tool layout or host software can delay qualification and require specialized onsite engineering.
Semiconductor capital-spending cycles Medium-High Fab delays or utilization corrections can shift large AMHS orders between years.
Long service obligations Medium Suppliers must maintain parts and field support for systems that operate continuously over many years.

Large projects require early capital commitment

A cleanroom AMHS network is ordered before wafer production begins and must be coordinated with building construction and process-tool installation. This front-loaded spending can be delayed when a fab owner changes its capacity plan. Suppliers therefore face revenue timing risk even when long-term semiconductor demand remains attractive.

Integration failures can constrain an entire fab

OHT must work with load ports, stockers, manufacturing execution systems and process-tool schedules. A software or mechanical incompatibility can create widespread queuing rather than an isolated equipment issue. Qualification is therefore conservative, and fabs prefer suppliers with proven interfaces and experienced field teams, which raises barriers for new entrants.

Equipment cycles create uneven order timing

Semiconductor manufacturers expand capacity in waves. Strong AI and memory investment can produce large order backlogs, while inventory corrections can postpone new fabs or equipment installation. OHT suppliers must retain skilled engineering capacity through these cycles because losing experienced teams can weaken project execution during the next upturn.

Lifecycle support is costly but unavoidable

A transport system may operate around the clock for more than a decade. Customers expect spare vehicles, electronics, control software updates and onsite response throughout that period. The recurring service opportunity is attractive, but it requires regional infrastructure and inventory that smaller suppliers may find difficult to maintain.

Market Opportunities

AI-optimized material control systems

Large OHT fleets generate detailed movement and fault data. Suppliers can use this information to predict congestion, optimize empty-vehicle positioning and identify maintenance needs before failures occur. Software improvements can be deployed across an existing installed base, creating recurring revenue without replacing rails or vehicles.

Back-end and advanced-packaging automation

Chiplet and HBM production increase automation needs beyond traditional front-end wafer fabrication. Suppliers with experience in cleanroom OHT can adapt transport, storage and multi-product handling systems for substrates, carriers and backend flows, broadening demand beyond conventional FOUP movement.

New semiconductor geographies

Fab regionalization is creating projects in the United States, Europe, Japan, India and other markets. Greenfield locations need complete AMHS architectures and local service organizations, giving established suppliers opportunities to expand geographically and create long-term aftermarket positions.

Brownfield 200mm modernization

Many specialty fabs still use older manual or floor-based material handling. Selective OHT, ceiling buffers and automated transfer can improve labor productivity and contamination control without rebuilding the entire factory. Modular retrofit packages can open an addressable market beyond new mega-fabs.

Supply Chain Analysis

Components & ControlsMotors, sensors, drives, hoists and control electronics form cleanroom-compatible OHT vehicles.
System ManufacturingVehicles, rails, switches, buffers and stockers are engineered into a fab-specific AMHS architecture.
Installation & SoftwareMechanical installation, host integration, traffic simulation and qualification create a production-ready network.
Fab Operations & ServiceChipmakers run the fleet continuously while suppliers provide maintenance, spares and software optimization.

Components & Controls. OHT suppliers source precision motors, bearings, encoders, sensors, power systems and industrial controllers that must operate cleanly and reliably. Critical electronics are qualified for long service life because redesigning a vehicle controller can trigger extensive revalidation. Standardized modules help suppliers control spare-parts complexity across large installed fleets.

System Manufacturing. The supplier converts components into vehicles and combines them with custom rail, switches, buffers and stockers. Project engineering begins before shipment because each fab has a different bay layout and tool mix. Large manufacturers can reuse proven modules while adapting route geometry and vehicle count to the customer’s production plan.

Installation & Software. Onsite teams mount rail, commission vehicles and connect the material control system to factory hosts and process tools. Traffic simulations are refined using actual tool availability and wafer-flow patterns. This stage carries significant schedule risk, making experienced project managers and software engineers a key part of supplier capacity.

Fab Operations & Service. After ramp-up, the system becomes critical production infrastructure. Suppliers maintain spare vehicles, replace wear components and update control software while the fab remains in operation. Predictive analytics and remote diagnostics can reduce emergency maintenance and create higher-value service contracts over the life of the fab.

Recent Developments in the Semiconductor OHT (Overhead Hoist Transport) Market

Developments tracked to September 2026. Entries are dated to the official publication date where available.

  • 3 April 2026 Capacity
    Daifuku completed a new Shiga factory for semiconductor transport and storage systems, increasing domestic cleanroom production capacity by 30%. The facility includes a full-scale test line designed to reproduce fab conditions, supporting faster validation and shorter onsite adjustment cycles for large AMHS projects. Source
  • 1 April 2026 Industry investment
    SEMI projected worldwide 300mm fab equipment spending of $133 billion in 2026 and $151 billion in 2027. Record investment in AI, advanced logic, memory and regionalized manufacturing expands the installed base of fabs that require FOUP transport, stockers and material-control systems. Source
  • 17 August 2026 Strategy
    Daifuku highlighted continued cleanroom innovation and global expansion as semiconductor manufacturing evolves. The company emphasized software, AI and next-generation material handling as areas that can reshape storage and transport architectures beyond fixed traditional routing. Source
  • 28 February 2025 Fab expansion
    Intel updated the construction timeline for its Ohio One campus, where two leading-edge fabs are being built. Large greenfield projects such as Ohio create demand for complete cleanroom automation systems because material handling must be installed and qualified alongside the production tools. Source
  • 26 September 2024 Investment outlook
    SEMI reported plans for $400 billion of 300mm fab equipment investment across 2025–2027. The regionalization of semiconductor manufacturing and AI-related capacity expansion create a multi-year pipeline for cleanroom automation suppliers. Source

Report Scope & Segmentation

Attribute Coverage
Report title Global Semiconductor OHT (Overhead Hoist Transport) Market, Trends, Business Strategies 2025-2032
Base / estimate / forecast 2025 base year; 2026 estimated year; 2034 forecast end year; CAGR measured for 2026–2034.
By Type Single Track OHT; Double Track OHT
By Application 200mm Wafer FAB; 300mm Wafer FAB
Regions North America, Europe, Asia-Pacific, South America, and Middle East & Africa, with country-level analysis across the principal national markets.
Companies DAIFUKU, Murata Machinery, SMCore, SYNUS Tech, Shinsung E&G, Mirle Automation Inter, SFA Engineering Corporation, TOTA, KENMEC MECHANICAL ENGINEERING
Customization Scope Free report customization (equivalent to up to 4 analyst working days) with purchase. Addition or alteration to country, regional and segment scope.

Frequently Asked Questions

What is the size of the Semiconductor OHT market?

The global Semiconductor OHT market is valued at USD 803.6 million in 2025, is estimated at USD 880.8 million in 2026, and is projected to reach USD 1,833.8 million by 2034, representing a 9.6% CAGR during 2026–2034. Growth is driven by new 300mm fabs, AI and HBM investment, and higher cleanroom automation requirements.

What is semiconductor OHT?

Semiconductor OHT is an overhead automated material handling system that transports FOUPs and other carriers along ceiling-mounted rails inside a semiconductor cleanroom. Vehicles hoist carriers directly to tool load ports, buffers or stockers. The system reduces manual handling, preserves floor space and helps process tools receive wafers at the correct time with minimal contamination risk.

Which region leads the Semiconductor OHT market?

Asia Pacific leads because Taiwan, South Korea, China and Japan contain the world’s largest concentration of 300mm wafer fabrication capacity. The region also hosts major OHT manufacturers and service organizations, creating a dense ecosystem that supports installation, maintenance, software tuning and rapid capacity expansion.

Which OHT type is growing faster?

Double Track OHT is gaining importance in large advanced fabs because parallel routing can improve traffic capacity, provide bypass options and reduce the operational effect of local congestion or maintenance. Single-track systems remain relevant where layouts are smaller, routes are simpler or brownfield ceiling constraints make a dual-route architecture difficult.

Which application generates the most OHT demand?

300mm wafer fabs generate the largest demand because advanced logic, DRAM, NAND and foundry manufacturing use FOUP-based automation as a standard operating model. Large fabs can require extensive overhead rail networks, many vehicles, buffers and stockers coordinated by factory-control software.

Why is OHT important for advanced semiconductor fabs?

Advanced fabs use expensive process tools and wafers that can spend months moving through hundreds of steps. If a carrier arrives late, the process tool can sit idle and reduce fab output. OHT systems minimize this risk by automating wafer movement, positioning carriers near future process steps and using control software to manage traffic across the entire factory.

What are the main restraints on OHT adoption?

The main restraints are high project cost, long integration cycles, semiconductor capital-spending volatility and the need for long-term service. A full system includes rail, vehicles, buffers, stockers, controls and installation. Customers are therefore cautious about supplier selection because failures can affect a large part of the fab rather than one isolated process tool.

Who are the major Semiconductor OHT companies?

Major companies include Daifuku, Murata Machinery, SMCore, SYNUS Tech, Shinsung E&G, Mirle Automation, SFA Engineering Corporation, TOTA and KENMEC Mechanical Engineering. Global leaders differentiate through large installed bases, full-fab integration and service coverage, while regional suppliers compete through proximity, cost and local engineering support.

How does AI semiconductor demand affect OHT?

AI demand drives investment in advanced logic, HBM and related semiconductor capacity. These fabs use dense tool layouts and process high-value wafers, making material delays costly. OHT suppliers benefit through new fab projects, larger fleets, more overhead buffering and demand for software that predicts congestion and improves carrier dispatch.

Where are the strongest OHT growth opportunities?

The strongest opportunities are in new 300mm fabs, AI-optimized material control, advanced-packaging automation, semiconductor regionalization and 200mm brownfield modernization. Suppliers that combine reliable mechanical systems with traffic software and global service are best positioned to capture both initial project revenue and long-term aftermarket demand.

Research Sources & Evidence Base
View research sources used for this overview
  1. Daifuku. Cleanroom Solutions, Cleanroom AMHS, semiconductor transport and storage architecture..
  2. Daifuku. New Factory for Semiconductor Production Lines, 2026 cleanroom production-capacity expansion and full-scale test line..
  3. Daifuku. Cleanroom Technology, Semiconductor OHT, control systems and worldwide service footprint..
  4. Murata Machinery. Clean FA / Semiconductor OHT, OHT, stocker and cleanroom material-handling technology..
  5. SEMI. 300mm Fab Equipment Spending 2026–2029, Global fab investment and regional equipment spending..
  6. SEMI. 300mm Fab Outlook 2025–2027, Regionalized fab investment supporting AMHS demand..
  7. Intel. Ohio One Construction Update, Greenfield U.S. fab build-out..
  8. Daifuku. Shaping the Future of Material Handling, 2026 strategy for AI-enabled material handling and cleanroom growth..
Global Semiconductor OHT (Overhead Hoist Transport) Market, Trends, Business Strategies 2026-2034

Get Sample Report PDF for Exclusive Insights

Report Sample Includes

  • Table of Contents
  • List of Tables & Figures
  • Charts, Research Methodology, and more...

PDF Icon Download Sample Report PDF

Download Sample Report

Table of Content

Table of Contents
1 Research Methodology and Statistical Scope
1.1 Market Definition and Statistical Scope of Semiconductor OHT (Overhead Hoist Transport)
1.2 Key Market Segments
1.2.1 Semiconductor OHT (Overhead Hoist Transport) Segment by Type
1.2.2 Semiconductor OHT (Overhead Hoist Transport) Segment by Application
1.3 Methodology & Sources of Information
1.3.1 Research Methodology
1.3.2 Research Process
1.3.3 Market Breakdown and Data Triangulation
1.3.4 Base Year
1.3.5 Report Assumptions & Caveats
2 Semiconductor OHT (Overhead Hoist Transport) Market Overview
2.1 Global Market Overview
2.1.1 Global Semiconductor OHT (Overhead Hoist Transport) Market Size (M USD) Estimates and Forecasts (2019-2032)
2.1.2 Global Semiconductor OHT (Overhead Hoist Transport) Sales Estimates and Forecasts (2019-2032)
2.2 Market Segment Executive Summary
2.3 Global Market Size by Region
3 Semiconductor OHT (Overhead Hoist Transport) Market Competitive Landscape
3.1 Global Semiconductor OHT (Overhead Hoist Transport) Sales by Manufacturers (2019-2025)
3.2 Global Semiconductor OHT (Overhead Hoist Transport) Revenue Market Share by Manufacturers (2019-2025)
3.3 Semiconductor OHT (Overhead Hoist Transport) Market Share by Company Type (Tier 1, Tier 2, and Tier 3)
3.4 Global Semiconductor OHT (Overhead Hoist Transport) Average Price by Manufacturers (2019-2025)
3.5 Manufacturers Semiconductor OHT (Overhead Hoist Transport) Sales Sites, Area Served, Product Type
3.6 Semiconductor OHT (Overhead Hoist Transport) Market Competitive Situation and Trends
3.6.1 Semiconductor OHT (Overhead Hoist Transport) Market Concentration Rate
3.6.2 Global 5 and 10 Largest Semiconductor OHT (Overhead Hoist Transport) Players Market Share by Revenue
3.6.3 Mergers & Acquisitions, Expansion
4 Semiconductor OHT (Overhead Hoist Transport) Industry Chain Analysis
4.1 Semiconductor OHT (Overhead Hoist Transport) Industry Chain Analysis
4.2 Market Overview of Key Raw Materials
4.3 Midstream Market Analysis
4.4 Downstream Customer Analysis
5 The Development and Dynamics of Semiconductor OHT (Overhead Hoist Transport) Market
5.1 Key Development Trends
5.2 Driving Factors
5.3 Market Challenges
5.4 Market Restraints
5.5 Industry News
5.5.1 New Product Developments
5.5.2 Mergers & Acquisitions
5.5.3 Expansions
5.5.4 Collaboration/Supply Contracts
5.6 Industry Policies
6 Semiconductor OHT (Overhead Hoist Transport) Market Segmentation by Type
6.1 Evaluation Matrix of Segment Market Development Potential (Type)
6.2 Global Semiconductor OHT (Overhead Hoist Transport) Sales Market Share by Type (2019-2025)
6.3 Global Semiconductor OHT (Overhead Hoist Transport) Market Size Market Share by Type (2019-2025)
6.4 Global Semiconductor OHT (Overhead Hoist Transport) Price by Type (2019-2025)
7 Semiconductor OHT (Overhead Hoist Transport) Market Segmentation by Application
7.1 Evaluation Matrix of Segment Market Development Potential (Application)
7.2 Global Semiconductor OHT (Overhead Hoist Transport) Market Sales by Application (2019-2025)
7.3 Global Semiconductor OHT (Overhead Hoist Transport) Market Size (M USD) by Application (2019-2025)
7.4 Global Semiconductor OHT (Overhead Hoist Transport) Sales Growth Rate by Application (2019-2025)
8 Semiconductor OHT (Overhead Hoist Transport) Market Consumption by Region
8.1 Global Semiconductor OHT (Overhead Hoist Transport) Sales by Region
8.1.1 Global Semiconductor OHT (Overhead Hoist Transport) Sales by Region
8.1.2 Global Semiconductor OHT (Overhead Hoist Transport) Sales Market Share by Region
8.2 North America
8.2.1 North America Semiconductor OHT (Overhead Hoist Transport) Sales by Country
8.2.2 U.S.
8.2.3 Canada
8.2.4 Mexico
8.3 Europe
8.3.1 Europe Semiconductor OHT (Overhead Hoist Transport) Sales by Country
8.3.2 Germany
8.3.3 France
8.3.4 U.K.
8.3.5 Italy
8.3.6 Russia
8.4 Asia Pacific
8.4.1 Asia Pacific Semiconductor OHT (Overhead Hoist Transport) Sales by Region
8.4.2 China
8.4.3 Japan
8.4.4 South Korea
8.4.5 India
8.4.6 Southeast Asia
8.5 South America
8.5.1 South America Semiconductor OHT (Overhead Hoist Transport) Sales by Country
8.5.2 Brazil
8.5.3 Argentina
8.5.4 Columbia
8.6 Middle East and Africa
8.6.1 Middle East and Africa Semiconductor OHT (Overhead Hoist Transport) Sales by Region
8.6.2 Saudi Arabia
8.6.3 UAE
8.6.4 Egypt
8.6.5 Nigeria
8.6.6 South Africa
9 Semiconductor OHT (Overhead Hoist Transport) Market Production by Region
9.1 Global Production of Semiconductor OHT (Overhead Hoist Transport) by Region (2019-2025)
9.2 Global Semiconductor OHT (Overhead Hoist Transport) Revenue Market Share by Region (2019-2025)
9.3 Global Semiconductor OHT (Overhead Hoist Transport) Production, Revenue, Price and Gross Margin (2019-2025)
9.4 North America Semiconductor OHT (Overhead Hoist Transport) Production
9.4.1 North America Semiconductor OHT (Overhead Hoist Transport) Production Growth Rate (2019-2025)
9.4.2 North America Semiconductor OHT (Overhead Hoist Transport) Production, Revenue, Price and Gross Margin (2019-2025)
9.5 Europe Semiconductor OHT (Overhead Hoist Transport) Production
9.5.1 Europe Semiconductor OHT (Overhead Hoist Transport) Production Growth Rate (2019-2025)
9.5.2 Europe Semiconductor OHT (Overhead Hoist Transport) Production, Revenue, Price and Gross Margin (2019-2025)
9.6 Japan Semiconductor OHT (Overhead Hoist Transport) Production (2019-2025)
9.6.1 Japan Semiconductor OHT (Overhead Hoist Transport) Production Growth Rate (2019-2025)
9.6.2 Japan Semiconductor OHT (Overhead Hoist Transport) Production, Revenue, Price and Gross Margin (2019-2025)
9.7 China Semiconductor OHT (Overhead Hoist Transport) Production (2019-2025)
9.7.1 China Semiconductor OHT (Overhead Hoist Transport) Production Growth Rate (2019-2025)
9.7.2 China Semiconductor OHT (Overhead Hoist Transport) Production, Revenue, Price and Gross Margin (2019-2025)
10 Key Companies Profile
10.1 DAIFUKU
10.1.1 DAIFUKU Semiconductor OHT (Overhead Hoist Transport) Basic Information
10.1.2 DAIFUKU Semiconductor OHT (Overhead Hoist Transport) Product Overview
10.1.3 DAIFUKU Semiconductor OHT (Overhead Hoist Transport) Product Market Performance
10.1.4 DAIFUKU Business Overview
10.1.5 DAIFUKU Semiconductor OHT (Overhead Hoist Transport) SWOT Analysis
10.1.6 DAIFUKU Recent Developments
10.2 Murata Machinery
10.2.1 Murata Machinery Semiconductor OHT (Overhead Hoist Transport) Basic Information
10.2.2 Murata Machinery Semiconductor OHT (Overhead Hoist Transport) Product Overview
10.2.3 Murata Machinery Semiconductor OHT (Overhead Hoist Transport) Product Market Performance
10.2.4 Murata Machinery Business Overview
10.2.5 Murata Machinery Semiconductor OHT (Overhead Hoist Transport) SWOT Analysis
10.2.6 Murata Machinery Recent Developments
10.3 SMCore
10.3.1 SMCore Semiconductor OHT (Overhead Hoist Transport) Basic Information
10.3.2 SMCore Semiconductor OHT (Overhead Hoist Transport) Product Overview
10.3.3 SMCore Semiconductor OHT (Overhead Hoist Transport) Product Market Performance
10.3.4 SMCore Semiconductor OHT (Overhead Hoist Transport) SWOT Analysis
10.3.5 SMCore Business Overview
10.3.6 SMCore Recent Developments
10.4 SYNUS Tech
10.4.1 SYNUS Tech Semiconductor OHT (Overhead Hoist Transport) Basic Information
10.4.2 SYNUS Tech Semiconductor OHT (Overhead Hoist Transport) Product Overview
10.4.3 SYNUS Tech Semiconductor OHT (Overhead Hoist Transport) Product Market Performance
10.4.4 SYNUS Tech Business Overview
10.4.5 SYNUS Tech Recent Developments
10.5 Shinsung EandG
10.5.1 Shinsung EandG Semiconductor OHT (Overhead Hoist Transport) Basic Information
10.5.2 Shinsung EandG Semiconductor OHT (Overhead Hoist Transport) Product Overview
10.5.3 Shinsung EandG Semiconductor OHT (Overhead Hoist Transport) Product Market Performance
10.5.4 Shinsung EandG Business Overview
10.5.5 Shinsung EandG Recent Developments
10.6 Mirle Automation Inter
10.6.1 Mirle Automation Inter Semiconductor OHT (Overhead Hoist Transport) Basic Information
10.6.2 Mirle Automation Inter Semiconductor OHT (Overhead Hoist Transport) Product Overview
10.6.3 Mirle Automation Inter Semiconductor OHT (Overhead Hoist Transport) Product Market Performance
10.6.4 Mirle Automation Inter Business Overview
10.6.5 Mirle Automation Inter Recent Developments
10.7 SFA Engineering Corporation
10.7.1 SFA Engineering Corporation Semiconductor OHT (Overhead Hoist Transport) Basic Information
10.7.2 SFA Engineering Corporation Semiconductor OHT (Overhead Hoist Transport) Product Overview
10.7.3 SFA Engineering Corporation Semiconductor OHT (Overhead Hoist Transport) Product Market Performance
10.7.4 SFA Engineering Corporation Business Overview
10.7.5 SFA Engineering Corporation Recent Developments
10.8 TOTA
10.8.1 TOTA Semiconductor OHT (Overhead Hoist Transport) Basic Information
10.8.2 TOTA Semiconductor OHT (Overhead Hoist Transport) Product Overview
10.8.3 TOTA Semiconductor OHT (Overhead Hoist Transport) Product Market Performance
10.8.4 TOTA Business Overview
10.8.5 TOTA Recent Developments
10.9 KENMEC MECHANICAL ENGINEERING
10.9.1 KENMEC MECHANICAL ENGINEERING Semiconductor OHT (Overhead Hoist Transport) Basic Information
10.9.2 KENMEC MECHANICAL ENGINEERING Semiconductor OHT (Overhead Hoist Transport) Product Overview
10.9.3 KENMEC MECHANICAL ENGINEERING Semiconductor OHT (Overhead Hoist Transport) Product Market Performance
10.9.4 KENMEC MECHANICAL ENGINEERING Business Overview
10.9.5 KENMEC MECHANICAL ENGINEERING Recent Developments
11 Semiconductor OHT (Overhead Hoist Transport) Market Forecast by Region
11.1 Global Semiconductor OHT (Overhead Hoist Transport) Market Size Forecast
11.2 Global Semiconductor OHT (Overhead Hoist Transport) Market Forecast by Region
11.2.1 North America Market Size Forecast by Country
11.2.2 Europe Semiconductor OHT (Overhead Hoist Transport) Market Size Forecast by Country
11.2.3 Asia Pacific Semiconductor OHT (Overhead Hoist Transport) Market Size Forecast by Region
11.2.4 South America Semiconductor OHT (Overhead Hoist Transport) Market Size Forecast by Country
11.2.5 Middle East and Africa Forecasted Consumption of Semiconductor OHT (Overhead Hoist Transport) by Country
12 Forecast Market by Type and by Application (2025-2032)
12.1 Global Semiconductor OHT (Overhead Hoist Transport) Market Forecast by Type (2025-2032)
12.1.1 Global Forecasted Sales of Semiconductor OHT (Overhead Hoist Transport) by Type (2025-2032)
12.1.2 Global Semiconductor OHT (Overhead Hoist Transport) Market Size Forecast by Type (2025-2032)
12.1.3 Global Forecasted Price of Semiconductor OHT (Overhead Hoist Transport) by Type (2025-2032)
12.2 Global Semiconductor OHT (Overhead Hoist Transport) Market Forecast by Application (2025-2032)
12.2.1 Global Semiconductor OHT (Overhead Hoist Transport) Sales (K Units) Forecast by Application
12.2.2 Global Semiconductor OHT (Overhead Hoist Transport) Market Size (M USD) Forecast by Application (2025-2032)
13 Conclusion and Key FindingsList of Tables
Table 1. Introduction of the Type
Table 2. Introduction of the Application
Table 3. Market Size (M USD) Segment Executive Summary
Table 4. Semiconductor OHT (Overhead Hoist Transport) Market Size Comparison by Region (M USD)
Table 5. Global Semiconductor OHT (Overhead Hoist Transport) Sales (K Units) by Manufacturers (2019-2025)
Table 6. Global Semiconductor OHT (Overhead Hoist Transport) Sales Market Share by Manufacturers (2019-2025)
Table 7. Global Semiconductor OHT (Overhead Hoist Transport) Revenue (M USD) by Manufacturers (2019-2025)
Table 8. Global Semiconductor OHT (Overhead Hoist Transport) Revenue Share by Manufacturers (2019-2025)
Table 9. Company Type (Tier 1, Tier 2, and Tier 3) & (based on the Revenue in Semiconductor OHT (Overhead Hoist Transport) as of 2022)
Table 10. Global Market Semiconductor OHT (Overhead Hoist Transport) Average Price (USD/Unit) of Key Manufacturers (2019-2025)
Table 11. Manufacturers Semiconductor OHT (Overhead Hoist Transport) Sales Sites and Area Served
Table 12. Manufacturers Semiconductor OHT (Overhead Hoist Transport) Product Type
Table 13. Global Semiconductor OHT (Overhead Hoist Transport) Manufacturers Market Concentration Ratio (CR5 and HHI)
Table 14. Mergers & Acquisitions, Expansion Plans
Table 15. Industry Chain Map of Semiconductor OHT (Overhead Hoist Transport)
Table 16. Market Overview of Key Raw Materials
Table 17. Midstream Market Analysis
Table 18. Downstream Customer Analysis
Table 19. Key Development Trends
Table 20. Driving Factors
Table 21. Semiconductor OHT (Overhead Hoist Transport) Market Challenges
Table 22. Global Semiconductor OHT (Overhead Hoist Transport) Sales by Type (K Units)
Table 23. Global Semiconductor OHT (Overhead Hoist Transport) Market Size by Type (M USD)
Table 24. Global Semiconductor OHT (Overhead Hoist Transport) Sales (K Units) by Type (2019-2025)
Table 25. Global Semiconductor OHT (Overhead Hoist Transport) Sales Market Share by Type (2019-2025)
Table 26. Global Semiconductor OHT (Overhead Hoist Transport) Market Size (M USD) by Type (2019-2025)
Table 27. Global Semiconductor OHT (Overhead Hoist Transport) Market Size Share by Type (2019-2025)
Table 28. Global Semiconductor OHT (Overhead Hoist Transport) Price (USD/Unit) by Type (2019-2025)
Table 29. Global Semiconductor OHT (Overhead Hoist Transport) Sales (K Units) by Application
Table 30. Global Semiconductor OHT (Overhead Hoist Transport) Market Size by Application
Table 31. Global Semiconductor OHT (Overhead Hoist Transport) Sales by Application (2019-2025) & (K Units)
Table 32. Global Semiconductor OHT (Overhead Hoist Transport) Sales Market Share by Application (2019-2025)
Table 33. Global Semiconductor OHT (Overhead Hoist Transport) Sales by Application (2019-2025) & (M USD)
Table 34. Global Semiconductor OHT (Overhead Hoist Transport) Market Share by Application (2019-2025)
Table 35. Global Semiconductor OHT (Overhead Hoist Transport) Sales Growth Rate by Application (2019-2025)
Table 36. Global Semiconductor OHT (Overhead Hoist Transport) Sales by Region (2019-2025) & (K Units)
Table 37. Global Semiconductor OHT (Overhead Hoist Transport) Sales Market Share by Region (2019-2025)
Table 38. North America Semiconductor OHT (Overhead Hoist Transport) Sales by Country (2019-2025) & (K Units)
Table 39. Europe Semiconductor OHT (Overhead Hoist Transport) Sales by Country (2019-2025) & (K Units)
Table 40. Asia Pacific Semiconductor OHT (Overhead Hoist Transport) Sales by Region (2019-2025) & (K Units)
Table 41. South America Semiconductor OHT (Overhead Hoist Transport) Sales by Country (2019-2025) & (K Units)
Table 42. Middle East and Africa Semiconductor OHT (Overhead Hoist Transport) Sales by Region (2019-2025) & (K Units)
Table 43. Global Semiconductor OHT (Overhead Hoist Transport) Production (K Units) by Region (2019-2025)
Table 44. Global Semiconductor OHT (Overhead Hoist Transport) Revenue (US$ Million) by Region (2019-2025)
Table 45. Global Semiconductor OHT (Overhead Hoist Transport) Revenue Market Share by Region (2019-2025)
Table 46. Global Semiconductor OHT (Overhead Hoist Transport) Production (K Units), Revenue (US$ Million), Price (USD/Unit) and Gross Margin (2019-2025)
Table 47. North America Semiconductor OHT (Overhead Hoist Transport) Production (K Units), Revenue (US$ Million), Price (USD/Unit) and Gross Margin (2019-2025)
Table 48. Europe Semiconductor OHT (Overhead Hoist Transport) Production (K Units), Revenue (US$ Million), Price (USD/Unit) and Gross Margin (2019-2025)
Table 49. Japan Semiconductor OHT (Overhead Hoist Transport) Production (K Units), Revenue (US$ Million), Price (USD/Unit) and Gross Margin (2019-2025)
Table 50. China Semiconductor OHT (Overhead Hoist Transport) Production (K Units), Revenue (US$ Million), Price (USD/Unit) and Gross Margin (2019-2025)
Table 51. DAIFUKU Semiconductor OHT (Overhead Hoist Transport) Basic Information
Table 52. DAIFUKU Semiconductor OHT (Overhead Hoist Transport) Product Overview
Table 53. DAIFUKU Semiconductor OHT (Overhead Hoist Transport) Sales (K Units), Revenue (M USD), Price (USD/Unit) and Gross Margin (2019-2025)
Table 54. DAIFUKU Business Overview
Table 55. DAIFUKU Semiconductor OHT (Overhead Hoist Transport) SWOT Analysis
Table 56. DAIFUKU Recent Developments
Table 57. Murata Machinery Semiconductor OHT (Overhead Hoist Transport) Basic Information
Table 58. Murata Machinery Semiconductor OHT (Overhead Hoist Transport) Product Overview
Table 59. Murata Machinery Semiconductor OHT (Overhead Hoist Transport) Sales (K Units), Revenue (M USD), Price (USD/Unit) and Gross Margin (2019-2025)
Table 60. Murata Machinery Business Overview
Table 61. Murata Machinery Semiconductor OHT (Overhead Hoist Transport) SWOT Analysis
Table 62. Murata Machinery Recent Developments
Table 63. SMCore Semiconductor OHT (Overhead Hoist Transport) Basic Information
Table 64. SMCore Semiconductor OHT (Overhead Hoist Transport) Product Overview
Table 65. SMCore Semiconductor OHT (Overhead Hoist Transport) Sales (K Units), Revenue (M USD), Price (USD/Unit) and Gross Margin (2019-2025)
Table 66. SMCore Semiconductor OHT (Overhead Hoist Transport) SWOT Analysis
Table 67. SMCore Business Overview
Table 68. SMCore Recent Developments
Table 69. SYNUS Tech Semiconductor OHT (Overhead Hoist Transport) Basic Information
Table 70. SYNUS Tech Semiconductor OHT (Overhead Hoist Transport) Product Overview
Table 71. SYNUS Tech Semiconductor OHT (Overhead Hoist Transport) Sales (K Units), Revenue (M USD), Price (USD/Unit) and Gross Margin (2019-2025)
Table 72. SYNUS Tech Business Overview
Table 73. SYNUS Tech Recent Developments
Table 74. Shinsung EandG Semiconductor OHT (Overhead Hoist Transport) Basic Information
Table 75. Shinsung EandG Semiconductor OHT (Overhead Hoist Transport) Product Overview
Table 76. Shinsung EandG Semiconductor OHT (Overhead Hoist Transport) Sales (K Units), Revenue (M USD), Price (USD/Unit) and Gross Margin (2019-2025)
Table 77. Shinsung EandG Business Overview
Table 78. Shinsung EandG Recent Developments
Table 79. Mirle Automation Inter Semiconductor OHT (Overhead Hoist Transport) Basic Information
Table 80. Mirle Automation Inter Semiconductor OHT (Overhead Hoist Transport) Product Overview
Table 81. Mirle Automation Inter Semiconductor OHT (Overhead Hoist Transport) Sales (K Units), Revenue (M USD), Price (USD/Unit) and Gross Margin (2019-2025)
Table 82. Mirle Automation Inter Business Overview
Table 83. Mirle Automation Inter Recent Developments
Table 84. SFA Engineering Corporation Semiconductor OHT (Overhead Hoist Transport) Basic Information
Table 85. SFA Engineering Corporation Semiconductor OHT (Overhead Hoist Transport) Product Overview
Table 86. SFA Engineering Corporation Semiconductor OHT (Overhead Hoist Transport) Sales (K Units), Revenue (M USD), Price (USD/Unit) and Gross Margin (2019-2025)
Table 87. SFA Engineering Corporation Business Overview
Table 88. SFA Engineering Corporation Recent Developments
Table 89. TOTA Semiconductor OHT (Overhead Hoist Transport) Basic Information
Table 90. TOTA Semiconductor OHT (Overhead Hoist Transport) Product Overview
Table 91. TOTA Semiconductor OHT (Overhead Hoist Transport) Sales (K Units), Revenue (M USD), Price (USD/Unit) and Gross Margin (2019-2025)
Table 92. TOTA Business Overview
Table 93. TOTA Recent Developments
Table 94. KENMEC MECHANICAL ENGINEERING Semiconductor OHT (Overhead Hoist Transport) Basic Information
Table 95. KENMEC MECHANICAL ENGINEERING Semiconductor OHT (Overhead Hoist Transport) Product Overview
Table 96. KENMEC MECHANICAL ENGINEERING Semiconductor OHT (Overhead Hoist Transport) Sales (K Units), Revenue (M USD), Price (USD/Unit) and Gross Margin (2019-2025)
Table 97. KENMEC MECHANICAL ENGINEERING Business Overview
Table 98. KENMEC MECHANICAL ENGINEERING Recent Developments
Table 99. Global Semiconductor OHT (Overhead Hoist Transport) Sales Forecast by Region (2025-2032) & (K Units)
Table 100. Global Semiconductor OHT (Overhead Hoist Transport) Market Size Forecast by Region (2025-2032) & (M USD)
Table 101. North America Semiconductor OHT (Overhead Hoist Transport) Sales Forecast by Country (2025-2032) & (K Units)
Table 102. North America Semiconductor OHT (Overhead Hoist Transport) Market Size Forecast by Country (2025-2032) & (M USD)
Table 103. Europe Semiconductor OHT (Overhead Hoist Transport) Sales Forecast by Country (2025-2032) & (K Units)
Table 104. Europe Semiconductor OHT (Overhead Hoist Transport) Market Size Forecast by Country (2025-2032) & (M USD)
Table 105. Asia Pacific Semiconductor OHT (Overhead Hoist Transport) Sales Forecast by Region (2025-2032) & (K Units)
Table 106. Asia Pacific Semiconductor OHT (Overhead Hoist Transport) Market Size Forecast by Region (2025-2032) & (M USD)
Table 107. South America Semiconductor OHT (Overhead Hoist Transport) Sales Forecast by Country (2025-2032) & (K Units)
Table 108. South America Semiconductor OHT (Overhead Hoist Transport) Market Size Forecast by Country (2025-2032) & (M USD)
Table 109. Middle East and Africa Semiconductor OHT (Overhead Hoist Transport) Consumption Forecast by Country (2025-2032) & (Units)
Table 110. Middle East and Africa Semiconductor OHT (Overhead Hoist Transport) Market Size Forecast by Country (2025-2032) & (M USD)
Table 111. Global Semiconductor OHT (Overhead Hoist Transport) Sales Forecast by Type (2025-2032) & (K Units)
Table 112. Global Semiconductor OHT (Overhead Hoist Transport) Market Size Forecast by Type (2025-2032) & (M USD)
Table 113. Global Semiconductor OHT (Overhead Hoist Transport) Price Forecast by Type (2025-2032) & (USD/Unit)
Table 114. Global Semiconductor OHT (Overhead Hoist Transport) Sales (K Units) Forecast by Application (2025-2032)
Table 115. Global Semiconductor OHT (Overhead Hoist Transport) Market Size Forecast by Application (2025-2032) & (M USD)
List of Figures
Figure 1. Product Picture of Semiconductor OHT (Overhead Hoist Transport)
Figure 2. Data Triangulation
Figure 3. Key Caveats
Figure 4. Global Semiconductor OHT (Overhead Hoist Transport) Market Size (M USD), 2019-2032
Figure 5. Global Semiconductor OHT (Overhead Hoist Transport) Market Size (M USD) (2019-2032)
Figure 6. Global Semiconductor OHT (Overhead Hoist Transport) Sales (K Units) & (2019-2032)
Figure 7. Evaluation Matrix of Segment Market Development Potential (Type)
Figure 8. Evaluation Matrix of Segment Market Development Potential (Application)
Figure 9. Evaluation Matrix of Regional Market Development Potential
Figure 10. Semiconductor OHT (Overhead Hoist Transport) Market Size by Country (M USD)
Figure 11. Semiconductor OHT (Overhead Hoist Transport) Sales Share by Manufacturers in 2023
Figure 12. Global Semiconductor OHT (Overhead Hoist Transport) Revenue Share by Manufacturers in 2023
Figure 13. Semiconductor OHT (Overhead Hoist Transport) Market Share by Company Type (Tier 1, Tier 2 and Tier 3): 2023
Figure 14. Global Market Semiconductor OHT (Overhead Hoist Transport) Average Price (USD/Unit) of Key Manufacturers in 2023
Figure 15. The Global 5 and 10 Largest Players: Market Share by Semiconductor OHT (Overhead Hoist Transport) Revenue in 2023
Figure 16. Evaluation Matrix of Segment Market Development Potential (Type)
Figure 17. Global Semiconductor OHT (Overhead Hoist Transport) Market Share by Type
Figure 18. Sales Market Share of Semiconductor OHT (Overhead Hoist Transport) by Type (2019-2025)
Figure 19. Sales Market Share of Semiconductor OHT (Overhead Hoist Transport) by Type in 2023
Figure 20. Market Size Share of Semiconductor OHT (Overhead Hoist Transport) by Type (2019-2025)
Figure 21. Market Size Market Share of Semiconductor OHT (Overhead Hoist Transport) by Type in 2023
Figure 22. Evaluation Matrix of Segment Market Development Potential (Application)
Figure 23. Global Semiconductor OHT (Overhead Hoist Transport) Market Share by Application
Figure 24. Global Semiconductor OHT (Overhead Hoist Transport) Sales Market Share by Application (2019-2025)
Figure 25. Global Semiconductor OHT (Overhead Hoist Transport) Sales Market Share by Application in 2023
Figure 26. Global Semiconductor OHT (Overhead Hoist Transport) Market Share by Application (2019-2025)
Figure 27. Global Semiconductor OHT (Overhead Hoist Transport) Market Share by Application in 2023
Figure 28. Global Semiconductor OHT (Overhead Hoist Transport) Sales Growth Rate by Application (2019-2025)
Figure 29. Global Semiconductor OHT (Overhead Hoist Transport) Sales Market Share by Region (2019-2025)
Figure 30. North America Semiconductor OHT (Overhead Hoist Transport) Sales and Growth Rate (2019-2025) & (K Units)
Figure 31. North America Semiconductor OHT (Overhead Hoist Transport) Sales Market Share by Country in 2023
Figure 32. U.S. Semiconductor OHT (Overhead Hoist Transport) Sales and Growth Rate (2019-2025) & (K Units)
Figure 33. Canada Semiconductor OHT (Overhead Hoist Transport) Sales (K Units) and Growth Rate (2019-2025)
Figure 34. Mexico Semiconductor OHT (Overhead Hoist Transport) Sales (Units) and Growth Rate (2019-2025)
Figure 35. Europe Semiconductor OHT (Overhead Hoist Transport) Sales and Growth Rate (2019-2025) & (K Units)
Figure 36. Europe Semiconductor OHT (Overhead Hoist Transport) Sales Market Share by Country in 2023
Figure 37. Germany Semiconductor OHT (Overhead Hoist Transport) Sales and Growth Rate (2019-2025) & (K Units)
Figure 38. France Semiconductor OHT (Overhead Hoist Transport) Sales and Growth Rate (2019-2025) & (K Units)
Figure 39. U.K. Semiconductor OHT (Overhead Hoist Transport) Sales and Growth Rate (2019-2025) & (K Units)
Figure 40. Italy Semiconductor OHT (Overhead Hoist Transport) Sales and Growth Rate (2019-2025) & (K Units)
Figure 41. Russia Semiconductor OHT (Overhead Hoist Transport) Sales and Growth Rate (2019-2025) & (K Units)
Figure 42. Asia Pacific Semiconductor OHT (Overhead Hoist Transport) Sales and Growth Rate (K Units)
Figure 43. Asia Pacific Semiconductor OHT (Overhead Hoist Transport) Sales Market Share by Region in 2023
Figure 44. China Semiconductor OHT (Overhead Hoist Transport) Sales and Growth Rate (2019-2025) & (K Units)
Figure 45. Japan Semiconductor OHT (Overhead Hoist Transport) Sales and Growth Rate (2019-2025) & (K Units)
Figure 46. South Korea Semiconductor OHT (Overhead Hoist Transport) Sales and Growth Rate (2019-2025) & (K Units)
Figure 47. India Semiconductor OHT (Overhead Hoist Transport) Sales and Growth Rate (2019-2025) & (K Units)
Figure 48. Southeast Asia Semiconductor OHT (Overhead Hoist Transport) Sales and Growth Rate (2019-2025) & (K Units)
Figure 49. South America Semiconductor OHT (Overhead Hoist Transport) Sales and Growth Rate (K Units)
Figure 50. South America Semiconductor OHT (Overhead Hoist Transport) Sales Market Share by Country in 2023
Figure 51. Brazil Semiconductor OHT (Overhead Hoist Transport) Sales and Growth Rate (2019-2025) & (K Units)
Figure 52. Argentina Semiconductor OHT (Overhead Hoist Transport) Sales and Growth Rate (2019-2025) & (K Units)
Figure 53. Columbia Semiconductor OHT (Overhead Hoist Transport) Sales and Growth Rate (2019-2025) & (K Units)
Figure 54. Middle East and Africa Semiconductor OHT (Overhead Hoist Transport) Sales and Growth Rate (K Units)
Figure 55. Middle East and Africa Semiconductor OHT (Overhead Hoist Transport) Sales Market Share by Region in 2023
Figure 56. Saudi Arabia Semiconductor OHT (Overhead Hoist Transport) Sales and Growth Rate (2019-2025) & (K Units)
Figure 57. UAE Semiconductor OHT (Overhead Hoist Transport) Sales and Growth Rate (2019-2025) & (K Units)
Figure 58. Egypt Semiconductor OHT (Overhead Hoist Transport) Sales and Growth Rate (2019-2025) & (K Units)
Figure 59. Nigeria Semiconductor OHT (Overhead Hoist Transport) Sales and Growth Rate (2019-2025) & (K Units)
Figure 60. South Africa Semiconductor OHT (Overhead Hoist Transport) Sales and Growth Rate (2019-2025) & (K Units)
Figure 61. Global Semiconductor OHT (Overhead Hoist Transport) Production Market Share by Region (2019-2025)
Figure 62. North America Semiconductor OHT (Overhead Hoist Transport) Production (K Units) Growth Rate (2019-2025)
Figure 63. Europe Semiconductor OHT (Overhead Hoist Transport) Production (K Units) Growth Rate (2019-2025)
Figure 64. Japan Semiconductor OHT (Overhead Hoist Transport) Production (K Units) Growth Rate (2019-2025)
Figure 65. China Semiconductor OHT (Overhead Hoist Transport) Production (K Units) Growth Rate (2019-2025)
Figure 66. Global Semiconductor OHT (Overhead Hoist Transport) Sales Forecast by Volume (2019-2032) & (K Units)
Figure 67. Global Semiconductor OHT (Overhead Hoist Transport) Market Size Forecast by Value (2019-2032) & (M USD)
Figure 68. Global Semiconductor OHT (Overhead Hoist Transport) Sales Market Share Forecast by Type (2025-2032)
Figure 69. Global Semiconductor OHT (Overhead Hoist Transport) Market Share Forecast by Type (2025-2032)
Figure 70. Global Semiconductor OHT (Overhead Hoist Transport) Sales Forecast by Application (2025-2032)
Figure 71. Global Semiconductor OHT (Overhead Hoist Transport) Market Share Forecast by Application (2025-2032)



