SEMICONDUCTOR INSIGHT
MARKET RESEARCH REPORT

Fluorinated Photovoltaic Backsheet Market

2026 to 2034
MARKET INTELLIGENCE
ACROSS KEY REGIONS
2026 EDITION
SOLAR CELLS Semiconductor Market Research

Fluorinated Photovoltaic Backsheet Market

Size, Share & Industry Analysis, By Type (Double-Sided Fluorine-Containing Backsheet, Single-Sided Fluorine-Containing Backsheet), By Application (Standard PV Modules, High-Temperature Environments, Harsh Climate Installations, Others), By End User (Utility-Scale Power Plants, Commercial & Industrial Projects, Residential Installations), By Thickness (0.10-0.25 mm, 0.25-0.30 mm, 0.30-0.35 mm), and Regional Forecast, 2026-2034

◷
UPDATED 08 October 2026
▤
REPORT LENGTH Detailed Report
▣
REPORT CODE 396a16e8786b
▯
FORMATS PDF

Fluorinated photovoltaic backsheet market was valued at USD 1.02 billion in 2025 and is projected to reach USD 1.63 billion by 2034, growing at a CAGR of 5.4% over the 2026–2034 forecast period. Europe held the largest regional position in 2025, while Asia Pacific has the strongest growth profile.

Get the sample PDF with study scope, segmentation and methodology details.

Key Statistics

2025 Market Size
USD 1.02 billion
2034 Projected Market Size
USD 1.63 billion
CAGR (2026–2034)
5.4%
Largest Market in 2025
Europe

Key Takeaways

  • Double-Sided Fluorine-Containing Backsheet is a leading product category because it addresses the largest current application base.
  • Standard PV Modules is a major application, with demand shaped by performance, reliability and system integration.
  • Europe leads current market value, while Asia Pacific provides the strongest growth profile.
  • Longer module lifetimes, stronger weatherability and lower lifecycle risk in harsh environments is the main technology direction influencing new design wins.
  • Market size and growth: USD 1.02 billion in 2025 is projected to reach USD 1.63 billion by 2034 at a 5.4% CAGR during 2026–2034.

Fluorinated Photovoltaic Backsheet Market Overview

Fluorinated photovoltaic backsheet market was valued at USD 1.02 billion in 2025 and is projected to reach USD 1.63 billion by 2034, growing at a CAGR of 5.4% over the 2026–2034 forecast period. Europe held the largest regional position in 2025, while Asia Pacific has the strongest growth profile.

Base year: 2025 · Estimated year: 2026 · Forecast period: 2026–2034 · Historical data: 2021–2025 · Values in USD

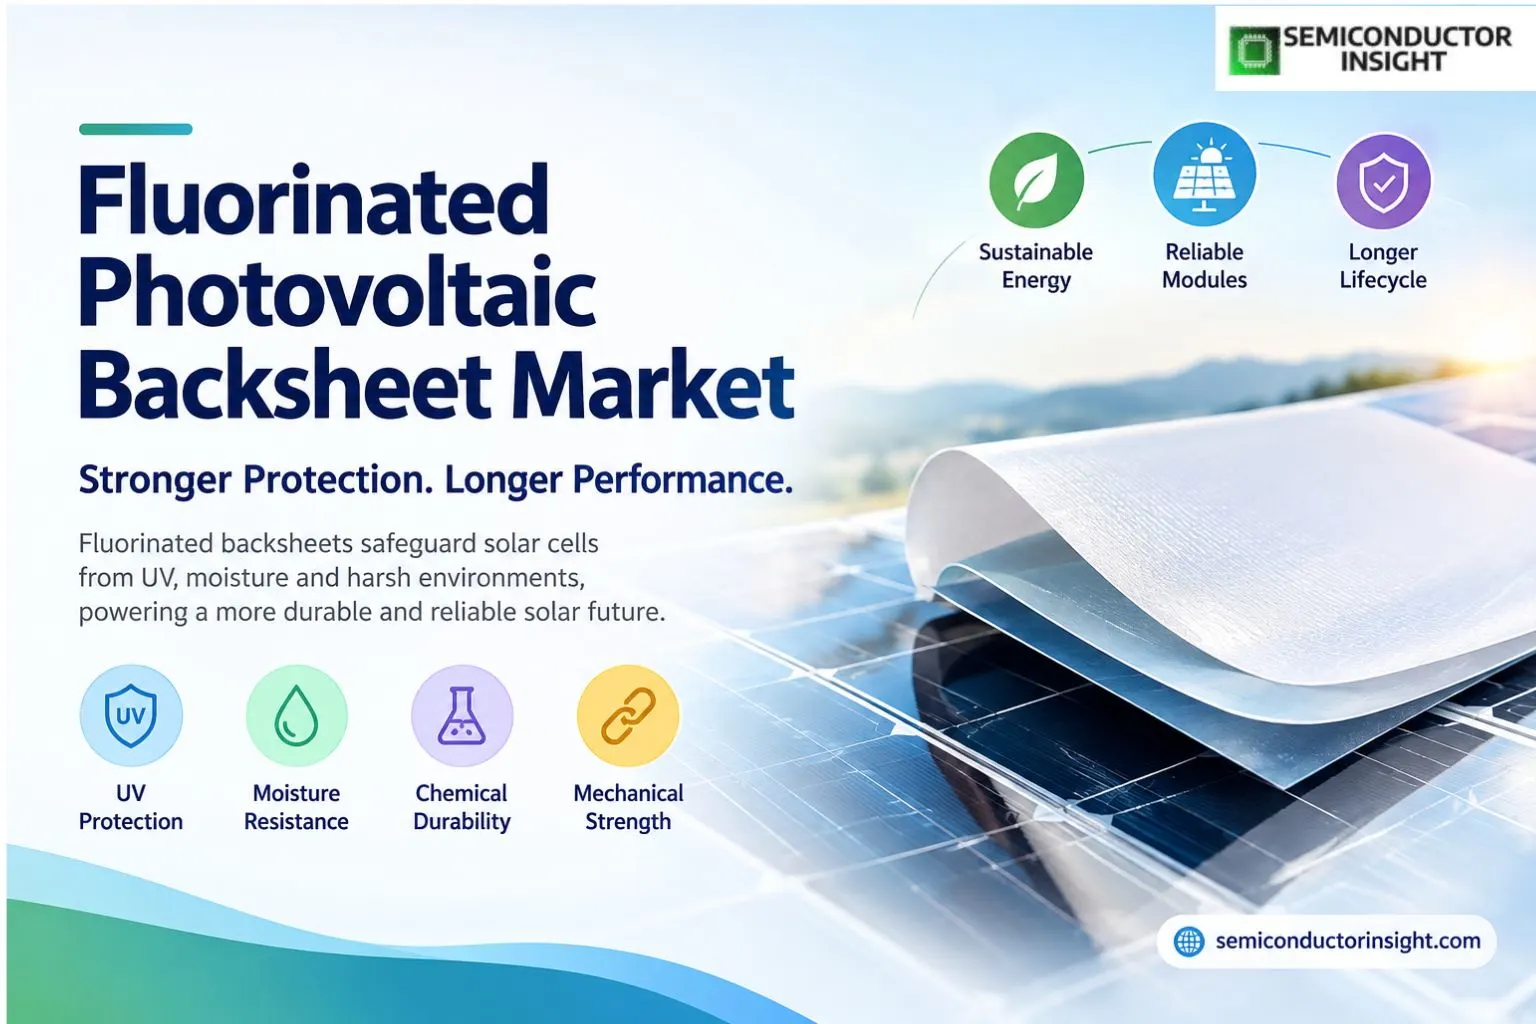
Fluorinated photovoltaic backsheets are multilayer protective laminates that use PVF, PVDF or other fluoropolymer films to protect solar cells against ultraviolet exposure, moisture, chemicals and mechanical stress. Commercial decisions in the Fluorinated Photovoltaic Backsheet market therefore depend on system integration, qualification effort, reliability, lifecycle support and measurable operating value rather than on one specification alone.

The market is valued at USD 1.015 billion in 2025 and reaches USD 1.626 billion by 2034, representing a 5.4% CAGR. Europe is the most mature adoption region because project financiers and module buyers place strong emphasis on long-term durability and lifecycle risk. Supplier selection also reflects manufacturing consistency, regional technical support, product availability and the ability to sustain qualified designs through multi-year customer programs.

DuPont states that Tedlar PVF-based backsheets have been field-proven for more than 30 years across deserts, tropical, coastal and mountainous climates, with weatherability, mechanical strength and adhesion central to long-duration module protection. Buyers increasingly compare total system impact, implementation complexity and long-term service requirements alongside component price, which creates room for technically differentiated suppliers.

Segment Analysis: By Type

By type, the fluorinated photovoltaic backsheet market is segmented into Double-Sided Fluorine-Containing Backsheet, Single-Sided Fluorine-Containing Backsheet. Each category has a distinct functional role and commercial position, so the analysis emphasizes use case, integration and competitive relevance rather than repeating a single market statistic across every row. Adoption varies by customer architecture and replacement cycle, so demand is strongest where the technology solves a clear performance, reliability or integration problem.

Type Function Market position
Double-Sided Fluorine-Containing Backsheet Double-Sided Fluorine-Containing Backsheet addresses a distinct architecture or performance requirement within the Fluorinated Photovoltaic Backsheet market. Commercial demand depends on application fit, qualification, cost and lifecycle requirements rather than a single headline statistic.
Single-Sided Fluorine-Containing Backsheet Single-Sided Fluorine-Containing Backsheet addresses a distinct architecture or performance requirement within the Fluorinated Photovoltaic Backsheet market. Commercial demand depends on application fit, qualification, cost and lifecycle requirements rather than a single headline statistic.

Pricing by type

Double-sided fluorinated structures command the highest premiums because both faces receive durable fluoropolymer protection, while single-sided designs balance cost and long-term weatherability. That market structure favors suppliers able to combine product performance with stable supply, application engineering and documented quality across the intended operating environment. Commercial decisions in the Fluorinated Photovoltaic Backsheet market therefore depend on system integration, qualification effort, reliability, lifecycle support and measurable operating value rather than on one specification alone.

Segment Analysis: By Application

By application, the market is segmented into Standard PV Modules, High-Temperature Environments, Harsh Climate Installations, Others. Application economics differ by qualification, lifecycle, reliability and system-level value, so each row below uses context specific to that application rather than mechanically repeating headline evidence. Supplier selection also reflects manufacturing consistency, regional technical support, product availability and the ability to sustain qualified designs through multi-year customer programs.

Application Demand characteristics
Standard PV Modules Standard PV Modules creates demand where fluorinated photovoltaic backsheet improves integration, performance, reliability or system economics.
High-Temperature Environments High-Temperature Environments creates demand where fluorinated photovoltaic backsheet improves integration, performance, reliability or system economics.
Harsh Climate Installations Harsh Climate Installations creates demand where fluorinated photovoltaic backsheet improves integration, performance, reliability or system economics.
Others Others creates demand where fluorinated photovoltaic backsheet improves integration, performance, reliability or system economics.

Regional Analysis

Europe leads current market value, while Asia Pacific has the strongest growth profile. Regional demand is shaped by manufacturing concentration, technology adoption, customer investment cycles and local supplier ecosystems. Buyers increasingly compare total system impact, implementation complexity and long-term service requirements alongside component price, which creates room for technically differentiated suppliers.

How does regional demand differ across the fluorinated photovoltaic backsheet market?

Asia Pacific provides the deepest manufacturing scale, North America contributes high-value technology and enterprise demand, and Europe remains important in industrial, automotive and regulated applications. South America and the Middle East & Africa are smaller but developing markets. Adoption varies by customer architecture and replacement cycle, so demand is strongest where the technology solves a clear performance, reliability or integration problem.

Region Position Growth outlook Demand profile What decides supplier selection
Asia Pacific High Highest module manufacturing, solar capacity growth and cost-sensitive premium adoption Supply scale and qualification
North America High Moderate-high utility solar, harsh-climate installations and bankability-focused procurement Technology capability and service
Europe Large Moderate durability standards, long-term asset quality and premium module specifications Compliance and lifecycle
South America Smaller Moderate Import/industrial led Cost and distribution
Middle East & Africa Smallest base Emerging Infrastructure led Project support

Asia Pacific KEY REGION

What shapes demand in Asia Pacific?

Asia Pacific demand is led by China, Japan, South Korea, Taiwan and India, with module manufacturing, solar capacity growth and cost-sensitive premium adoption shaping the regional opportunity. That market structure favors suppliers able to combine product performance with stable supply, application engineering and documented quality across the intended operating environment.

Market positionHigh
Growth outlookHighest
Demand profilemodule manufacturing, solar capacity growth and cost-sensitive premium adoption
Market access gateSupply scale and qualification
Country Position in region What drives demand
China Largest scale Manufacturing and end-market demand.
Japan High-spec Technology and industrial applications.
South Korea Advanced electronics High-value manufacturing and digital infrastructure.
India High growth Infrastructure and enterprise adoption.

Market instances

  • Manufacturing scale supports fast commercialization. Local supply chains reduce lead times and qualification friction.
  • China and India expand the addressable base. Demand grows through infrastructure, industrialization and digital adoption.
In the full report: country-level market size, segment revenue, supplier analysis and forecast detail across 2021–2034.

North America HIGH-VALUE REGION

What shapes demand in North America?

North America is a high-value market where utility solar, harsh-climate installations and bankability-focused procurement supports premium demand and early technology adoption. Commercial decisions in the Fluorinated Photovoltaic Backsheet market therefore depend on system integration, qualification effort, reliability, lifecycle support and measurable operating value rather than on one specification alone. Supplier selection also reflects manufacturing consistency, regional technical support, product availability and the ability to sustain qualified designs through multi-year customer programs.

Market positionHigh
Growth outlookModerate-high
Demand profileutility solar, harsh-climate installations and bankability-focused procurement
Market access gateTechnology capability and service
Country Position in region What drives demand
United States Dominant Technology, enterprise and industrial demand.
Canada Established Industrial and communications applications.
Mexico Manufacturing support Electronics and automotive assembly.

Market instances

  • The United States anchors regional value. Large OEM, cloud and enterprise ecosystems support advanced deployments.
  • Supplier support matters. Customers value long lifecycle, integration and application engineering.
In the full report: country-level market size, segment revenue, supplier analysis and forecast detail across 2021–2034.

Europe HIGH-VALUE REGION

What shapes demand in Europe?

Europe is a technically demanding market where durability standards, long-term asset quality and premium module specifications supports qualified, long-lifecycle products. Buyers increasingly compare total system impact, implementation complexity and long-term service requirements alongside component price, which creates room for technically differentiated suppliers. Adoption varies by customer architecture and replacement cycle, so demand is strongest where the technology solves a clear performance, reliability or integration problem.

Market positionLarge
Growth outlookModerate
Demand profiledurability standards, long-term asset quality and premium module specifications
Market access gateCompliance and lifecycle
Country Position in region What drives demand
Germany Largest Automotive and industrial applications.
France High-value Industrial, aerospace and digital systems.
United Kingdom Technology led Enterprise, telecom and research demand.
Italy Industrial Machinery and electronics applications.

Market instances

  • Qualification and compliance influence supplier selection. Customers emphasize reliability and support.
  • Industrial and automotive demand supports durable revenue. Long product cycles create sticky design wins.
In the full report: country-level market size, segment revenue, supplier analysis and forecast detail across 2021–2034.

South America

What shapes demand in South America?

South America is a smaller market led by Brazil, with demand concentrated in industrial modernization, telecom and imported systems. That market structure favors suppliers able to combine product performance with stable supply, application engineering and documented quality across the intended operating environment. Commercial decisions in the Fluorinated Photovoltaic Backsheet market therefore depend on system integration, qualification effort, reliability, lifecycle support and measurable operating value rather than on one specification alone.

Market positionSmaller
Growth outlookModerate
Demand profileImport/industrial led
Market access gateCost and distribution
Country Position in region What drives demand
Brazil Largest Industrial and electronics demand.
Argentina Niche Enterprise and industrial applications.
Rest of region Import led Demand follows infrastructure investment.

Market instances

  • Brazil anchors the regional opportunity. Local industry creates the largest addressable base.
  • Distribution and landed cost matter. Most advanced products rely on imported supply.
In the full report: country-level market size, segment revenue, supplier analysis and forecast detail across 2021–2034.

Middle East & Africa EMERGING

What shapes demand in Middle East & Africa?

Middle East & Africa is an emerging market where digital infrastructure, energy and industrial projects create selective demand. Supplier selection also reflects manufacturing consistency, regional technical support, product availability and the ability to sustain qualified designs through multi-year customer programs. Buyers increasingly compare total system impact, implementation complexity and long-term service requirements alongside component price, which creates room for technically differentiated suppliers.

Market positionSmallest base
Growth outlookEmerging
Demand profileInfrastructure led
Market access gateProject support
Country Position in region What drives demand
UAE Technology led Digital infrastructure and enterprise systems.
Saudi Arabia Growth market Infrastructure and industrial investment.
South Africa Industrial niche Automation and enterprise demand.

Market instances

  • Gulf projects support premium deployments. New infrastructure can adopt advanced architectures from the outset.
  • Regional demand is project-based. Supplier service and local integration remain important.
In the full report: country-level market size, segment revenue, supplier analysis and forecast detail across 2021–2034.

Key Fluorinated Photovoltaic Backsheet Manufacturers and Competitive Landscape

The competitive landscape includes Cybrid Technologies, Jolywood, Coveme, Luckyfilm, Taiflex, Toppan, Zhongtian Technologies, Hangzhou First PV Material, Krempel, DuPont. Adoption varies by customer architecture and replacement cycle, so demand is strongest where the technology solves a clear performance, reliability or integration problem. That market structure favors suppliers able to combine product performance with stable supply, application engineering and documented quality across the intended operating environment.

Competition centers on longer module lifetimes, stronger weatherability and lower lifecycle risk in harsh environments, customer qualification, manufacturing consistency and application support. Once a product is designed into a long-lifecycle system, switching costs can protect incumbent positions but also raise the importance of roadmap continuity. Commercial decisions in the Fluorinated Photovoltaic Backsheet market therefore depend on system integration, qualification effort, reliability, lifecycle support and measurable operating value rather than on one specification alone.

Tier structure

Tier Companies Basis of competition
Tier 1 Cybrid Technologies, Jolywood, Coveme, Luckyfilm Global scale, broad customer qualification and advanced technology portfolios.
Tier 2 Taiflex, Toppan, Zhongtian Technologies, Hangzhou First PV Material Strong specialist capability, regional design wins and application-focused portfolios.
Tier 3 Regional and niche suppliers Cost competition, customization and specialized customer support.

Key companies profiled

  • Cybrid Technologies
  • Jolywood
  • Coveme
  • Luckyfilm
  • Taiflex
  • Toppan
  • Zhongtian Technologies
  • Hangzhou First PV Material
  • Krempel
  • DuPont

Fluorinated Photovoltaic Backsheet Production Capacity Analysis

Production capacity in the Fluorinated Photovoltaic Backsheet market is shaped by the underlying manufacturing process, qualification burden and customer-specific configuration. Suppliers must balance equipment utilization with quality control because high-volume output only creates value when yield, reliability and traceability remain stable. Supplier selection also reflects manufacturing consistency, regional technical support, product availability and the ability to sustain qualified designs through multi-year customer programs.

Capacity additions tend to follow customer program ramps rather than headline market growth alone. Regional supply resilience is becoming more important, particularly where customers require second-source planning, long product lifecycles or shorter engineering-response times. Buyers increasingly compare total system impact, implementation complexity and long-term service requirements alongside component price, which creates room for technically differentiated suppliers.

The practical bottleneck is often qualified output rather than nominal installed capacity. Manufacturing, assembly, test and application support must scale together to avoid creating capacity that cannot be used in production programs. Adoption varies by customer architecture and replacement cycle, so demand is strongest where the technology solves a clear performance, reliability or integration problem.

Fluorinated Photovoltaic Backsheet Market Dynamics: Drivers, Restraints and Opportunities

The Fluorinated Photovoltaic Backsheet market is shaped by growth is driven by long-duration solar projects, harsh-climate deployment, bankability requirements and demand for modules that maintain insulation and adhesion over decades. At the same time, growth is constrained by fluoropolymer cost, regulatory scrutiny around fluorinated chemistries, competition from non-fluorinated backsheets and glass-glass module designs. The strongest commercial opportunities are concentrated in premium utility modules, desert installations, high-humidity climates and long-warranty projects create the strongest opportunities.

MARKET DRIVERS

Drivers Impact Analysis*

Driver (~) % impact on CAGR forecast Geographic relevance Impact timeline
Technology upgrade cycle +1.6% Global; strongest in leading adopter markets Near to medium term
End-market expansion +1.2% Application-specific Near term
Higher value per system +0.8% Premium and advanced systems Medium term

Technology adoption expands addressable demand

Growth is driven by long-duration solar projects, harsh-climate deployment, bankability requirements and demand for modules that maintain insulation and adhesion over decades. This demand is strongest where customers can measure a clear improvement in system performance, footprint, energy efficiency, reliability or operating cost. That market structure favors suppliers able to combine product performance with stable supply, application engineering and documented quality across the intended operating environment.

End-market modernization increases content per system

The technology upgrade cycle supports replacement and redesign activity as OEMs move to higher-performance architectures. New designs typically create the best opportunity because suppliers can influence specifications before qualification is locked. Commercial decisions in the Fluorinated Photovoltaic Backsheet market therefore depend on system integration, qualification effort, reliability, lifecycle support and measurable operating value rather than on one specification alone.

Higher-value architectures support premium mix

Expanding end markets also increase content per system, creating value growth even when unit shipments grow more slowly. Suppliers that combine engineering support with reliable supply are better positioned to capture those design transitions. Supplier selection also reflects manufacturing consistency, regional technical support, product availability and the ability to sustain qualified designs through multi-year customer programs.

MARKET RESTRAINTS

Restraints Impact Analysis*

Restraint (~) % impact on CAGR forecast Geographic relevance Impact timeline
Qualification and integration burden -0.7% Global Ongoing
Price and substitution pressure -0.5% Cost-sensitive applications Ongoing
Supply-chain or process complexity -0.4% Global Medium term

Qualification burden slows supplier switching

Growth is constrained by fluoropolymer cost, regulatory scrutiny around fluorinated chemistries, competition from non-fluorinated backsheets and glass-glass module designs. These constraints are most significant where customers have qualified alternatives or where the technology must prove a clear system-level advantage over lower-cost incumbent solutions. Buyers increasingly compare total system impact, implementation complexity and long-term service requirements alongside component price, which creates room for technically differentiated suppliers.

Price competition limits margin expansion

Qualification and integration can extend sales cycles because customers must validate performance, reliability and compatibility in their own system environment. That makes early engineering engagement important for new suppliers. Adoption varies by customer architecture and replacement cycle, so demand is strongest where the technology solves a clear performance, reliability or integration problem.

Alternative technologies constrain selected use cases

Supply-chain complexity can also limit growth when specialized materials, tooling, test or regional support are required. Customers increasingly evaluate resilience alongside price when choosing long-lifecycle suppliers. That market structure favors suppliers able to combine product performance with stable supply, application engineering and documented quality across the intended operating environment. Commercial decisions in the Fluorinated Photovoltaic Backsheet market therefore depend on system integration, qualification effort, reliability, lifecycle support and measurable operating value rather than on one specification alone.

MARKET OPPORTUNITIES

Advanced integration creates premium opportunities

Premium utility modules, desert installations, high-humidity climates and long-warranty projects create the strongest opportunities. The most attractive opportunities are where customers are redesigning systems rather than simply replacing like-for-like components. Supplier selection also reflects manufacturing consistency, regional technical support, product availability and the ability to sustain qualified designs through multi-year customer programs.

Regional capacity and supply resilience

Longer module lifetimes, stronger weatherability and lower lifecycle risk in harsh environments can create premium value when it lowers system complexity, improves performance or supports a new product architecture that is difficult to achieve with incumbent approaches. Buyers increasingly compare total system impact, implementation complexity and long-term service requirements alongside component price, which creates room for technically differentiated suppliers.

Application engineering deepens customer value

Regional engineering support and application-specific customization provide another route to growth because customers increasingly expect suppliers to support qualification, transition planning and lifecycle management. Adoption varies by customer architecture and replacement cycle, so demand is strongest where the technology solves a clear performance, reliability or integration problem. That market structure favors suppliers able to combine product performance with stable supply, application engineering and documented quality across the intended operating environment.

Fluorinated Photovoltaic Backsheet Supply Chain Analysis

Upstream. PVF or PVDF film, PET core layers, adhesives, coating and lamination, surface treatment, electrical-insulation testing and weathering qualification form the supply chain. Supply quality at this stage directly affects downstream yield, reliability and cost. Commercial decisions in the Fluorinated Photovoltaic Backsheet market therefore depend on system integration, qualification effort, reliability, lifecycle support and measurable operating value rather than on one specification alone.

UpstreamElectromechanical relays, microcontrollers, passive components, moulded housings, DIN clips, terminal blocks
ManufacturingPCB assembly, housing moulding, calibration and functional test, approval marking
ChannelElectrical wholesalers, industrial distributors, catalogue houses, direct OEM supply
DownstreamPanel builders, machine OEMs, electrical contractors, facility maintenance, utilities

Manufacturing. Core production combines process control, assembly, inspection and test, with product-specific qualification used to verify performance before customer shipment. Supplier selection also reflects manufacturing consistency, regional technical support, product availability and the ability to sustain qualified designs through multi-year customer programs. Buyers increasingly compare total system impact, implementation complexity and long-term service requirements alongside component price, which creates room for technically differentiated suppliers.

Distribution. High-value programs are typically won through direct OEM, Tier-1 or design-house engagement, while distributors serve prototypes, regional customers and lower-volume applications. Adoption varies by customer architecture and replacement cycle, so demand is strongest where the technology solves a clear performance, reliability or integration problem. That market structure favors suppliers able to combine product performance with stable supply, application engineering and documented quality across the intended operating environment.

Downstream. End users integrate the product into systems where switching costs rise after qualification, making lifecycle support and supply continuity commercially important. Commercial decisions in the Fluorinated Photovoltaic Backsheet market therefore depend on system integration, qualification effort, reliability, lifecycle support and measurable operating value rather than on one specification alone.

Downstream. Panel builders and machine OEMs are the primary specifying customers, followed by electrical contractors working on building services and by facility maintenance teams handling replacement. The specification decision is usually made once, at panel design, and then repeats for the life of the design — which makes design-in position considerably more valuable than any individual transaction.

Recent Developments in the Fluorinated Photovoltaic Backsheet Market

Developments tracked through September 2026. Items are selected for direct relevance to product technology, deployment or standards. Supplier selection also reflects manufacturing consistency, regional technical support, product availability and the ability to sustain qualified designs through multi-year customer programs. Buyers increasingly compare total system impact, implementation complexity and long-term service requirements alongside component price, which creates room for technically differentiated suppliers.

  • 2026 Sustainability
    DuPont Tedlar operations move to renewable electricity DuPont announced that Tedlar PVF film manufacturing operations in the United States are powered by 100% renewable electricity through renewable energy certificates. Source
  • 2026 Current
    Tedlar remains positioned for long-life PV modules DuPont continues positioning Tedlar PVF-based backsheets around weatherability, mechanical strength and adhesion over multi-decade solar-module lifetimes. Source
  • 2026 Current
    Premium backsheets target harsh climates Fluorinated backsheet designs remain focused on UV, thermal, moisture and chemical resistance where asset life and warranty risk are critical. Source

REPORT SCOPE & SEGMENTATION

Attribute Details
Study Period 2021–2034
Base Year 2025
Estimated Year 2026
Forecast Period 2026–2034
Historical Period 2021–2025
Market Size 2025 USD 1.02 billion
Market Size 2034 USD 1.63 billion
Growth Rate CAGR of 5.4% from 2026–2034
Unit Value (USD Million)
Segmentation By Type, By Application, By End User, By Thickness, and By Region
By Type Double-Sided Fluorine-Containing Backsheet · Single-Sided Fluorine-Containing Backsheet
By Application Standard PV Modules · High-Temperature Environments · Harsh Climate Installations · Others
By Thickness 0.10-0.25 mm · 0.25-0.30 mm · 0.30-0.35 mm
By End User Utility-Scale Power Plants · Commercial & Industrial Projects · Residential Installations
By Region Each region analysed by Type, Application and Country
North AmericaU.S., Canada, Mexico
EuropeGermany, France, U.K., Italy, Russia, Nordic Countries, Benelux
AsiaChina, Japan, South Korea, India, Southeast Asia
South AmericaBrazil, Argentina, Rest of South America
Middle East & AfricaTurkey, Israel, Saudi Arabia, UAE, Rest of MEA
Key Companies Profiled Cybrid Technologies, Jolywood, Coveme, Luckyfilm, Taiflex, Toppan, Zhongtian Technologies, Hangzhou First PV Material, Krempel, DuPont
Customization Scope Free report customization (equivalent to up to 4 analyst working days) with purchase. Addition or alteration to country, regional and segment scope.

Frequently Asked Questions

What is the current size of the Fluorinated Photovoltaic Backsheet market?

The market is valued at USD 1.02 billion in 2025 and is projected to reach USD 1.63 billion by 2034, expanding at a 5.4% CAGR during 2026–2034.

Which companies lead the Fluorinated Photovoltaic Backsheet market?

Key participants include Cybrid Technologies, Jolywood, Coveme, Luckyfilm, Taiflex, Toppan, Zhongtian Technologies, Hangzhou First PV Material.

What is Fluorinated Photovoltaic Backsheet?

Fluorinated photovoltaic backsheets are multilayer protective laminates that use PVF, PVDF or other fluoropolymer films to protect solar cells against ultraviolet exposure, moisture, chemicals and mechanical stress.

What are the main product types?

The market includes Double-Sided Fluorine-Containing Backsheet, Single-Sided Fluorine-Containing Backsheet.

What are the key applications?

The principal applications are Standard PV Modules, High-Temperature Environments, Harsh Climate Installations, Others.

Which region leads the market?

Europe leads current market value, while Asia Pacific has the strongest growth profile.

What drives market growth?

Growth is driven by long-duration solar projects, harsh-climate deployment, bankability requirements and demand for modules that maintain insulation and adhesion over decades.

What are the main challenges?

Growth is constrained by fluoropolymer cost, regulatory scrutiny around fluorinated chemistries, competition from non-fluorinated backsheets and glass-glass module designs.

Research Sources & Evidence Base

View research sources used for this overview
  1. DuPont. Tedlar Backsheets, current PVF backsheet durability and module-lifetime context.
  2. DuPont. Tedlar Renewable Electricity Announcement, 2026 manufacturing sustainability update.
Fluorinated Photovoltaic Backsheet Market Size, Share & Industry Analysis, By Type (Double-Sided Fluorine-Containing Backsheet, Single-Sided Fluorine-Containing Backsheet), By Application (Standard PV Modules, High-Temperature Environments, Harsh Climate Installations, Others), By End User (Utility-Scale Power Plants, Commercial & Industrial Projects, Residential Installations), By Thickness (0.10-0.25 mm, 0.25-0.30 mm, 0.30-0.35 mm), and Regional Forecast, 2026-2034

Get Sample Report PDF for Exclusive Insights

Report Sample Includes

  • Table of Contents
  • List of Tables & Figures
  • Charts, Research Methodology, and more...

PDF Icon Download Sample Report PDF
SKU: 396a16e8786b
Category:
License Type

Corporate License, Excel License, PDF and Excel Databook License

Download Sample Report

Table of Content

1 Introduction to Research & Analysis Reports
1.1 Fluorinated Photovoltaic Backsheet Market Definition
1.2 Market Segments
1.2.1 Segment by Type
1.2.2 Segment by Mounted
1.2.3 Segment by Thickness
1.2.4 Segment by Application
1.3 Global Fluorinated Photovoltaic Backsheet Market Overview
1.4 Features & Benefits of This Report
1.5 Methodology & Sources of Information
1.5.1 Research Methodology
1.5.2 Research Process
1.5.3 Base Year
1.5.4 Report Assumptions & Caveats
2 Global Fluorinated Photovoltaic Backsheet Overall Market Size
2.1 Global Fluorinated Photovoltaic Backsheet Market Size: 2025 VS 2032
2.2 Global Fluorinated Photovoltaic Backsheet Market Size, Prospects & Forecasts: 2026-2034
2.3 Global Fluorinated Photovoltaic Backsheet Sales: 2026-2034
3 Company Landscape
3.1 Top Fluorinated Photovoltaic Backsheet Players in Global Market
3.2 Top Global Fluorinated Photovoltaic Backsheet Companies Ranked by Revenue
3.3 Global Fluorinated Photovoltaic Backsheet Revenue by Companies
3.4 Global Fluorinated Photovoltaic Backsheet Sales by Companies
3.5 Global Fluorinated Photovoltaic Backsheet Price by Manufacturer (2021-2026)
3.6 Top 3 and Top 5 Fluorinated Photovoltaic Backsheet Companies in Global Market, by Revenue in 2025
3.7 Global Manufacturers Fluorinated Photovoltaic Backsheet Product Type
3.8 Tier 1, Tier 2, and Tier 3 Fluorinated Photovoltaic Backsheet Players in Global Market
3.8.1 List of Global Tier 1 Fluorinated Photovoltaic Backsheet Companies
3.8.2 List of Global Tier 2 and Tier 3 Fluorinated Photovoltaic Backsheet Companies
4 Sights by Type
4.1 Overview
4.1.1 Segment by Type – Global Fluorinated Photovoltaic Backsheet Market Size Markets, 2025 & 2032
4.1.2 Double-Sided Fluorine-Containing Backsheet
4.1.3 Single-Sided Fluorine-Containing Backsheet
4.2 Segment by Type – Global Fluorinated Photovoltaic Backsheet Revenue & Forecasts
4.2.1 Segment by Type – Global Fluorinated Photovoltaic Backsheet Revenue, 2021-2026
4.2.2 Segment by Type – Global Fluorinated Photovoltaic Backsheet Revenue, 2027-2032
4.2.3 Segment by Type – Global Fluorinated Photovoltaic Backsheet Revenue Market Share, 2026-2034
4.3 Segment by Type – Global Fluorinated Photovoltaic Backsheet Sales & Forecasts
4.3.1 Segment by Type – Global Fluorinated Photovoltaic Backsheet Sales, 2021-2026
4.3.2 Segment by Type – Global Fluorinated Photovoltaic Backsheet Sales, 2027-2032
4.3.3 Segment by Type – Global Fluorinated Photovoltaic Backsheet Sales Market Share, 2026-2034
4.4 Segment by Type – Global Fluorinated Photovoltaic Backsheet Price (Manufacturers Selling Prices), 2026-2034
5 Sights by Mounted
5.1 Overview
5.1.1 Segment by Mounted – Global Fluorinated Photovoltaic Backsheet Market Size Markets, 2025 & 2032
5.1.2 Roof-Mounted
5.1.3 Ground-Mounted
5.2 Segment by Mounted – Global Fluorinated Photovoltaic Backsheet Revenue & Forecasts
5.2.1 Segment by Mounted – Global Fluorinated Photovoltaic Backsheet Revenue, 2021-2026
5.2.2 Segment by Mounted – Global Fluorinated Photovoltaic Backsheet Revenue, 2027-2032
5.2.3 Segment by Mounted – Global Fluorinated Photovoltaic Backsheet Revenue Market Share, 2026-2034
5.3 Segment by Mounted – Global Fluorinated Photovoltaic Backsheet Sales & Forecasts
5.3.1 Segment by Mounted – Global Fluorinated Photovoltaic Backsheet Sales, 2021-2026
5.3.2 Segment by Mounted – Global Fluorinated Photovoltaic Backsheet Sales, 2027-2032
5.3.3 Segment by Mounted – Global Fluorinated Photovoltaic Backsheet Sales Market Share, 2026-2034
5.4 Segment by Mounted – Global Fluorinated Photovoltaic Backsheet Price (Manufacturers Selling Prices), 2026-2034
6 Sights by Thickness
6.1 Overview
6.1.1 Segment by Thickness – Global Fluorinated Photovoltaic Backsheet Market Size Markets, 2025 & 2032
6.1.2 0.10 mm~0.25 mm
6.1.3 0.25 mm~ 0.30 mm
6.1.4 0.30 mm~ 0.35 mm
6.2 Segment by Thickness – Global Fluorinated Photovoltaic Backsheet Revenue & Forecasts
6.2.1 Segment by Thickness – Global Fluorinated Photovoltaic Backsheet Revenue, 2021-2026
6.2.2 Segment by Thickness – Global Fluorinated Photovoltaic Backsheet Revenue, 2027-2032
6.2.3 Segment by Thickness – Global Fluorinated Photovoltaic Backsheet Revenue Market Share, 2026-2034
6.3 Segment by Thickness – Global Fluorinated Photovoltaic Backsheet Sales & Forecasts
6.3.1 Segment by Thickness – Global Fluorinated Photovoltaic Backsheet Sales, 2021-2026
6.3.2 Segment by Thickness – Global Fluorinated Photovoltaic Backsheet Sales, 2027-2032
6.3.3 Segment by Thickness – Global Fluorinated Photovoltaic Backsheet Sales Market Share, 2026-2034
6.4 Segment by Thickness – Global Fluorinated Photovoltaic Backsheet Price (Manufacturers Selling Prices), 2026-2034
7 Sights by Application
7.1 Overview
7.1.1 Segment by Application – Global Fluorinated Photovoltaic Backsheet Market Size, 2025 & 2032
7.1.2 Standard PV Modules
7.1.3 High-Temperature Environments
7.1.4 Others
7.2 Segment by Application – Global Fluorinated Photovoltaic Backsheet Revenue & Forecasts
7.2.1 Segment by Application – Global Fluorinated Photovoltaic Backsheet Revenue, 2021-2026
7.2.2 Segment by Application – Global Fluorinated Photovoltaic Backsheet Revenue, 2027-2032
7.2.3 Segment by Application – Global Fluorinated Photovoltaic Backsheet Revenue Market Share, 2026-2034
7.3 Segment by Application – Global Fluorinated Photovoltaic Backsheet Sales & Forecasts
7.3.1 Segment by Application – Global Fluorinated Photovoltaic Backsheet Sales, 2021-2026
7.3.2 Segment by Application – Global Fluorinated Photovoltaic Backsheet Sales, 2027-2032
7.3.3 Segment by Application – Global Fluorinated Photovoltaic Backsheet Sales Market Share, 2026-2034
7.4 Segment by Application – Global Fluorinated Photovoltaic Backsheet Price (Manufacturers Selling Prices), 2026-2034
8 Sights Region
8.1 By Region – Global Fluorinated Photovoltaic Backsheet Market Size, 2025 & 2032
8.2 By Region – Global Fluorinated Photovoltaic Backsheet Revenue & Forecasts
8.2.1 By Region – Global Fluorinated Photovoltaic Backsheet Revenue, 2021-2026
8.2.2 By Region – Global Fluorinated Photovoltaic Backsheet Revenue, 2027-2032
8.2.3 By Region – Global Fluorinated Photovoltaic Backsheet Revenue Market Share, 2026-2034
8.3 By Region – Global Fluorinated Photovoltaic Backsheet Sales & Forecasts
8.3.1 By Region – Global Fluorinated Photovoltaic Backsheet Sales, 2021-2026
8.3.2 By Region – Global Fluorinated Photovoltaic Backsheet Sales, 2027-2032
8.3.3 By Region – Global Fluorinated Photovoltaic Backsheet Sales Market Share, 2026-2034
8.4 North America
8.4.1 By Country – North America Fluorinated Photovoltaic Backsheet Revenue, 2026-2034
8.4.2 By Country – North America Fluorinated Photovoltaic Backsheet Sales, 2026-2034
8.4.3 United States Fluorinated Photovoltaic Backsheet Market Size, 2026-2034
8.4.4 Canada Fluorinated Photovoltaic Backsheet Market Size, 2026-2034
8.4.5 Mexico Fluorinated Photovoltaic Backsheet Market Size, 2026-2034
8.5 Europe
8.5.1 By Country – Europe Fluorinated Photovoltaic Backsheet Revenue, 2026-2034
8.5.2 By Country – Europe Fluorinated Photovoltaic Backsheet Sales, 2026-2034
8.5.3 Germany Fluorinated Photovoltaic Backsheet Market Size, 2026-2034
8.5.4 France Fluorinated Photovoltaic Backsheet Market Size, 2026-2034
8.5.5 U.K. Fluorinated Photovoltaic Backsheet Market Size, 2026-2034
8.5.6 Italy Fluorinated Photovoltaic Backsheet Market Size, 2026-2034
8.5.7 Russia Fluorinated Photovoltaic Backsheet Market Size, 2026-2034
8.5.8 Nordic Countries Fluorinated Photovoltaic Backsheet Market Size, 2026-2034
8.5.9 Benelux Fluorinated Photovoltaic Backsheet Market Size, 2026-2034
8.6 Asia
8.6.1 By Region – Asia Fluorinated Photovoltaic Backsheet Revenue, 2026-2034
8.6.2 By Region – Asia Fluorinated Photovoltaic Backsheet Sales, 2026-2034
8.6.3 China Fluorinated Photovoltaic Backsheet Market Size, 2026-2034
8.6.4 Japan Fluorinated Photovoltaic Backsheet Market Size, 2026-2034
8.6.5 South Korea Fluorinated Photovoltaic Backsheet Market Size, 2026-2034
8.6.6 Southeast Asia Fluorinated Photovoltaic Backsheet Market Size, 2026-2034
8.6.7 India Fluorinated Photovoltaic Backsheet Market Size, 2026-2034
8.7 South America
8.7.1 By Country – South America Fluorinated Photovoltaic Backsheet Revenue, 2026-2034
8.7.2 By Country – South America Fluorinated Photovoltaic Backsheet Sales, 2026-2034
8.7.3 Brazil Fluorinated Photovoltaic Backsheet Market Size, 2026-2034
8.7.4 Argentina Fluorinated Photovoltaic Backsheet Market Size, 2026-2034
8.8 Middle East & Africa
8.8.1 By Country – Middle East & Africa Fluorinated Photovoltaic Backsheet Revenue, 2026-2034
8.8.2 By Country – Middle East & Africa Fluorinated Photovoltaic Backsheet Sales, 2026-2034
8.8.3 Turkey Fluorinated Photovoltaic Backsheet Market Size, 2026-2034
8.8.4 Israel Fluorinated Photovoltaic Backsheet Market Size, 2026-2034
8.8.5 Saudi Arabia Fluorinated Photovoltaic Backsheet Market Size, 2026-2034
8.8.6 UAE Fluorinated Photovoltaic Backsheet Market Size, 2026-2034
9 Manufacturers & Brands Profiles
9.1 Cybrid Technologies
9.1.1 Cybrid Technologies Company Summary
9.1.2 Cybrid Technologies Business Overview
9.1.3 Cybrid Technologies Fluorinated Photovoltaic Backsheet Major Product Offerings
9.1.4 Cybrid Technologies Fluorinated Photovoltaic Backsheet Sales and Revenue in Global (2021-2026)
9.1.5 Cybrid Technologies Key News & Latest Developments
9.2 Jolywood
9.2.1 Jolywood Company Summary
9.2.2 Jolywood Business Overview
9.2.3 Jolywood Fluorinated Photovoltaic Backsheet Major Product Offerings
9.2.4 Jolywood Fluorinated Photovoltaic Backsheet Sales and Revenue in Global (2021-2026)
9.2.5 Jolywood Key News & Latest Developments
9.3 Coveme
9.3.1 Coveme Company Summary
9.3.2 Coveme Business Overview
9.3.3 Coveme Fluorinated Photovoltaic Backsheet Major Product Offerings
9.3.4 Coveme Fluorinated Photovoltaic Backsheet Sales and Revenue in Global (2021-2026)
9.3.5 Coveme Key News & Latest Developments
9.4 Luckyfilm
9.4.1 Luckyfilm Company Summary
9.4.2 Luckyfilm Business Overview
9.4.3 Luckyfilm Fluorinated Photovoltaic Backsheet Major Product Offerings
9.4.4 Luckyfilm Fluorinated Photovoltaic Backsheet Sales and Revenue in Global (2021-2026)
9.4.5 Luckyfilm Key News & Latest Developments
9.5 Taiflex
9.5.1 Taiflex Company Summary
9.5.2 Taiflex Business Overview
9.5.3 Taiflex Fluorinated Photovoltaic Backsheet Major Product Offerings
9.5.4 Taiflex Fluorinated Photovoltaic Backsheet Sales and Revenue in Global (2021-2026)
9.5.5 Taiflex Key News & Latest Developments
9.6 Toppan
9.6.1 Toppan Company Summary
9.6.2 Toppan Business Overview
9.6.3 Toppan Fluorinated Photovoltaic Backsheet Major Product Offerings
9.6.4 Toppan Fluorinated Photovoltaic Backsheet Sales and Revenue in Global (2021-2026)
9.6.5 Toppan Key News & Latest Developments
9.7 Zhongtian Technologies Group
9.7.1 Zhongtian Technologies Group Company Summary
9.7.2 Zhongtian Technologies Group Business Overview
9.7.3 Zhongtian Technologies Group Fluorinated Photovoltaic Backsheet Major Product Offerings
9.7.4 Zhongtian Technologies Group Fluorinated Photovoltaic Backsheet Sales and Revenue in Global (2021-2026)
9.7.5 Zhongtian Technologies Group Key News & Latest Developments
9.8 Crown Advanced Material
9.8.1 Crown Advanced Material Company Summary
9.8.2 Crown Advanced Material Business Overview
9.8.3 Crown Advanced Material Fluorinated Photovoltaic Backsheet Major Product Offerings
9.8.4 Crown Advanced Material Fluorinated Photovoltaic Backsheet Sales and Revenue in Global (2021-2026)
9.8.5 Crown Advanced Material Key News & Latest Developments
9.9 Fujifilm
9.9.1 Fujifilm Company Summary
9.9.2 Fujifilm Business Overview
9.9.3 Fujifilm Fluorinated Photovoltaic Backsheet Major Product Offerings
9.9.4 Fujifilm Fluorinated Photovoltaic Backsheet Sales and Revenue in Global (2021-2026)
9.9.5 Fujifilm Key News & Latest Developments
9.10 Hangzhou First PV Materia
9.10.1 Hangzhou First PV Materia Company Summary
9.10.2 Hangzhou First PV Materia Business Overview
9.10.3 Hangzhou First PV Materia Fluorinated Photovoltaic Backsheet Major Product Offerings
9.10.4 Hangzhou First PV Materia Fluorinated Photovoltaic Backsheet Sales and Revenue in Global (2021-2026)
9.10.5 Hangzhou First PV Materia Key News & Latest Developments
9.11 Krempel GmbH
9.11.1 Krempel GmbH Company Summary
9.11.2 Krempel GmbH Business Overview
9.11.3 Krempel GmbH Fluorinated Photovoltaic Backsheet Major Product Offerings
9.11.4 Krempel GmbH Fluorinated Photovoltaic Backsheet Sales and Revenue in Global (2021-2026)
9.11.5 Krempel GmbH Key News & Latest Developments
9.12 Toyal
9.12.1 Toyal Company Summary
9.12.2 Toyal Business Overview
9.12.3 Toyal Fluorinated Photovoltaic Backsheet Major Product Offerings
9.12.4 Toyal Fluorinated Photovoltaic Backsheet Sales and Revenue in Global (2021-2026)
9.12.5 Toyal Key News & Latest Developments
9.13 Ventura
9.13.1 Ventura Company Summary
9.13.2 Ventura Business Overview
9.13.3 Ventura Fluorinated Photovoltaic Backsheet Major Product Offerings
9.13.4 Ventura Fluorinated Photovoltaic Backsheet Sales and Revenue in Global (2021-2026)
9.13.5 Ventura Key News & Latest Developments
9.14 HuiTian
9.14.1 HuiTian Company Summary
9.14.2 HuiTian Business Overview
9.14.3 HuiTian Fluorinated Photovoltaic Backsheet Major Product Offerings
9.14.4 HuiTian Fluorinated Photovoltaic Backsheet Sales and Revenue in Global (2021-2026)
9.14.5 HuiTian Key News & Latest Developments
9.15 Vishakha Renewables
9.15.1 Vishakha Renewables Company Summary
9.15.2 Vishakha Renewables Business Overview
9.15.3 Vishakha Renewables Fluorinated Photovoltaic Backsheet Major Product Offerings
9.15.4 Vishakha Renewables Fluorinated Photovoltaic Backsheet Sales and Revenue in Global (2021-2026)
9.15.5 Vishakha Renewables Key News & Latest Developments
10 Global Fluorinated Photovoltaic Backsheet Production Capacity, Analysis
10.1 Global Fluorinated Photovoltaic Backsheet Production Capacity, 2026-2034
10.2 Fluorinated Photovoltaic Backsheet Production Capacity of Key Manufacturers in Global Market
10.3 Global Fluorinated Photovoltaic Backsheet Production by Region
11 Key Market Trends, Opportunity, Drivers and Restraints
11.1 Market Opportunities & Trends
11.2 Market Drivers
11.3 Market Restraints
12 Fluorinated Photovoltaic Backsheet Supply Chain Analysis
12.1 Fluorinated Photovoltaic Backsheet Industry Value Chain
12.2 Fluorinated Photovoltaic Backsheet Upstream Market
12.3 Fluorinated Photovoltaic Backsheet Downstream and Clients
12.4 Marketing Channels Analysis
12.4.1 Marketing Channels
12.4.2 Fluorinated Photovoltaic Backsheet Distributors and Sales Agents in Global
13 Conclusion
14 Appendix
14.1 Note
14.2 Examples of Clients
14.3 DisclaimerList of Tables
Table 1. Key Players of Fluorinated Photovoltaic Backsheet in Global Market
Table 2. Top Fluorinated Photovoltaic Backsheet Players in Global Market, Ranking by Revenue (2025)
Table 3. Global Fluorinated Photovoltaic Backsheet Revenue by Companies, (US$, Mn), 2021-2026
Table 4. Global Fluorinated Photovoltaic Backsheet Revenue Share by Companies, 2021-2026
Table 5. Global Fluorinated Photovoltaic Backsheet Sales by Companies, (K Sqm), 2021-2026
Table 6. Global Fluorinated Photovoltaic Backsheet Sales Share by Companies, 2021-2026
Table 7. Key Manufacturers Fluorinated Photovoltaic Backsheet Price (2021-2026) & (US$/Sq m)
Table 8. Global Manufacturers Fluorinated Photovoltaic Backsheet Product Type
Table 9. List of Global Tier 1 Fluorinated Photovoltaic Backsheet Companies, Revenue (US$, Mn) in 2025 and Market Share
Table 10. List of Global Tier 2 and Tier 3 Fluorinated Photovoltaic Backsheet Companies, Revenue (US$, Mn) in 2025 and Market Share
Table 11. Segment by Type – Global Fluorinated Photovoltaic Backsheet Revenue, (US$, Mn), 2025 & 2032
Table 12. Segment by Type – Global Fluorinated Photovoltaic Backsheet Revenue (US$, Mn), 2021-2026
Table 13. Segment by Type – Global Fluorinated Photovoltaic Backsheet Revenue (US$, Mn), 2027-2032
Table 14. Segment by Type – Global Fluorinated Photovoltaic Backsheet Sales (K Sqm), 2021-2026
Table 15. Segment by Type – Global Fluorinated Photovoltaic Backsheet Sales (K Sqm), 2027-2032
Table 16. Segment by Mounted – Global Fluorinated Photovoltaic Backsheet Revenue, (US$, Mn), 2025 & 2032
Table 17. Segment by Mounted – Global Fluorinated Photovoltaic Backsheet Revenue (US$, Mn), 2021-2026
Table 18. Segment by Mounted – Global Fluorinated Photovoltaic Backsheet Revenue (US$, Mn), 2027-2032
Table 19. Segment by Mounted – Global Fluorinated Photovoltaic Backsheet Sales (K Sqm), 2021-2026
Table 20. Segment by Mounted – Global Fluorinated Photovoltaic Backsheet Sales (K Sqm), 2027-2032
Table 21. Segment by Thickness – Global Fluorinated Photovoltaic Backsheet Revenue, (US$, Mn), 2025 & 2032
Table 22. Segment by Thickness – Global Fluorinated Photovoltaic Backsheet Revenue (US$, Mn), 2021-2026
Table 23. Segment by Thickness – Global Fluorinated Photovoltaic Backsheet Revenue (US$, Mn), 2027-2032
Table 24. Segment by Thickness – Global Fluorinated Photovoltaic Backsheet Sales (K Sqm), 2021-2026
Table 25. Segment by Thickness – Global Fluorinated Photovoltaic Backsheet Sales (K Sqm), 2027-2032
Table 26. Segment by Application – Global Fluorinated Photovoltaic Backsheet Revenue, (US$, Mn), 2025 & 2032
Table 27. Segment by Application – Global Fluorinated Photovoltaic Backsheet Revenue, (US$, Mn), 2021-2026
Table 28. Segment by Application – Global Fluorinated Photovoltaic Backsheet Revenue, (US$, Mn), 2027-2032
Table 29. Segment by Application – Global Fluorinated Photovoltaic Backsheet Sales, (K Sqm), 2021-2026
Table 30. Segment by Application – Global Fluorinated Photovoltaic Backsheet Sales, (K Sqm), 2027-2032
Table 31. By Region – Global Fluorinated Photovoltaic Backsheet Revenue, (US$, Mn), 2025 & 2032
Table 32. By Region – Global Fluorinated Photovoltaic Backsheet Revenue, (US$, Mn), 2021-2026
Table 33. By Region – Global Fluorinated Photovoltaic Backsheet Revenue, (US$, Mn), 2027-2032
Table 34. By Region – Global Fluorinated Photovoltaic Backsheet Sales, (K Sqm), 2021-2026
Table 35. By Region – Global Fluorinated Photovoltaic Backsheet Sales, (K Sqm), 2027-2032
Table 36. By Country – North America Fluorinated Photovoltaic Backsheet Revenue, (US$, Mn), 2021-2026
Table 37. By Country – North America Fluorinated Photovoltaic Backsheet Revenue, (US$, Mn), 2027-2032
Table 38. By Country – North America Fluorinated Photovoltaic Backsheet Sales, (K Sqm), 2021-2026
Table 39. By Country – North America Fluorinated Photovoltaic Backsheet Sales, (K Sqm), 2027-2032
Table 40. By Country – Europe Fluorinated Photovoltaic Backsheet Revenue, (US$, Mn), 2021-2026
Table 41. By Country – Europe Fluorinated Photovoltaic Backsheet Revenue, (US$, Mn), 2027-2032
Table 42. By Country – Europe Fluorinated Photovoltaic Backsheet Sales, (K Sqm), 2021-2026
Table 43. By Country – Europe Fluorinated Photovoltaic Backsheet Sales, (K Sqm), 2027-2032
Table 44. By Region – Asia Fluorinated Photovoltaic Backsheet Revenue, (US$, Mn), 2021-2026
Table 45. By Region – Asia Fluorinated Photovoltaic Backsheet Revenue, (US$, Mn), 2027-2032
Table 46. By Region – Asia Fluorinated Photovoltaic Backsheet Sales, (K Sqm), 2021-2026
Table 47. By Region – Asia Fluorinated Photovoltaic Backsheet Sales, (K Sqm), 2027-2032
Table 48. By Country – South America Fluorinated Photovoltaic Backsheet Revenue, (US$, Mn), 2021-2026
Table 49. By Country – South America Fluorinated Photovoltaic Backsheet Revenue, (US$, Mn), 2027-2032
Table 50. By Country – South America Fluorinated Photovoltaic Backsheet Sales, (K Sqm), 2021-2026
Table 51. By Country – South America Fluorinated Photovoltaic Backsheet Sales, (K Sqm), 2027-2032
Table 52. By Country – Middle East & Africa Fluorinated Photovoltaic Backsheet Revenue, (US$, Mn), 2021-2026
Table 53. By Country – Middle East & Africa Fluorinated Photovoltaic Backsheet Revenue, (US$, Mn), 2027-2032
Table 54. By Country – Middle East & Africa Fluorinated Photovoltaic Backsheet Sales, (K Sqm), 2021-2026
Table 55. By Country – Middle East & Africa Fluorinated Photovoltaic Backsheet Sales, (K Sqm), 2027-2032
Table 56. Cybrid Technologies Company Summary
Table 57. Cybrid Technologies Fluorinated Photovoltaic Backsheet Product Offerings
Table 58. Cybrid Technologies Fluorinated Photovoltaic Backsheet Sales (K Sqm), Revenue (US$, Mn) and Average Price (US$/Sq m) & (2021-2026)
Table 59. Cybrid Technologies Key News & Latest Developments
Table 60. Jolywood Company Summary
Table 61. Jolywood Fluorinated Photovoltaic Backsheet Product Offerings
Table 62. Jolywood Fluorinated Photovoltaic Backsheet Sales (K Sqm), Revenue (US$, Mn) and Average Price (US$/Sq m) & (2021-2026)
Table 63. Jolywood Key News & Latest Developments
Table 64. Coveme Company Summary
Table 65. Coveme Fluorinated Photovoltaic Backsheet Product Offerings
Table 66. Coveme Fluorinated Photovoltaic Backsheet Sales (K Sqm), Revenue (US$, Mn) and Average Price (US$/Sq m) & (2021-2026)
Table 67. Coveme Key News & Latest Developments
Table 68. Luckyfilm Company Summary
Table 69. Luckyfilm Fluorinated Photovoltaic Backsheet Product Offerings
Table 70. Luckyfilm Fluorinated Photovoltaic Backsheet Sales (K Sqm), Revenue (US$, Mn) and Average Price (US$/Sq m) & (2021-2026)
Table 71. Luckyfilm Key News & Latest Developments
Table 72. Taiflex Company Summary
Table 73. Taiflex Fluorinated Photovoltaic Backsheet Product Offerings
Table 74. Taiflex Fluorinated Photovoltaic Backsheet Sales (K Sqm), Revenue (US$, Mn) and Average Price (US$/Sq m) & (2021-2026)
Table 75. Taiflex Key News & Latest Developments
Table 76. Toppan Company Summary
Table 77. Toppan Fluorinated Photovoltaic Backsheet Product Offerings
Table 78. Toppan Fluorinated Photovoltaic Backsheet Sales (K Sqm), Revenue (US$, Mn) and Average Price (US$/Sq m) & (2021-2026)
Table 79. Toppan Key News & Latest Developments
Table 80. Zhongtian Technologies Group Company Summary
Table 81. Zhongtian Technologies Group Fluorinated Photovoltaic Backsheet Product Offerings
Table 82. Zhongtian Technologies Group Fluorinated Photovoltaic Backsheet Sales (K Sqm), Revenue (US$, Mn) and Average Price (US$/Sq m) & (2021-2026)
Table 83. Zhongtian Technologies Group Key News & Latest Developments
Table 84. Crown Advanced Material Company Summary
Table 85. Crown Advanced Material Fluorinated Photovoltaic Backsheet Product Offerings
Table 86. Crown Advanced Material Fluorinated Photovoltaic Backsheet Sales (K Sqm), Revenue (US$, Mn) and Average Price (US$/Sq m) & (2021-2026)
Table 87. Crown Advanced Material Key News & Latest Developments
Table 88. Fujifilm Company Summary
Table 89. Fujifilm Fluorinated Photovoltaic Backsheet Product Offerings
Table 90. Fujifilm Fluorinated Photovoltaic Backsheet Sales (K Sqm), Revenue (US$, Mn) and Average Price (US$/Sq m) & (2021-2026)
Table 91. Fujifilm Key News & Latest Developments
Table 92. Hangzhou First PV Materia Company Summary
Table 93. Hangzhou First PV Materia Fluorinated Photovoltaic Backsheet Product Offerings
Table 94. Hangzhou First PV Materia Fluorinated Photovoltaic Backsheet Sales (K Sqm), Revenue (US$, Mn) and Average Price (US$/Sq m) & (2021-2026)
Table 95. Hangzhou First PV Materia Key News & Latest Developments
Table 96. Krempel GmbH Company Summary
Table 97. Krempel GmbH Fluorinated Photovoltaic Backsheet Product Offerings
Table 98. Krempel GmbH Fluorinated Photovoltaic Backsheet Sales (K Sqm), Revenue (US$, Mn) and Average Price (US$/Sq m) & (2021-2026)
Table 99. Krempel GmbH Key News & Latest Developments
Table 100. Toyal Company Summary
Table 101. Toyal Fluorinated Photovoltaic Backsheet Product Offerings
Table 102. Toyal Fluorinated Photovoltaic Backsheet Sales (K Sqm), Revenue (US$, Mn) and Average Price (US$/Sq m) & (2021-2026)
Table 103. Toyal Key News & Latest Developments
Table 104. Ventura Company Summary
Table 105. Ventura Fluorinated Photovoltaic Backsheet Product Offerings
Table 106. Ventura Fluorinated Photovoltaic Backsheet Sales (K Sqm), Revenue (US$, Mn) and Average Price (US$/Sq m) & (2021-2026)
Table 107. Ventura Key News & Latest Developments
Table 108. HuiTian Company Summary
Table 109. HuiTian Fluorinated Photovoltaic Backsheet Product Offerings
Table 110. HuiTian Fluorinated Photovoltaic Backsheet Sales (K Sqm), Revenue (US$, Mn) and Average Price (US$/Sq m) & (2021-2026)
Table 111. HuiTian Key News & Latest Developments
Table 112. Vishakha Renewables Company Summary
Table 113. Vishakha Renewables Fluorinated Photovoltaic Backsheet Product Offerings
Table 114. Vishakha Renewables Fluorinated Photovoltaic Backsheet Sales (K Sqm), Revenue (US$, Mn) and Average Price (US$/Sq m) & (2021-2026)
Table 115. Vishakha Renewables Key News & Latest Developments
Table 116. Fluorinated Photovoltaic Backsheet Capacity of Key Manufacturers in Global Market, 2024-2026 (K Sqm)
Table 117. Global Fluorinated Photovoltaic Backsheet Capacity Market Share of Key Manufacturers, 2024-2026
Table 118. Global Fluorinated Photovoltaic Backsheet Production by Region, 2021-2026 (K Sqm)
Table 119. Global Fluorinated Photovoltaic Backsheet Production by Region, 2027-2032 (K Sqm)
Table 120. Fluorinated Photovoltaic Backsheet Market Opportunities & Trends in Global Market
Table 121. Fluorinated Photovoltaic Backsheet Market Drivers in Global Market
Table 122. Fluorinated Photovoltaic Backsheet Market Restraints in Global Market
Table 123. Fluorinated Photovoltaic Backsheet Raw Materials
Table 124. Fluorinated Photovoltaic Backsheet Raw Materials Suppliers in Global Market
Table 125. Typical Fluorinated Photovoltaic Backsheet Downstream
Table 126. Fluorinated Photovoltaic Backsheet Downstream Clients in Global Market
Table 127. Fluorinated Photovoltaic Backsheet Distributors and Sales Agents in Global Market

List of Figures
Figure 1. Fluorinated Photovoltaic Backsheet Product Picture
Figure 2. Fluorinated Photovoltaic Backsheet Segment by Type in 2025
Figure 3. Fluorinated Photovoltaic Backsheet Segment by Mounted in 2025
Figure 4. Fluorinated Photovoltaic Backsheet Segment by Thickness in 2025
Figure 5. Fluorinated Photovoltaic Backsheet Segment by Application in 2025
Figure 6. Global Fluorinated Photovoltaic Backsheet Market Overview: 2025
Figure 7. Key Caveats
Figure 8. Global Fluorinated Photovoltaic Backsheet Market Size: 2025 VS 2032 (US$, Mn)
Figure 9. Global Fluorinated Photovoltaic Backsheet Revenue: 2026-2034 (US$, Mn)
Figure 10. Fluorinated Photovoltaic Backsheet Sales in Global Market: 2026-2034 (K Sqm)
Figure 11. The Top 3 and 5 Players Market Share by Fluorinated Photovoltaic Backsheet Revenue in 2025
Figure 12. Segment by Type – Global Fluorinated Photovoltaic Backsheet Revenue, (US$, Mn), 2025 & 2032
Figure 13. Segment by Type – Global Fluorinated Photovoltaic Backsheet Revenue Market Share, 2026-2034
Figure 14. Segment by Type – Global Fluorinated Photovoltaic Backsheet Sales Market Share, 2026-2034
Figure 15. Segment by Type – Global Fluorinated Photovoltaic Backsheet Price (US$/Sq m), 2026-2034
Figure 16. Segment by Mounted – Global Fluorinated Photovoltaic Backsheet Revenue, (US$, Mn), 2025 & 2032
Figure 17. Segment by Mounted – Global Fluorinated Photovoltaic Backsheet Revenue Market Share, 2026-2034
Figure 18. Segment by Mounted – Global Fluorinated Photovoltaic Backsheet Sales Market Share, 2026-2034
Figure 19. Segment by Mounted – Global Fluorinated Photovoltaic Backsheet Price (US$/Sq m), 2026-2034
Figure 20. Segment by Thickness – Global Fluorinated Photovoltaic Backsheet Revenue, (US$, Mn), 2025 & 2032
Figure 21. Segment by Thickness – Global Fluorinated Photovoltaic Backsheet Revenue Market Share, 2026-2034
Figure 22. Segment by Thickness – Global Fluorinated Photovoltaic Backsheet Sales Market Share, 2026-2034
Figure 23. Segment by Thickness – Global Fluorinated Photovoltaic Backsheet Price (US$/Sq m), 2026-2034
Figure 24. Segment by Application – Global Fluorinated Photovoltaic Backsheet Revenue, (US$, Mn), 2025 & 2032
Figure 25. Segment by Application – Global Fluorinated Photovoltaic Backsheet Revenue Market Share, 2026-2034
Figure 26. Segment by Application – Global Fluorinated Photovoltaic Backsheet Sales Market Share, 2026-2034
Figure 27. Segment by Application -Global Fluorinated Photovoltaic Backsheet Price (US$/Sq m), 2026-2034
Figure 28. By Region – Global Fluorinated Photovoltaic Backsheet Revenue, (US$, Mn), 2025 & 2032
Figure 29. By Region – Global Fluorinated Photovoltaic Backsheet Revenue Market Share, 2021 VS 2025 VS 2032
Figure 30. By Region – Global Fluorinated Photovoltaic Backsheet Revenue Market Share, 2026-2034
Figure 31. By Region – Global Fluorinated Photovoltaic Backsheet Sales Market Share, 2026-2034
Figure 32. By Country – North America Fluorinated Photovoltaic Backsheet Revenue Market Share, 2026-2034
Figure 33. By Country – North America Fluorinated Photovoltaic Backsheet Sales Market Share, 2026-2034
Figure 34. United States Fluorinated Photovoltaic Backsheet Revenue, (US$, Mn), 2026-2034
Figure 35. Canada Fluorinated Photovoltaic Backsheet Revenue, (US$, Mn), 2026-2034
Figure 36. Mexico Fluorinated Photovoltaic Backsheet Revenue, (US$, Mn), 2026-2034
Figure 37. By Country – Europe Fluorinated Photovoltaic Backsheet Revenue Market Share, 2026-2034
Figure 38. By Country – Europe Fluorinated Photovoltaic Backsheet Sales Market Share, 2026-2034
Figure 39. Germany Fluorinated Photovoltaic Backsheet Revenue, (US$, Mn), 2026-2034
Figure 40. France Fluorinated Photovoltaic Backsheet Revenue, (US$, Mn), 2026-2034
Figure 41. U.K. Fluorinated Photovoltaic Backsheet Revenue, (US$, Mn), 2026-2034
Figure 42. Italy Fluorinated Photovoltaic Backsheet Revenue, (US$, Mn), 2026-2034
Figure 43. Russia Fluorinated Photovoltaic Backsheet Revenue, (US$, Mn), 2026-2034
Figure 44. Nordic Countries Fluorinated Photovoltaic Backsheet Revenue, (US$, Mn), 2026-2034
Figure 45. Benelux Fluorinated Photovoltaic Backsheet Revenue, (US$, Mn), 2026-2034
Figure 46. By Region – Asia Fluorinated Photovoltaic Backsheet Revenue Market Share, 2026-2034
Figure 47. By Region – Asia Fluorinated Photovoltaic Backsheet Sales Market Share, 2026-2034
Figure 48. China Fluorinated Photovoltaic Backsheet Revenue, (US$, Mn), 2026-2034
Figure 49. Japan Fluorinated Photovoltaic Backsheet Revenue, (US$, Mn), 2026-2034
Figure 50. South Korea Fluorinated Photovoltaic Backsheet Revenue, (US$, Mn), 2026-2034
Figure 51. Southeast Asia Fluorinated Photovoltaic Backsheet Revenue, (US$, Mn), 2026-2034
Figure 52. India Fluorinated Photovoltaic Backsheet Revenue, (US$, Mn), 2026-2034
Figure 53. By Country – South America Fluorinated Photovoltaic Backsheet Revenue Market Share, 2026-2034
Figure 54. By Country – South America Fluorinated Photovoltaic Backsheet Sales, Market Share, 2026-2034
Figure 55. Brazil Fluorinated Photovoltaic Backsheet Revenue, (US$, Mn), 2026-2034
Figure 56. Argentina Fluorinated Photovoltaic Backsheet Revenue, (US$, Mn), 2026-2034
Figure 57. By Country – Middle East & Africa Fluorinated Photovoltaic Backsheet Revenue, Market Share, 2026-2034
Figure 58. By Country – Middle East & Africa Fluorinated Photovoltaic Backsheet Sales, Market Share, 2026-2034
Figure 59. Turkey Fluorinated Photovoltaic Backsheet Revenue, (US$, Mn), 2026-2034
Figure 60. Israel Fluorinated Photovoltaic Backsheet Revenue, (US$, Mn), 2026-2034
Figure 61. Saudi Arabia Fluorinated Photovoltaic Backsheet Revenue, (US$, Mn), 2026-2034
Figure 62. UAE Fluorinated Photovoltaic Backsheet Revenue, (US$, Mn), 2026-2034
Figure 63. Global Fluorinated Photovoltaic Backsheet Production Capacity (K Sqm), 2026-2034
Figure 64. The Percentage of Production Fluorinated Photovoltaic Backsheet by Region, 2025 VS 2032
Figure 65. Fluorinated Photovoltaic Backsheet Industry Value Chain
Figure 66. Marketing Channels