SEMICONDUCTOR INSIGHT
MARKET RESEARCH REPORT

Global Organic Photovoltaic Solar Cells Market

2026 to 2034
MARKET INTELLIGENCE
ACROSS KEY REGIONS
2026 EDITION
SOLAR CELLS Semiconductor Market Research

Global Organic Photovoltaic Solar Cells Market

Trends, Business Strategies 2026–2034

◷
UPDATED 29 October 2026
▤
REPORT LENGTH Detailed Report
▣
REPORT CODE 23d5e536a470
▯
FORMATS PDF

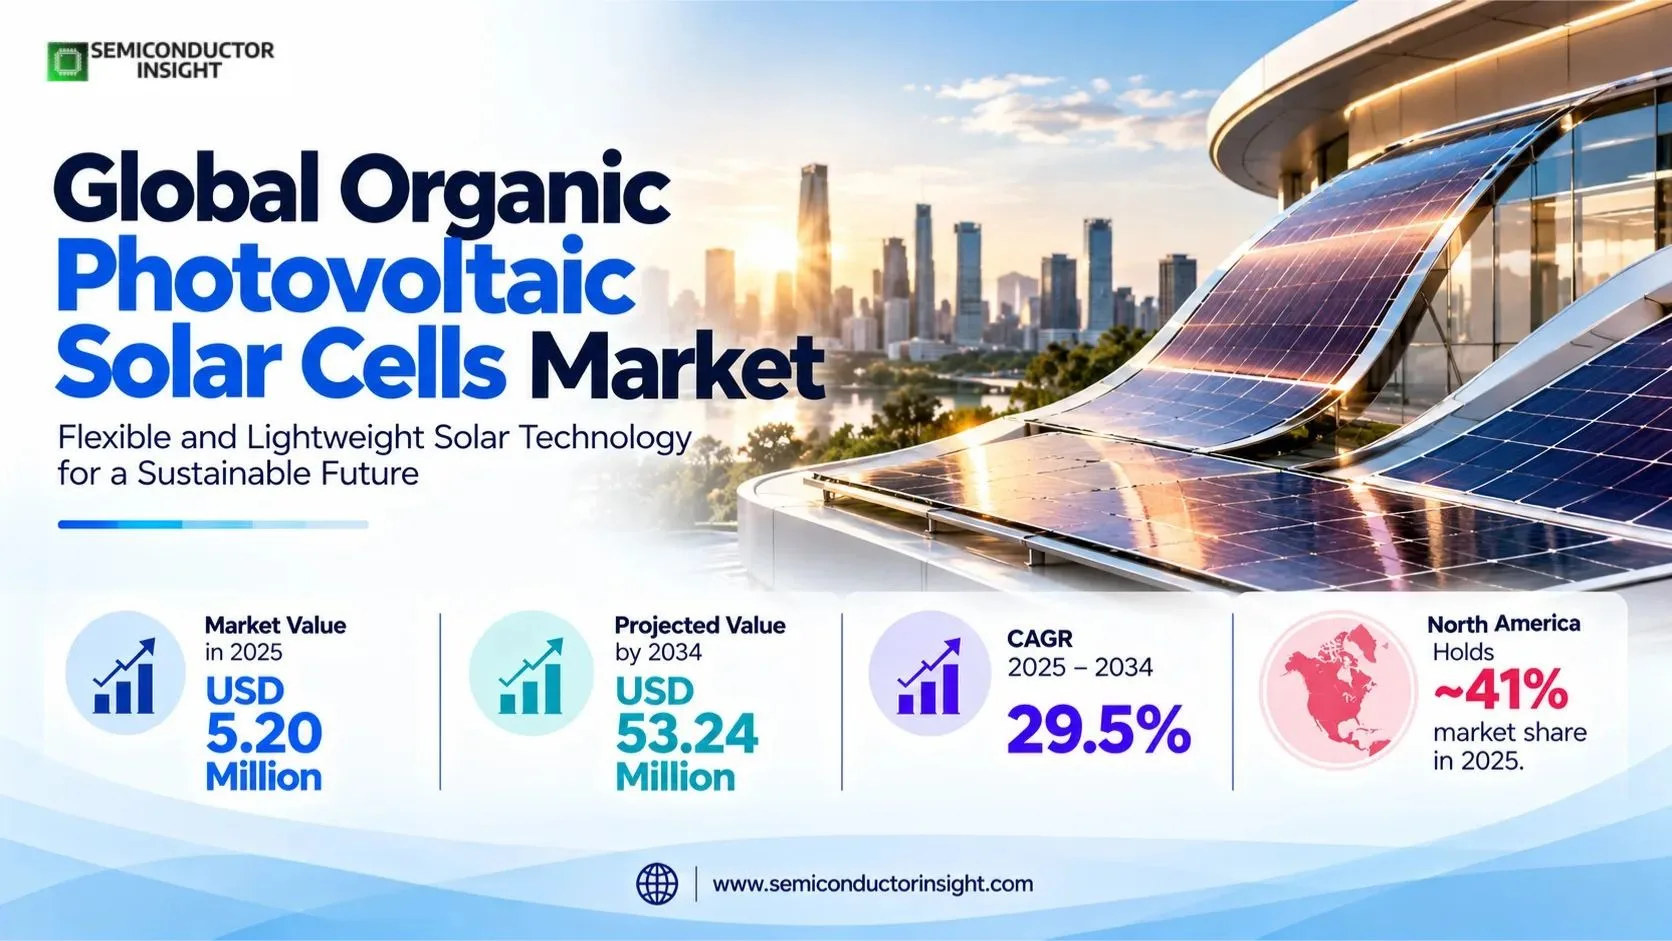
Organic photovoltaic solar cells market was valued at USD 5.20 million in 2025 and is projected to reach USD 53.24 million by 2034, representing a CAGR of 29.5% over 2025–2034. North America held an estimated ~41% share in 2025, while flexible modules led product revenue at ~78%.

Get the sample PDF with study scope, segmentation and methodology details.

Key Statistics

2025 Market Size
USD 5.20 million
2034 Projected Size
USD 53.24 million
CAGR (2025–2034)
29.5%
Largest Market in 2025
North America (~41%)

Key Takeaways

  • Market scale: Sales of organic photovoltaic cells and integrated cell modules reached USD 5.20 million in 2025, with USD 6.73 million estimated for 2026 and USD 53.24 million forecast for 2034; the 2025–2034 growth path is close to thirty percent annually as the industry moves beyond individually engineered pilots.
  • Module format: Flexible OPV Module represents the largest product category at an estimated ~78% of 2025 sales; roll-to-roll substrates suit curved surfaces, battery-free sensor housings and thin architectural laminates, whereas Rigid OPV Module is reserved for mechanically supported components and specialist glass integration.
  • End use: BIPV leads the application split with a modeled ~38% share, followed by IoT at ~29%, Consumer & Portable Power at ~22%, and Transportation & Mobility at ~11%; indoor harvesting is the fastest-expanding use, with a modeled ~32.0% growth rate.
  • Regional footprint: North America holds an estimated ~41% of 2025 revenue based on the publisher’s historical U.S.-weighted monetary distribution, ahead of Europe at ~31% and Asia-Pacific at ~21%; Asian supply-chain participation is growing faster than its current sales base.
  • Commercial inflection: Recent product announcements by Dracula Technologies, Epishine, NEXT Energy Technologies and Heliatek show distinct sales channels for ambient-light electronics and building films, but performance qualification, encapsulation and project conversion remain more decisive than headline laboratory efficiency.

Organic Photovoltaic Solar Cells Market Overview

Organic photovoltaic solar cells market was valued at USD 5.20 million in 2025 and is projected to reach USD 53.24 million by 2034, representing a CAGR of 29.5% over 2025–2034. North America held an estimated ~41% share in 2025, while flexible modules led product revenue at ~78%.

Base year: 2025 · Estimated year: 2026 · Forecast period: 2025–2034 · Historical reference: 2023 · Values in USD million

Organic photovoltaic cells convert incident light into electricity through thin layers of carbon-based donor and acceptor materials. Their commercial appeal is not based on competing directly with crystalline silicon at utility scale: printed OPV can be lightweight, mechanically conformable, visually discreet and effective under artificial illumination. A remote control operating near 500 lux and a commercial window exposed to daylight impose different electrical and lifetime requirements, so a single laboratory efficiency figure does not describe either market adequately.

The revenue perimeter includes merchant organic photovoltaic cells and finished cell modules, whether the active layer is mounted on a flexible polymer film or a rigid support. BIPV orders are counted at the OPV cell or coated-module level, not at the installed price of the entire window wall; the same exclusion applies to completed remote controls, sensors, batteries, automobiles and façades. This avoids assigning downstream construction or electronics value to the photovoltaic component itself.

In 2025 the product mix is weighted toward flexible designs, which account for ~78% of modeled revenue because printed cell stacks can follow curved surfaces and be cut to device-specific shapes. Rigid modules retain ~22%, especially where the OPV layer is bonded to glass or another stable substrate. A distinction between the two formats is commercially useful even when an integrated glazing assembly contains both a flexible coating process and a rigid final carrier.

Indoor applications change the way buyers evaluate performance. A battery-free asset sensor may harvest tens or hundreds of microwatts during illuminated periods and rely on a low-leakage storage element after dark; a building laminate instead needs a weather-resistant barrier and electrical connections that tolerate temperature cycling for years. Both depend on printed photoactive layers, yet their test protocols, unit economics and customer approval cycles differ substantially.

The market remains early in commercial deployment, so the small 2025 revenue base is sensitive to project timing and customer qualification. The 2026 estimate of USD 6.73 million implies a relatively small absolute addition despite the high growth percentage. Scaling toward 2034 requires recurring orders for standardized components rather than repeated bespoke demonstration contracts, particularly in smart-building electronics, portable controls and specialty glazing.

The 2025 regional scenario assigns 41% to North America, 31% to Europe, 21% to Asia-Pacific, 4% to South America and 3% to the Middle East and Africa. Across 2025–2034 the corresponding modeled growth rates are 29.2%, 29.2%, 30.8%, 26.5% and 30.7%. These 10 percentages summarize allocation assumptions rather than independently measured country totals; they help explain how a small 2025 revenue pool might develop as applications mature through 2028, 2031 and 2034.

Regional leadership reflects the location of commercial installations and cell procurement rather than merely the headquarters of materials researchers. North America is modeled at ~41% of 2025 value because the publisher supplies a monetary historical regional anchor; Europe at ~31% benefits from French, German and Swedish OPV activity, while Asia-Pacific at ~21% is building capacity in Chinese indoor modules. Smaller South American and Middle Eastern markets remain dependent on imported devices and integrator-led projects.

Segment Analysis: By Type

The product segmentation distinguishes Flexible OPV Module and Rigid OPV Module. Flexible products contribute an estimated ~78% of 2025 revenue and are modeled to grow at ~30.0% annually; rigid products account for ~22% and expand at ~27.6%, with material selection governed by bending radius, encapsulation, electrical contact design and integration into the buyer’s assembly.

Type Construction and use Market position
Flexible OPV Module Printed organic layers on polymer carriers make it possible to create thin energy-harvesting strips, custom shapes and broad lightweight films. Inkjet and roll-to-roll coating support short development iterations and avoid the mass of glass-backed crystalline products. The trade-off is greater dependence on moisture barriers, lamination quality and mechanical fatigue testing before a device manufacturer accepts production volumes. Largest format, ~78% share in 2025; ~30.0% modeled CAGR. This format fits indoor IoT, low-profile controls, portable accessories and surface-conforming BIPV. Manufacturers compete on useful output at the customer’s actual light spectrum, module area and production yield rather than on a peak power rating alone. Growing customer-specific design wins should improve recurring shipment economics.
Rigid OPV Module Glass or mechanically stable substrates can support the organic junction when a flat, dimensionally controlled assembly is required. These modules suit glazing demonstrations, integrated electronics panels and products that prioritize stable contacts over bending. Although they sacrifice some of the flexibility associated with printed solar cells, they can simplify packaging and installation in fixed architectural or industrial assemblies. Estimated ~22% of 2025 sales; ~27.6% modeled CAGR. The rigid category is smaller because conventional photovoltaic technologies already serve many fixed-surface applications. Its opportunity lies in transparent, colored or low-light-compatible solutions where standard silicon would compromise appearance or device geometry, with qualification emphasizing glass interfaces and long-term electrical stability.

Flexible OPV Module

Flexible-cell demand is being shaped by design engineers rather than bulk electricity buyers. Printed patterns can fit behind a remote-control window or on the housing of a wireless monitor, reducing the need for replaceable batteries. For an original equipment manufacturer, a smaller cell that still powers the duty cycle may be more valuable than a larger module with a higher peak rating, because it frees space for electronics and industrial design.

Manufacturing economics improve when ink utilization, drying uniformity and electrode registration are controlled across successive rolls. An order of 10,000 custom sensor patches may involve a different cost curve from 100 square meters of architectural film, even though both use organic absorbers. Buyers therefore assess lot-to-lot uniformity and the supplier’s ability to preserve performance after cutting, encapsulating and bonding the flexible material.

Rigid OPV Module

A rigid carrier is useful where the photovoltaic element must align with a fixed optical aperture or be sealed inside a window unit. NEXT Energy Technologies’ large-format transparent coating demonstrations show why the support structure matters: glass fabricators require predictable dimensions, cable routing and compatibility with insulating-glass assembly. The cell contribution should be separated from the glazing system to preserve a consistent semiconductor-product revenue boundary.

Rigid modules face competition from conventional small solar panels in outdoor products, yet they may offer aesthetic benefits in indoor fixtures or façades. The buyer weighs visual transparency, spectral response and stability alongside price per watt, and qualification can involve ultraviolet exposure, humidity and thermal cycling. These engineering requirements slow conversion from pilot to volume but can produce durable supplier relationships after certification.

Segment Analysis: By Application

Four applications are tracked: BIPV, Transportation & Mobility, IoT, and Consumer & Portable Power. BIPV leads with an estimated ~38% of 2025 value, while IoT represents ~29% and has the strongest modeled expansion at ~32.0% annually; Consumer & Portable Power holds ~22%, leaving Transportation & Mobility at ~11%. The split is designed to reflect cell procurement rather than the complete installed systems.

Application Demand characteristics
BIPV An estimated ~38% of 2025 revenue comes from photovoltaic cells intended for building-integrated applications. The attractive niches are light façades, decorative surfaces and transparent or semitransparent windows where appearance and structural load are constraints. Project economics are assessed against building-system requirements, so a cell supplier must demonstrate electrical output and installation compatibility without treating the entire glass or framing contract as cell revenue.
Transportation & Mobility The modeled ~11% share reflects experimental and limited-volume uses on vehicle interiors, lightweight surfaces and mobile accessories rather than mainstream traction energy. A thin OPV element can support auxiliary sensing or low-power electronics, but moving equipment faces vibration, heat and shading patterns that differ from static building use. Commercial acceptance depends on robust encapsulation and measurable savings in wiring or battery replacement.
IoT IoT accounts for a modeled ~29% of 2025 revenue and is the fastest-growing application at ~32.0% annually. Sensors deployed in buildings, warehouses and industrial assets can collect indoor light instead of depending entirely on primary batteries. Device makers judge cells by the energy accumulated during a realistic illumination schedule and by performance when lights are off, not by noon sunlight conversion efficiency.
Consumer & Portable Power Consumer and portable products contribute an estimated ~22% share, including remotes, tags, low-power accessories and demonstration electronics. Integration is especially attractive when replacing a battery would require opening a sealed enclosure or dispatching a service technician. Adoption hinges on user experience: the device must still operate after storage, intermittent illumination and variable room brightness, often with a compact storage component.

The relative ranking can change as standardized indoor components reach consumer-electronics supply chains. A single approved remote-control platform may ship more cell units than several architectural demonstration projects, although the average selling price per cell differs markedly. That is why the ~32.0% IoT growth assumption is distinct from the ~30.0% flexible-format trajectory and should not be interpreted as a guarantee of higher industrywide average selling prices.

The 2025 application allocation comprises 38% BIPV, 29% IoT, 22% consumer and portable devices, and 11% transportation uses. The modeled category growth assumptions include 30.0% for building integration, 32.0% for IoT, 27.0% for consumer products and 24.5% for mobility, with 2026–2028 qualification cycles preceding broader 2029–2031 rollouts. These are directional analytical estimates, not measured product shipment shares; the four applications have distinct component prices and procurement lead times.

Building projects are lumpy because architectural procurement, glazing certification and installation schedules extend beyond component manufacturing. In contrast, IoT and consumer programs typically move through electronics qualification and annual product refreshes. Suppliers serving both channels must manage long-life environmental testing for outdoor cells alongside repeatable low-light output measurements for indoor products, creating different working-capital and warranty exposures.
Regional Analysis

North America represents an estimated ~41% of 2025 organic photovoltaic solar cell revenue, Europe follows at ~31%, Asia-Pacific at ~21%, South America at ~4%, and the Middle East & Africa at ~3%. These allocations describe the cell and module market rather than installed photovoltaic capacity; each region has a different mix of architectural demonstrations, indoor harvesting electronics and supplier qualification.

How do regional commercialization routes differ for organic photovoltaic cells?

The regional map is unusually sensitive to where initial customer projects are recorded. North American glazing trials can generate large contract values from a small number of units, while European indoor-harvesting companies may sell numerous tiny cells through electronics channels. Asia-Pacific has significant manufacturing and material research activity, but factory location does not necessarily establish where the final cell revenue is recognized. The five-region model therefore keeps commercial demand distinct from manufacturing footprint.

The modeled growth rates range from ~26.5% in South America to ~30.8% in Asia-Pacific, compared with the ~29.5% global path. These are analytical scenarios based on regional application maturity and the available company evidence, not official national sales series. North America is the current leader, while a more rapid buildout of Asian indoor-device programs could narrow the gap during the 2025–2034 period.

Region Position Growth outlook Demand profile What decides supplier selection
North America Largest (~41%) Rapid (~29.2% CAGR) Transparent glazing and pilot cells Building-code compatibility and customer qualification
Europe Second (~31%) Rapid (~29.2% CAGR) Indoor electronics and printed films Low-light reliability and roll-to-roll consistency
Asia-Pacific Third (~21%) Fastest (~30.8% CAGR) Printed-cell manufacturing and IoT Yield, packaging scale and integration costs
South America Fourth (~4%) Developing (~26.5% CAGR) Imported specialist cell systems Distributor support and installed-project financing
Middle East & Africa Fifth (~3%) Emerging (~30.7% CAGR) Architectural demonstrations and sensors Thermal endurance and application-specific warranties

North America LARGEST · ~41% SHARE

Why does North America account for the largest OPV cell market share?

North America holds an estimated ~41% of 2025 cell and module sales, reflecting early commercialization of transparent organic photovoltaic glazing and specialist energy-harvesting products. California has been an important test environment because façade suppliers and technology developers can validate optical appearance alongside electrical output. The region is modeled to grow at ~29.2% CAGR as demonstration installations move toward repeatable architectural specifications.

Market positionLargest (~41%)
Growth outlookRapid (~29.2% CAGR)
Demand profileArchitectural pilot led
Market access gateGlazing approval and electrical testing
Country Position in region What drives demand
United States Largest The United States anchors regional demand through California-based NEXT Energy Technologies and a network of glass fabricators, façade contractors and electronics integrators. U.S. procurement involves coating qualification, glass-fabricator interfaces and verification that power-generating layers preserve acceptable daylight transmission. These requirements can support higher-value specialist cells, but they also lengthen customer approvals and mean a successful architectural demonstration should not be mistaken for a recurring national shipment program.
Canada Specialty opportunity Canadian demand is likely to concentrate in low-power monitoring and building-envelope trials where long winter periods and variable daylight require careful energy budgeting. A sensor may need to survive extended darkness, so cell output must be assessed together with a storage element and radio duty cycle. Commercial purchasers also demand humidity and freeze-thaw testing that is more stringent than indoor laboratory measurement, keeping the current market modest.
Mexico Integrator market Mexico participates through electronics assembly, commercial-building development and cross-border component sourcing rather than through a large identified merchant OPV manufacturing base. Buyers considering solar-powered tags or environmental monitors evaluate local service availability, import costs and the ability to replace a failed module without redesigning the device. A modeled share within North America does not imply a separately verified national market value for 2025.

Market instances

  • Transparent cell coating reached a full-size glazing installation. NEXT Energy Technologies disclosed its Santa Barbara installation on 23 July 2025, covering six photovoltaic windows and about 100 square feet of transparent energy-generating glass. The cells were incorporated into insulating glass units with separate framing and low-emissivity components. This milestone demonstrates system integration, while the commercial opportunity for OPV suppliers remains the coating and cell portion of future window orders.
  • Pilot-line dimensions became relevant to architectural procurement. In February 2025 NEXT reported production of 40-by-60-inch transparent photovoltaic windows after a pilot-line upgrade. The size matters because full vision-area glazing is a different qualification challenge from a small research coupon: uniformity, contact routing and optical consistency must hold across the panel. The market impact is a potential path from sample sales to projects that use standard façade dimensions.
In the full report: country-level sales, end-user programs, module type splits and application opportunities for the United States, Canada and Mexico, including separate assessment of pilot conversion and installed building components.

Europe SECOND · ~31% SHARE

Which European supply chains support organic photovoltaic cell commercialization?

Europe accounts for a modeled ~31% of 2025 revenue, supported by printed organic electronics clusters in France, Germany, Sweden and Greece. Indoor IoT products and flexible architectural films create different routes to market, but both benefit from local research partnerships and specialty manufacturing expertise. The ~29.2% modeled CAGR reflects expanding design wins tempered by qualification and encapsulation costs.

Market positionSecond (~31%)
Growth outlookRapid (~29.2% CAGR)
Demand profileIndoor harvesting led
Market access gateOEM validation and material stability
Country Position in region What drives demand
France Indoor device hub Dracula Technologies operates from Valence and targets low-power connected equipment with its LAYER organic photovoltaic platform. Its January 2026 announcement described a 30% performance improvement for the V2.0 generation under relevant lighting conditions. The commercial importance is a smaller cell footprint for a given sensor energy budget, which can reduce enclosure constraints and make battery-free equipment easier for original equipment manufacturers to qualify.
Germany Printed film center Germany hosts ASCA and architectural integration expertise, with OPV films designed for lightweight building surfaces and decorative power generation. ASCA describes modules reaching up to 70 W per square meter under its technology specifications, which is a product-performance indicator rather than verified national sales. German construction buyers focus on fire classification, durability and installation interfaces, so a laboratory efficiency gain does not automatically translate into booked revenue.
Sweden and Greece Specialist production Sweden contributes Epishine indoor photovoltaic technology, including cells designed for low-power consumer devices, while Greek company Organic Electronic Technologies describes roll-to-roll OPV production and related organic electronics activity. These businesses occupy different points of the value chain: one emphasizes component integration and electronics channels, the other manufacturing and film technology. Their presence supports the regional ecosystem without establishing a common output or revenue total.

Market instances

  • Battery replacement became a consumer-electronics design question. Linköping University announced on 16 April 2026 that Epishine-developed printed organic solar cells would be used in a new Google TV remote-control design. The development connects an established electronics distribution channel with a practical indoor-energy source. Its significance is not the number of laboratory samples but the prospect of repeat cell procurement when an OEM integrates the technology into a mass-market device.
  • Low-light cell packaging moved toward industrial scale. Dracula Technologies introduced LAYER V2.0 at CES 2026, reporting a 30% performance increase against its previous generation and emphasizing customized printed shapes. The improvement can support the same sensing duty cycle with less active area, although buyers must still validate real illumination and storage behavior. For European suppliers, consistent manufacturing yield and long-term contracts are the critical next commercialization steps.
In the full report: detailed France, Germany, Sweden, Greece and other European country coverage, with company supply footprints, OEM design wins, low-light output and architecture-specific qualification requirements.

Asia-Pacific THIRD · ~21% SHARE · FASTEST

What supports the faster modeled expansion in Asia-Pacific?

Asia-Pacific holds a modeled ~21% of 2025 cell sales but is assigned the highest regional growth rate, ~30.8% CAGR, because Chinese printed-electronics developers and regional device assemblers can move indoor-harvesting designs into manufacturing programs. Product development in China, Japan and South Korea supports material and packaging capability, although the region’s current demand is not assumed to equal its research or manufacturing capacity.

Market positionThird (~21%)
Growth outlookFastest (~30.8% CAGR)
Demand profileManufacturing expansion led
Market access gateQualification and yield consistency
Country Position in region What drives demand
China Scaling supplier base ChasingLight has described indoor organic photovoltaic modules and larger printed cell formats, including a 650-by-550-millimeter development line. Such specifications demonstrate process scale, but laboratory output or prototype dimensions cannot be used as merchant sales figures. Chinese electronics assemblers can evaluate printed cells for smart labels, sensors and remote devices, where the main competitive question is whether energy harvesting reduces total ownership cost over several years.
Japan Materials and electronics Japan contributes chemical, substrate and device integration expertise relevant to printed photovoltaic stacks, including encapsulation films and precision coating equipment. Domestic electronics manufacturers may value thin cells for indoor controls, asset tracking and maintenance-free monitoring, but qualification demands stable output under realistic LEDs and heat exposure. The region’s modeled 2025 share is based on broader Asia-Pacific commercial conditions rather than a published Japan-only market number.
South Korea and India Emerging adopters South Korea’s electronics manufacturing base offers potential for organic cells in accessories and industrial sensors, while India presents opportunities in low-power building monitoring and remote instrumentation. Neither country should be assigned revenue solely because it has a large conventional solar industry. OPV adoption depends on application-level engineering, especially the match between ambient illumination, storage capacity and the device’s communications schedule.

Market instances

  • Indoor OPV moved into a dedicated Chinese module offering. A November 2025 account of ChasingLight’s iLux products described modules intended for indoor illumination and cited output measured at 1,000 lux. The operating condition is important because low-light performance can differ sharply from standard sunlight tests. Buyers considering asset trackers or smart-home equipment need comparable measurements at their actual light spectrum and should not infer annual cell revenue from a product announcement.
  • Flexible module dimensions broadened manufacturing options. ChasingLight’s development information identifies large-area organic photovoltaic processing and work on newer absorber materials. Moving beyond laboratory coupons allows manufacturers to test coating uniformity, pattern registration and encapsulation losses across production-sized films. For Asia-Pacific suppliers, the commercial impact is the possibility of supplying device makers with repeatable custom shapes, provided qualification and defect rates remain under control.
In the full report: country-specific manufacturing capabilities and end-market adoption in China, Japan, South Korea, India and Southeast Asia, separating R&D capacity from recognized photovoltaic cell sales.

South America FOURTH · ~4% SHARE

Where could organic photovoltaic cells find a viable South American niche?

South America represents an estimated ~4% of 2025 global cell revenue and a modeled ~26.5% CAGR. The most credible opportunities are imported low-power modules used in commercial sensors, building monitoring and selected design-led façades rather than a large indigenous merchant manufacturing industry. Purchasers must account for import duties, component availability and maintenance logistics, which can dominate the economics of very small photovoltaic devices.

Market positionFourth (~4%)
Growth outlookDeveloping (~26.5% CAGR)
Demand profileImported module demand
Market access gateService and import economics
Country Position in region What drives demand
Brazil Largest regional prospect Brazil’s commercial buildings and industrial logistics facilities could adopt indoor photovoltaic cells where replacing batteries is costly or unsafe. An OPV sensor installed in a warehouse should be assessed against illumination during operating and nonoperating hours, not against Brazil’s conventional solar irradiation statistics. Imported components require local integration partners, documentation and after-sales support, which currently limit the speed at which pilot projects can become repeat orders.
Argentina Research-linked demand Argentina offers potential in specialty electronics and energy-efficient building demonstrations, but imported organic cells compete with inexpensive batteries and established small silicon panels. The strongest use cases are visually constrained devices or indoor environments where the light spectrum favors a tuned organic absorber. Purchasers may also require currency and customs planning, adding uncertainty to procurement timing in a small market.
Colombia and Chile Selective applications Colombia and Chile have commercial and industrial monitoring needs that can support low-maintenance sensors, although a regional market share cannot be derived from conventional photovoltaic deployment. A printed cell must operate reliably through humidity, temperature and lighting changes, and its storage circuit must bridge darkness. Integrators can create demand by packaging the technology as a complete maintenance-saving solution while purchasing the cell as a discrete component.

Market instances

  • Warehouse monitoring offers a maintenance-driven buying case. Industrial facilities may have hundreds of battery-powered tags distributed across racks, doors and equipment, making routine replacement labor expensive. An organic photovoltaic cell can be justified when it supplies enough energy from existing indoor lighting to extend the service interval materially. The opportunity remains application-specific, with illumination mapping and a validated power budget required before procurement commitments are commercially credible.
  • Architectural specification creates a longer sales cycle. An importer proposing semitransparent organic photovoltaic films for a façade must coordinate optical appearance, fire performance, moisture protection and electrical routing with local designers. The first installation may be small but technically demanding, and downstream construction costs can far exceed the value of the OPV component. Regional growth therefore depends more on project repeatability than on a broad renewable-energy capacity target.
In the full report: market entry conditions, local distributors, installation requirements and sector opportunities for Brazil, Argentina, Chile, Colombia and other South American countries.

Middle East & Africa FIFTH · ~3% SHARE

How do climate and infrastructure conditions shape demand in the Middle East and Africa?

The Middle East and Africa account for a modeled ~3% of 2025 revenue, with ~30.7% annual growth assumed from a very small base. Lightweight architectural cells and autonomous monitoring equipment offer possible entry points, but extreme heat, ultraviolet exposure and irregular maintenance infrastructure can undermine poorly protected organic stacks. Commercialization is therefore contingent on field-proven encapsulation rather than on nominal solar resource.

Market positionFifth (~3%)
Growth outlookEmerging (~30.7% CAGR)
Demand profileProject and sensor demand
Market access gateHeat resistance and warranty terms
Country Position in region What drives demand
United Arab Emirates Architectural showcase The UAE’s design-led commercial construction sector offers a venue for transparent or colored energy-generating surfaces, provided the photovoltaic element meets demanding façade and safety specifications. Indoor cells could also power low-energy occupancy sensors in managed buildings. However, external summer temperatures and ultraviolet loading require long-term field validation, so a prototype installation cannot be interpreted as evidence of an established national merchant OPV market.
Saudi Arabia Smart-building prospect Saudi Arabia’s large construction and industrial modernization projects create possible demand for low-maintenance sensing and aesthetically integrated energy harvesting. Cell suppliers must demonstrate how their products tolerate heat, dust and intermittent lighting, especially when modules are placed behind tinted glass. Contract structures may favor established building-system integrators, meaning the photovoltaic component is only one part of a much larger procurement decision.
South Africa and Egypt Selective device integration South Africa and Egypt may adopt printed photovoltaic components in specialty monitoring devices, educational pilots and low-power consumer accessories. For outdoor applications, a small conventional silicon cell is often cheaper, so OPV needs a specific advantage such as flexible geometry, indoor-light response or visual integration. Import availability, warranty enforcement and electronics design support are likely to determine near-term adoption more than overall national solar deployment.

Market instances

  • Hot-climate qualification becomes a market-access test. A façade module exposed to desert conditions may experience large day-night temperature swings, strong ultraviolet radiation and airborne dust. These stresses can degrade contacts and barrier films long before a cell reaches its theoretical energy payback. Suppliers seeking projects in the Gulf need independent environmental testing and explicit warranty boundaries, which favors well-engineered modules over visually attractive but unqualified prototypes.
  • Autonomous sensing could reduce site-service visits. Large industrial compounds and logistics facilities can benefit from wireless monitoring where changing batteries is operationally expensive. An organic cell positioned under consistent indoor lighting can contribute energy for intermittent measurements and short radio transmissions, but the power budget must include long unlit periods. A successful installation would create a recurring component opportunity only if the design survives field conditions and is adopted across multiple sites.
In the full report: country opportunity assessments for the UAE, Saudi Arabia, South Africa, Egypt and other markets, including climate qualification, integrator access and imported component economics.

Organic Photovoltaic Solar Cell Manufacturers and Competitive Landscape

Competition is fragmented between architectural film developers, indoor-energy-harvesting specialists and materials-oriented organic electronics businesses. NEXT Energy Technologies and Heliatek demonstrate building integration, while Epishine and Dracula Technologies emphasize compact electronics. A supplier’s addressable revenue depends on whether it sells the photovoltaic cell, a finished module, a complete power system or only upstream materials.

Dracula Technologies differentiates its LAYER platform through customized printed cell geometry and ambient-light operation for battery-free IoT. Its 2026 V2.0 generation was announced with a 30% performance improvement, but the figure measures a product change rather than the company’s market share. Customers will prioritize consistent output under their own LED spectrum, electrical connection reliability and production capacity once the design passes validation.

Epishine’s consumer-electronics route differs from the project-led building business. The April 2026 Linköping University announcement connected its printed cells to Google TV remote controls, creating a possible repeat-order channel with standardized form factors. Architectural developers such as Heliatek, ASCA and NEXT must instead work through glass suppliers, architects and construction schedules; that makes their order timing less predictable even when an individual installation is physically larger.

OET in Greece and ChasingLight in China represent the manufacturing and product-development side of the industry. Their capabilities can influence cost and supply availability, yet announced production area, pilot-line width or laboratory efficiency cannot be converted into annual merchant sales without contract evidence. MORESCO and other materials participants may be relevant upstream, but material shipments should not be counted again as finished OPV cell revenue.

Supplier qualification often depends on intellectual property, customer-specific patterns, and encapsulation know-how rather than simply installed printing capacity. In a compact sensor, cell thickness and output under 200 to 1,000 lux may decide a contract; for a window laminate, transparency and weathering are more important. This fragmentation makes broad market-share rankings unreliable unless companies disclose comparable cell or module sales.

Tier structure

Tier Companies Basis of competition
Integrated film developers Heliatek, ASCA, NEXT Energy Technologies These businesses emphasize energy-generating surfaces for buildings, with capabilities ranging from organic thin-film production to transparent coating integration. They must support project engineering, aesthetic approvals and installation compatibility. A large architectural project can demonstrate scale but should not be treated as recurring cell shipments until the glazing or construction channel places repeat orders.
Indoor-cell specialists Epishine, Dracula Technologies, ChasingLight This group focuses on cells that operate under artificial illumination and fit into small electronics. Commercial differentiation involves low-light power density, custom printing, electrical interface design and manufacturing yield. A consumer-device design win can produce high unit volume, while warranty and reliability requirements remain tied to the complete device rather than only the laboratory cell.
Manufacturing and ecosystem Organic Electronic Technologies, Sunew, MORESCO, Carbon Valley These organizations are associated with printed organic electronics, specialty materials or application development at differing points in the value chain. Their inclusion identifies relevant capabilities rather than a verified ranking of merchant OPV revenue. Buyers should distinguish upstream inks, coating equipment and research activity from cells and integrated modules that fall within the market boundary.

Key companies profiled

  • Heliatek
  • Sunew
  • Organic Electronic Technologies (OET)
  • ASCA
  • MORESCO
  • NEXT Energy Technologies
  • Epishine
  • Dracula Technologies
  • ChasingLight
  • Carbon Valley

Organic Photovoltaic Solar Cell Production and Capacity Analysis

OPV manufacturing relies on precision deposition of organic photoactive layers, electrode formation and moisture-resistant encapsulation. European developers have publicized roll-to-roll production and Chinese companies have disclosed larger-area module development, but announced nameplate capacity is not equivalent to output sold. Commercial scaling is constrained by material uniformity, process yield and customer-specific qualification.

Roll-to-roll processing is attractive because it can produce thin photovoltaic films without high-temperature crystalline wafer fabrication. However, a printed cell is only saleable when the absorber, transport layers, electrodes and barrier stack work together over the intended service life. Defects at the coating edge or a pinhole in encapsulation can dominate field performance, so yield improvement is as important as line speed when a supplier moves from pilot to contracted volumes.

Dracula Technologies describes a Green MicroPower Factory with stated annual capacity up to 150 million square centimeters of printed devices. That figure is a production-capability reference, not a revenue number or evidence that all output was shipped in 2026. Similarly, OET’s statements about roll-to-roll manufacturing and planned area capacity indicate industrial ambition, but purchasers still need evidence of product qualification, repeat orders and the delivered mix of cell formats.

The manufacturing route for architectural coatings differs from that for indoor sensor patches. Large transparent glazing requires optical consistency and electrical connection across broad areas, while small IoT modules need inexpensive cutting, pattern customization and high yield at tiny dimensions. A factory optimized for one product may not economically serve the other without changes to deposition tools, lamination equipment and test fixtures.

Production locations in Germany, France, Sweden, Greece, China and the United States create a geographically dispersed innovation base. Materials can still cross borders several times before reaching a finished cell, so local assembly alone does not guarantee local sourcing. Customers seeking dependable delivery should examine absorber supply, barrier-film suppliers, testing capacity and contingency arrangements rather than relying on country-of-origin labels.

Organic Photovoltaic Solar Cells Market Dynamics, Drivers, Restraints and Opportunities

Demand growth reflects energy harvesting in battery-free electronics, transparent building integration and improvements in printed-cell performance. The positive modeled contributions total 35.50 percentage points, partly offset by 6.00 points from durability, cost and qualification restraints, producing the headline market CAGR. These allocations describe analytical growth influences rather than observed causal coefficients.

MARKET DRIVERS

Drivers Impact Analysis*

Market Drivers Impact Rank CAGR Contribution (%) 2026–2028 2029–2031 2032–2034
Battery-free IoT sensor adoption High +11.20% High High High
BIPV glazing and lightweight façade projects High +8.60% Medium High High
Printed-cell performance and low-light output gains Medium-High +6.30% High Medium Medium
Consumer-electronics OEM design wins Medium +4.70% Medium High High
Roll-to-roll manufacturing and customization Low-Medium +3.00% Medium Medium High
Others (portable accessories and specialist mobility) Low +1.70% Low Medium Medium

Battery-free sensing reduces replacement labor

Indoor energy harvesting has an economic advantage when the expense of changing a battery exceeds the value of the energy delivered. In a warehouse with many inaccessible sensors, printed OPV can recharge a small storage element from ordinary lighting and extend the service interval. Dracula Technologies’ 2026 product generation demonstrates efforts to increase power from a given surface area, making this application the largest modeled positive growth contribution.

Transparent building integration opens nontraditional surfaces

Photovoltaic cells that can be incorporated into windows or decorative façade elements address surfaces that conventional opaque panels cannot use without changing building appearance. NEXT Energy Technologies’ six-window installation in July 2025 showed one practical assembly route. Adoption remains tied to construction schedules, but the available surface area and the value of aesthetic integration support a meaningful long-run opportunity for cell and coating suppliers.

Material and device improvements support smaller footprints

Higher output under realistic indoor illumination permits smaller active areas in remotes, labels and asset-monitoring products. The commercial benefit is not only electrical efficiency: reducing the cell footprint can simplify enclosure design and leave room for antennas or other electronics. Device manufacturers will compare stable lifetime energy delivery against a battery-based design, so improvements in contact design and protective layers are essential complements to absorber advances.

Consumer-device platforms create repeatable orders

Epishine’s connection to a Google TV remote-control program, described in April 2026, illustrates a different growth mechanism from architectural pilot projects. Once a cell is accepted into a standardized consumer product, recurring manufacturing runs can lower unit costs and make production planning more predictable. The qualification threshold remains demanding because buyers expect consistent operation in homes with different light sources and usage patterns.

Others and emerging applications widen addressable demand

Portable electronics, indoor trackers and small auxiliary vehicle systems offer opportunities beyond buildings and fixed industrial sensors. The requirements vary widely: a wearable may value conformability, while a shipping label requires extremely low cost and long shelf life. These emerging uses add breadth to the market but are not assumed to displace mainstream photovoltaic technologies in high-power applications during the 2025–2034 forecast window.

MARKET RESTRAINTS

Restraints Impact Analysis*

Market Restraints Impact Rank CAGR Contribution (%) 2026–2028 2029–2031 2032–2034
Moisture, oxygen and ultraviolet durability High -2.60% High High Medium
Manufacturing yield and integration cost Medium-High -1.70% High Medium Medium
OEM qualification and project delays Medium -1.10% Medium High Medium
Others (battery and silicon alternatives) Low -0.60% Medium Medium Low
*CAGR contribution shows the percentage points each factor adds to or removes from the forecast CAGR for 2026–2034; driver contributions less restraint contributions equal the market CAGR. The period columns describe how each factor influences organic photovoltaic cell adoption as customer qualification and product deployment evolve.

Encapsulation governs the usable product lifetime

Organic active layers can be sensitive to moisture, oxygen and light-induced degradation, making protective barriers a central commercial requirement. A module that performs well in a laboratory may still fail a multiyear warranty test after exposure to humidity or ultraviolet radiation. Outdoor architectural installations therefore require more stringent validation than a sheltered indoor remote, increasing cost and delaying some project conversions.

Early production economics remain volume-sensitive

Coating equipment can produce many square meters, but customer-specific patterns, electrical contacts and encapsulation steps can reduce effective throughput. Low volumes also make testing and process engineering expensive per saleable cell. Suppliers must improve yield and standardize product families before their printed-manufacturing advantage translates into competitive delivered prices, especially against inexpensive batteries or miniature silicon devices.

Design approval and construction cycles slow revenue recognition

A remote-control supplier must pass electronics qualification, while an architectural film developer must satisfy glazing, safety and installation requirements. Both can take longer than the technical development of the cell itself. A successful prototype should therefore be treated as evidence of technical feasibility rather than an immediate indicator of annual sales, and a supplier’s pipeline may be concentrated in a few large customers.

MARKET OPPORTUNITIES

Energy-autonomous commercial buildings

Building managers increasingly deploy wireless occupancy, environmental and asset sensors, but replacing batteries across a large property can create persistent operating expense. Organic cells optimized for indoor light could support devices in illuminated corridors, offices and retail spaces, especially when combined with efficient electronics. The opportunity is strongest where maintenance savings are measurable and the cell can be incorporated without compromising device appearance.

Architectural surfaces with aesthetic constraints

Semitransparent and colored photovoltaic layers could turn selected windows, shades and decorative panels into energy-generating surfaces. These applications do not compete primarily on cost per installed watt against rooftop silicon; they compete on the ability to add generation without sacrificing the building’s intended appearance. A supplier that qualifies a repeatable glazing specification can potentially move from showcase installations to standardized component procurement.

Industrial tracking and connected packaging

Smart labels, asset tags and low-power monitoring devices often operate in places where wiring is impractical and battery replacement is costly. Printed organic cells can be shaped to available surfaces and paired with storage circuitry to harvest intermittent indoor light. For manufacturers, the route to growth is a qualified reference design that electronics integrators can reuse across multiple customer programs rather than a collection of bespoke demonstrations.

Organic Photovoltaic Solar Cell Supply Chain Analysis

The value chain begins with donor and acceptor materials, conductive inks and barrier films; it continues through precision coating, cell patterning, encapsulation and testing before an integrator adds power-management electronics or glazing hardware. The finished cell or integrated photovoltaic module is the revenue object, while upstream chemistry and downstream equipment should be assessed separately.

MaterialsOrganic absorbers, transport layers, electrode inks and substrate films establish spectral response, conductivity and manufacturing compatibility.
Cell fabricationPrinting, coating, patterning and contact deposition convert the material stack into a working photovoltaic junction with controlled electrical characteristics.
Protection and testingEncapsulation, optical inspection and low-light or environmental testing determine whether production output can meet the buyer’s lifetime specification.
OEM integrationDevice makers and façade suppliers combine qualified cells with storage circuits, control electronics, glass or structural components for the final application.

Upstream material selection. Organic absorber chemistry must balance spectral response, stability and processability. A formulation optimized for LED illumination may differ from one designed for outdoor sunlight, so suppliers cannot assume that one ink family will serve every product. Material choices also influence coating solvents, drying conditions and compatibility with transparent electrodes, linking chemistry decisions directly to factory yield and cell lifetime.

Conversion and assembly. The highest-value production steps are those that preserve uniformity across the required cell area and protect the active layers from environmental damage. An IoT customer may request unusual shapes and small electrical contacts, while a glazing buyer requires broad optical uniformity. Both create integration costs that are not visible in laboratory efficiency data, making process engineering an important source of competitive advantage.

Commercial channels. Printed-cell suppliers typically reach buyers through electronics OEMs, power-management integrators, building-product fabricators or specialty distributors. Each channel uses different qualification criteria and procurement cycles, and the cell may account for only a small fraction of the finished product price. Revenue forecasts should therefore track actual cell and module shipments rather than total sales of sensors, remotes or façade systems.

Recent Developments in Organic Photovoltaic Solar Cells

  • 16 April 2026 OEM adoption
    Linköping University reported that Epishine-developed printed organic solar cells would power a Google TV remote-control design using ordinary indoor illumination. The application illustrates a repeatable consumer-electronics procurement channel rather than a one-off research coupon. For suppliers, the commercial question is whether cell output, manufacturing yield and energy-storage integration remain consistent across the volumes required by device assemblers. Source
  • 5 January 2026 Product launch
    Dracula Technologies introduced LAYER V2.0 around CES 2026 and described a 30% performance improvement compared with its earlier organic photovoltaic generation. The design uses customized printing and is aimed at battery-free connected products under indoor light. This development matters because reducing the required cell area can improve device packaging, although commercial success still depends on qualified output under realistic lighting and storage cycles. Source
  • 23 July 2025 Building pilot
    NEXT Energy Technologies announced an installation of six large transparent photovoltaic windows at its Santa Barbara headquarters, each measuring 40 by 60 inches and together covering about 100 square feet. The event shows that organic coatings can be integrated into conventional insulating glass assemblies with dedicated electrical connections. It supports the architectural commercialization pathway but does not establish a national market size or the value of merchant cells shipped. Source
  • 11 February 2025 Manufacturing milestone
    NEXT Energy Technologies described a pilot-line upgrade capable of producing transparent photovoltaic window units measuring 40 by 60 inches. Full-scale glass formats introduce coating-uniformity and electrical-connection requirements that are not evident in small test cells. The advance is relevant to future architectural qualification because buyers expect standard dimensions and predictable aesthetics, while sales remain contingent on project conversion and certification. Source
  • 6 December 2024 Partnership
    NGK announced cooperation involving Epishine’s indoor organic photovoltaic technology and energy-harvesting applications. Partnerships between cell developers and established component suppliers can shorten the path from a photovoltaic sample to a complete power solution by addressing packaging, electrical storage and reliability. Their importance lies in integration and channel access; a collaboration announcement alone should not be counted as a volume sales contract. Source
  • 26 November 2025 Indoor module
    A published account of ChasingLight’s iLux indoor organic photovoltaic products described performance under a 1,000-lux illumination condition. That test environment is materially different from standard outdoor solar-cell characterization and is relevant to connected devices installed in offices and warehouses. Buyers should compare useful output over their own operating schedule before extrapolating laboratory power-density results into recurring product demand. Source
  • 2026 Technology update
    ASCA described printed organic photovoltaic films incorporating newer acceptor materials and product output up to 70 watts per square meter under its stated conditions. The announcement illustrates continued work on lightweight architectural films, but the performance figure is not a measure of annual revenue or installed market share. Field durability, optical appearance and the ability to manufacture consistent large-area modules remain the main commercial tests. Source

REPORT SCOPE & SEGMENTATION

Attribute Details
Study Period 2023–2034
Base Year 2025
Estimated Year 2026
Forecast Period 2025–2034
Historical Reference 2023
Market Size 2025 USD 5.20 million
Market Size 2026 USD 6.73 million
Market Size 2034 USD 53.24 million
Growth Rate CAGR of 29.5% over 2025–2034
Units Value (USD Million); cell and integrated module sales
Segmentation By Type, By Application and By Region
By Type Flexible OPV Module · Rigid OPV Module
By Application BIPV · Transportation & Mobility · IoT · Consumer & Portable Power
By Region Country detail is available within the five regional markets
North AmericaUnited States, Canada, Mexico
EuropeGermany, France, United Kingdom, Italy, Russia, Sweden, Greece, Rest of Europe
Asia-PacificChina, Japan, South Korea, India, Southeast Asia, Rest of Asia-Pacific
South AmericaBrazil, Argentina, Colombia, Chile, Rest of South America
Middle East & AfricaSaudi Arabia, UAE, Egypt, Nigeria, South Africa, Rest of Middle East & Africa
Key Companies Profiled Heliatek, Sunew, Organic Electronic Technologies, ASCA, MORESCO, NEXT Energy Technologies, Epishine, Dracula Technologies, ChasingLight, Carbon Valley
Customization Scope Country-level module adoption, material qualification, low-light performance requirements, architectural cell integration and supplier-specific manufacturing coverage can be customized.

Frequently Asked Questions

How large is the organic photovoltaic solar cells market?

The worldwide market is valued at USD 5.20 million in the 2025 base year, with USD 6.73 million estimated for 2026 and USD 53.24 million projected by 2034. The growth trajectory is 29.5% annually over nine years. These values describe organic cells and integrated cell modules, not entire building façades, completed electronics or the larger conventional photovoltaic industry.

What distinguishes organic photovoltaic cells from silicon panels?

Organic photovoltaic devices use thin photoactive layers made from carbon-based semiconductor materials rather than conventional crystalline silicon wafers. They can be printed on flexible supports and tuned for indoor lighting or visual transparency. Their strongest opportunities are low-power electronics and specialty surfaces, while durability and conversion efficiency constrain competition with mature high-output rooftop and utility-scale silicon products.

Which companies participate in organic photovoltaic solar cells?

Relevant developers include Dracula Technologies and Epishine for indoor harvesting, Heliatek and ASCA for printed architectural films, NEXT Energy Technologies for transparent glazing coatings, and OET and ChasingLight for manufacturing or module development. Their roles are not interchangeable: some supply photovoltaic components, while others also participate in upstream materials or downstream integrated building systems.

Which module type currently leads the market?

Flexible OPV Module holds the leading modeled share at about ~78% in 2025, while Rigid OPV Module accounts for roughly ~22%. Flexible products can fit curved or small electronic surfaces and support printed customization. Rigid constructions are valuable when mechanical support, glass bonding or stable dimensions matter more than bendability, especially in fixed building applications.

What are the principal applications for these cells?

BIPV represents an estimated ~38% of base-year revenue, IoT ~29%, Consumer & Portable Power ~22%, and Transportation & Mobility ~11%. These categories cover very different purchase decisions: architectural cells must satisfy installation and lifetime requirements, whereas indoor sensor cells are evaluated for useful power under LEDs and the maintenance cost of battery replacement.

Which geographic market is the largest?

North America is modeled at ~41% of 2025 revenue, followed by Europe at ~31% and Asia-Pacific at ~21%. The historical monetary regional anchor supports North American leadership, whereas the other regional percentages are analytical allocations. Asia-Pacific is expected to expand fastest at ~30.8% CAGR as printed electronics manufacturing and indoor-module adoption develop.

What is driving growth in indoor organic photovoltaics?

Battery-free sensing offers a clear economic reason to adopt organic cells: fewer battery changes can reduce service labor and waste across distributed devices. The cell must provide enough energy under the actual light spectrum and operating schedule, often with storage for dark periods. Improved printed-cell performance and compact electrical interfaces are making this integration easier for device designers.

Why is building integration an important opportunity?

Organic cells can be incorporated into visually sensitive surfaces such as selected windows, façades and decorative laminates. Transparent or colored coatings may add electricity generation without the appearance of a conventional opaque panel. Commercial acceptance still requires glazing compatibility, long-term encapsulation, electrical safety and installation qualification, so early showcase projects do not guarantee immediate mass deployment.

What technical barriers could delay commercialization?

Moisture and oxygen can damage organic active layers, while ultraviolet exposure, thermal cycling and contact degradation can shorten operating life. Printed manufacturing also requires consistent coating uniformity and reliable encapsulation across large or custom-shaped products. These issues raise testing costs and slow customer qualification, particularly for outdoor products that must satisfy building or industrial warranties.

What is included in the market forecast?

The scope includes flexible and rigid organic photovoltaic cells and integrated cell modules used in buildings, mobility, IoT and portable equipment across five regions. The 2025 base year and 2034 endpoint cover the cell-level commercial value. Finished remote controls, batteries, complete window assemblies, conventional silicon photovoltaics and standalone raw chemical inputs are outside this revenue boundary.

Research Sources & Evidence Base

View research sources used for this overview
  1. Dracula Technologies. LAYER V2.0 CES announcement, 5 January 2026 product performance and indoor harvesting application.
  2. Dracula Technologies. Organic electronics expansion, 9 June 2026 corporate activity and separation of OPV from adjacent OLED research.
  3. Dracula Technologies. Company press release archive, Product and industrial scale-up announcement chronology.
  4. Organic Electronic Technologies. Printed electronics and OPV portfolio, Greek organic photovoltaic manufacturing and application scope.
  5. Organic Electronic Technologies. OET corporate capacity information, Company-described production plans, not realized merchant sales.
  6. Organic Electronic Technologies. OET corporate operations, Location and organizational scope for printed organic devices.
  7. ChasingLight. OPV technology development, Printed-cell formats, materials and development capability.
  8. PV Magazine. ChasingLight indoor module launch, 26 November 2025 module announcement and 1,000-lux test context.
  9. Linköping University. Epishine consumer application, 16 April 2026 indoor organic cell adoption in Google TV remote controls.
  10. Epishine. Indoor energy harvesting products, Company cell platform and application portfolio.
  11. Heliatek. BMW plant organic film installation, 25 February 2026 architectural film deployment context.
  12. Heliatek. Roll-to-roll production, Manufacturing process for organic thin-film photovoltaic products.
  13. ASCA. Printed OPV technology, Organic film performance and material technology update.
  14. ASCA. ASCA corporate information, Company manufacturing and ownership background.
  15. NEXT Energy Technologies. Santa Barbara BIPV installation, 23 July 2025 six-window transparent OPV demonstration.
  16. NEXT Energy Technologies. Large-format OPV window, February 2025 pilot-line and glazing dimension milestone.
  17. NGK. Indoor energy harvesting cooperation, December 2024 partnership context for integrated devices.
  18. Vinnova. OPV ink research project, Research support and upstream technology evidence, not merchant cell revenue.
Global Organic Photovoltaic Solar Cells Market, Trends, Business Strategies 2026–2034

Get Sample Report PDF for Exclusive Insights

Report Sample Includes

  • Table of Contents
  • List of Tables & Figures
  • Charts, Research Methodology, and more...

PDF Icon Download Sample Report PDF

Download Sample Report

Table of Content

Table of Contents
1 Research Methodology and Statistical Scope
1.1 Market Definition and Statistical Scope of Organic Photovoltaic Solar Cells
1.2 Key Market Segments
1.2.1 Organic Photovoltaic Solar Cells Segment by Type
1.2.2 Organic Photovoltaic Solar Cells Segment by Application
1.3 Methodology & Sources of Information
1.3.1 Research Methodology
1.3.2 Research Process
1.3.3 Market Breakdown and Data Triangulation
1.3.4 Base Year
1.3.5 Report Assumptions & Caveats
2 Organic Photovoltaic Solar Cells Market Overview
2.1 Global Market Overview
2.1.1 Global Organic Photovoltaic Solar Cells Market Size (M USD) Estimates and Forecasts (2026-2034)
2.1.2 Global Organic Photovoltaic Solar Cells Sales Estimates and Forecasts (2026-2034)
2.2 Market Segment Executive Summary
2.3 Global Market Size by Region
3 Organic Photovoltaic Solar Cells Market Competitive Landscape
3.1 Global Organic Photovoltaic Solar Cells Sales by Manufacturers (2019-2025)
3.2 Global Organic Photovoltaic Solar Cells Revenue Market Share by Manufacturers (2019-2025)
3.3 Organic Photovoltaic Solar Cells Market Share by Company Type (Tier 1, Tier 2, and Tier 3)
3.4 Global Organic Photovoltaic Solar Cells Average Price by Manufacturers (2019-2025)
3.5 Manufacturers Organic Photovoltaic Solar Cells Sales Sites, Area Served, Product Type
3.6 Organic Photovoltaic Solar Cells Market Competitive Situation and Trends
3.6.1 Organic Photovoltaic Solar Cells Market Concentration Rate
3.6.2 Global 5 and 10 Largest Organic Photovoltaic Solar Cells Players Market Share by Revenue
3.6.3 Mergers & Acquisitions, Expansion
4 Organic Photovoltaic Solar Cells Industry Chain Analysis
4.1 Organic Photovoltaic Solar Cells Industry Chain Analysis
4.2 Market Overview of Key Raw Materials
4.3 Midstream Market Analysis
4.4 Downstream Customer Analysis
5 The Development and Dynamics of Organic Photovoltaic Solar Cells Market
5.1 Key Development Trends
5.2 Driving Factors
5.3 Market Challenges
5.4 Market Restraints
5.5 Industry News
5.5.1 New Product Developments
5.5.2 Mergers & Acquisitions
5.5.3 Expansions
5.5.4 Collaboration/Supply Contracts
5.6 Industry Policies
6 Organic Photovoltaic Solar Cells Market Segmentation by Type
6.1 Evaluation Matrix of Segment Market Development Potential (Type)
6.2 Global Organic Photovoltaic Solar Cells Sales Market Share by Type (2019-2025)
6.3 Global Organic Photovoltaic Solar Cells Market Size Market Share by Type (2019-2025)
6.4 Global Organic Photovoltaic Solar Cells Price by Type (2019-2025)
7 Organic Photovoltaic Solar Cells Market Segmentation by Application
7.1 Evaluation Matrix of Segment Market Development Potential (Application)
7.2 Global Organic Photovoltaic Solar Cells Market Sales by Application (2019-2025)
7.3 Global Organic Photovoltaic Solar Cells Market Size (M USD) by Application (2019-2025)
7.4 Global Organic Photovoltaic Solar Cells Sales Growth Rate by Application (2019-2025)
8 Organic Photovoltaic Solar Cells Market Consumption by Region
8.1 Global Organic Photovoltaic Solar Cells Sales by Region
8.1.1 Global Organic Photovoltaic Solar Cells Sales by Region
8.1.2 Global Organic Photovoltaic Solar Cells Sales Market Share by Region
8.2 North America
8.2.1 North America Organic Photovoltaic Solar Cells Sales by Country
8.2.2 U.S.
8.2.3 Canada
8.2.4 Mexico
8.3 Europe
8.3.1 Europe Organic Photovoltaic Solar Cells Sales by Country
8.3.2 Germany
8.3.3 France
8.3.4 U.K.
8.3.5 Italy
8.3.6 Russia
8.4 Asia Pacific
8.4.1 Asia Pacific Organic Photovoltaic Solar Cells Sales by Region
8.4.2 China
8.4.3 Japan
8.4.4 South Korea
8.4.5 India
8.4.6 Southeast Asia
8.5 South America
8.5.1 South America Organic Photovoltaic Solar Cells Sales by Country
8.5.2 Brazil
8.5.3 Argentina
8.5.4 Columbia
8.6 Middle East and Africa
8.6.1 Middle East and Africa Organic Photovoltaic Solar Cells Sales by Region
8.6.2 Saudi Arabia
8.6.3 UAE
8.6.4 Egypt
8.6.5 Nigeria
8.6.6 South Africa
9 Organic Photovoltaic Solar Cells Market Production by Region
9.1 Global Production of Organic Photovoltaic Solar Cells by Region (2019-2025)
9.2 Global Organic Photovoltaic Solar Cells Revenue Market Share by Region (2019-2025)
9.3 Global Organic Photovoltaic Solar Cells Production, Revenue, Price and Gross Margin (2019-2025)
9.4 North America Organic Photovoltaic Solar Cells Production
9.4.1 North America Organic Photovoltaic Solar Cells Production Growth Rate (2019-2025)
9.4.2 North America Organic Photovoltaic Solar Cells Production, Revenue, Price and Gross Margin (2019-2025)
9.5 Europe Organic Photovoltaic Solar Cells Production
9.5.1 Europe Organic Photovoltaic Solar Cells Production Growth Rate (2019-2025)
9.5.2 Europe Organic Photovoltaic Solar Cells Production, Revenue, Price and Gross Margin (2019-2025)
9.6 Japan Organic Photovoltaic Solar Cells Production (2019-2025)
9.6.1 Japan Organic Photovoltaic Solar Cells Production Growth Rate (2019-2025)
9.6.2 Japan Organic Photovoltaic Solar Cells Production, Revenue, Price and Gross Margin (2019-2025)
9.7 China Organic Photovoltaic Solar Cells Production (2019-2025)
9.7.1 China Organic Photovoltaic Solar Cells Production Growth Rate (2019-2025)
9.7.2 China Organic Photovoltaic Solar Cells Production, Revenue, Price and Gross Margin (2019-2025)
10 Key Companies Profile
10.1 Heliatek
10.1.1 Heliatek Organic Photovoltaic Solar Cells Basic Information
10.1.2 Heliatek Organic Photovoltaic Solar Cells Product Overview
10.1.3 Heliatek Organic Photovoltaic Solar Cells Product Market Performance
10.1.4 Heliatek Business Overview
10.1.5 Heliatek Organic Photovoltaic Solar Cells SWOT Analysis
10.1.6 Heliatek Recent Developments
10.2 Sunew
10.2.1 Sunew Organic Photovoltaic Solar Cells Basic Information
10.2.2 Sunew Organic Photovoltaic Solar Cells Product Overview
10.2.3 Sunew Organic Photovoltaic Solar Cells Product Market Performance
10.2.4 Sunew Business Overview
10.2.5 Sunew Organic Photovoltaic Solar Cells SWOT Analysis
10.2.6 Sunew Recent Developments
10.3 OET
10.3.1 OET Organic Photovoltaic Solar Cells Basic Information
10.3.2 OET Organic Photovoltaic Solar Cells Product Overview
10.3.3 OET Organic Photovoltaic Solar Cells Product Market Performance
10.3.4 OET Organic Photovoltaic Solar Cells SWOT Analysis
10.3.5 OET Business Overview
10.3.6 OET Recent Developments
10.4 ASCA
10.4.1 ASCA Organic Photovoltaic Solar Cells Basic Information
10.4.2 ASCA Organic Photovoltaic Solar Cells Product Overview
10.4.3 ASCA Organic Photovoltaic Solar Cells Product Market Performance
10.4.4 ASCA Business Overview
10.4.5 ASCA Recent Developments
10.5 MORESCO
10.5.1 MORESCO Organic Photovoltaic Solar Cells Basic Information
10.5.2 MORESCO Organic Photovoltaic Solar Cells Product Overview
10.5.3 MORESCO Organic Photovoltaic Solar Cells Product Market Performance
10.5.4 MORESCO Business Overview
10.5.5 MORESCO Recent Developments
10.6 Next Energy Technologies
10.6.1 Next Energy Technologies Organic Photovoltaic Solar Cells Basic Information
10.6.2 Next Energy Technologies Organic Photovoltaic Solar Cells Product Overview
10.6.3 Next Energy Technologies Organic Photovoltaic Solar Cells Product Market Performance
10.6.4 Next Energy Technologies Business Overview
10.6.5 Next Energy Technologies Recent Developments
10.7 Epishine
10.7.1 Epishine Organic Photovoltaic Solar Cells Basic Information
10.7.2 Epishine Organic Photovoltaic Solar Cells Product Overview
10.7.3 Epishine Organic Photovoltaic Solar Cells Product Market Performance
10.7.4 Epishine Business Overview
10.7.5 Epishine Recent Developments
10.8 Dracula Technologies
10.8.1 Dracula Technologies Organic Photovoltaic Solar Cells Basic Information
10.8.2 Dracula Technologies Organic Photovoltaic Solar Cells Product Overview
10.8.3 Dracula Technologies Organic Photovoltaic Solar Cells Product Market Performance
10.8.4 Dracula Technologies Business Overview
10.8.5 Dracula Technologies Recent Developments
10.9 ChasingLight
10.9.1 ChasingLight Organic Photovoltaic Solar Cells Basic Information
10.9.2 ChasingLight Organic Photovoltaic Solar Cells Product Overview
10.9.3 ChasingLight Organic Photovoltaic Solar Cells Product Market Performance
10.9.4 ChasingLight Business Overview
10.9.5 ChasingLight Recent Developments
10.10 Carbon Valley
10.10.1 Carbon Valley Organic Photovoltaic Solar Cells Basic Information
10.10.2 Carbon Valley Organic Photovoltaic Solar Cells Product Overview
10.10.3 Carbon Valley Organic Photovoltaic Solar Cells Product Market Performance
10.10.4 Carbon Valley Business Overview
10.10.5 Carbon Valley Recent Developments
11 Organic Photovoltaic Solar Cells Market Forecast by Region
11.1 Global Organic Photovoltaic Solar Cells Market Size Forecast
11.2 Global Organic Photovoltaic Solar Cells Market Forecast by Region
11.2.1 North America Market Size Forecast by Country
11.2.2 Europe Organic Photovoltaic Solar Cells Market Size Forecast by Country
11.2.3 Asia Pacific Organic Photovoltaic Solar Cells Market Size Forecast by Region
11.2.4 South America Organic Photovoltaic Solar Cells Market Size Forecast by Country
11.2.5 Middle East and Africa Forecasted Consumption of Organic Photovoltaic Solar Cells by Country
12 Forecast Market by Type and by Application (2025-2032)
12.1 Global Organic Photovoltaic Solar Cells Market Forecast by Type (2025-2032)
12.1.1 Global Forecasted Sales of Organic Photovoltaic Solar Cells by Type (2025-2032)
12.1.2 Global Organic Photovoltaic Solar Cells Market Size Forecast by Type (2025-2032)
12.1.3 Global Forecasted Price of Organic Photovoltaic Solar Cells by Type (2025-2032)
12.2 Global Organic Photovoltaic Solar Cells Market Forecast by Application (2025-2032)
12.2.1 Global Organic Photovoltaic Solar Cells Sales (K Units) Forecast by Application
12.2.2 Global Organic Photovoltaic Solar Cells Market Size (M USD) Forecast by Application (2025-2032)
13 Conclusion and Key FindingsList of Tables
Table 1. Introduction of the Type
Table 2. Introduction of the Application
Table 3. Market Size (M USD) Segment Executive Summary
Table 4. Organic Photovoltaic Solar Cells Market Size Comparison by Region (M USD)
Table 5. Global Organic Photovoltaic Solar Cells Sales (K Units) by Manufacturers (2019-2025)
Table 6. Global Organic Photovoltaic Solar Cells Sales Market Share by Manufacturers (2019-2025)
Table 7. Global Organic Photovoltaic Solar Cells Revenue (M USD) by Manufacturers (2019-2025)
Table 8. Global Organic Photovoltaic Solar Cells Revenue Share by Manufacturers (2019-2025)
Table 9. Company Type (Tier 1, Tier 2, and Tier 3) & (based on the Revenue in Organic Photovoltaic Solar Cells as of 2022)
Table 10. Global Market Organic Photovoltaic Solar Cells Average Price (USD/Unit) of Key Manufacturers (2019-2025)
Table 11. Manufacturers Organic Photovoltaic Solar Cells Sales Sites and Area Served
Table 12. Manufacturers Organic Photovoltaic Solar Cells Product Type
Table 13. Global Organic Photovoltaic Solar Cells Manufacturers Market Concentration Ratio (CR5 and HHI)
Table 14. Mergers & Acquisitions, Expansion Plans
Table 15. Industry Chain Map of Organic Photovoltaic Solar Cells
Table 16. Market Overview of Key Raw Materials
Table 17. Midstream Market Analysis
Table 18. Downstream Customer Analysis
Table 19. Key Development Trends
Table 20. Driving Factors
Table 21. Organic Photovoltaic Solar Cells Market Challenges
Table 22. Global Organic Photovoltaic Solar Cells Sales by Type (K Units)
Table 23. Global Organic Photovoltaic Solar Cells Market Size by Type (M USD)
Table 24. Global Organic Photovoltaic Solar Cells Sales (K Units) by Type (2019-2025)
Table 25. Global Organic Photovoltaic Solar Cells Sales Market Share by Type (2019-2025)
Table 26. Global Organic Photovoltaic Solar Cells Market Size (M USD) by Type (2019-2025)
Table 27. Global Organic Photovoltaic Solar Cells Market Size Share by Type (2019-2025)
Table 28. Global Organic Photovoltaic Solar Cells Price (USD/Unit) by Type (2019-2025)
Table 29. Global Organic Photovoltaic Solar Cells Sales (K Units) by Application
Table 30. Global Organic Photovoltaic Solar Cells Market Size by Application
Table 31. Global Organic Photovoltaic Solar Cells Sales by Application (2019-2025) & (K Units)
Table 32. Global Organic Photovoltaic Solar Cells Sales Market Share by Application (2019-2025)
Table 33. Global Organic Photovoltaic Solar Cells Sales by Application (2019-2025) & (M USD)
Table 34. Global Organic Photovoltaic Solar Cells Market Share by Application (2019-2025)
Table 35. Global Organic Photovoltaic Solar Cells Sales Growth Rate by Application (2019-2025)
Table 36. Global Organic Photovoltaic Solar Cells Sales by Region (2019-2025) & (K Units)
Table 37. Global Organic Photovoltaic Solar Cells Sales Market Share by Region (2019-2025)
Table 38. North America Organic Photovoltaic Solar Cells Sales by Country (2019-2025) & (K Units)
Table 39. Europe Organic Photovoltaic Solar Cells Sales by Country (2019-2025) & (K Units)
Table 40. Asia Pacific Organic Photovoltaic Solar Cells Sales by Region (2019-2025) & (K Units)
Table 41. South America Organic Photovoltaic Solar Cells Sales by Country (2019-2025) & (K Units)
Table 42. Middle East and Africa Organic Photovoltaic Solar Cells Sales by Region (2019-2025) & (K Units)
Table 43. Global Organic Photovoltaic Solar Cells Production (K Units) by Region (2019-2025)
Table 44. Global Organic Photovoltaic Solar Cells Revenue (US$ Million) by Region (2019-2025)
Table 45. Global Organic Photovoltaic Solar Cells Revenue Market Share by Region (2019-2025)
Table 46. Global Organic Photovoltaic Solar Cells Production (K Units), Revenue (US$ Million), Price (USD/Unit) and Gross Margin (2019-2025)
Table 47. North America Organic Photovoltaic Solar Cells Production (K Units), Revenue (US$ Million), Price (USD/Unit) and Gross Margin (2019-2025)
Table 48. Europe Organic Photovoltaic Solar Cells Production (K Units), Revenue (US$ Million), Price (USD/Unit) and Gross Margin (2019-2025)
Table 49. Japan Organic Photovoltaic Solar Cells Production (K Units), Revenue (US$ Million), Price (USD/Unit) and Gross Margin (2019-2025)
Table 50. China Organic Photovoltaic Solar Cells Production (K Units), Revenue (US$ Million), Price (USD/Unit) and Gross Margin (2019-2025)
Table 51. Heliatek Organic Photovoltaic Solar Cells Basic Information
Table 52. Heliatek Organic Photovoltaic Solar Cells Product Overview
Table 53. Heliatek Organic Photovoltaic Solar Cells Sales (K Units), Revenue (M USD), Price (USD/Unit) and Gross Margin (2019-2025)
Table 54. Heliatek Business Overview
Table 55. Heliatek Organic Photovoltaic Solar Cells SWOT Analysis
Table 56. Heliatek Recent Developments
Table 57. Sunew Organic Photovoltaic Solar Cells Basic Information
Table 58. Sunew Organic Photovoltaic Solar Cells Product Overview
Table 59. Sunew Organic Photovoltaic Solar Cells Sales (K Units), Revenue (M USD), Price (USD/Unit) and Gross Margin (2019-2025)
Table 60. Sunew Business Overview
Table 61. Sunew Organic Photovoltaic Solar Cells SWOT Analysis
Table 62. Sunew Recent Developments
Table 63. OET Organic Photovoltaic Solar Cells Basic Information
Table 64. OET Organic Photovoltaic Solar Cells Product Overview
Table 65. OET Organic Photovoltaic Solar Cells Sales (K Units), Revenue (M USD), Price (USD/Unit) and Gross Margin (2019-2025)
Table 66. OET Organic Photovoltaic Solar Cells SWOT Analysis
Table 67. OET Business Overview
Table 68. OET Recent Developments
Table 69. ASCA Organic Photovoltaic Solar Cells Basic Information
Table 70. ASCA Organic Photovoltaic Solar Cells Product Overview
Table 71. ASCA Organic Photovoltaic Solar Cells Sales (K Units), Revenue (M USD), Price (USD/Unit) and Gross Margin (2019-2025)
Table 72. ASCA Business Overview
Table 73. ASCA Recent Developments
Table 74. MORESCO Organic Photovoltaic Solar Cells Basic Information
Table 75. MORESCO Organic Photovoltaic Solar Cells Product Overview
Table 76. MORESCO Organic Photovoltaic Solar Cells Sales (K Units), Revenue (M USD), Price (USD/Unit) and Gross Margin (2019-2025)
Table 77. MORESCO Business Overview
Table 78. MORESCO Recent Developments
Table 79. Next Energy Technologies Organic Photovoltaic Solar Cells Basic Information
Table 80. Next Energy Technologies Organic Photovoltaic Solar Cells Product Overview
Table 81. Next Energy Technologies Organic Photovoltaic Solar Cells Sales (K Units), Revenue (M USD), Price (USD/Unit) and Gross Margin (2019-2025)
Table 82. Next Energy Technologies Business Overview
Table 83. Next Energy Technologies Recent Developments
Table 84. Epishine Organic Photovoltaic Solar Cells Basic Information
Table 85. Epishine Organic Photovoltaic Solar Cells Product Overview
Table 86. Epishine Organic Photovoltaic Solar Cells Sales (K Units), Revenue (M USD), Price (USD/Unit) and Gross Margin (2019-2025)
Table 87. Epishine Business Overview
Table 88. Epishine Recent Developments
Table 89. Dracula Technologies Organic Photovoltaic Solar Cells Basic Information
Table 90. Dracula Technologies Organic Photovoltaic Solar Cells Product Overview
Table 91. Dracula Technologies Organic Photovoltaic Solar Cells Sales (K Units), Revenue (M USD), Price (USD/Unit) and Gross Margin (2019-2025)
Table 92. Dracula Technologies Business Overview
Table 93. Dracula Technologies Recent Developments
Table 94. ChasingLight Organic Photovoltaic Solar Cells Basic Information
Table 95. ChasingLight Organic Photovoltaic Solar Cells Product Overview
Table 96. ChasingLight Organic Photovoltaic Solar Cells Sales (K Units), Revenue (M USD), Price (USD/Unit) and Gross Margin (2019-2025)
Table 97. ChasingLight Business Overview
Table 98. ChasingLight Recent Developments
Table 99. Carbon Valley Organic Photovoltaic Solar Cells Basic Information
Table 100. Carbon Valley Organic Photovoltaic Solar Cells Product Overview
Table 101. Carbon Valley Organic Photovoltaic Solar Cells Sales (K Units), Revenue (M USD), Price (USD/Unit) and Gross Margin (2019-2025)
Table 102. Carbon Valley Business Overview
Table 103. Carbon Valley Recent Developments
Table 104. Global Organic Photovoltaic Solar Cells Sales Forecast by Region (2025-2032) & (K Units)
Table 105. Global Organic Photovoltaic Solar Cells Market Size Forecast by Region (2025-2032) & (M USD)
Table 106. North America Organic Photovoltaic Solar Cells Sales Forecast by Country (2025-2032) & (K Units)
Table 107. North America Organic Photovoltaic Solar Cells Market Size Forecast by Country (2025-2032) & (M USD)
Table 108. Europe Organic Photovoltaic Solar Cells Sales Forecast by Country (2025-2032) & (K Units)
Table 109. Europe Organic Photovoltaic Solar Cells Market Size Forecast by Country (2025-2032) & (M USD)
Table 110. Asia Pacific Organic Photovoltaic Solar Cells Sales Forecast by Region (2025-2032) & (K Units)
Table 111. Asia Pacific Organic Photovoltaic Solar Cells Market Size Forecast by Region (2025-2032) & (M USD)
Table 112. South America Organic Photovoltaic Solar Cells Sales Forecast by Country (2025-2032) & (K Units)
Table 113. South America Organic Photovoltaic Solar Cells Market Size Forecast by Country (2025-2032) & (M USD)
Table 114. Middle East and Africa Organic Photovoltaic Solar Cells Consumption Forecast by Country (2025-2032) & (Units)
Table 115. Middle East and Africa Organic Photovoltaic Solar Cells Market Size Forecast by Country (2025-2032) & (M USD)
Table 116. Global Organic Photovoltaic Solar Cells Sales Forecast by Type (2025-2032) & (K Units)
Table 117. Global Organic Photovoltaic Solar Cells Market Size Forecast by Type (2025-2032) & (M USD)
Table 118. Global Organic Photovoltaic Solar Cells Price Forecast by Type (2025-2032) & (USD/Unit)
Table 119. Global Organic Photovoltaic Solar Cells Sales (K Units) Forecast by Application (2025-2032)
Table 120. Global Organic Photovoltaic Solar Cells Market Size Forecast by Application (2025-2032) & (M USD)
List of Figures
Figure 1. Product Picture of Organic Photovoltaic Solar Cells
Figure 2. Data Triangulation
Figure 3. Key Caveats
Figure 4. Global Organic Photovoltaic Solar Cells Market Size (M USD), 2026-2034
Figure 5. Global Organic Photovoltaic Solar Cells Market Size (M USD) (2026-2034)
Figure 6. Global Organic Photovoltaic Solar Cells Sales (K Units) & (2026-2034)
Figure 7. Evaluation Matrix of Segment Market Development Potential (Type)
Figure 8. Evaluation Matrix of Segment Market Development Potential (Application)
Figure 9. Evaluation Matrix of Regional Market Development Potential
Figure 10. Organic Photovoltaic Solar Cells Market Size by Country (M USD)
Figure 11. Organic Photovoltaic Solar Cells Sales Share by Manufacturers in 2023
Figure 12. Global Organic Photovoltaic Solar Cells Revenue Share by Manufacturers in 2023
Figure 13. Organic Photovoltaic Solar Cells Market Share by Company Type (Tier 1, Tier 2 and Tier 3): 2023
Figure 14. Global Market Organic Photovoltaic Solar Cells Average Price (USD/Unit) of Key Manufacturers in 2023
Figure 15. The Global 5 and 10 Largest Players: Market Share by Organic Photovoltaic Solar Cells Revenue in 2023
Figure 16. Evaluation Matrix of Segment Market Development Potential (Type)
Figure 17. Global Organic Photovoltaic Solar Cells Market Share by Type
Figure 18. Sales Market Share of Organic Photovoltaic Solar Cells by Type (2019-2025)
Figure 19. Sales Market Share of Organic Photovoltaic Solar Cells by Type in 2023
Figure 20. Market Size Share of Organic Photovoltaic Solar Cells by Type (2019-2025)
Figure 21. Market Size Market Share of Organic Photovoltaic Solar Cells by Type in 2023
Figure 22. Evaluation Matrix of Segment Market Development Potential (Application)
Figure 23. Global Organic Photovoltaic Solar Cells Market Share by Application
Figure 24. Global Organic Photovoltaic Solar Cells Sales Market Share by Application (2019-2025)
Figure 25. Global Organic Photovoltaic Solar Cells Sales Market Share by Application in 2023
Figure 26. Global Organic Photovoltaic Solar Cells Market Share by Application (2019-2025)
Figure 27. Global Organic Photovoltaic Solar Cells Market Share by Application in 2023
Figure 28. Global Organic Photovoltaic Solar Cells Sales Growth Rate by Application (2019-2025)
Figure 29. Global Organic Photovoltaic Solar Cells Sales Market Share by Region (2019-2025)
Figure 30. North America Organic Photovoltaic Solar Cells Sales and Growth Rate (2019-2025) & (K Units)
Figure 31. North America Organic Photovoltaic Solar Cells Sales Market Share by Country in 2023
Figure 32. U.S. Organic Photovoltaic Solar Cells Sales and Growth Rate (2019-2025) & (K Units)
Figure 33. Canada Organic Photovoltaic Solar Cells Sales (K Units) and Growth Rate (2019-2025)
Figure 34. Mexico Organic Photovoltaic Solar Cells Sales (Units) and Growth Rate (2019-2025)
Figure 35. Europe Organic Photovoltaic Solar Cells Sales and Growth Rate (2019-2025) & (K Units)
Figure 36. Europe Organic Photovoltaic Solar Cells Sales Market Share by Country in 2023
Figure 37. Germany Organic Photovoltaic Solar Cells Sales and Growth Rate (2019-2025) & (K Units)
Figure 38. France Organic Photovoltaic Solar Cells Sales and Growth Rate (2019-2025) & (K Units)
Figure 39. U.K. Organic Photovoltaic Solar Cells Sales and Growth Rate (2019-2025) & (K Units)
Figure 40. Italy Organic Photovoltaic Solar Cells Sales and Growth Rate (2019-2025) & (K Units)
Figure 41. Russia Organic Photovoltaic Solar Cells Sales and Growth Rate (2019-2025) & (K Units)
Figure 42. Asia Pacific Organic Photovoltaic Solar Cells Sales and Growth Rate (K Units)
Figure 43. Asia Pacific Organic Photovoltaic Solar Cells Sales Market Share by Region in 2023
Figure 44. China Organic Photovoltaic Solar Cells Sales and Growth Rate (2019-2025) & (K Units)
Figure 45. Japan Organic Photovoltaic Solar Cells Sales and Growth Rate (2019-2025) & (K Units)
Figure 46. South Korea Organic Photovoltaic Solar Cells Sales and Growth Rate (2019-2025) & (K Units)
Figure 47. India Organic Photovoltaic Solar Cells Sales and Growth Rate (2019-2025) & (K Units)
Figure 48. Southeast Asia Organic Photovoltaic Solar Cells Sales and Growth Rate (2019-2025) & (K Units)
Figure 49. South America Organic Photovoltaic Solar Cells Sales and Growth Rate (K Units)
Figure 50. South America Organic Photovoltaic Solar Cells Sales Market Share by Country in 2023
Figure 51. Brazil Organic Photovoltaic Solar Cells Sales and Growth Rate (2019-2025) & (K Units)
Figure 52. Argentina Organic Photovoltaic Solar Cells Sales and Growth Rate (2019-2025) & (K Units)
Figure 53. Columbia Organic Photovoltaic Solar Cells Sales and Growth Rate (2019-2025) & (K Units)
Figure 54. Middle East and Africa Organic Photovoltaic Solar Cells Sales and Growth Rate (K Units)
Figure 55. Middle East and Africa Organic Photovoltaic Solar Cells Sales Market Share by Region in 2023
Figure 56. Saudi Arabia Organic Photovoltaic Solar Cells Sales and Growth Rate (2019-2025) & (K Units)
Figure 57. UAE Organic Photovoltaic Solar Cells Sales and Growth Rate (2019-2025) & (K Units)
Figure 58. Egypt Organic Photovoltaic Solar Cells Sales and Growth Rate (2019-2025) & (K Units)
Figure 59. Nigeria Organic Photovoltaic Solar Cells Sales and Growth Rate (2019-2025) & (K Units)
Figure 60. South Africa Organic Photovoltaic Solar Cells Sales and Growth Rate (2019-2025) & (K Units)
Figure 61. Global Organic Photovoltaic Solar Cells Production Market Share by Region (2019-2025)
Figure 62. North America Organic Photovoltaic Solar Cells Production (K Units) Growth Rate (2019-2025)
Figure 63. Europe Organic Photovoltaic Solar Cells Production (K Units) Growth Rate (2019-2025)
Figure 64. Japan Organic Photovoltaic Solar Cells Production (K Units) Growth Rate (2019-2025)
Figure 65. China Organic Photovoltaic Solar Cells Production (K Units) Growth Rate (2019-2025)
Figure 66. Global Organic Photovoltaic Solar Cells Sales Forecast by Volume (2026-2034) & (K Units)
Figure 67. Global Organic Photovoltaic Solar Cells Market Size Forecast by Value (2026-2034) & (M USD)
Figure 68. Global Organic Photovoltaic Solar Cells Sales Market Share Forecast by Type (2025-2032)
Figure 69. Global Organic Photovoltaic Solar Cells Market Share Forecast by Type (2025-2032)
Figure 70. Global Organic Photovoltaic Solar Cells Sales Forecast by Application (2025-2032)
Figure 71. Global Organic Photovoltaic Solar Cells Market Share Forecast by Application (2025-2032)