Key Statistics
Key Takeaways
- The global ddic wafer foundry market was valued at USD 4.66 billion in 2025 and is projected to reach USD 6.95 billion by 2034, representing a 4.5% CAGR over 2026–2034.
- Advanced and specialty high-voltage processes are becoming more important as OLED, micro-OLED and higher-refresh-rate displays require tighter power, area and signal-performance targets.
- Small and medium display applications remain strategically important because smartphones, tablets, wearables and automotive displays combine high unit volumes with frequent platform refresh cycles.
- Asia Pacific holds the strongest market position because Taiwan, China, South Korea and Japan combine foundry capacity, display-panel manufacturing, fabless DDIC design and downstream device production.
- 200mm capacity remains commercially relevant for mature high-voltage processes, while 300mm adoption rises where node migration, die scaling and production economics justify larger-wafer manufacturing.
- Supplier selection increasingly depends on qualified eHV process platforms, yield stability, embedded IP support and the ability to coordinate capacity with panel and DDIC design roadmaps.
DDIC Wafer Foundry Market Overview
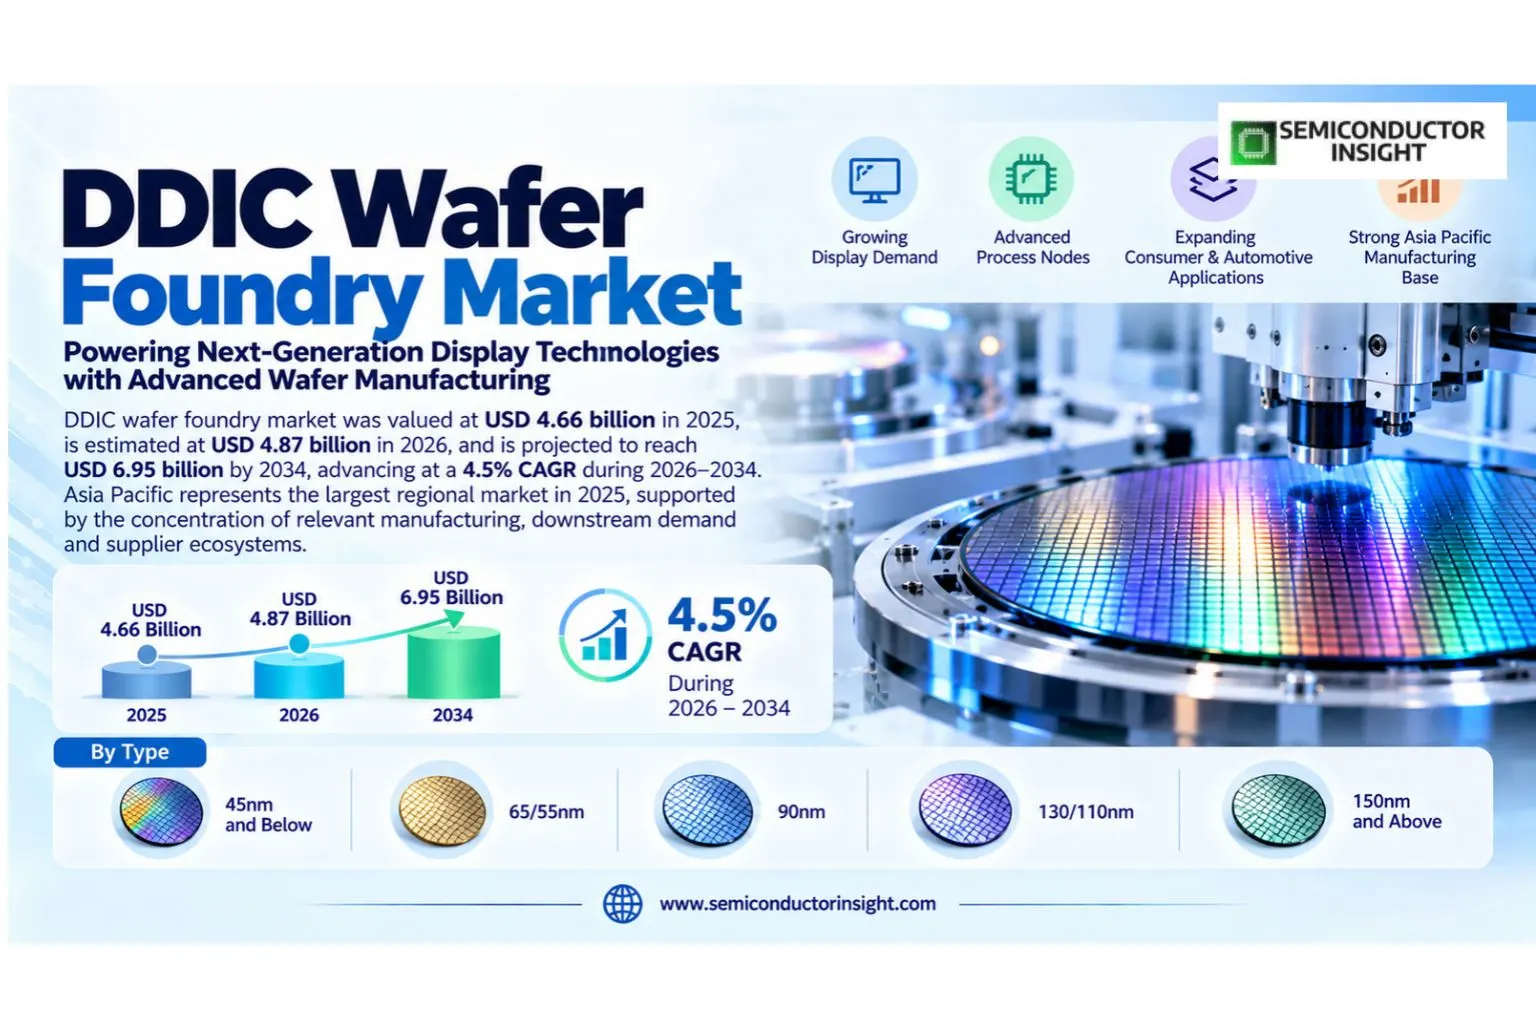
DDIC wafer foundry market was valued at USD 4.66 billion in 2025, is estimated at USD 4.87 billion in 2026, and is projected to reach USD 6.95 billion by 2034, advancing at a 4.5% CAGR during 2026–2034. Asia Pacific represents the largest regional market in 2025, supported by the concentration of relevant manufacturing, downstream demand and supplier ecosystems.
DDIC wafer foundry services cover the front-end fabrication of display driver integrated circuits used to translate digital image information into the analog voltages and timing signals required by LCD, OLED and emerging micro-display panels. The market includes specialty high-voltage CMOS processes, mixed-signal integration, wafer manufacturing and process support for source drivers, gate drivers, timing-related functions and highly integrated display-control devices.
Commercial demand is shaped by display technology rather than by semiconductor unit volume alone. OLED penetration, higher refresh rates, thinner bezels, lower mobile power budgets and automotive cockpit expansion are pushing DDIC designers toward smaller geometries and more specialized high-voltage device structures. At the same time, cost-sensitive television and mainstream display products continue to use mature nodes, preserving a broad technology mix across 8-inch and 12-inch fabs.
The commercial structure of the ddic wafer foundry market is shaped by design qualification, production economics and the interaction between component performance and downstream system requirements. Suppliers that can combine consistent manufacturing, application engineering and supply assurance are better positioned to convert technical eligibility into repeat business. Customer decisions increasingly account for lifecycle continuity, geographic resilience and integration cost, which makes proven process control and ecosystem compatibility as important as nominal product capability.
Segment Analysis: By Type
By type, the DDIC Wafer Foundry market is segmented into 45nm and Below, 65/55nm, 90nm, 130/110nm, 150nm and Above. 45nm and below processes represent the highest-performance portion of the market, while 65/55nm and 90nm remain important for cost-sensitive display drivers and mature LCD programs. Purchasing decisions vary by performance requirement, qualification burden, integration complexity and lifecycle economics, so suppliers compete on application fit rather than on a single technical specification.
| Type | Role in the market | Demand characteristics |
|---|---|---|
| 45nm and Below | 45nm and Below addresses a distinct part of the product and process mix. Its commercial position depends on technical fit, manufacturing maturity, integration requirements and customer qualification rather than on headline specifications alone. | Demand is strongest where the segment aligns with established customer designs, predictable supply, and measurable system-level performance. Suppliers that can document repeatability, compatibility and lifecycle support are better placed to defend design wins. |
| 65/55nm | 65/55nm addresses a distinct part of the product and process mix. Its commercial position depends on technical fit, manufacturing maturity, integration requirements and customer qualification rather than on headline specifications alone. | Demand is strongest where the segment aligns with established customer designs, predictable supply, and measurable system-level performance. Suppliers that can document repeatability, compatibility and lifecycle support are better placed to defend design wins. |
| 90nm | 90nm addresses a distinct part of the product and process mix. Its commercial position depends on technical fit, manufacturing maturity, integration requirements and customer qualification rather than on headline specifications alone. | Demand is strongest where the segment aligns with established customer designs, predictable supply, and measurable system-level performance. Suppliers that can document repeatability, compatibility and lifecycle support are better placed to defend design wins. |
| 130/110nm | 130/110nm addresses a distinct part of the product and process mix. Its commercial position depends on technical fit, manufacturing maturity, integration requirements and customer qualification rather than on headline specifications alone. | Demand is strongest where the segment aligns with established customer designs, predictable supply, and measurable system-level performance. Suppliers that can document repeatability, compatibility and lifecycle support are better placed to defend design wins. |
| 150nm and Above | 150nm and Above addresses a distinct part of the product and process mix. Its commercial position depends on technical fit, manufacturing maturity, integration requirements and customer qualification rather than on headline specifications alone. | Demand is strongest where the segment aligns with established customer designs, predictable supply, and measurable system-level performance. Suppliers that can document repeatability, compatibility and lifecycle support are better placed to defend design wins. |
Segment Analysis: By End User
By end user, the DDIC Wafer Foundry market is segmented into Consumer Electronics, Automotive, Industrial. Consumer electronics accounts for the broadest demand base, while automotive applications carry longer qualification cycles and stronger reliability requirements. Purchasing decisions vary by performance requirement, qualification burden, integration complexity and lifecycle economics, so suppliers compete on application fit rather than on a single technical specification.
| End User | Role in the market | Demand characteristics |
|---|---|---|
| Consumer Electronics | Consumer Electronics represents a relevant purchasing and deployment pathway within this market. Commercial attractiveness depends on how well it aligns with customer architecture, supply-chain constraints and required performance. | Growth is linked to design-in activity, installed-base transitions and the ability of suppliers to meet qualification, cost and availability requirements over the full product lifecycle. |
| Automotive | Automotive represents a relevant purchasing and deployment pathway within this market. Commercial attractiveness depends on how well it aligns with customer architecture, supply-chain constraints and required performance. | Growth is linked to design-in activity, installed-base transitions and the ability of suppliers to meet qualification, cost and availability requirements over the full product lifecycle. |
| Industrial | Industrial represents a relevant purchasing and deployment pathway within this market. Commercial attractiveness depends on how well it aligns with customer architecture, supply-chain constraints and required performance. | Growth is linked to design-in activity, installed-base transitions and the ability of suppliers to meet qualification, cost and availability requirements over the full product lifecycle. |
Segment Analysis: By Application
By application, the DDIC Wafer Foundry market is segmented into Large Size Display (TV), Small and Medium Size Display. Small and medium displays generate the most dynamic design activity because premium smartphones, tablets, wearables and automotive screens place strong emphasis on power efficiency, compact die size and higher refresh rates. Purchasing decisions vary by performance requirement, qualification burden, integration complexity and lifecycle economics, so suppliers compete on application fit rather than on a single technical specification.
| Application | Role in the market | Demand characteristics |
|---|---|---|
| Large Size Display (TV) | Large Size Display (TV) creates demand when the underlying system requires the market’s core function at production scale. Procurement is normally tied to platform launches, equipment upgrades, capacity expansion or replacement cycles. | Buyers evaluate reliability, qualification time, integration cost and vendor support alongside unit economics. Adoption accelerates when the solution removes a system bottleneck or supports a new performance tier without creating disproportionate redesign risk. |
| Small and Medium Size Display | Small and Medium Size Display creates demand when the underlying system requires the market’s core function at production scale. Procurement is normally tied to platform launches, equipment upgrades, capacity expansion or replacement cycles. | Buyers evaluate reliability, qualification time, integration cost and vendor support alongside unit economics. Adoption accelerates when the solution removes a system bottleneck or supports a new performance tier without creating disproportionate redesign risk. |
Segment Analysis: By Technology Node
By technology node, the DDIC Wafer Foundry market is segmented into Advanced Nodes (≤45nm), Mature Nodes (65nm-90nm), Legacy Nodes (≥110nm). Advanced nodes support premium OLED and emerging micro-display requirements, whereas mature nodes retain favorable economics for high-voltage analog functions and established panel designs. Purchasing decisions vary by performance requirement, qualification burden, integration complexity and lifecycle economics, so suppliers compete on application fit rather than on a single technical specification.
| Technology Node | Role in the market | Demand characteristics |
|---|---|---|
| Advanced Nodes (≤45nm) | Advanced Nodes (≤45nm) represents a relevant purchasing and deployment pathway within this market. Commercial attractiveness depends on how well it aligns with customer architecture, supply-chain constraints and required performance. | Growth is linked to design-in activity, installed-base transitions and the ability of suppliers to meet qualification, cost and availability requirements over the full product lifecycle. |
| Mature Nodes (65nm-90nm) | Mature Nodes (65nm-90nm) represents a relevant purchasing and deployment pathway within this market. Commercial attractiveness depends on how well it aligns with customer architecture, supply-chain constraints and required performance. | Growth is linked to design-in activity, installed-base transitions and the ability of suppliers to meet qualification, cost and availability requirements over the full product lifecycle. |
| Legacy Nodes (≥110nm) | Legacy Nodes (≥110nm) represents a relevant purchasing and deployment pathway within this market. Commercial attractiveness depends on how well it aligns with customer architecture, supply-chain constraints and required performance. | Growth is linked to design-in activity, installed-base transitions and the ability of suppliers to meet qualification, cost and availability requirements over the full product lifecycle. |
Segment Analysis: By Wafer Size
By wafer size, the DDIC Wafer Foundry market is segmented into 200mm (8-inch), 300mm (12-inch). 300mm manufacturing improves die economics for larger-volume advanced-node programs, while 200mm remains entrenched in specialty high-voltage production where depreciated tools and established recipes support attractive cost structures. Purchasing decisions vary by performance requirement, qualification burden, integration complexity and lifecycle economics, so suppliers compete on application fit rather than on a single technical specification.
| Wafer Size | Role in the market | Demand characteristics |
|---|---|---|
| 200mm (8-inch) | 200mm (8-inch) represents a relevant purchasing and deployment pathway within this market. Commercial attractiveness depends on how well it aligns with customer architecture, supply-chain constraints and required performance. | Growth is linked to design-in activity, installed-base transitions and the ability of suppliers to meet qualification, cost and availability requirements over the full product lifecycle. |
| 300mm (12-inch) | 300mm (12-inch) represents a relevant purchasing and deployment pathway within this market. Commercial attractiveness depends on how well it aligns with customer architecture, supply-chain constraints and required performance. | Growth is linked to design-in activity, installed-base transitions and the ability of suppliers to meet qualification, cost and availability requirements over the full product lifecycle. |
Regional Analysis
Asia Pacific leads the ddic wafer foundry market in 2025, while regional growth patterns differ according to manufacturing concentration, customer investment cycles, regulation, product mix and supply-chain access. The most important regional distinction is not simply market size; it is the mechanism that converts local investment and end-market demand into qualified purchases.
How does regional demand differ across the ddic wafer foundry market?
Regional demand for ddic wafer foundry is structurally uneven because manufacturing assets, design centers, downstream customers and qualification ecosystems are not distributed evenly. Asia Pacific typically has the deepest electronics manufacturing base, North America combines technology development with capital investment, Europe emphasizes reliability and industrial requirements, and emerging regions are more dependent on imported systems. These differences influence vendor selection, inventory policy, service expectations and the pace at which new technologies are adopted.
| Region | Market position | Growth outlook | Demand profile | Supplier-selection gate |
|---|---|---|---|---|
| Asia Pacific | Largest | Strong | Foundry- and display-manufacturing led | Process qualification and local capacity |
| North America | Second-tier demand | Moderate | Design, premium-device and reshoring led | Foundry ecosystem and qualification |
| Europe | Specialty demand | Moderate | Automotive and industrial led | Reliability and lifecycle support |
| South America | Emerging | Selective | Import- and device-demand led | Landed cost and supply continuity |
| Middle East & Africa | Developing | Selective | Imported-device and project led | Channel access and supply assurance |
Detailed Regional Blocks
Competitive Landscape
Competition in the ddic wafer foundry market is determined by technical qualification, manufacturing consistency, customer relationships and the ability to support product lifecycles. Price matters, but it rarely overrides reliability, integration effort or switching cost once a supplier has been designed into a production platform.
The competitive field includes TSMC, Samsung Foundry, United Microelectronics Corporation (UMC), Vanguard International Semiconductor (VIS), Hua Hong Semiconductor / HLMC, Nexchip Semiconductor, alongside other specialized suppliers. Market share can shift when a vendor gains access to a new platform, expands qualified capacity or introduces a technology that materially improves system performance. Because customer validation can be lengthy, incumbent suppliers often benefit from continuity, while challengers need a clear technical or supply-chain advantage to displace an approved source.
Competitive strategy is increasingly multi-dimensional. Leading suppliers invest in process or product development, application engineering and regional support at the same time, while customers seek second-source options where technically feasible. This creates a market in which differentiation is sustained through documented performance, manufacturing yield, quality systems, responsiveness and the ability to support future roadmap transitions without forcing unnecessary redesigns.
| Company | Competitive position | Primary basis of competition |
|---|---|---|
| TSMC | Established global / strategic supplier | Competes through product capability, qualification, account access and supply execution. |
| Samsung Foundry | Established global / strategic supplier | Competes through product capability, qualification, account access and supply execution. |
| United Microelectronics Corporation (UMC) | Established global / strategic supplier | Competes through product capability, qualification, account access and supply execution. |
| Vanguard International Semiconductor (VIS) | Specialist / regional competitor | Competes through product capability, qualification, account access and supply execution. |
| Hua Hong Semiconductor / HLMC | Specialist / regional competitor | Competes through product capability, qualification, account access and supply execution. |
| Nexchip Semiconductor | Specialist / regional competitor | Competes through product capability, qualification, account access and supply execution. |
| SMIC | Specialist / regional competitor | Competes through product capability, qualification, account access and supply execution. |
| Powerchip Semiconductor Manufacturing Corp. (PSMC) | Focused challenger / niche participant | Competes through product capability, qualification, account access and supply execution. |
| Tower Semiconductor | Focused challenger / niche participant | Competes through product capability, qualification, account access and supply execution. |
| DB HiTek | Focused challenger / niche participant | Competes through product capability, qualification, account access and supply execution. |
| GlobalFoundries | Focused challenger / niche participant | Competes through product capability, qualification, account access and supply execution. |
Production Capacity Analysis
DDIC foundry capacity should be measured as qualified high-voltage process capacity rather than total wafer starts. A fab may have substantial mature-node output but still be unsuitable for a given display driver because device models, voltage options, SRAM libraries, analog IP and reliability characterization are specific to the foundry process. This makes technology-qualified capacity a strategic asset and slows substitution when demand shifts.
Asia Pacific has the strongest concentration of qualified DDIC capacity. UMC’s broad eHV portfolio, TSMC’s specialty technology investment, Samsung’s integrated display ecosystem and Chinese foundry expansion create a multilayered supply base spanning 200mm and 300mm production. The region’s advantage is reinforced by proximity to panel makers and DDIC design houses, which shortens engineering feedback during yield ramp and product qualification.
Capacity should therefore be evaluated on a qualified-output basis rather than as nominal installed capability. A supplier may possess equipment or production lines that appear suitable but still require customer-specific validation, process tuning, test correlation or upstream material qualification. This distinction becomes especially important during demand spikes, when headline capacity can overstate the volume that is immediately available for a particular application, technology generation or reliability class.
Market Dynamics
The ddic wafer foundry market is being shaped by rising performance requirements and technology transitions on the demand side, while qualification complexity, supply concentration and cost discipline constrain the pace of adoption. The balance of these forces favors suppliers that can solve a measurable system problem without increasing integration risk.
Demand expansion is not uniform across all product variants or customer groups. New technology creates attractive design opportunities, but buyers typically require a clear economic or performance case before changing a qualified architecture. At the same time, supply-chain localization, capacity investment and tighter quality requirements are changing procurement behavior. As a result, growth is likely to concentrate around applications where performance upgrades, manufacturing scale and lifecycle value reinforce one another.
Market Drivers
Four forces provide the strongest support for demand in the ddic wafer foundry market: performance-driven technology upgrades, expansion of relevant downstream applications, investment in manufacturing or infrastructure, and the need for more resilient supply. Their importance varies by segment, but each creates a direct reason for customers to qualify or purchase additional solutions.
| Driver | Impact | Commercial mechanism |
|---|---|---|
| OLED, high-refresh-rate and higher-resolution displays raise DDIC complexity | High | Display systems are demanding lower power, faster signaling and more integration. Advanced high-voltage processes reduce die area and energy consumption while supporting higher refresh rates, creating foundry demand for qualified eHV platforms rather than generic mixed-signal capacity. |
| Automotive cockpit digitization expands long-life specialty demand | High | Vehicles are adding larger center displays, digital clusters, head-up displays and passenger screens. Automotive programs reward process stability, long product availability and rigorous qualification, improving the value of foundries that can maintain specialty nodes over extended platform lifecycles. |
| Specialty-node investment supports capacity and process migration | Medium-High | Foundries are investing in mature and specialty technology alongside leading-edge logic. New 22nm and 14nm eHV platforms give DDIC designers a path to reduce power and chip area without abandoning the high-voltage devices required to drive modern panels. |
| Display supply-chain localization increases regional sourcing options | Medium-High | China and other Asian markets are expanding domestic panel and semiconductor ecosystems. Local foundry capability can shorten qualification loops and reduce logistics risk, while also intensifying price competition in mature-node DDIC production. |
OLED, high-refresh-rate and higher-resolution displays raise DDIC complexity
Display systems are demanding lower power, faster signaling and more integration. Advanced high-voltage processes reduce die area and energy consumption while supporting higher refresh rates, creating foundry demand for qualified eHV platforms rather than generic mixed-signal capacity. The commercial effect is strongest where customers can link the technology change to higher throughput, lower power, improved reliability, reduced lifecycle cost or access to a new end-market requirement.
Automotive cockpit digitization expands long-life specialty demand
Vehicles are adding larger center displays, digital clusters, head-up displays and passenger screens. Automotive programs reward process stability, long product availability and rigorous qualification, improving the value of foundries that can maintain specialty nodes over extended platform lifecycles. The commercial effect is strongest where customers can link the technology change to higher throughput, lower power, improved reliability, reduced lifecycle cost or access to a new end-market requirement.
Specialty-node investment supports capacity and process migration
Foundries are investing in mature and specialty technology alongside leading-edge logic. New 22nm and 14nm eHV platforms give DDIC designers a path to reduce power and chip area without abandoning the high-voltage devices required to drive modern panels. The commercial effect is strongest where customers can link the technology change to higher throughput, lower power, improved reliability, reduced lifecycle cost or access to a new end-market requirement.
Display supply-chain localization increases regional sourcing options
China and other Asian markets are expanding domestic panel and semiconductor ecosystems. Local foundry capability can shorten qualification loops and reduce logistics risk, while also intensifying price competition in mature-node DDIC production. The commercial effect is strongest where customers can link the technology change to higher throughput, lower power, improved reliability, reduced lifecycle cost or access to a new end-market requirement.
Market Restraints
Growth is moderated by qualification burden, cyclical purchasing, technology substitution and supply-chain risk. These restraints do not eliminate demand, but they can extend sales cycles, limit supplier switching and reduce the speed at which technically superior solutions convert into production revenue.
| Restraint | Impact | Commercial consequence |
|---|---|---|
| Display cyclicality can create abrupt utilization swings | High | Television, smartphone and monitor demand can change quickly, and DDIC wafers compete with other specialty products for foundry capacity. Weak panel markets can pressure pricing, while sudden recoveries can create allocation risk and longer lead times. |
| Advanced eHV processes require difficult mixed-signal optimization | High | A DDIC combines dense digital logic with high-voltage analog output structures. Moving to smaller nodes is not a simple shrink because leakage, reliability, SRAM scaling, I/O voltage and panel-interface requirements must be balanced within a manufacturable process. |
| Customer qualification limits rapid supplier switching | Medium | Panel makers and DDIC design houses validate electrical behavior, yield, reliability and packaging interactions before volume production. Once a process is qualified, switching foundries can require mask changes, redesign work and a new qualification cycle. |
| Geopolitical and export-control exposure complicates capacity planning | Medium | The industry’s geographic concentration creates sensitivity to trade restrictions, technology controls and cross-border investment rules. Customers may seek dual sourcing, but technically equivalent DDIC foundry capacity is not always available across regions. |
Display cyclicality can create abrupt utilization swings
Television, smartphone and monitor demand can change quickly, and DDIC wafers compete with other specialty products for foundry capacity. Weak panel markets can pressure pricing, while sudden recoveries can create allocation risk and longer lead times. Suppliers can mitigate part of this pressure through stronger qualification support, transparent lifecycle planning, dual-source strategies and better alignment between product roadmaps and customer production schedules.
Advanced eHV processes require difficult mixed-signal optimization
A DDIC combines dense digital logic with high-voltage analog output structures. Moving to smaller nodes is not a simple shrink because leakage, reliability, SRAM scaling, I/O voltage and panel-interface requirements must be balanced within a manufacturable process. Suppliers can mitigate part of this pressure through stronger qualification support, transparent lifecycle planning, dual-source strategies and better alignment between product roadmaps and customer production schedules.
Customer qualification limits rapid supplier switching
Panel makers and DDIC design houses validate electrical behavior, yield, reliability and packaging interactions before volume production. Once a process is qualified, switching foundries can require mask changes, redesign work and a new qualification cycle. Suppliers can mitigate part of this pressure through stronger qualification support, transparent lifecycle planning, dual-source strategies and better alignment between product roadmaps and customer production schedules.
Geopolitical and export-control exposure complicates capacity planning
The industry’s geographic concentration creates sensitivity to trade restrictions, technology controls and cross-border investment rules. Customers may seek dual sourcing, but technically equivalent DDIC foundry capacity is not always available across regions. Suppliers can mitigate part of this pressure through stronger qualification support, transparent lifecycle planning, dual-source strategies and better alignment between product roadmaps and customer production schedules.
Market Opportunities
The most attractive opportunities in the ddic wafer foundry market occur where a technology transition creates measurable value and where suppliers can enter before the customer architecture is locked. Early engagement, application-specific engineering and credible supply planning can convert these windows into durable design positions.
14nm and 22nm eHV platforms for premium OLED
Foundries with advanced high-voltage integration can win premium mobile and micro-display programs where lower power and smaller die size have direct system value. The opportunity is strongest for suppliers that can demonstrate performance with production-relevant data, provide engineering support during qualification and maintain a roadmap that gives customers confidence in long-term availability.
Automotive display-driver specialization
Long qualification cycles, functional-safety expectations and growing display area create attractive specialty programs for suppliers with stable processes and automotive quality systems. The opportunity is strongest for suppliers that can demonstrate performance with production-relevant data, provide engineering support during qualification and maintain a roadmap that gives customers confidence in long-term availability.
Micro-LED and micro-OLED driver architectures
Emerging displays can require new voltage ranges, tighter pixel control and more integrated timing functions, creating design-in opportunities for differentiated foundry platforms. The opportunity is strongest for suppliers that can demonstrate performance with production-relevant data, provide engineering support during qualification and maintain a roadmap that gives customers confidence in long-term availability.
300mm migration for selected high-volume DDIC products
Programs that can move to larger wafers may gain better die economics and capacity scalability, especially when advanced nodes and high annual volumes justify the conversion cost. The opportunity is strongest for suppliers that can demonstrate performance with production-relevant data, provide engineering support during qualification and maintain a roadmap that gives customers confidence in long-term availability.
Supply Chain Analysis
Silicon wafers, gases and specialty materials
Foundries depend on high-purity silicon, photoresists, gases, targets and process chemicals. Stable quality is essential because analog and high-voltage devices can be sensitive to defectivity and parametric variation. Value capture at this stage depends on quality consistency, technical differentiation and the difficulty of substitution. Bottlenecks can propagate downstream when qualification or material compatibility prevents customers from shifting quickly to an alternative supplier.
Specialty foundry fabrication
High-voltage CMOS, mixed-signal devices, metal interconnects and wafer-level testing are executed on qualified node-specific platforms. Yield learning and process control determine cost competitiveness. Value capture at this stage depends on quality consistency, technical differentiation and the difficulty of substitution. Bottlenecks can propagate downstream when qualification or material compatibility prevents customers from shifting quickly to an alternative supplier.
DDIC design, packaging and test
Fabless DDIC suppliers integrate source/gate drive functions and coordinate wafer sort, packaging and final electrical test before shipment to panel-module customers. Value capture at this stage depends on quality consistency, technical differentiation and the difficulty of substitution. Bottlenecks can propagate downstream when qualification or material compatibility prevents customers from shifting quickly to an alternative supplier.
Panel and device integration
Display-panel makers integrate DDICs with LCD, OLED or emerging panels, after which smartphone, television, automotive and industrial OEMs capture final system value. Value capture at this stage depends on quality consistency, technical differentiation and the difficulty of substitution. Bottlenecks can propagate downstream when qualification or material compatibility prevents customers from shifting quickly to an alternative supplier.
Recent Developments
Recent developments show how technology roadmaps, manufacturing investment and standards are changing the competitive requirements of the ddic wafer foundry market. The entries below are selected for their direct relevance to product capability, capacity, qualification or downstream adoption rather than for general corporate activity.
UMC released a 14nm eHV FinFET platform for display driver ICs, stating that it can reduce power consumption by up to 40% and chip area by 35% versus its 22nm process. The development extends advanced-node economics into DDIC fabrication and raises competitive pressure on foundries focused only on mature high-voltage nodes. Source
UMC introduced its 22nm eHV technology for premium mobile display drivers, citing up to 30% lower core-device power consumption and 10% smaller SRAM bit cells versus 28nm eHV. The platform illustrates how foundry process innovation is becoming a direct lever for battery life, die size and display performance. Source
TSMC reiterated investment in specialty technologies and capacity in its 2025 annual report. Continued specialty-process development is relevant to DDIC customers because advanced display drivers need long-lived mixed-signal and high-voltage platforms alongside mainstream logic investment. Source
Report Scope & Segmentation
| Report attribute | Coverage |
|---|---|
| Market | DDIC Wafer Foundry |
| Base Year | 2025 |
| Estimated Year | 2026 |
| Forecast Period | 2026–2034 |
| 2025 Market Size | USD 4.66 billion |
| 2026 Estimated Size | USD 4.87 billion |
| 2034 Forecast Size | USD 6.95 billion |
| CAGR (2026–2034) | 4.5% |
| Largest Market in 2025 | Asia Pacific |
| By Type | 45nm and Below, 65/55nm, 90nm, 130/110nm, 150nm and Above |
| By Application | Large Size Display (TV), Small and Medium Size Display |
| By End User | Consumer Electronics, Automotive, Industrial |
| By Technology Node | Advanced Nodes (≤45nm), Mature Nodes (65nm-90nm), Legacy Nodes (≥110nm) |
| By Wafer Size | 200mm (8-inch), 300mm (12-inch) |
| Companies Profiled | TSMC, Samsung Foundry, United Microelectronics Corporation (UMC), Vanguard International Semiconductor (VIS), Hua Hong Semiconductor / HLMC, Nexchip Semiconductor, SMIC, Powerchip Semiconductor Manufacturing Corp. (PSMC), Tower Semiconductor, DB HiTek, GlobalFoundries |
Frequently Asked Questions
What was the ddic wafer foundry market size in 2025?
The global ddic wafer foundry market was valued at USD 4.66 billion in 2025. The 2025 value is the base-year reference used throughout this overview and provides the starting point for comparing the 2026 estimate and the 2034 forecast.
What is the projected ddic wafer foundry market size in 2034?
The global market is projected to reach USD 6.95 billion by 2034. The forecast reflects the interaction of downstream adoption, technology transitions, production investment and the qualification requirements that shape commercial conversion across the market.
What is the CAGR of the ddic wafer foundry market from 2026 to 2034?
The ddic wafer foundry market is expected to expand at a 4.5% CAGR during 2026–2034. Growth will not be uniform across every product or region because customer qualification, capital cycles, supply constraints and application-specific performance requirements differ materially.
Which region is the largest ddic wafer foundry market?
Asia Pacific is the largest regional market in 2025. Its position is supported by the concentration of relevant manufacturing, customers, technology ecosystems and downstream demand, although the precise commercial mechanism differs by country and application.
How is the ddic wafer foundry market segmented by type?
By type, the market is segmented into 45nm and Below, 65/55nm, 90nm, 130/110nm, 150nm and Above. These categories address different performance, cost and integration requirements, so supplier selection depends on application fit, qualification history and lifecycle economics rather than a single specification.
What are the main applications for ddic wafer foundry?
By application, the market covers Large Size Display (TV), Small and Medium Size Display. Demand in each application is linked to platform launches, capacity expansion, equipment replacement and the degree to which the technology improves system performance or manufacturing economics.
What are the principal growth drivers for the ddic wafer foundry market?
Key drivers include oled, high-refresh-rate and higher-resolution displays raise ddic complexity and automotive cockpit digitization expands long-life specialty demand. These forces increase demand when customers can translate technical improvements into higher performance, lower cost, greater reliability or access to new applications.
What are the main restraints in the ddic wafer foundry market?
Important restraints include display cyclicality can create abrupt utilization swings and advanced ehv processes require difficult mixed-signal optimization. The resulting qualification burden, purchasing cyclicality and technology risk can extend sales cycles and limit rapid supplier substitution even when new solutions offer clear technical advantages.
Which companies participate in the ddic wafer foundry market?
Companies profiled in this market include TSMC, Samsung Foundry, United Microelectronics Corporation (UMC), Vanguard International Semiconductor (VIS), Hua Hong Semiconductor / HLMC, Nexchip Semiconductor, SMIC, Powerchip Semiconductor Manufacturing Corp. (PSMC). Competition centers on qualification, product or process performance, manufacturing consistency, customer support and the ability to maintain supply across the required product lifecycle.
What should buyers evaluate when selecting a ddic wafer foundry supplier?
Buyers should evaluate demonstrated performance, qualification history, manufacturing consistency, lifecycle support, supply resilience and integration cost. A technically strong product can still face adoption barriers if it increases redesign risk, lacks regional support or cannot meet the customer’s production and quality requirements.
Research Sources & Evidence Base
View research sources used for this overview.
- UMC. Embedded High Voltage technology — DDIC-specific eHV process portfolio from 0.8µm to 14nm and display technology coverage.
- UMC. 14nm eHV FinFET platform announcement — 2026 process launch, power and area improvements, and DDIC positioning.
- UMC. 22nm eHV platform announcement — 2024 process launch and OLED DDIC manufacturing context.
- TSMC. 2025 Annual Report — Specialty technology investment and manufacturing-capacity context.
- SEMI. 2026 semiconductor equipment forecast — Foundry, logic and regional equipment-investment context.
Get Sample Report PDF for Exclusive Insights
Report Sample Includes
- Table of Contents
- List of Tables & Figures
- Charts, Research Methodology, and more...
 Download Sample Report PDF