SEMICONDUCTOR INSIGHT
MARKET RESEARCH REPORT

Connector Market

2026 to 2034
MARKET INTELLIGENCE
ACROSS KEY REGIONS
2026 EDITION
ELECTRONIC COMPONENTS Semiconductor Market Research

Connector Market

Size, Emerging Trends, Technological Advancements, and Business Strategies 2026-2034

◷
UPDATED 23 September 2026
▤
REPORT LENGTH Detailed Report
▯
FORMATS PDF

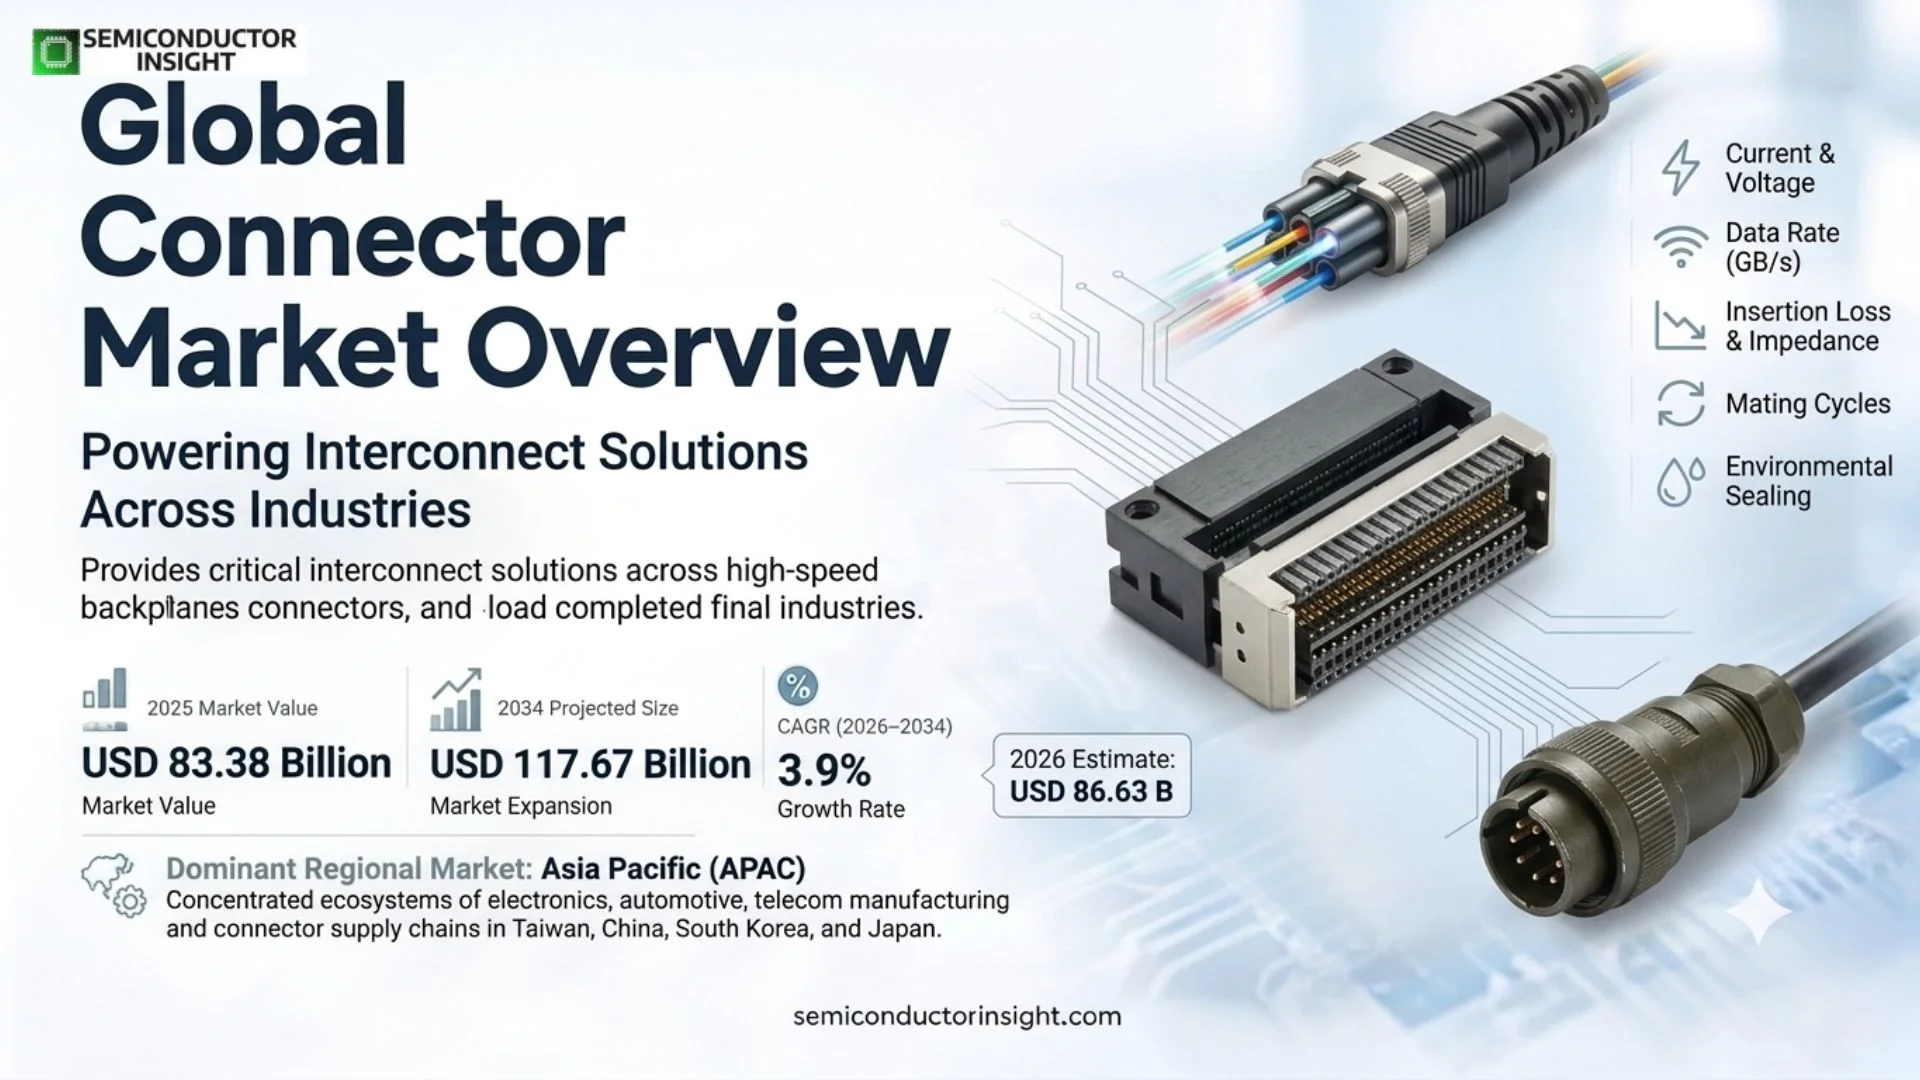
Connector market  is projected to reach USD 117.67 billion by 2034, representing a 3.9% CAGR during 2026–2034. The 2026 estimated market size is USD 86.63 billion. Asia Pacific is the leading regional market, supported by its concentration of electronics manufacturing, automotive production, telecom infrastructure and connector supply chains.

Get the sample PDF with study scope, segmentation and methodology details.

Key Statistics

2025 Market Size
USD 83.38 billion
2034 Projected Size
USD 117.67 billion
CAGR (2026–2034)
3.9%
Largest Market in 2025
Asia Pacific

Key Takeaways

  • Electrical and PCB connectors remain the broadest product class because nearly every electronic system needs reliable board, wire, power or signal interconnection, while RF, fiber and high-speed data connectors capture higher value where bandwidth and signal integrity are critical.
  • Automotive, telecommunications and data centers are the strongest demand centers. Vehicle electrification raises connector count and voltage requirements, while AI infrastructure drives denser high-speed, optical and power interconnect.
  • Asia Pacific is the leading regional market based on the concentration of electronics, automotive, telecom-equipment and connector manufacturing across China, Japan, South Korea, Taiwan and Southeast Asia.
  • High-speed density is increasing rapidly. TE Connectivity introduced its 56G MezzaWave board-to-board connector in March 2026, supporting PAM4 signaling, 1.27 mm pitch and configurations from 80 to 560 pins.
  • Industry consolidation is reshaping high-speed and fiber interconnect. Amphenol completed the acquisition of CommScope’s Connectivity and Cable Solutions business in January 2026, adding a large fiber-optic interconnect platform serving IT datacom and communications markets.

Connector Market Overview

Connector market is valued at USD 83.38 billion in 2025 and is projected to reach USD 117.67 billion by 2034, representing a 3.9% CAGR during 2026–2034. The 2026 estimated market size is USD 86.63 billion. Asia Pacific is the leading regional market, supported by its concentration of electronics manufacturing, automotive production, telecom infrastructure and connector supply chains.

Base year: 2025 · Estimated year: 2026 · Forecast period: 2026–2034 · Historical data: 2022–2025 · Values in USD

Connectors provide removable electrical, optical or RF interfaces between boards, cables, subsystems and equipment. The category spans simple low-voltage plugs and sockets through high-speed backplane, coaxial RF, fiber-optic, high-current power and harsh-environment circular interconnect. Performance requirements are defined by current, voltage, data rate, insertion loss, impedance, mating cycles, environmental sealing and mechanical robustness.

Market growth is increasingly shaped by system architecture rather than connector count alone. AI servers and switches need higher bandwidth density and more power per rack, vehicles are moving toward high-voltage electrification and zonal wiring, and telecom networks require more fiber and RF connectivity. These trends increase value per interconnect even when individual connector size shrinks.

Reliability and qualification create durable supplier relationships. Automotive, aerospace, medical and industrial customers often validate connectors through vibration, thermal cycling, sealing, flammability and lifecycle tests before production. High-speed data systems add signal-integrity modeling and channel validation, making engineering support, simulation and application-specific design important competitive differentiators.

Segment Analysis: By Type

By type, the market spans Electrical, Audio, Video, RF, Data, Power, Automotive, Fiber Optic, Circular and PCB Connectors. Electrical and PCB interconnects represent the broadest installed base, while RF, fiber and high-speed data products capture higher technical value in communications, AI infrastructure and advanced electronic systems.

Connector type Technical role Market position
Electrical & PCB Connectors Board-to-board, wire-to-board, wire-to-wire and backplane connectors move low- and high-speed signals between electronic assemblies. Pitch, contact density, current rating and signal integrity determine design suitability. The broadest product class by application count. Miniaturization and higher data rates are pushing tighter pitch, better shielding and more sophisticated contact geometry.
RF Connectors Coaxial and microwave connectors preserve controlled impedance from antenna or RF module through cables and boards. Frequency range, return loss, insertion loss and mechanical repeatability are critical. A high-value specialty category serving wireless infrastructure, aerospace, test, satellite and radar systems.
Data & Fiber Optic Connectors Copper high-speed and optical connectors support servers, switches, telecom systems and data-center fabrics. Density, channel loss, thermal behavior and serviceability become more important as lane rates increase. A strong growth segment driven by AI networking, cloud infrastructure and the migration from copper toward optical interconnect at longer or higher-speed links.
Power & Automotive Connectors High-current and high-voltage connectors distribute energy in EV batteries, charging, industrial systems, renewable equipment and data centers. Creepage, clearance, contact heating and sealing are key design constraints. A major growth category as EVs move to higher-voltage architectures and AI racks increase DC power requirements.
Circular & Specialty Connectors Circular, sealed and rugged connectors serve industrial, medical, aerospace and defense equipment where vibration, moisture, repeated mating and harsh environments are common. A premium segment with lower unit volume but higher engineering and qualification requirements.

Mating design and end-user segmentation

The market can also be segmented by mating design and end-user industry. Plug-and-socket architectures remain the standard removable interface, while application-specific shells, latches, seals and keying reduce assembly error. End users include electronics, automotive, telecommunications, manufacturing, healthcare, aerospace and defense, energy and IT infrastructure.

Axis Segments Commercial implication
By Mating Design Plug Connector · Socket Connector Plug and socket elements are engineered as a matched pair. Contact force, plating, retention and keying influence signal quality, mating life and field serviceability.
By End User Electronics · Automotive · Telecommunications · Manufacturing · Healthcare · Aerospace & Defense · Energy · IT Infrastructure Each industry emphasizes a different mix of density, power, ruggedness, lifecycle and certification. Suppliers with modular contact technologies can reuse core engineering across several end markets.

Segment Analysis: By Application

By application, automotive, telecommunications, data centers and consumer electronics form the largest demand clusters. Automotive electrification raises connector value per vehicle, while data centers and telecom networks need faster electrical and optical interfaces. Industrial, aerospace, medical and energy applications add long-life, rugged and safety-qualified demand.

Application Key market insight
Automotive Modern vehicles use connectors in battery packs, inverters, charging, ADAS, infotainment, sensors and zonal electrical architectures. EVs increase high-voltage and high-current requirements, while safety and harsh-environment operation make sealing, contact stability and long-term qualification central to supplier selection.
Telecommunications Radio units, base stations, routers and optical transport systems use RF, power, high-speed copper and fiber connectors. Network densification increases port count and favors compact interconnects that maintain signal integrity and outdoor reliability.
Data Centers AI and cloud infrastructure require very high aggregate bandwidth and rack power. High-speed board-to-board, cable, optical and high-current power connectors support switches, accelerators, storage and power-distribution equipment. Density and thermal performance are now core design parameters.
Consumer Electronics Phones, PCs, displays, appliances and wearables use miniature connectors for charging, batteries, cameras, audio, displays and internal board links. Cost and size are critical, but high-speed interfaces continue to increase signal-integrity requirements.
Industrial / Medical / Aerospace Industrial machines, diagnostic equipment and aerospace systems use rugged connectors with long mating life, shielding, sealing and controlled materials. Volumes are lower than consumer electronics but qualification and customization support higher value per connector.

Connector Market Share

Regional Analysis

Asia Pacific is the leading Connector market because China, Japan, South Korea, Taiwan and Southeast Asia host large electronics, vehicle, telecom-equipment and connector-manufacturing ecosystems. North America is a major high-speed, data-center, aerospace and automotive market, while Europe is strong in automotive, industrial and energy interconnect.

How do connector requirements differ across major regions?

Regional demand follows manufacturing concentration and end-market mix. Asia Pacific benefits from electronics and vehicle volume. North America has large AI-data-center, aerospace and communications demand and is home to major connector suppliers. Europe emphasizes automotive, industrial and energy systems with strict lifecycle and compliance requirements. Emerging regions grow through telecom, electrification and local manufacturing expansion.

Region Market position Growth outlook Core demand Commercial priority
Asia Pacific Leading region High Electronics, auto & telecom Scale, cost, density and local engineering
North America High-value technology market High AI data center, aerospace & auto Bandwidth, power density and supply assurance
Europe Automotive / industrial hub Moderate to high EV, industrial & energy Reliability, compliance and lifecycle
South America Emerging Moderate Automotive, telecom & industry Cost and imported supply
Middle East & Africa Emerging Moderate Telecom, energy & infrastructure Ruggedness and regional support
Asia PacificLEADING REGIONAL MARKET

Why does Asia Pacific lead connector demand?

The region combines the world’s largest electronics manufacturing base with substantial automotive, telecom-equipment and industrial production. China provides scale in consumer electronics and EVs, Japan has long-established connector and automotive suppliers, South Korea is strong in electronics and telecom, and Taiwan supports servers, networking and semiconductor systems.

Market position
Leading
Growth outlook
High
Demand profile
Electronics, EV & telecom
Commercial gate
Scale and local support
Country / cluster Role Market instance
China Largest manufacturing base Consumer electronics, EVs, renewable systems and telecom equipment create broad demand across signal, power and optical connectors.
Japan Technology and automotive hub High-reliability connectors support vehicles, industrial systems, robotics and advanced electronics.
South Korea Electronics / telecom market Mobile devices, displays, batteries and network equipment create dense interconnect requirements.
Taiwan & Southeast Asia Server / EMS growth AI servers, networking equipment and electronics assembly support high-speed and power connector demand.
AI server manufacturing increases both signal and power connector content. High-speed copper and optical links scale alongside higher-current power delivery.
EV growth expands high-voltage connector demand. Battery packs, inverters and charging systems require sealed and touch-safe interconnects.
Dense electronics supply chains favor local customization. Suppliers can shorten sample, tooling and validation cycles when engineering teams are close to OEM production.
North AmericaAI & HIGH-SPEED INTERCONNECT HUB

What drives North American connector growth?

North America combines hyperscale data centers, advanced networking, aerospace, defense, automotive and medical technology. TE Connectivity and Amphenol have large engineering and commercial operations in the region. AI infrastructure is especially important because 56G/112G-class board links, optical interconnect and high-current power systems increase connector value per rack.

Market position
High-value technology market
Growth outlook
High
Demand profile
AI, aerospace & automotive
Commercial gate
Bandwidth and power density
Country / cluster Role Market instance
United States Primary regional market AI data centers, aerospace, defense, medical and EV platforms create strong high-value connector demand.
Mexico Automotive / electronics manufacturing Vehicle and electronics assembly creates large production consumption through global OEM programs.
Canada Aerospace / industrial niche Communications, aerospace and industrial systems support specialized rugged interconnect.
TE launched MezzaWave 56G in March 2026. The board-to-board platform supports 56 Gbps PAM4, 1.27 mm pitch, 80–560 pins and 7–10 mm stack heights.
Amphenol completed the CommScope CCS acquisition in January 2026. The transaction added a large fiber-optic interconnect platform for IT datacom and communications.
Amphenol reported record second-quarter 2026 sales of USD 8.8 billion. Strong demand and acquisitions underline the scale of high-speed and interconnect markets.
Europe

Why is Europe important in connector markets?

Europe is strong in automotive, industrial automation, rail, renewable energy and medical equipment. TE Connectivity and several specialist suppliers serve vehicle and industrial customers that require long product lifecycles, environmental sealing and strict qualification. EV charging and high-voltage architectures are expanding power-connector value.

Market position
Automotive / industrial hub
Growth outlook
Moderate to high
Demand profile
EV, industrial & energy
Commercial gate
Reliability and compliance
Country / cluster Role Market instance
Germany Automotive and industrial center EV, factory automation and machinery create large demand for sealed and high-current interconnect.
France Aerospace / energy market Aerospace, rail and energy systems use rugged and safety-qualified connectors.
United Kingdom & Central Europe Industrial / data infrastructure Manufacturing, telecom and data-center expansion support mixed signal and power demand.
High-voltage EV architectures raise creepage and clearance requirements. Connector design must prevent arcing while remaining compact and serviceable.
Industrial systems prioritize long mating life and sealing. Downtime cost makes reliability more important than the lowest connector price.
Energy transition broadens the market. Charging, solar, storage and grid equipment require power connectors that handle higher current and outdoor exposure.
South America

How does South American connector demand develop?

South America is an emerging market led by Brazil. Vehicle production, telecom expansion, industrial equipment and renewable energy create the main opportunities. Most high-speed and specialty connectors are imported, while local manufacturing focuses more heavily on automotive and standard electrical interconnect.

Market position
Emerging
Growth outlook
Moderate
Demand profile
Auto, telecom & industry
Commercial gate
Cost and distribution
Country / cluster Role Market instance
Brazil Largest regional market Automotive production, telecom and industrial systems create broad connector demand.
Argentina Selective automotive / industrial Global vehicle and equipment platforms bring qualified connector designs into local manufacturing.
Chile Energy / mining niche Renewables and mining create rugged power and industrial interconnect requirements.
Automotive localization supports recurring connector volume. Harness and module production consume qualified terminals and housings locally.
Telecom growth increases fiber and RF interconnect. Network upgrades rely on imported high-performance components.
Renewables create harsh-environment power demand. Outdoor connectors need sealing, UV resistance and stable contact performance.
Middle East & Africa

What supports connector growth in the Middle East and Africa?

Telecom, data centers, renewable energy, oil and gas, transportation and industrial infrastructure create the main demand. Gulf markets are expanding AI and cloud facilities that need high-speed and high-current interconnect, while African markets are led by telecom and industrial applications. Environmental resistance is especially important in heat, dust and outdoor installations.

Market position
Emerging
Growth outlook
Moderate
Demand profile
Telecom, energy & infrastructure
Commercial gate
Ruggedness and availability
Country / cluster Role Market instance
Saudi Arabia Infrastructure / AI growth Data centers, renewable power and industrial projects expand high-speed and power interconnect.
UAE Data-center / telecom hub Cloud, aerospace and smart infrastructure support premium connector applications.
South Africa Regional industrial base Telecom, mining and industrial systems create the largest sub-Saharan demand.
AI data centers need both bandwidth and power. High-density optical and electrical links grow alongside HVDC and high-current distribution.
Outdoor telecom requires sealing and corrosion resistance. Environmental performance is a major qualification criterion.
Renewable-energy projects expand high-power interconnect. Solar and storage systems need field-serviceable connectors with robust contact performance.

Competitive Landscape

The profiled company set includes Amphenol, Rosenberger, CommScope, DDK, L-com, Shireen, Lumberg, Gemintek, SYSKIM, XAHohor, SomeFly Technologies and Zeeteq. The broader connector industry also includes diversified interconnect leaders such as TE Connectivity, whose product development in 2026 highlights the shift toward higher-speed data, optical and high-current power applications.

Amphenol competes across communications, automotive, industrial, aerospace and data-center markets with high-speed, RF, power and fiber-optic interconnect. Its January 2026 acquisition of CommScope’s Connectivity and Cable Solutions business materially expanded its fiber platform, with the acquired business expected to contribute substantial 2026 sales.

TE Connectivity illustrates the industry’s move toward denser high-speed and power interconnect. The 56G MezzaWave connector supports high-density board-to-board links, while the company’s 2026 AI-data-center portfolio emphasizes high-speed copper, optical, thermal and HVDC power connectivity. The breadth of these platforms shows how suppliers increasingly solve system interconnect rather than sell isolated connectors.

Rosenberger and L-com are strong in RF and high-frequency connectivity, while DDK, Lumberg and regional suppliers address industrial, automotive and electronic interfaces. Competitive differentiation depends on signal integrity, power handling, mechanical robustness, global tooling and the ability to support customer validation across many product generations.

Competitive tier structure

Competitive tier Representative companies Competitive strengths
Global diversified leaders Amphenol; TE Connectivity; CommScope / CCS High-speed copper, fiber, RF, automotive and power interconnect with global engineering and manufacturing
RF / industrial specialists Rosenberger; L-com; DDK; Lumberg Coaxial RF, industrial, board and cable systems with application-specific expertise
Regional / niche suppliers Shireen; Gemintek; SYSKIM; XAHohor; SomeFly Technologies; Zeeteq Focused connectivity products, regional customer support and specialized application coverage

Key companies profiled

AmphenolRosenbergerCommScopeDDKL-comShireenLumbergGemintekSYSKIMXAHohorSomeFly TechnologiesZeeteq

Connector Manufacturing & Qualification Analysis

Connector capacity spans precision stamping, molding, plating, contact forming, cable assembly, fiber termination, automated insertion and electrical or optical test. Capacity is highly product specific: a high-volume USB-style contact line cannot simply be converted into a sealed automotive high-voltage connector or a 56G backplane system. Tooling and qualification therefore create meaningful switching and expansion lead times.

Contact plating and molding quality are major determinants of field reliability. Gold, tin, silver and other finishes are selected for current, corrosion and mating-life requirements, while engineered polymers provide insulation, dimensional stability and flame resistance. Tight pitch and higher signal speeds reduce allowable mechanical tolerance.

Qualification capacity is equally important. High-speed connectors require channel simulation and eye-diagram validation, automotive connectors undergo thermal and vibration testing, and fiber connectors need insertion-loss and return-loss verification. Suppliers with internal labs can shorten customer design cycles and protect proprietary application knowledge.

Market Dynamics

Growth is driven by EV electrification, AI data centers, telecom fiberization, industrial automation and renewable energy. Restraints include metal-price volatility, miniaturization complexity, qualification cost and supply-chain concentration. Opportunities center on 56G/112G-class board links, optical interconnect, high-voltage EV charging and modular high-current data-center power.

MARKET DRIVERS

EVs increase both connector count and value

Battery packs, inverters, onboard chargers and zonal architectures use more high-voltage, high-current and high-speed connectors than conventional vehicles. Safety requirements support premium sealed and touch-safe designs.

AI infrastructure raises bandwidth density

Accelerator clusters need more high-speed lanes per switch and server while rack power rises sharply. This simultaneously increases demand for 56G/112G-class board interconnect, optical links and high-current power connectors.

Fiber moves deeper into networks

Higher traffic and longer reach favor optical links from telecom backbone into data centers and enterprise systems. The Amphenol-CommScope CCS transaction reflects the strategic value of fiber connectivity at scale.

Automation increases rugged industrial interconnect

Robotics, machine vision and smart factories use more sensors, motors and networked equipment. Connectors must support repeated movement, EMI control and fast field replacement.

Drivers Impact Analysis

Driver Impact Primary markets Time horizon
EV electrification High Asia Pacific, Europe, North America Medium to long term
AI / data-center bandwidth High North America, Asia Pacific Short to long term
Telecom fiberization High Global Persistent
Industrial automation Medium to high Global Persistent

MARKET RESTRAINTS

Material prices affect connector economics

Copper alloys, gold plating and engineering polymers are important cost inputs. High-volume markets can be price sensitive, so suppliers need efficient material usage and automation.

Smaller connectors are harder to engineer

Tighter pitch reduces mechanical tolerance and increases crosstalk risk. Higher data rates require precise impedance and shielding, raising simulation, tooling and inspection requirements.

Qualification slows supplier switching

Automotive, aerospace and medical connectors can remain in programs for years. Replacing a qualified connector may require revalidation of mechanical, electrical and environmental performance.

Global manufacturing can create regional risk

Many connector components and assemblies are produced in Asia. Customers increasingly want dual sourcing or local capacity for strategic automotive, telecom and data-center programs.

Restraints Impact Analysis

Restraint Impact Exposure Time horizon
Copper / gold / polymer cost Medium to high Global Short to medium term
Miniaturization & signal-integrity complexity High High-speed electronics Persistent
Qualification and tooling cost Medium to high Automotive / aerospace / medical Persistent
Supply-chain concentration Medium Global Persistent

MARKET OPPORTUNITIES

Scale high-speed board-to-board platforms

56G and higher PAM4 links need dense connector systems with controlled loss and crosstalk. AI servers and switches create a large addressable market for modular high-speed mezzanine and backplane products.

Expand optical connectivity

Fiber increasingly replaces copper where reach and bandwidth make electrical links inefficient. Acquisitions and product expansion show strong strategic interest in optical connectors, transceivers and cable assemblies.

Grow high-voltage EV and charging connectors

800V-class vehicles and faster charging raise voltage, current and thermal requirements. Suppliers can capture more value through sealed inlets, busbar interfaces and touch-safe power connectors.

Develop data-center power interconnect

Higher rack power creates demand for low-resistance, high-current connectors and HVDC distribution. Connector design becomes part of thermal and facility-efficiency optimization.

Connector Value Chain Analysis

Metals, polymers & optical materials

Copper alloys, plating metals, engineering resins and fiber define electrical, mechanical and optical capability.

Contact / housing manufacturing

Stamping, molding, machining and plating create connector contacts and insulating structures.

Assembly & qualification

Contacts, seals, cable, fiber and shells are assembled and validated for signal, power and environmental performance.

System integration

Vehicles, servers, networks, industrial equipment and medical systems convert connector reliability into system uptime.

Material selection defines electrical and mechanical limits

Copper alloy conductivity, spring force, plating and polymer temperature capability determine current, mating life and reliability. High-speed designs also need stable dielectric properties.

Precision tooling creates repeatable contact geometry

Stamped contacts and molded housings require micron-level consistency at tight pitch. Tool wear or molding variation can change contact force and signal impedance.

Qualification adds system-specific value

A connector becomes commercially valuable when it has proven performance under the customer’s environmental and electrical conditions. Testing creates a barrier that protects design wins over long product lifecycles.

Field serviceability supports long-term economics

Connectors allow modules to be replaced without soldering or permanent bonding. Easy mating, keying and robust latches reduce maintenance time in data centers, factories and vehicles.

Recent Developments in the Connector Market

29 July 2026

Amphenol reports record second-quarter 2026 results

Amphenol reported quarterly sales of USD 8.8 billion, 30% organic growth and orders of USD 10.7 billion, highlighting strong demand across interconnect markets and the contribution of recent acquisitions.

Primary source

22 July 2026

TE Connectivity reports 14% fiscal third-quarter sales growth

TE reported net sales of USD 5.16 billion and orders of USD 5.7 billion, supported by growth across transportation and industrial markets.

Primary source

27 May 2026

TE highlights next-generation AI data-center connectivity

At COMPUTEX 2026, TE presented high-speed, high-density, optical and HVDC connectivity aimed at AI data centers where bandwidth and power requirements are rising together.

Primary source

16 March 2026

TE launches MezzaWave 56G connector

The new board-to-board platform supports up to 56 Gbps PAM4 signaling, 1.27 mm pitch, 80–560 pins and multiple stack heights for next-generation high-speed electronic systems.

Primary source

12 January 2026

Amphenol completes CommScope CCS acquisition

The acquisition expands Amphenol’s fiber-optic interconnect position in IT datacom and communications and adds a large connectivity platform to the company’s communications portfolio.

Primary source

REPORT SCOPE & SEGMENTATION

Attribute Details
Study Period 2022–2034
Base Year 2025
Estimated Year 2026
Forecast Period 2026–2034
Historical Period 2022–2025
Market Size 2025 USD 83.38 billion
Market Size 2034 USD 117.67 billion
Growth Rate 3.9% during 2026–2034
Unit Value (USD Million/Billion) and connector shipments
By Type Electrical Connector · Audio Connector · Video Connector · RF Connector · Data Connector · Power Connector · Automotive Connector · Fiber Optic Connector · Circular Connector · PCB Connector · Others
By Application Consumer Electronics · Automotive · Telecommunications · Industrial Machinery · Aerospace and Defense · Medical Devices · Data Centers · Energy and Power · Others
By Mating Design Plug Connector · Socket Connector
By End User Electronics · Automotive · Telecommunication · Manufacturing · Healthcare · Aerospace and Defense · Energy · IT Infrastructure · Others
By Region Each region analysed by connector type, application, mating design, end-user industry and country market
North AmericaUnited States, Canada, Mexico
EuropeGermany, France, United Kingdom, Italy and other European markets
Asia PacificChina, Japan, South Korea, Taiwan, India, Southeast Asia and other Asian markets
South AmericaBrazil, Argentina, Chile and other South American markets
Middle East & AfricaSaudi Arabia, UAE, South Africa and other MEA markets
Key Companies Profiled Amphenol · Rosenberger · CommScope · DDK · L-com · Shireen · Lumberg · Gemintek · SYSKIM · XAHohor · SomeFly Technologies · Zeeteq
Customization Scope Free report customization equivalent to up to four analyst working days with purchase. Addition or alteration to country, regional and segment scope.

Frequently Asked Questions

What is the 2025 size of the Connector market?

The market is valued at USD 83.38 billion in 2025 and is projected to reach USD 117.67 billion by 2034. The 2026 estimate is USD 86.63 billion and the 2026–2034 CAGR is 3.9%, supported by automotive, telecom, AI infrastructure and industrial demand.

Which connector types are most important?

Electrical and PCB connectors form the broadest installed base, while RF, high-speed data, fiber-optic and power connectors capture higher technical value in telecom, AI data centers, vehicles and specialized industrial systems.

Which applications are driving growth?

Automotive, telecommunications and data centers are major growth engines. EVs require more high-voltage and high-current connectors, telecom networks use more fiber and RF interconnect, and AI infrastructure needs dense high-speed and high-power connectivity.

Which region leads the market?

Asia Pacific is the leading region based on its concentration of electronics, automotive, telecom-equipment and connector manufacturing. China, Japan, South Korea and Taiwan form a particularly dense interconnect supply and demand ecosystem.

What is the estimated market size in 2026?

The 2026 estimated market size is USD 86.63 billion. Growth reflects continued electrification, higher data rates, more optical connectivity and expansion of electronics content across vehicles, industrial systems and cloud infrastructure.

How is AI changing connector demand?

AI servers and switches need more bandwidth and power per rack. This raises demand for high-speed board-to-board connectors, optical interconnect and high-current power systems while making thermal and signal-integrity performance more important.

Why are EVs important to connector suppliers?

EV batteries, inverters, onboard chargers and fast-charging systems require sealed high-voltage and high-current interconnect. Zonal vehicle architectures also increase high-speed data links and power distribution across the vehicle.

What are the main market restraints?

The main restraints are metal and polymer cost volatility, higher engineering complexity from miniaturization and faster data rates, expensive qualification in regulated industries and geographic concentration of manufacturing.

What is the key high-speed connector trend?

Board-to-board and cable systems are moving toward 56G, 112G and higher signaling while maintaining density and thermal performance. TE’s 56G MezzaWave launch in 2026 illustrates this transition in compact mezzanine connectivity.

What does the report cover?

The report covers electrical, RF, data, power, automotive, fiber, circular and PCB connectors; major end-use applications; plug and socket formats; five global regions; manufacturing and qualification analysis; and the profiled company set.

Research Sources & Evidence Base

View primary and authoritative evidence used in this overview
  1. TE Connectivity. 2025 Annual Report – Primary company evidence on transportation and industrial connectivity businesses and end-market exposure.
  2. TE Connectivity. MezzaWave 56G Connector – March 2026 product launch covering 56 Gbps PAM4, 1.27 mm pitch and high-density board-to-board applications.
  3. TE Connectivity. AI Data Center Connectivity at COMPUTEX 2026 – May 2026 evidence on high-speed, optical and HVDC interconnect for AI infrastructure.
  4. Amphenol. 2025 Form 10-K – Primary filing covering communications, automotive, high-speed, RF, power and fiber-optic interconnect businesses.
  5. Amphenol. Completion of CommScope CCS Acquisition – January 2026 evidence on expansion of fiber-optic interconnect in IT datacom and communications.
  6. Amphenol. Second Quarter 2026 Results – July 2026 primary evidence on record sales, organic growth and order activity.

Connector Market Size, Emerging Trends, Technological Advancements, and Business Strategies 2026-2034

Get Sample Report PDF for Exclusive Insights

Report Sample Includes

  • Table of Contents
  • List of Tables & Figures
  • Charts, Research Methodology, and more...

PDF Icon Download Sample Report PDF

Table of Content

1 Introduction to Research & Analysis Reports
1.1 Connector Market Definition
1.2 Market Segments
1.2.1 Market by Type
1.2.2 Market by Application
1.3 Global Connector Market Overview
1.4 Features & Benefits of This Report
1.5 Methodology & Sources of Information
1.5.1 Research Methodology
1.5.2 Research Process
1.5.3 Base Year
1.5.4 Report Assumptions & Caveats
2 Global Connector Overall Market Size
2.1 Global Connector Market Size: 2022 VS 2035
2.2 Global Connector Market Size, Prospects & Forecasts: 2018-2035
2.3 Key Market Trends, Opportunity, Drivers and Restraints
2.3.1 Market Opportunities & Trends
2.3.2 Market Drivers
2.3.3 Market Restraints
3 Company Landscape
3.1 Top Connector Players in Global Market
3.2 Top Global Connector Companies Ranked by Revenue
3.3 Global Connector Revenue by Companies
3.4 Top 3 and Top 5 Connector Companies in Global Market, by Revenue in 2022
3.5 Global Companies Connector Product Type
3.6 Tier 1, Tier 2 and Tier 3 Connector Players in Global Market
3.6.1 List of Global Tier 1 Connector Companies
3.6.2 List of Global Tier 2 and Tier 3 Connector Companies
4 Market Sights by Product
4.1 Overview
4.1.1 By Type – Global Connector Market Size Markets, 2022 & 2035
4.1.2 Plug Connector
4.1.3 Socket Connector
4.2 By Type – Global Connector Revenue & Forecasts
4.2.1 By Type – Global Connector Revenue, 2018-2023
4.2.2 By Type – Global Connector Revenue, 2024-2035
4.2.3 By Type – Global Connector Revenue Market Share, 2018-2035
5 Sights by Application
5.1 Overview
5.1.1 By Application – Global Connector Market Size, 2022 & 2035
5.1.2 Automotive and Transportation
5.1.3 Consumer Electronics
5.1.4 Computer and Peripherals
5.1.5 Industrial
5.1.6 Telecom/Datacom
5.1.7 Others
5.2 By Application – Global Connector Revenue & Forecasts
5.2.1 By Application – Global Connector Revenue, 2018-2023
5.2.2 By Application – Global Connector Revenue, 2024-2035
5.2.3 By Application – Global Connector Revenue Market Share, 2018-2035
6 Sights by Region
6.1 By Region – Global Connector Market Size, 2022 & 2035
6.2 By Region – Global Connector Revenue & Forecasts
6.2.1 By Region – Global Connector Revenue, 2018-2023
6.2.2 By Region – Global Connector Revenue, 2024-2035
6.2.3 By Region – Global Connector Revenue Market Share, 2018-2035
6.3 North America
6.3.1 By Country – North America Connector Revenue, 2018-2035
6.3.2 US Connector Market Size, 2018-2035
6.3.3 Canada Connector Market Size, 2018-2035
6.3.4 Mexico Connector Market Size, 2018-2035
6.4 Europe
6.4.1 By Country – Europe Connector Revenue, 2018-2035
6.4.2 Germany Connector Market Size, 2018-2035
6.4.3 France Connector Market Size, 2018-2035
6.4.4 U.K. Connector Market Size, 2018-2035
6.4.5 Italy Connector Market Size, 2018-2035
6.4.6 Russia Connector Market Size, 2018-2035
6.4.7 Nordic Countries Connector Market Size, 2018-2035
6.4.8 Benelux Connector Market Size, 2018-2035
6.5 Asia
6.5.1 By Region – Asia Connector Revenue, 2018-2035
6.5.2 China Connector Market Size, 2018-2035
6.5.3 Japan Connector Market Size, 2018-2035
6.5.4 South Korea Connector Market Size, 2018-2035
6.5.5 Southeast Asia Connector Market Size, 2018-2035
6.5.6 India Connector Market Size, 2018-2035
6.6 South America
6.6.1 By Country – South America Connector Revenue, 2018-2035
6.6.2 Brazil Connector Market Size, 2018-2035
6.6.3 Argentina Connector Market Size, 2018-2035
6.7 Middle East & Africa
6.7.1 By Country – Middle East & Africa Connector Revenue, 2018-2035
6.7.2 Turkey Connector Market Size, 2018-2035
6.7.3 Israel Connector Market Size, 2018-2035
6.7.4 Saudi Arabia Connector Market Size, 2018-2035
6.7.5 UAE Connector Market Size, 2018-2035
7 Connector Companies Profiles
7.1 Amphenol
7.1.1 Amphenol Company Summary
7.1.2 Amphenol Business Overview
7.1.3 Amphenol Connector Major Product Offerings
7.1.4 Amphenol Connector Revenue in Global Market (2018-2023)
7.1.5 Amphenol Key News & Latest Developments
7.2 Rosenberger
7.2.1 Rosenberger Company Summary
7.2.2 Rosenberger Business Overview
7.2.3 Rosenberger Connector Major Product Offerings
7.2.4 Rosenberger Connector Revenue in Global Market (2018-2023)
7.2.5 Rosenberger Key News & Latest Developments
7.3 CommScope
7.3.1 CommScope Company Summary
7.3.2 CommScope Business Overview
7.3.3 CommScope Connector Major Product Offerings
7.3.4 CommScope Connector Revenue in Global Market (2018-2023)
7.3.5 CommScope Key News & Latest Developments
7.4 DDK
7.4.1 DDK Company Summary
7.4.2 DDK Business Overview
7.4.3 DDK Connector Major Product Offerings
7.4.4 DDK Connector Revenue in Global Market (2018-2023)
7.4.5 DDK Key News & Latest Developments
7.5 L-com
7.5.1 L-com Company Summary
7.5.2 L-com Business Overview
7.5.3 L-com Connector Major Product Offerings
7.5.4 L-com Connector Revenue in Global Market (2018-2023)
7.5.5 L-com Key News & Latest Developments
7.6 Shireen
7.6.1 Shireen Company Summary
7.6.2 Shireen Business Overview
7.6.3 Shireen Connector Major Product Offerings
7.6.4 Shireen Connector Revenue in Global Market (2018-2023)
7.6.5 Shireen Key News & Latest Developments
7.7 Lumberg
7.7.1 Lumberg Company Summary
7.7.2 Lumberg Business Overview
7.7.3 Lumberg Connector Major Product Offerings
7.7.4 Lumberg Connector Revenue in Global Market (2018-2023)
7.7.5 Lumberg Key News & Latest Developments
7.8 Gemintek
7.8.1 Gemintek Company Summary
7.8.2 Gemintek Business Overview
7.8.3 Gemintek Connector Major Product Offerings
7.8.4 Gemintek Connector Revenue in Global Market (2018-2023)
7.8.5 Gemintek Key News & Latest Developments
7.9 SYSKIM
7.9.1 SYSKIM Company Summary
7.9.2 SYSKIM Business Overview
7.9.3 SYSKIM Connector Major Product Offerings
7.9.4 SYSKIM Connector Revenue in Global Market (2018-2023)
7.9.5 SYSKIM Key News & Latest Developments
7.10 DDK
7.10.1 DDK Company Summary
7.10.2 DDK Business Overview
7.10.3 DDK Connector Major Product Offerings
7.10.4 DDK Connector Revenue in Global Market (2018-2023)
7.10.5 DDK Key News & Latest Developments
7.11 L-com
7.11.1 L-com Company Summary
7.11.2 L-com Business Overview
7.11.3 L-com Connector Major Product Offerings
7.11.4 L-com Connector Revenue in Global Market (2018-2023)
7.11.5 L-com Key News & Latest Developments
7.12 XAHohor
7.12.1 XAHohor Company Summary
7.12.2 XAHohor Business Overview
7.12.3 XAHohor Connector Major Product Offerings
7.12.4 XAHohor Connector Revenue in Global Market (2018-2023)
7.12.5 XAHohor Key News & Latest Developments
7.13 SomeFly Technologies
7.13.1 SomeFly Technologies Company Summary
7.13.2 SomeFly Technologies Business Overview
7.13.3 SomeFly Technologies Connector Major Product Offerings
7.13.4 SomeFly Technologies Connector Revenue in Global Market (2018-2023)
7.13.5 SomeFly Technologies Key News & Latest Developments
7.14 Zeeteq
7.14.1 Zeeteq Company Summary
7.14.2 Zeeteq Business Overview
7.14.3 Zeeteq Connector Major Product Offerings
7.14.4 Zeeteq Connector Revenue in Global Market (2018-2023)
7.14.5 Zeeteq Key News & Latest Developments
8 Conclusion
9 Appendix
9.1 Note
9.2 Examples of Clients
9.3 DisclaimerList of Tables
Table 1. Connector Market Opportunities & Trends in Global Market
Table 2. Connector Market Drivers in Global Market
Table 3. Connector Market Restraints in Global Market
Table 4. Key Players of Connector in Global Market
Table 5. Top Connector Players in Global Market, Ranking by Revenue (2022)
Table 6. Global Connector Revenue by Companies, (US$, Mn), 2018-2023
Table 7. Global Connector Revenue Share by Companies, 2018-2023
Table 8. Global Companies Connector Product Type
Table 9. List of Global Tier 1 Connector Companies, Revenue (US$, Mn) in 2022 and Market Share
Table 10. List of Global Tier 2 and Tier 3 Connector Companies, Revenue (US$, Mn) in 2022 and Market Share
Table 11. By Type ? Global Connector Revenue, (US$, Mn), 2022 & 2035
Table 12. By Type – Connector Revenue in Global (US$, Mn), 2018-2023
Table 13. By Type – Connector Revenue in Global (US$, Mn), 2024-2035
Table 14. By Application ? Global Connector Revenue, (US$, Mn), 2022 & 2035
Table 15. By Application – Connector Revenue in Global (US$, Mn), 2018-2023
Table 16. By Application – Connector Revenue in Global (US$, Mn), 2024-2035
Table 17. By Region ? Global Connector Revenue, (US$, Mn), 2022 & 2035
Table 18. By Region – Global Connector Revenue (US$, Mn), 2018-2023
Table 19. By Region – Global Connector Revenue (US$, Mn), 2024-2035
Table 20. By Country – North America Connector Revenue, (US$, Mn), 2018-2023
Table 21. By Country – North America Connector Revenue, (US$, Mn), 2024-2035
Table 22. By Country – Europe Connector Revenue, (US$, Mn), 2018-2023
Table 23. By Country – Europe Connector Revenue, (US$, Mn), 2024-2035
Table 24. By Region – Asia Connector Revenue, (US$, Mn), 2018-2023
Table 25. By Region – Asia Connector Revenue, (US$, Mn), 2024-2035
Table 26. By Country – South America Connector Revenue, (US$, Mn), 2018-2023
Table 27. By Country – South America Connector Revenue, (US$, Mn), 2024-2035
Table 28. By Country – Middle East & Africa Connector Revenue, (US$, Mn), 2018-2023
Table 29. By Country – Middle East & Africa Connector Revenue, (US$, Mn), 2024-2035
Table 30. Amphenol Company Summary
Table 31. Amphenol Connector Product Offerings
Table 32. Amphenol Connector Revenue (US$, Mn) & (2018-2023)
Table 33. Amphenol Key News & Latest Developments
Table 34. Rosenberger Company Summary
Table 35. Rosenberger Connector Product Offerings
Table 36. Rosenberger Connector Revenue (US$, Mn) & (2018-2023)
Table 37. Rosenberger Key News & Latest Developments
Table 38. CommScope Company Summary
Table 39. CommScope Connector Product Offerings
Table 40. CommScope Connector Revenue (US$, Mn) & (2018-2023)
Table 41. CommScope Key News & Latest Developments
Table 42. DDK Company Summary
Table 43. DDK Connector Product Offerings
Table 44. DDK Connector Revenue (US$, Mn) & (2018-2023)
Table 45. DDK Key News & Latest Developments
Table 46. L-com Company Summary
Table 47. L-com Connector Product Offerings
Table 48. L-com Connector Revenue (US$, Mn) & (2018-2023)
Table 49. L-com Key News & Latest Developments
Table 50. Shireen Company Summary
Table 51. Shireen Connector Product Offerings
Table 52. Shireen Connector Revenue (US$, Mn) & (2018-2023)
Table 53. Shireen Key News & Latest Developments
Table 54. Lumberg Company Summary
Table 55. Lumberg Connector Product Offerings
Table 56. Lumberg Connector Revenue (US$, Mn) & (2018-2023)
Table 57. Lumberg Key News & Latest Developments
Table 58. Gemintek Company Summary
Table 59. Gemintek Connector Product Offerings
Table 60. Gemintek Connector Revenue (US$, Mn) & (2018-2023)
Table 61. Gemintek Key News & Latest Developments
Table 62. SYSKIM Company Summary
Table 63. SYSKIM Connector Product Offerings
Table 64. SYSKIM Connector Revenue (US$, Mn) & (2018-2023)
Table 65. SYSKIM Key News & Latest Developments
Table 66. DDK Company Summary
Table 67. DDK Connector Product Offerings
Table 68. DDK Connector Revenue (US$, Mn) & (2018-2023)
Table 69. DDK Key News & Latest Developments
Table 70. L-com Company Summary
Table 71. L-com Connector Product Offerings
Table 72. L-com Connector Revenue (US$, Mn) & (2018-2023)
Table 73. L-com Key News & Latest Developments
Table 74. XAHohor Company Summary
Table 75. XAHohor Connector Product Offerings
Table 76. XAHohor Connector Revenue (US$, Mn) & (2018-2023)
Table 77. XAHohor Key News & Latest Developments
Table 78. SomeFly Technologies Company Summary
Table 79. SomeFly Technologies Connector Product Offerings
Table 80. SomeFly Technologies Connector Revenue (US$, Mn) & (2018-2023)
Table 81. SomeFly Technologies Key News & Latest Developments
Table 82. Zeeteq Company Summary
Table 83. Zeeteq Connector Product Offerings
Table 84. Zeeteq Connector Revenue (US$, Mn) & (2018-2023)
Table 85. Zeeteq Key News & Latest Developments
List of Figures
Figure 1. Connector Segment by Type in 2022
Figure 2. Connector Segment by Application in 2022
Figure 3. Global Connector Market Overview: 2022
Figure 4. Key Caveats
Figure 5. Global Connector Market Size: 2022 VS 2035 (US$, Mn)
Figure 6. Global Connector Revenue, 2018-2035 (US$, Mn)
Figure 7. The Top 3 and 5 Players Market Share by Connector Revenue in 2022
Figure 8. By Type – Global Connector Revenue Market Share, 2018-2035
Figure 9. By Application – Global Connector Revenue Market Share, 2018-2035
Figure 10. By Type – Global Connector Revenue, (US$, Mn), 2022 & 2035
Figure 11. By Type – Global Connector Revenue Market Share, 2018-2035
Figure 12. By Application – Global Connector Revenue, (US$, Mn), 2022 & 2035
Figure 13. By Application – Global Connector Revenue Market Share, 2018-2035
Figure 14. By Region – Global Connector Revenue Market Share, 2018-2035
Figure 15. By Country – North America Connector Revenue Market Share, 2018-2035
Figure 16. US Connector Revenue, (US$, Mn), 2018-2035
Figure 17. Canada Connector Revenue, (US$, Mn), 2018-2035
Figure 18. Mexico Connector Revenue, (US$, Mn), 2018-2035
Figure 19. By Country – Europe Connector Revenue Market Share, 2018-2035
Figure 20. Germany Connector Revenue, (US$, Mn), 2018-2035
Figure 21. France Connector Revenue, (US$, Mn), 2018-2035
Figure 22. U.K. Connector Revenue, (US$, Mn), 2018-2035
Figure 23. Italy Connector Revenue, (US$, Mn), 2018-2035
Figure 24. Russia Connector Revenue, (US$, Mn), 2018-2035
Figure 25. Nordic Countries Connector Revenue, (US$, Mn), 2018-2035
Figure 26. Benelux Connector Revenue, (US$, Mn), 2018-2035
Figure 27. By Region – Asia Connector Revenue Market Share, 2018-2035
Figure 28. China Connector Revenue, (US$, Mn), 2018-2035
Figure 29. Japan Connector Revenue, (US$, Mn), 2018-2035
Figure 30. South Korea Connector Revenue, (US$, Mn), 2018-2035
Figure 31. Southeast Asia Connector Revenue, (US$, Mn), 2018-2035
Figure 32. India Connector Revenue, (US$, Mn), 2018-2035
Figure 33. By Country – South America Connector Revenue Market Share, 2018-2035
Figure 34. Brazil Connector Revenue, (US$, Mn), 2018-2035
Figure 35. Argentina Connector Revenue, (US$, Mn), 2018-2035
Figure 36. By Country – Middle East & Africa Connector Revenue Market Share, 2018-2035
Figure 37. Turkey Connector Revenue, (US$, Mn), 2018-2035
Figure 38. Israel Connector Revenue, (US$, Mn), 2018-2035
Figure 39. Saudi Arabia Connector Revenue, (US$, Mn), 2018-2035
Figure 40. UAE Connector Revenue, (US$, Mn), 2018-2035
Figure 41. Amphenol Connector Revenue Year Over Year Growth (US$, Mn) & (2018-2023)
Figure 42. Rosenberger Connector Revenue Year Over Year Growth (US$, Mn) & (2018-2023)
Figure 43. CommScope Connector Revenue Year Over Year Growth (US$, Mn) & (2018-2023)
Figure 44. DDK Connector Revenue Year Over Year Growth (US$, Mn) & (2018-2023)
Figure 45. L-com Connector Revenue Year Over Year Growth (US$, Mn) & (2018-2023)
Figure 46. Shireen Connector Revenue Year Over Year Growth (US$, Mn) & (2018-2023)
Figure 47. Lumberg Connector Revenue Year Over Year Growth (US$, Mn) & (2018-2023)
Figure 48. Gemintek Connector Revenue Year Over Year Growth (US$, Mn) & (2018-2023)
Figure 49. SYSKIM Connector Revenue Year Over Year Growth (US$, Mn) & (2018-2023)
Figure 50. DDK Connector Revenue Year Over Year Growth (US$, Mn) & (2018-2023)
Figure 51. L-com Connector Revenue Year Over Year Growth (US$, Mn) & (2018-2023)
Figure 52. XAHohor Connector Revenue Year Over Year Growth (US$, Mn) & (2018-2023)
Figure 53. SomeFly Technologies Connector Revenue Year Over Year Growth (US$, Mn) & (2018-2023)
Figure 54. Zeeteq Connector Revenue Year Over Year Growth (US$, Mn) & (2018-2023)

License

Excel Data Pack, PDF & Excel license, Corporate License

Download Sample Report

Table of Content

1 Introduction to Research & Analysis Reports
1.1 Connector Market Definition
1.2 Market Segments
1.2.1 Market by Type
1.2.2 Market by Application
1.3 Global Connector Market Overview
1.4 Features & Benefits of This Report
1.5 Methodology & Sources of Information
1.5.1 Research Methodology
1.5.2 Research Process
1.5.3 Base Year
1.5.4 Report Assumptions & Caveats
2 Global Connector Overall Market Size
2.1 Global Connector Market Size: 2022 VS 2035
2.2 Global Connector Market Size, Prospects & Forecasts: 2018-2035
2.3 Key Market Trends, Opportunity, Drivers and Restraints
2.3.1 Market Opportunities & Trends
2.3.2 Market Drivers
2.3.3 Market Restraints
3 Company Landscape
3.1 Top Connector Players in Global Market
3.2 Top Global Connector Companies Ranked by Revenue
3.3 Global Connector Revenue by Companies
3.4 Top 3 and Top 5 Connector Companies in Global Market, by Revenue in 2022
3.5 Global Companies Connector Product Type
3.6 Tier 1, Tier 2 and Tier 3 Connector Players in Global Market
3.6.1 List of Global Tier 1 Connector Companies
3.6.2 List of Global Tier 2 and Tier 3 Connector Companies
4 Market Sights by Product
4.1 Overview
4.1.1 By Type – Global Connector Market Size Markets, 2022 & 2035
4.1.2 Plug Connector
4.1.3 Socket Connector
4.2 By Type – Global Connector Revenue & Forecasts
4.2.1 By Type – Global Connector Revenue, 2018-2023
4.2.2 By Type – Global Connector Revenue, 2024-2035
4.2.3 By Type – Global Connector Revenue Market Share, 2018-2035
5 Sights by Application
5.1 Overview
5.1.1 By Application – Global Connector Market Size, 2022 & 2035
5.1.2 Automotive and Transportation
5.1.3 Consumer Electronics
5.1.4 Computer and Peripherals
5.1.5 Industrial
5.1.6 Telecom/Datacom
5.1.7 Others
5.2 By Application – Global Connector Revenue & Forecasts
5.2.1 By Application – Global Connector Revenue, 2018-2023
5.2.2 By Application – Global Connector Revenue, 2024-2035
5.2.3 By Application – Global Connector Revenue Market Share, 2018-2035
6 Sights by Region
6.1 By Region – Global Connector Market Size, 2022 & 2035
6.2 By Region – Global Connector Revenue & Forecasts
6.2.1 By Region – Global Connector Revenue, 2018-2023
6.2.2 By Region – Global Connector Revenue, 2024-2035
6.2.3 By Region – Global Connector Revenue Market Share, 2018-2035
6.3 North America
6.3.1 By Country – North America Connector Revenue, 2018-2035
6.3.2 US Connector Market Size, 2018-2035
6.3.3 Canada Connector Market Size, 2018-2035
6.3.4 Mexico Connector Market Size, 2018-2035
6.4 Europe
6.4.1 By Country – Europe Connector Revenue, 2018-2035
6.4.2 Germany Connector Market Size, 2018-2035
6.4.3 France Connector Market Size, 2018-2035
6.4.4 U.K. Connector Market Size, 2018-2035
6.4.5 Italy Connector Market Size, 2018-2035
6.4.6 Russia Connector Market Size, 2018-2035
6.4.7 Nordic Countries Connector Market Size, 2018-2035
6.4.8 Benelux Connector Market Size, 2018-2035
6.5 Asia
6.5.1 By Region – Asia Connector Revenue, 2018-2035
6.5.2 China Connector Market Size, 2018-2035
6.5.3 Japan Connector Market Size, 2018-2035
6.5.4 South Korea Connector Market Size, 2018-2035
6.5.5 Southeast Asia Connector Market Size, 2018-2035
6.5.6 India Connector Market Size, 2018-2035
6.6 South America
6.6.1 By Country – South America Connector Revenue, 2018-2035
6.6.2 Brazil Connector Market Size, 2018-2035
6.6.3 Argentina Connector Market Size, 2018-2035
6.7 Middle East & Africa
6.7.1 By Country – Middle East & Africa Connector Revenue, 2018-2035
6.7.2 Turkey Connector Market Size, 2018-2035
6.7.3 Israel Connector Market Size, 2018-2035
6.7.4 Saudi Arabia Connector Market Size, 2018-2035
6.7.5 UAE Connector Market Size, 2018-2035
7 Connector Companies Profiles
7.1 Amphenol
7.1.1 Amphenol Company Summary
7.1.2 Amphenol Business Overview
7.1.3 Amphenol Connector Major Product Offerings
7.1.4 Amphenol Connector Revenue in Global Market (2018-2023)
7.1.5 Amphenol Key News & Latest Developments
7.2 Rosenberger
7.2.1 Rosenberger Company Summary
7.2.2 Rosenberger Business Overview
7.2.3 Rosenberger Connector Major Product Offerings
7.2.4 Rosenberger Connector Revenue in Global Market (2018-2023)
7.2.5 Rosenberger Key News & Latest Developments
7.3 CommScope
7.3.1 CommScope Company Summary
7.3.2 CommScope Business Overview
7.3.3 CommScope Connector Major Product Offerings
7.3.4 CommScope Connector Revenue in Global Market (2018-2023)
7.3.5 CommScope Key News & Latest Developments
7.4 DDK
7.4.1 DDK Company Summary
7.4.2 DDK Business Overview
7.4.3 DDK Connector Major Product Offerings
7.4.4 DDK Connector Revenue in Global Market (2018-2023)
7.4.5 DDK Key News & Latest Developments
7.5 L-com
7.5.1 L-com Company Summary
7.5.2 L-com Business Overview
7.5.3 L-com Connector Major Product Offerings
7.5.4 L-com Connector Revenue in Global Market (2018-2023)
7.5.5 L-com Key News & Latest Developments
7.6 Shireen
7.6.1 Shireen Company Summary
7.6.2 Shireen Business Overview
7.6.3 Shireen Connector Major Product Offerings
7.6.4 Shireen Connector Revenue in Global Market (2018-2023)
7.6.5 Shireen Key News & Latest Developments
7.7 Lumberg
7.7.1 Lumberg Company Summary
7.7.2 Lumberg Business Overview
7.7.3 Lumberg Connector Major Product Offerings
7.7.4 Lumberg Connector Revenue in Global Market (2018-2023)
7.7.5 Lumberg Key News & Latest Developments
7.8 Gemintek
7.8.1 Gemintek Company Summary
7.8.2 Gemintek Business Overview
7.8.3 Gemintek Connector Major Product Offerings
7.8.4 Gemintek Connector Revenue in Global Market (2018-2023)
7.8.5 Gemintek Key News & Latest Developments
7.9 SYSKIM
7.9.1 SYSKIM Company Summary
7.9.2 SYSKIM Business Overview
7.9.3 SYSKIM Connector Major Product Offerings
7.9.4 SYSKIM Connector Revenue in Global Market (2018-2023)
7.9.5 SYSKIM Key News & Latest Developments
7.10 DDK
7.10.1 DDK Company Summary
7.10.2 DDK Business Overview
7.10.3 DDK Connector Major Product Offerings
7.10.4 DDK Connector Revenue in Global Market (2018-2023)
7.10.5 DDK Key News & Latest Developments
7.11 L-com
7.11.1 L-com Company Summary
7.11.2 L-com Business Overview
7.11.3 L-com Connector Major Product Offerings
7.11.4 L-com Connector Revenue in Global Market (2018-2023)
7.11.5 L-com Key News & Latest Developments
7.12 XAHohor
7.12.1 XAHohor Company Summary
7.12.2 XAHohor Business Overview
7.12.3 XAHohor Connector Major Product Offerings
7.12.4 XAHohor Connector Revenue in Global Market (2018-2023)
7.12.5 XAHohor Key News & Latest Developments
7.13 SomeFly Technologies
7.13.1 SomeFly Technologies Company Summary
7.13.2 SomeFly Technologies Business Overview
7.13.3 SomeFly Technologies Connector Major Product Offerings
7.13.4 SomeFly Technologies Connector Revenue in Global Market (2018-2023)
7.13.5 SomeFly Technologies Key News & Latest Developments
7.14 Zeeteq
7.14.1 Zeeteq Company Summary
7.14.2 Zeeteq Business Overview
7.14.3 Zeeteq Connector Major Product Offerings
7.14.4 Zeeteq Connector Revenue in Global Market (2018-2023)
7.14.5 Zeeteq Key News & Latest Developments
8 Conclusion
9 Appendix
9.1 Note
9.2 Examples of Clients
9.3 DisclaimerList of Tables
Table 1. Connector Market Opportunities & Trends in Global Market
Table 2. Connector Market Drivers in Global Market
Table 3. Connector Market Restraints in Global Market
Table 4. Key Players of Connector in Global Market
Table 5. Top Connector Players in Global Market, Ranking by Revenue (2022)
Table 6. Global Connector Revenue by Companies, (US$, Mn), 2018-2023
Table 7. Global Connector Revenue Share by Companies, 2018-2023
Table 8. Global Companies Connector Product Type
Table 9. List of Global Tier 1 Connector Companies, Revenue (US$, Mn) in 2022 and Market Share
Table 10. List of Global Tier 2 and Tier 3 Connector Companies, Revenue (US$, Mn) in 2022 and Market Share
Table 11. By Type ? Global Connector Revenue, (US$, Mn), 2022 & 2035
Table 12. By Type – Connector Revenue in Global (US$, Mn), 2018-2023
Table 13. By Type – Connector Revenue in Global (US$, Mn), 2024-2035
Table 14. By Application ? Global Connector Revenue, (US$, Mn), 2022 & 2035
Table 15. By Application – Connector Revenue in Global (US$, Mn), 2018-2023
Table 16. By Application – Connector Revenue in Global (US$, Mn), 2024-2035
Table 17. By Region ? Global Connector Revenue, (US$, Mn), 2022 & 2035
Table 18. By Region – Global Connector Revenue (US$, Mn), 2018-2023
Table 19. By Region – Global Connector Revenue (US$, Mn), 2024-2035
Table 20. By Country – North America Connector Revenue, (US$, Mn), 2018-2023
Table 21. By Country – North America Connector Revenue, (US$, Mn), 2024-2035
Table 22. By Country – Europe Connector Revenue, (US$, Mn), 2018-2023
Table 23. By Country – Europe Connector Revenue, (US$, Mn), 2024-2035
Table 24. By Region – Asia Connector Revenue, (US$, Mn), 2018-2023
Table 25. By Region – Asia Connector Revenue, (US$, Mn), 2024-2035
Table 26. By Country – South America Connector Revenue, (US$, Mn), 2018-2023
Table 27. By Country – South America Connector Revenue, (US$, Mn), 2024-2035
Table 28. By Country – Middle East & Africa Connector Revenue, (US$, Mn), 2018-2023
Table 29. By Country – Middle East & Africa Connector Revenue, (US$, Mn), 2024-2035
Table 30. Amphenol Company Summary
Table 31. Amphenol Connector Product Offerings
Table 32. Amphenol Connector Revenue (US$, Mn) & (2018-2023)
Table 33. Amphenol Key News & Latest Developments
Table 34. Rosenberger Company Summary
Table 35. Rosenberger Connector Product Offerings
Table 36. Rosenberger Connector Revenue (US$, Mn) & (2018-2023)
Table 37. Rosenberger Key News & Latest Developments
Table 38. CommScope Company Summary
Table 39. CommScope Connector Product Offerings
Table 40. CommScope Connector Revenue (US$, Mn) & (2018-2023)
Table 41. CommScope Key News & Latest Developments
Table 42. DDK Company Summary
Table 43. DDK Connector Product Offerings
Table 44. DDK Connector Revenue (US$, Mn) & (2018-2023)
Table 45. DDK Key News & Latest Developments
Table 46. L-com Company Summary
Table 47. L-com Connector Product Offerings
Table 48. L-com Connector Revenue (US$, Mn) & (2018-2023)
Table 49. L-com Key News & Latest Developments
Table 50. Shireen Company Summary
Table 51. Shireen Connector Product Offerings
Table 52. Shireen Connector Revenue (US$, Mn) & (2018-2023)
Table 53. Shireen Key News & Latest Developments
Table 54. Lumberg Company Summary
Table 55. Lumberg Connector Product Offerings
Table 56. Lumberg Connector Revenue (US$, Mn) & (2018-2023)
Table 57. Lumberg Key News & Latest Developments
Table 58. Gemintek Company Summary
Table 59. Gemintek Connector Product Offerings
Table 60. Gemintek Connector Revenue (US$, Mn) & (2018-2023)
Table 61. Gemintek Key News & Latest Developments
Table 62. SYSKIM Company Summary
Table 63. SYSKIM Connector Product Offerings
Table 64. SYSKIM Connector Revenue (US$, Mn) & (2018-2023)
Table 65. SYSKIM Key News & Latest Developments
Table 66. DDK Company Summary
Table 67. DDK Connector Product Offerings
Table 68. DDK Connector Revenue (US$, Mn) & (2018-2023)
Table 69. DDK Key News & Latest Developments
Table 70. L-com Company Summary
Table 71. L-com Connector Product Offerings
Table 72. L-com Connector Revenue (US$, Mn) & (2018-2023)
Table 73. L-com Key News & Latest Developments
Table 74. XAHohor Company Summary
Table 75. XAHohor Connector Product Offerings
Table 76. XAHohor Connector Revenue (US$, Mn) & (2018-2023)
Table 77. XAHohor Key News & Latest Developments
Table 78. SomeFly Technologies Company Summary
Table 79. SomeFly Technologies Connector Product Offerings
Table 80. SomeFly Technologies Connector Revenue (US$, Mn) & (2018-2023)
Table 81. SomeFly Technologies Key News & Latest Developments
Table 82. Zeeteq Company Summary
Table 83. Zeeteq Connector Product Offerings
Table 84. Zeeteq Connector Revenue (US$, Mn) & (2018-2023)
Table 85. Zeeteq Key News & Latest Developments
List of Figures
Figure 1. Connector Segment by Type in 2022
Figure 2. Connector Segment by Application in 2022
Figure 3. Global Connector Market Overview: 2022
Figure 4. Key Caveats
Figure 5. Global Connector Market Size: 2022 VS 2035 (US$, Mn)
Figure 6. Global Connector Revenue, 2018-2035 (US$, Mn)
Figure 7. The Top 3 and 5 Players Market Share by Connector Revenue in 2022
Figure 8. By Type – Global Connector Revenue Market Share, 2018-2035
Figure 9. By Application – Global Connector Revenue Market Share, 2018-2035
Figure 10. By Type – Global Connector Revenue, (US$, Mn), 2022 & 2035
Figure 11. By Type – Global Connector Revenue Market Share, 2018-2035
Figure 12. By Application – Global Connector Revenue, (US$, Mn), 2022 & 2035
Figure 13. By Application – Global Connector Revenue Market Share, 2018-2035
Figure 14. By Region – Global Connector Revenue Market Share, 2018-2035
Figure 15. By Country – North America Connector Revenue Market Share, 2018-2035
Figure 16. US Connector Revenue, (US$, Mn), 2018-2035
Figure 17. Canada Connector Revenue, (US$, Mn), 2018-2035
Figure 18. Mexico Connector Revenue, (US$, Mn), 2018-2035
Figure 19. By Country – Europe Connector Revenue Market Share, 2018-2035
Figure 20. Germany Connector Revenue, (US$, Mn), 2018-2035
Figure 21. France Connector Revenue, (US$, Mn), 2018-2035
Figure 22. U.K. Connector Revenue, (US$, Mn), 2018-2035
Figure 23. Italy Connector Revenue, (US$, Mn), 2018-2035
Figure 24. Russia Connector Revenue, (US$, Mn), 2018-2035
Figure 25. Nordic Countries Connector Revenue, (US$, Mn), 2018-2035
Figure 26. Benelux Connector Revenue, (US$, Mn), 2018-2035
Figure 27. By Region – Asia Connector Revenue Market Share, 2018-2035
Figure 28. China Connector Revenue, (US$, Mn), 2018-2035
Figure 29. Japan Connector Revenue, (US$, Mn), 2018-2035
Figure 30. South Korea Connector Revenue, (US$, Mn), 2018-2035
Figure 31. Southeast Asia Connector Revenue, (US$, Mn), 2018-2035
Figure 32. India Connector Revenue, (US$, Mn), 2018-2035
Figure 33. By Country – South America Connector Revenue Market Share, 2018-2035
Figure 34. Brazil Connector Revenue, (US$, Mn), 2018-2035
Figure 35. Argentina Connector Revenue, (US$, Mn), 2018-2035
Figure 36. By Country – Middle East & Africa Connector Revenue Market Share, 2018-2035
Figure 37. Turkey Connector Revenue, (US$, Mn), 2018-2035
Figure 38. Israel Connector Revenue, (US$, Mn), 2018-2035
Figure 39. Saudi Arabia Connector Revenue, (US$, Mn), 2018-2035
Figure 40. UAE Connector Revenue, (US$, Mn), 2018-2035
Figure 41. Amphenol Connector Revenue Year Over Year Growth (US$, Mn) & (2018-2023)
Figure 42. Rosenberger Connector Revenue Year Over Year Growth (US$, Mn) & (2018-2023)
Figure 43. CommScope Connector Revenue Year Over Year Growth (US$, Mn) & (2018-2023)
Figure 44. DDK Connector Revenue Year Over Year Growth (US$, Mn) & (2018-2023)
Figure 45. L-com Connector Revenue Year Over Year Growth (US$, Mn) & (2018-2023)
Figure 46. Shireen Connector Revenue Year Over Year Growth (US$, Mn) & (2018-2023)
Figure 47. Lumberg Connector Revenue Year Over Year Growth (US$, Mn) & (2018-2023)
Figure 48. Gemintek Connector Revenue Year Over Year Growth (US$, Mn) & (2018-2023)
Figure 49. SYSKIM Connector Revenue Year Over Year Growth (US$, Mn) & (2018-2023)
Figure 50. DDK Connector Revenue Year Over Year Growth (US$, Mn) & (2018-2023)
Figure 51. L-com Connector Revenue Year Over Year Growth (US$, Mn) & (2018-2023)
Figure 52. XAHohor Connector Revenue Year Over Year Growth (US$, Mn) & (2018-2023)
Figure 53. SomeFly Technologies Connector Revenue Year Over Year Growth (US$, Mn) & (2018-2023)
Figure 54. Zeeteq Connector Revenue Year Over Year Growth (US$, Mn) & (2018-2023)

Customer Reviews

There are no reviews yet.

Be the first to review “Connector Market Size, Emerging Trends, Technological Advancements, and Business Strategies 2026-2034”

Your email address will not be published. Required fields are marked *