Key Statistics
High-power silicon photonics is moving from a specialist optical component category toward a critical layer of AI and cloud connectivity. The commercial requirement is rising bandwidth with lower energy consumption, tighter packaging and predictable optical performance. Silicon photonics answers that requirement by integrating optical functions with silicon-based electronics, while suppliers extend the platform through higher-speed modulators, lasers, photonic integrated circuits, optical engines and co-packaged architectures. The market therefore grows at the intersection of data-center network scaling, advanced packaging and power-efficiency constraints.
Key Takeaways
- EML chips are identified as the leading type in the report, while DFB and other silicon-photonic or laser-based architectures address different reach, wavelength and cost requirements.
- Data centers and high-speed communications form the largest application pathway, while AI/ML is the strongest structural source of incremental demand as accelerator and switch bandwidth rises toward 800G and 1.6T links.
- North America leads the market through hyperscale data-center design activity and established photonics suppliers; Asia-Pacific is the fastest structural growth region as optical manufacturing and AI infrastructure expand together.
- The core growth driver is the migration to higher optical lane rates and lower power-per-bit; the key restraints are development cost, specialized engineering requirements, packaging complexity and the need to qualify optics as part of a complete networking platform.
- Competition is shifting toward vertically integrated optical engines and co-packaged optics, where silicon photonics, DSP/SerDes, lasers, packaging and testing are combined to reduce link power, loss and integration risk.
High Power Silicon Photonics (SiPh) Chip Market Overview
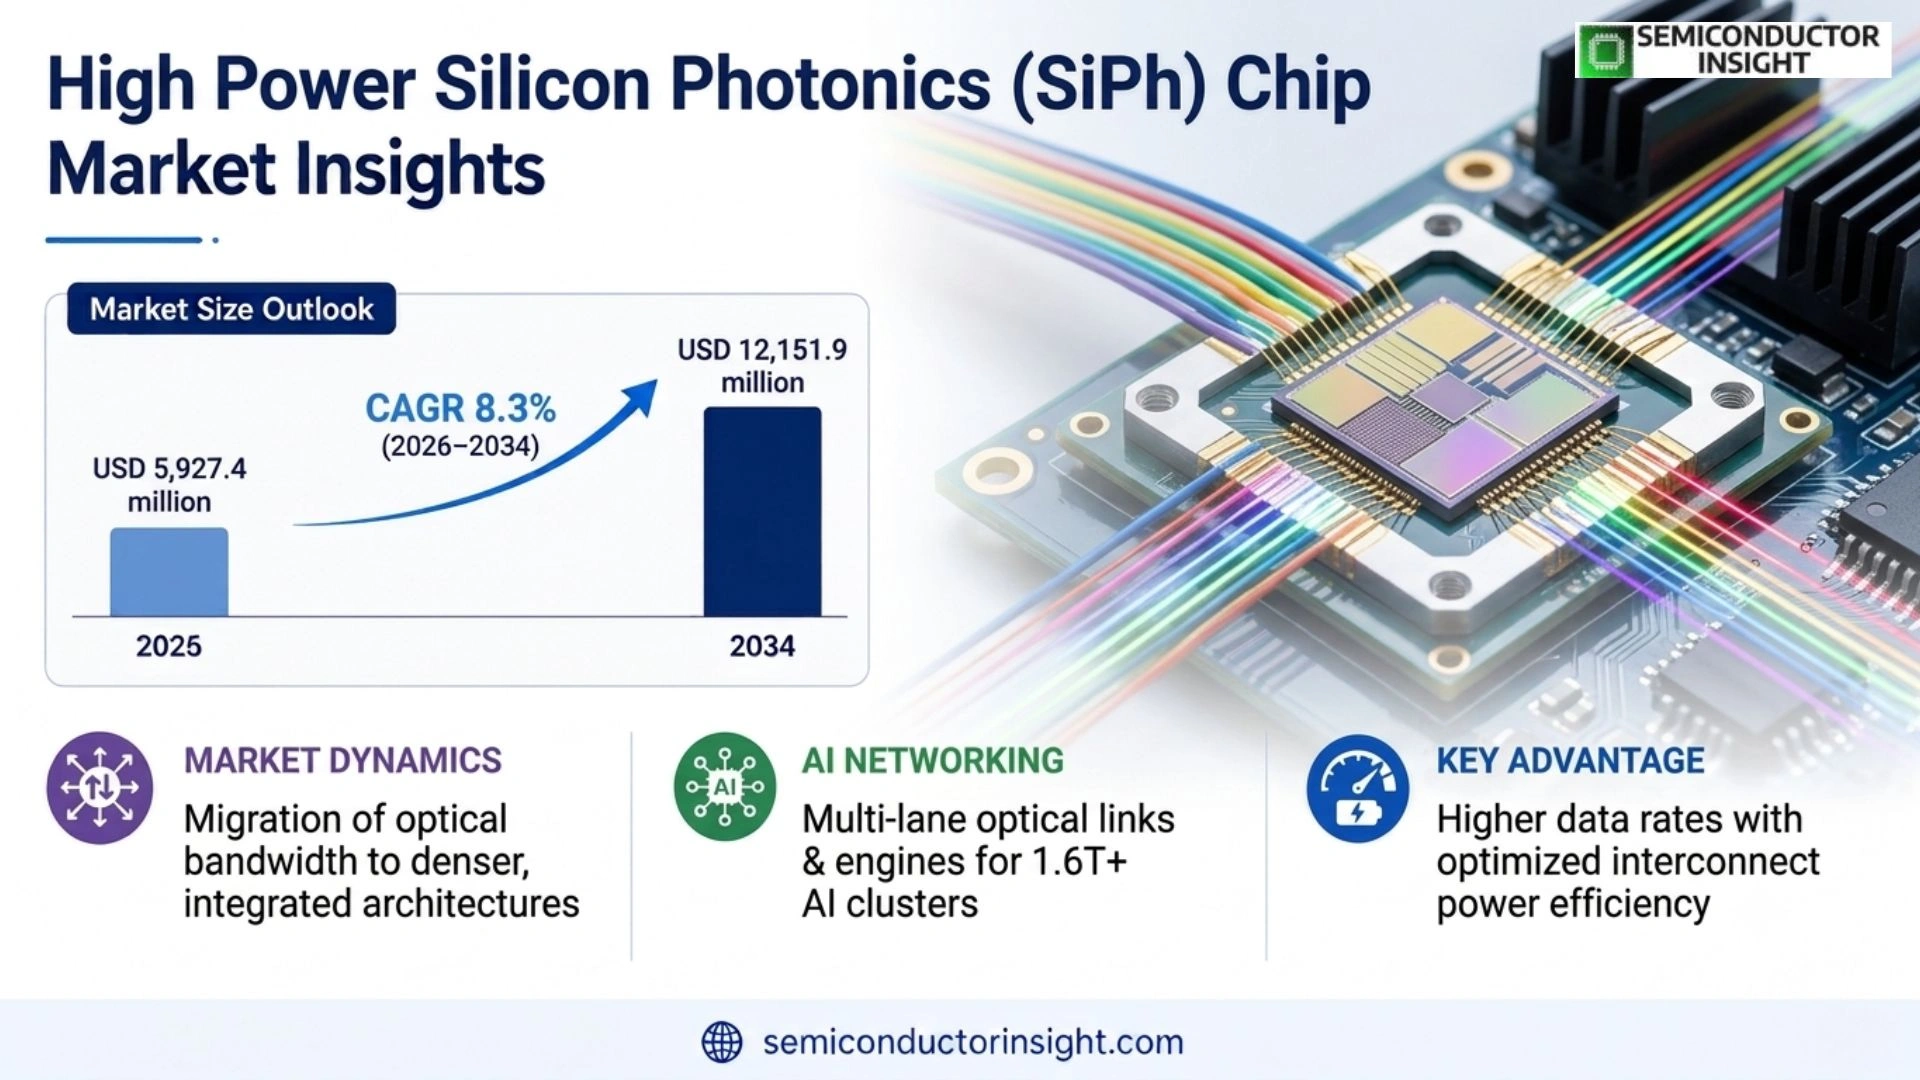
high power silicon photonics (SiPh) chip market was valued at USD 5,473 million in 2024 and was reported at USD 10,360 million for 2032. Rebasing those published anchors to the requested 2025–2034 window gives a 2025 market size of USD 5,927.4 million, a 2034 value of USD 12,151.9 million and an 8.3% CAGR for 2026–2034. The scope covers high-power silicon-photonics chips serving data-center interconnects, high-speed communications, high-performance computing and artificial-intelligence workloads.
Silicon photonics combines optical waveguides, modulators, detectors and laser-related functions with silicon-based electronics to move data with higher bandwidth and lower energy overhead than long electrical links at comparable system scale. The high-power segment becomes commercially important when optical sources and transmit paths must support higher launch power, longer reach or dense optical engines. Buyers evaluate the whole link, including insertion loss, modulation efficiency, thermal behavior, coupling, reliability, package footprint and interoperability with DSP and switch architectures.
The architecture is not limited to a single chip. A commercial optical path can include a photonic integrated circuit, laser source, driver, transimpedance amplifier, DSP or SerDes, fiber coupling structure and a package that maintains optical alignment under temperature cycling. Intel reports more than 8 million shipped photonic integrated circuits with more than 32 million integrated on-chip lasers and supports 400G, 800G and 1.6T solutions. Marvell has demonstrated a 1.6T silicon-photonics light engine carrying 200 Gbps per lane, while Broadcom is integrating optical engines directly with high-radix switch silicon.
The market is changing now as AI clusters push more data between accelerators, switches and storage systems. Electrical I/O faces increasing power and signal-integrity constraints, making optics attractive deeper inside the network and potentially closer to compute packages. Coherent demonstrated a silicon-photonics 1.6T-DR8 module with eight 200G optical and electrical interfaces in 2025, while Broadcom describes CPO as an approach that can deliver more than 3.5x power-consumption savings and more than 1 Tbps/mm bandwidth density. These developments convert photonics from a connectivity component into a system-architecture lever.
Segment Analysis: By Type
The market is segmented into EML Chips, DFB Chips and Others. EML technology combines efficient high-speed modulation with laser output in a structure suited to demanding datacom and telecom links, while DFB architectures provide a mature laser platform used across optical communications. The Other category includes VCSEL-based chips and silicon modulators, creating a broad innovation layer that can address short-reach, multi-lane and integrated photonic designs where power, cost and packaging are decisive.
| Type | Demand and Commercial Characteristics | Position |
|---|---|---|
| EML Chips | EML is identified as the leading type in the report. Demand is tied to high-speed optical transmitters that require controlled modulation, high bandwidth and reliable optical output. Suppliers compete on modulation efficiency, wavelength stability, thermal behavior, coupling and integration with 800G and 1.6T module architectures. Coherent’s 200G-per-lane work and its 400G D-EML demonstration illustrate how the EML roadmap is being extended as data-center lane rates rise. | Largest |
| DFB Chips | DFB chips remain important where stable laser output, wavelength control and established optical-module manufacturing are priorities. The commercial buying trigger can be telecom reach, datacom reach or a cost-sensitive optical engine where the laser need not be integrated with the same architecture as an EML. Suppliers compete through wavelength performance, power efficiency, temperature stability, packaging and the ability to scale across multiple module designs. | Established |
| Others | Other solutions include VCSEL-based chips, silicon modulators and hybrid photonic architectures. This segment is commercially important where customers want shorter reach, lower cost, smaller footprint or deeper integration with silicon electronics. Broadcom’s 200G-per-lane VCSEL driver work and Intel’s on-chip laser and silicon-photonics platform show how the boundary between laser, modulator and photonic integrated circuit functions is becoming more integrated. | Innovation-led |
Secondary technology lenses: power output and manufacturing process
The report also segments the market by power output into Low Power (≤ 10 mW), Medium Power (10–50 mW) and High Power (≥ 50 mW), and by manufacturing process into Monolithic Integration, Hybrid Integration and Others. These axes matter commercially. High-power devices are relevant when reach, coupling loss or optical engine architecture requires more optical budget, while hybrid integration can combine specialized lasers or materials with silicon photonics to achieve performance that a strictly monolithic process may not deliver. The choice affects fab access, packaging complexity, thermal management and cost.
Segment Analysis: By Application
| Application | Demand Characteristics and Purchasing Trigger |
|---|---|
| Data Centers and High-speed Communications | The purchasing trigger is rising switch and transceiver bandwidth combined with strict energy budgets. Cloud operators and networking vendors need optical links that can scale from 400G to 800G and 1.6T without a proportional rise in power. Suppliers respond with higher-lane-rate photonic engines, advanced DSP interfaces and packaging that improves thermal and optical performance. Intel, Broadcom, Coherent and Cisco all demonstrate how silicon photonics is being integrated into mainstream data-center connectivity platforms. |
| High-performance Computing (HPC) | HPC systems require low-latency, high-bandwidth movement among processors, memory and interconnect fabrics. Optical I/O becomes more attractive as copper reach and power limits constrain topology choices. Suppliers therefore develop compact photonic engines, optical I/O chiplets and co-packaged architectures. Intel’s optical compute interconnect work demonstrates the shift from pluggable transceivers toward optical links closer to compute silicon, expanding the addressable market for photonic integrated circuits and high-power optical sources. |
| Artificial Intelligence and Machine Learning | AI clusters create a particularly strong demand trigger: accelerator counts, switch radix and east-west traffic are increasing simultaneously. Photonics responds by increasing lane speed and reducing energy per bit, while CPO and LPO architectures move the optical function closer to the switch or accelerator. Marvell’s 1.6T light engine and Broadcom’s 102.4-Tbps CPO switch show how silicon-photonics components are becoming embedded in AI-network architectures rather than remaining separate optical modules. |
| Others | Other applications include telecom, optical circuit switching, sensing and emerging photonic computing or quantum systems. These segments value combinations of optical power, wavelength stability, integration and reliability rather than data-center bandwidth alone. Suppliers can use these applications to diversify beyond hyperscale buyers, although qualification cycles can be long and device specifications can vary significantly. The commercial opportunity is strongest where a common photonic platform can be adapted across multiple end markets without duplicating high-cost process development. |
Regional Analysis
North America leads the high-power SiPh market through the concentration of hyperscale data-center customers, networking semiconductor companies and photonics specialists. Asia-Pacific is the fastest structural growth region as optical manufacturing, AI infrastructure and advanced electronics production expand across China, Japan and other markets. Europe contributes strong photonics engineering, precision manufacturing and research capabilities, while South America and the Middle East & Africa remain smaller but can grow through telecom modernization, data-center builds, industrial connectivity and specialist optical applications.
| Region | Commercial Position | Why the Region Behaves Differently | Evidence / Market Instance | Growth Outlook |
|---|---|---|---|---|
| North America | Largest demand and platform development base | The region contains major cloud, switch and semiconductor developers that can define optical architectures and qualify large volumes. Suppliers gain leverage from close access to system architects and advanced packaging ecosystems. The market therefore rewards integration depth, high-speed product roadmaps and rapid co-development more than commodity optical-component scale alone. | Intel has shipped more than 8 million photonic integrated circuits and is developing 200G-per-lane platforms; Broadcom integrates silicon photonics into CPO systems and AI-network switches. | Largest / high |
| Asia-Pacific | Fastest structural growth | Asia-Pacific combines optical-component manufacturing, electronics assembly, telecom infrastructure and rapidly expanding AI/data-center capacity. Japan adds mature photonics engineering and laser expertise, while China and other markets strengthen optical-module production and domestic supply chains. This ecosystem makes scale manufacturing and cost-down particularly important alongside technology differentiation. | ROHM and other Japanese electronics suppliers illustrate regional engineering depth, while major optical vendors operate across U.S.-Asia manufacturing networks and supply the region’s datacom demand. | Fastest |
| Europe | Precision and photonics engineering center | Europe’s strength lies in photonics research, specialty manufacturing and long-established optical communications expertise. Suppliers compete through precision optics, laser technology, packaging and high-reliability components. The commercial mechanism is innovation and specialization rather than raw module volume, giving European companies an important position in advanced components even when hyperscale system demand is concentrated elsewhere. | Coherent’s European and U.S. development footprint and the region’s established photonics ecosystem support 800G, 1.6T and specialized optical applications. | High |
| South America | Telecom and data-center expansion market | The region’s opportunity is tied to communications infrastructure, enterprise data centers and gradual cloud modernization. Most high-end photonic chips are imported, so suppliers depend on module integrators and network equipment vendors. Commercial success therefore hinges on interoperability, stable supply and support rather than local photonic-fab presence, making channel partnerships particularly important. | Telecom operators and data-center builders create demand for higher-speed optical modules as network capacity rises, increasing the downstream need for 400G, 800G and eventually 1.6T architectures. | Medium |
| Middle East & Africa | Data-center, telecom and specialist growth | Regional demand is shaped by new data-center investment, telecom modernization and connectivity requirements over long distances. Buyers prioritize power efficiency, thermal reliability and vendor support, especially in dense facilities and hot climates. Silicon photonics can gain share when its optical power budget and package efficiency reduce system cooling or simplify scaling, but qualification and local service remain key procurement gates. | New cloud and data-center infrastructure increases the need for high-speed optical connectivity, while specialist photonics suppliers can address long-reach and high-temperature operating requirements. | Medium-high |
Detailed Regional Blocks
Why does North America lead high-power SiPh demand?
North America’s leadership is anchored in the proximity of hyperscale data-center operators to switch-ASIC designers, optical-DSP vendors and photonics manufacturers. That creates a fast feedback loop from network architecture to optical component specification. Intel’s volume-proven photonic platform, Broadcom’s CPO development and Cisco’s 800G-to-1.6T optics roadmap all demonstrate a market where system architects can directly pull photonic integration into the networking stack.
| Country | Position | Demand Mechanism |
|---|---|---|
| United States | Largest system and technology hub | The U.S. combines hyperscale customers with Intel, Broadcom, Cisco, Marvell and other photonics and networking developers. This makes the country central to optical architecture qualification and the migration toward 800G, 1.6T and CPO. |
| Canada | Research and network ecosystem | Canada adds photonics research, telecom expertise and data-center demand. Suppliers benefit from strong interoperability and reliability evidence, with commercial routes generally tied to system integrators and network-equipment vendors rather than local high-volume photonic fabs. |
| Mexico | Manufacturing and data-center route | Mexico’s electronics manufacturing base and its position in the North American industrial supply chain provide a downstream route for optical modules and networking equipment. Cost, standardization and dependable supply are important for production-oriented customers. |
Market instances
- 2024 — Intel demonstrated a fully integrated optical I/O chiplet supporting 64 channels of 32 Gbps in each direction over up to 100 meters and described next-generation 200G-per-lane PICs for 800G and 1.6T applications. The development moves silicon photonics closer to compute packaging and expands the addressable market beyond conventional pluggable modules.
- 2025 — Broadcom showcased CPO systems with more than 3.5x power-consumption savings, 40% lower optics cost per bit and more than 1 Tbps/mm bandwidth density on its published platform description. These figures show how integration can create measurable system benefits that influence switch architecture decisions.
- 2025 — Cisco described silicon photonics as supporting 800 Gbps optics today and 1.6 Tbps optics tomorrow, emphasizing reliability, scalability and signal integrity for AI clusters. The market impact is stronger demand for photonic components that can qualify across multiple networking platforms rather than a single proprietary system.
The regional implication is specific to North America: suppliers should align photonic product roadmaps, application engineering, module qualification and distribution with the region’s dominant purchase mechanism. The block distinguishes system-architecture leadership, manufacturing scale, precision technology, project procurement and emerging downstream demand, rather than treating all regional growth as the same phenomenon. That differentiation is commercially important in a market where a photonic chip may be designed in one country, fabricated in another, packaged in a third and deployed inside a global networking platform.
How is the Asia-Pacific supply ecosystem changing the SiPh opportunity?
Asia-Pacific’s advantage is its combination of electronics manufacturing, optical-module assembly, telecommunications infrastructure and rising AI compute demand. Japan contributes specialized photonics and laser engineering, while broader Asian manufacturing ecosystems support cost-sensitive scaling. This structure favors suppliers that can move quickly from photonic IC design into high-volume module production while maintaining the optical alignment and yield needed for 800G and 1.6T platforms.
| Country | Position | Demand Mechanism |
|---|---|---|
| Japan | Photonics engineering center | Japan contributes laser, optical and semiconductor expertise to the region’s supply chain. Companies such as Furukawa Electric, Sumitomo Electric and NTT Electronics support specialized optical technologies that can feed high-speed datacom and telecom products. |
| China | Large manufacturing and demand base | China combines optical-module manufacturing, telecom demand and expanding AI infrastructure. The commercial opportunity favors scalable photonic components that can be integrated into large module production runs while maintaining performance and cost discipline. |
| South Korea | AI and electronics infrastructure market | South Korea’s semiconductor, electronics and data-center ecosystem creates demand for dense optical interconnects. Supplier access depends on high-speed qualification, package integration and the ability to meet OEM reliability and thermal requirements. |
Market instances
- 2025 — Coherent’s 1.6T silicon-photonics transceiver demonstration used eight 200 Gbps optical and electrical interfaces with a 3 nm DSP in one module. The development shows how Asia-linked photonics manufacturing and global AI-network demand are converging around 200G-per-lane architectures.
- 2024–2025 — Broadcom continued expanding optical technologies around 200G-per-lane DSPs and 800G/1.6T architectures. The market effect is a shift toward photonic components designed for multi-lane scaling, raising demand for laser, modulator, packaging and optical-engine supply across Asian manufacturing networks.
- 2025 — Coherent introduced quad-channel ICs for silicon-photonics Mach-Zehnder modulators in 800G and 1.6T pluggables. Such IC-level integration reduces the number of separate building blocks required in optical modules and increases the value captured by suppliers able to combine photonics with high-speed electronics.
The regional implication is specific to Asia-Pacific: suppliers should align photonic product roadmaps, application engineering, module qualification and distribution with the region’s dominant purchase mechanism. The block distinguishes system-architecture leadership, manufacturing scale, precision technology, project procurement and emerging downstream demand, rather than treating all regional growth as the same phenomenon. That differentiation is commercially important in a market where a photonic chip may be designed in one country, fabricated in another, packaged in a third and deployed inside a global networking platform.
What role does Europe play in the SiPh value chain?
Europe’s strongest position is in specialty optical technology, precision manufacturing, research and high-reliability components. The commercial advantage is not simply module volume; it is the ability to engineer difficult optical functions, advanced lasers, coupling systems and photonic subassemblies. This makes Europe a critical source of technology that can be integrated into global networking products even when final system demand is concentrated in North America or Asia-Pacific.
| Country | Position | Demand Mechanism |
|---|---|---|
| Germany | Precision semiconductor and optical market | Germany’s engineering base supports advanced photonics, industrial optics and high-reliability communications systems. Suppliers can win through precision manufacturing, component qualification and advanced optical-electronic integration. |
| France | Research and photonics specialization | France contributes photonics research, specialized optical component development and engineering talent. Its role is strongest in technology differentiation and advanced component development that can feed global networking products. |
| United Kingdom | Optical communications and research | The U.K. has a strong photonics research and telecom heritage. Commercial demand is supported by data-center connectivity and communications equipment, with product differentiation centered on optical performance, integration and reliability. |
Market instances
- 2025 — Coherent introduced a quad-channel driver for silicon-photonics Mach-Zehnder modulators targeting 800G and 1.6T pluggable modules. The development demonstrates Europe’s photonics specialization at the interface between optical devices and high-speed electronics, a layer where technical differentiation can support premium positioning.
- 2025 — Coherent’s ECOC program included a 50 dB extinction-ratio wire-grid polarizer with 98.5% efficiency and a 2D lens array produced through glass molding. The developments extend the photonics value chain into optical coupling and polarization control, important to high-density datacom systems.
- 2025 — Coherent’s R&D program continued across 800G/1.6T transceivers, CPO, VCSELs, EMLs and silicon photonics. The market impact is increased demand for component interoperability and packaging precision as optical architectures become more integrated.
The regional implication is specific to Europe: suppliers should align photonic product roadmaps, application engineering, module qualification and distribution with the region’s dominant purchase mechanism. The block distinguishes system-architecture leadership, manufacturing scale, precision technology, project procurement and emerging downstream demand, rather than treating all regional growth as the same phenomenon. That differentiation is commercially important in a market where a photonic chip may be designed in one country, fabricated in another, packaged in a third and deployed inside a global networking platform.
Where will SiPh demand emerge first in South America?
Demand is likely to arrive through telecom upgrades, enterprise data centers and international connectivity. The region’s procurement model favors imported high-speed modules and optical engines, so suppliers need interoperable products and stable distribution. Customers are less likely to fund customized photonic development locally, increasing the value of standardized 800G and next-generation architectures that can be deployed through established networking platforms.
| Country | Position | Demand Mechanism |
|---|---|---|
| Brazil | Telecom and data-center demand | Brazil’s scale of telecom and enterprise infrastructure makes it the most important regional downstream market. Imported high-speed optical modules can gain adoption as networks scale toward 400G and 800G, provided suppliers maintain local support and interoperability. |
| Chile | International connectivity and data centers | Chile’s connectivity infrastructure and growing digital facilities create opportunities for high-speed optical components. Suppliers can enter through standardized module architectures where network operators prioritize capacity expansion and stable service. |
| Argentina | Enterprise and telecom modernization | Argentina presents selective demand through enterprise networks and telecom modernization. The main commercial requirement is reliable supply with standard optical interfaces, since customized local photonic production is not the core purchasing model. |
Market instances
- 2025 — Intel’s silicon-photonics platform continued to support 400G, 800G and 1.6T solutions. Standardized products at these data rates create an importable architecture for South American operators and data-center providers, reducing the need for region-specific photonic development.
- 2025 — Cisco’s optics validation work emphasized compatibility across Cisco and third-party platforms. The commercial significance for emerging markets is direct: interoperability can shorten qualification when operators upgrade networks using equipment from multiple vendors.
- 2025 — Broadcom’s CPO and high-speed optical portfolio increased the availability of high-bandwidth architectures suited to AI networking. The downstream implication is that regional data centers can adopt higher-speed networking through globally qualified modules instead of relying on local photonic manufacturing.
The regional implication is specific to South America: suppliers should align photonic product roadmaps, application engineering, module qualification and distribution with the region’s dominant purchase mechanism. The block distinguishes system-architecture leadership, manufacturing scale, precision technology, project procurement and emerging downstream demand, rather than treating all regional growth as the same phenomenon. That differentiation is commercially important in a market where a photonic chip may be designed in one country, fabricated in another, packaged in a third and deployed inside a global networking platform.
Why can high-power SiPh matter in Middle East & Africa?
The regional growth mechanism is infrastructure build-out rather than domestic photonic manufacturing. New data centers and network backbones need higher bandwidth without a proportional rise in power and thermal load. Silicon photonics can support that requirement through compact optical engines and integrated components. Commercial entry still depends on project certification, thermal validation and regional support, since customers typically buy complete connectivity solutions rather than bare photonic chips.
| Country | Position | Demand Mechanism |
|---|---|---|
| Saudi Arabia | Data-center and cloud infrastructure | Large-scale digital infrastructure projects increase the need for compact, energy-efficient optical connectivity. Suppliers with validated 800G and next-generation architectures can compete through system integrators and project procurement. |
| United Arab Emirates | Advanced data-center demand | The UAE’s data-center and cloud infrastructure supports demand for dense optical interconnects and high-speed modules. Power efficiency, thermal behavior and vendor support are important decision factors in high-density deployments. |
| South Africa | Network and data-center hub | South Africa’s role as a regional connectivity hub creates demand for high-capacity optical links. Imported photonic components are most likely to succeed through established network-equipment and data-center supply chains. |
Market instances
- 2025 — Broadcom highlighted CPO as an approach for reducing optical power and increasing bandwidth density in AI networks. Dense data-center environments in the region can benefit when optical integration lowers rack-level thermal and power burdens.
- 2025 — Cisco documented 800G-to-1.6T silicon-photonics roadmaps and comprehensive optics validation. The development supports project procurement where long-life network equipment must operate predictably across mixed optical components and high-temperature environments.
- 2025 — Marvell demonstrated a 1.6T silicon-photonics light engine supporting 200 Gbps per lane. The market impact is a broader supply of optical engines designed for rack-scale AI connectivity, creating new procurement opportunities as regional AI and cloud infrastructure expands.
The regional implication is specific to Middle East & Africa: suppliers should align photonic product roadmaps, application engineering, module qualification and distribution with the region’s dominant purchase mechanism. The block distinguishes system-architecture leadership, manufacturing scale, precision technology, project procurement and emerging downstream demand, rather than treating all regional growth as the same phenomenon. That differentiation is commercially important in a market where a photonic chip may be designed in one country, fabricated in another, packaged in a third and deployed inside a global networking platform.
Competitive Landscape
Competition in high-power silicon photonics is increasingly determined by the ability to integrate photonics, high-speed electronics and packaging while maintaining optical power, signal integrity and reliability at rising lane rates. Suppliers with proven production experience can convert their installed base into next-generation design wins, while specialists can differentiate through lasers, modulators, optical engines or coupling components. The market is therefore broadening from standalone optical chips to integrated platforms in which the photonic device is one element of a complete connectivity architecture.
A systems-and-silicon cluster includes Broadcom, Intel and Marvell, where optical functionality is increasingly tied to switch ASICs, DSPs or compute interconnects. Intel reports more than 8 million shipped photonic integrated circuits and more than 32 million integrated on-chip lasers, while Marvell demonstrated a 1.6T light engine containing a silicon photonics chip, linear driver and TIA in a single package. These approaches compete on power per bit, reach, integration and time to deployment, shifting value toward suppliers that can own more of the electrical-optical interface.
A photonics-and-module cluster includes Lumentum, Coherent, Source Photonics, Sumitomo Electric, NTT Electronics and Furukawa Electric, among others. These companies can differentiate through lasers, EMLs, photonic ICs, optical components and module architectures. Coherent’s 2025 portfolio included 1.6T silicon-photonics transceivers, 800G/1.6T drivers and advanced optical components, showing how suppliers are combining multiple building blocks. The competitive objective is to offer performance and reliability without allowing package complexity, thermal overhead or optical alignment costs to erode the system value proposition.
Key industry players
- Lumentum Holdings Inc. (U.S.)
- Coherent Corp. (II-VI Incorporated) (U.S.)
- Mitsubishi Electric Corporation (Japan)
- Source Photonics (U.S./China)
- Broadcom Inc. (U.S.)
- Sumitomo Electric Industries, Ltd. (Japan)
- Applied Optoelectronics, Inc. (U.S.)
- NTT Electronics Corporation (Japan)
- Furukawa Electric Co., Ltd. (Japan)
- Macom Technology Solutions (U.S.)
| Competitive Tier | Players | How Competition Works |
|---|---|---|
| Platform leaders | Intel; Broadcom; Coherent | These suppliers combine multiple layers of the optical stack, including photonic ICs, high-speed electronics, optical engines or CPO. Their position is reinforced by system-level roadmaps, established customer relationships and the ability to qualify an architecture from chip to transceiver or switch. Competition centers on throughput, power efficiency, reliability, package integration and the speed of moving from demonstration to production. |
| Optical specialists | Lumentum; Source Photonics; Sumitomo Electric; NTT Electronics; Furukawa Electric | Specialists compete through laser technology, photonic devices, optical subassemblies and module expertise. Their leverage is strongest where customers require specific wavelength, output-power, packaging or reliability characteristics. Technical depth and manufacturing scale can create differentiation even when the company does not control the full networking architecture, particularly when module and system vendors need qualified second sources. |
| Focused component innovators | Mitsubishi Electric; Applied Optoelectronics; Macom Technology Solutions | Focused suppliers target high-value device or component niches where optical power, modulation, coupling or integration creates a specific performance advantage. Their route to expansion is product differentiation followed by qualification with module and system companies. Success depends on maintaining reliable production, compatible interfaces and enough volume to support customer programs as optical data rates increase. |
The competitive battleground is also moving toward packaging and qualification. Broadcom’s published CPO architecture targets higher bandwidth density and lower power, Cisco emphasizes optics validation across platforms, and Coherent is developing 800G and 1.6T products that combine photonic and electronic building blocks. These examples show why chip performance alone is insufficient: a photonic supplier must deliver alignment stability, thermal control, monitorability and interoperability across the module or package. The companies best positioned to expand share are those that can reduce integration work for customers while keeping the optical path stable at higher lane rates.
Selected Operating and Market Evidence
| Metric | Value | Commercial Significance |
|---|---|---|
| Intel shipped PICs | >8 million | The shipment history provides evidence of high-volume silicon-photonics manufacturing maturity rather than a purely experimental platform. |
| Intel integrated on-chip lasers | >32 million | The laser count demonstrates the scale of wafer-integrated active photonics and supports the commercial case for high-volume optical connectivity. |
| Intel optical I/O prototype channels | 64 | The demonstrated architecture used 64 channels in each direction, illustrating the density possible when optical connectivity moves closer to compute. |
| Intel per-channel data rate, prototype | 32 Gbps | The prototype’s channel rate establishes a baseline from which the company is advancing toward 200G-per-lane photonic platforms. |
| Intel demonstrated fiber reach | 100 meters | The 100-meter reach shows how optical compute interconnect can address rack and data-center distances where electrical links become more power- and signal-constrained. |
| Intel current solution rates | 400G / 800G / 1.6T | The portfolio spans multiple optical generations, allowing customers to move toward higher bandwidth without abandoning a proven silicon-photonics manufacturing base. |
| Intel laser die-area reduction | >40% | Reducing die area can improve economics and integration density, making the photonic platform more scalable as optical engine complexity increases. |
| Intel laser/SOA power reduction | >15% | Lower active-device power improves the energy budget available to dense optical engines and AI-network architectures. |
| Broadcom CPO power saving | >3.5× | The company’s published comparison indicates the scale of optical power savings it targets by shortening the electrical path and integrating optics near switch silicon. |
| Broadcom optics cost per bit reduction | 40% lower | The stated cost-per-bit improvement connects CPO architecture with a direct economic incentive for high-bandwidth data-center deployment. |
| Broadcom CPO bandwidth density | >1 Tbps/mm | High bandwidth density can increase front-panel or package efficiency, creating a commercial route to denser switching architectures. |
| Broadcom CPO field test, 2025 | 1 million 400G-equivalent port device hours | The reliability milestone provides production-oriented evidence for CPO adoption in hyperscale AI-network environments. |
| Broadcom CPO optics power comparison | 65% lower | The field-test comparison strengthens the case that package-integrated silicon photonics can materially reduce optical power rather than only increase throughput. |
| Marvell light engine lane rate | 200 Gbps/lane | The 1.6T engine demonstrates the move toward 200G optical lanes and higher integration of photonic and electronic functions. |
| Marvell demonstrated light-engine capacity | 1.6T | The capacity is directly aligned with emerging AI-rack networking needs and increases demand for compact optical engines. |
| Marvell prior CPO light-engine demonstration | 6.4T | The 6.4T reference shows the direction toward multi-terabit optical engines and tighter co-packaged connectivity. |
| Coherent 1.6T module lane structure | 8 × 200G | Eight 200G optical and electrical interfaces illustrate the component density and synchronization required for 1.6T modules. |
| Coherent DSP node, 2025 | 3 nm | Smaller DSP process nodes can reduce electrical power and leave more system headroom for the optical interface and thermal budget. |
| Coherent claimed 1.6T DSP power reduction | >20% | The reduction links advanced DSP integration with lower module power, supporting the economics of 1.6T connectivity. |
| Coherent polarizer performance, 2025 | 50 dB / 98.5% | The combination of extinction ratio and efficiency illustrates how optical-component performance can affect signal integrity and insertion-loss budgets in high-speed modules. |
Production Capacity Analysis
Silicon-photonics capacity is constrained by more than wafer starts. Yield must be maintained across waveguide structures, modulators, detectors and laser integration, while packaging introduces another layer of coupling and thermal tolerances. The resulting capacity bottlenecks occur at process qualification, laser integration, optical packaging and high-speed test as often as at front-end wafers. Intel’s high-volume photonics platform and Broadcom, Marvell and Coherent’s push toward integrated engines show why manufacturing scale and packaging capability increasingly determine which architectures can move from demonstration to production.
| Capacity Layer | Constraint and Commercial Effect | Importance |
|---|---|---|
| Photonic wafer fabrication | Photonic ICs require specialized process control for waveguides, modulators, detectors and couplers. Intel’s platform uses wafer-scale laser arrays and reports more than 8 million PICs shipped, showing the importance of production maturity. Bottlenecks arise when a process must preserve optical performance and yield as feature density increases. | High |
| Laser and active-device integration | High-power optical systems depend on stable laser performance and efficient coupling into the photonic circuit. Integrated laser arrays reduce external component count but increase process and thermal complexity. Suppliers therefore invest in hybrid and wafer-scale approaches that preserve optical output while reducing assembly steps. | High |
| Optical packaging and coupling | Fiber attach, alignment, thermal stability and optical loss can dominate system yield even after the photonic wafer is qualified. High-density modules increase the number of optical paths and make coupling tolerance a manufacturing constraint. Advanced lens arrays, molded optics and package-integrated optical engines are responses to this bottleneck. | High |
| High-speed test and system qualification | 800G and 1.6T modules require electrical, optical and software-level validation across many lanes. The qualification burden increases when photonics is integrated directly with switch silicon or compute packages. Suppliers with automated test, mature firmware interfaces and established system-validation processes can ramp faster than component-only competitors. | Medium-high |
Market Dynamics
The central market dynamic is the migration of optical bandwidth from the edge of the data center toward denser and more tightly integrated architectures. As electrical I/O consumes more power and loses signal margin at higher data rates, customers respond with faster optical lanes, silicon photonics, linear-drive modules and co-packaged optics. Suppliers then move more functionality onto the same package, raising the value of photonic integration, optical engines, high-speed drivers and thermal design. Growth therefore depends on both data volume and the engineering economics of moving light closer to compute.
The 800G-to-1.6T transition is a concrete trigger. Intel supports 400G, 800G and 1.6T silicon-photonics solutions, Coherent demonstrated eight 200G lanes in a 1.6T module, and Broadcom’s 200G-per-lane DSP roadmap targets next-generation AI connectivity. These technologies raise throughput without requiring a proportional increase in fiber count, but they also tighten optical loss, thermal and signal-integrity requirements. The commercial opportunity therefore expands for suppliers that can improve efficiency while keeping module design and qualification manageable.
CPO and rack-scale optical engines create the second major dynamic. Broadcom’s CPO architecture puts optical engines next to switch ASICs, while Marvell’s 1.6T light engine integrates a silicon-photonics chip with driver and TIA functions. These structures can reduce electrical path length and power, but they also change manufacturing economics by coupling optical and electronic qualification. The market implication is deeper supplier collaboration with ASIC, packaging and system companies, creating larger contract value for partners able to control multiple layers of the interconnect.
Market Drivers
Driver impact assessment*
| Driver | Impact* | Commercial Mechanism |
|---|---|---|
| AI cluster bandwidth scaling | High | Higher accelerator and switch bandwidth raises demand for 800G, 1.6T and integrated optical connectivity. |
| Power-per-bit pressure | High | Optical links can reduce electrical interconnect burden, supporting lower energy consumption at growing data rates. |
| CPO and optical I/O integration | High | Moving optics closer to compute and switch silicon reduces path loss and opens a new class of optical-engine demand. |
| 200G-per-lane migration | Medium-high | Higher lane rates increase the value of advanced modulators, lasers, DSPs, drivers and high-speed test. |
| Hyperscale standardization | Medium-high | Common optical interfaces allow qualified photonic platforms to scale across multiple data-center generations and suppliers. |
AI networking and data movement
The customer requirement is more bandwidth among accelerators, switches and storage without allowing interconnect power to consume the performance budget. Silicon photonics responds with multi-lane optical links and increasingly integrated optical engines. Suppliers package photonic ICs with high-speed electronics and work with system vendors on qualification. The market implication is sustained demand for higher-power, higher-bandwidth photonic components as AI clusters scale beyond today’s 800G architectures toward 1.6T and integrated optical I/O.
Power efficiency at higher data rates
Higher SerDes and optical lane rates increase the electrical energy required to drive long traces and compensate for interconnect loss. Silicon photonics reduces the need for some electrical reach and can integrate modulation and detection on silicon. Suppliers respond with lower-power drivers, DSPs and optical engines. Broadcom’s CPO claims and Coherent’s lower-power 1.6T demonstration show how power efficiency has become a product specification, not simply an engineering preference.
CPO and optical compute interconnect
The industry requirement is shorter, higher-bandwidth paths between compute and networking silicon. CPO and optical I/O respond by placing photonics closer to ASICs or accelerators. Suppliers capture value through photonic packaging, optical engines and system co-design, while customers gain lower path loss and potentially lower power. The market implication is a shift from pluggable-only architectures toward package-level photonics, increasing the importance of advanced integration and qualification capabilities.
Higher lane speeds
Customers want fewer channels for more throughput while preserving reach and signal quality. 200G-per-lane technologies answer this requirement, supported by EMLs, silicon modulators, laser drivers and advanced DSPs. Suppliers that can synchronize optical and electrical interfaces can shorten module development and improve interoperability. The market implication is higher component content per optical module and stronger demand for photonic ICs designed around 800G and 1.6T standards.
Volume-proven silicon manufacturing
The requirement for lower cost at higher optical density favors processes that can reuse semiconductor manufacturing discipline. Intel reports a high-volume silicon-photonics platform with more than 8 million shipped PICs and more than 32 million integrated on-chip lasers. Suppliers respond by pushing wafer-scale laser integration, known-good-die testing and tighter photonic-electronic integration. The commercial implication is that scale manufacturing can turn silicon photonics from a specialty technology into a repeatable infrastructure component.
Market Restraints
Restraint impact assessment*
| Restraint | Impact* | Evidence-led Mechanism |
|---|---|---|
| High development and mask cost | High | Photonic IC development combines semiconductor processing with optical design, creating substantial non-recurring engineering and qualification expense. |
| Packaging and alignment complexity | High | Optical coupling, thermal expansion and fiber alignment can reduce yield and add cost even after the photonic wafer is proven. |
| Specialized engineering talent | Medium-high | Integrated photonics requires expertise spanning optics, electronics, fabrication and packaging, limiting the speed of ecosystem expansion. |
| Interoperability and qualification burden | Medium-high | Higher lane rates require coordinated electrical, optical, firmware and system validation across multiple vendors. |
| Alternative optical architectures | Medium | VCSEL, EML, DFB and conventional pluggables remain effective in different reach, power and cost windows, limiting universal SiPh substitution. |
Non-recurring engineering remains high
Silicon photonics requires coordinated investment across optical design, process development, packaging and high-speed testing. A design may need new masks, process tuning and coupling structures before entering production. Suppliers respond by reusing process platforms and selling multiple products from common manufacturing capabilities. The restraint remains important for startups and smaller component companies, which must reach customer qualification before the scale economics of a shared photonic platform become attractive.
Packaging can dominate yield
Optical coupling is less forgiving than many electronic interconnects. Fiber placement, lens alignment, thermal expansion and connector interfaces can introduce loss or reliability problems. Suppliers respond with wafer-level and molded optics, optical engines and more controlled packaging flows. Coherent’s lens-array and photonic-IC development demonstrates the increasing importance of the package. The market implication is that photonic suppliers with strong packaging capabilities can have a structural advantage even when multiple companies can fabricate comparable chips.
Skills are interdisciplinary
The industry needs engineers who understand optical waveguides, lasers, semiconductor processing, RF or high-speed electronics, packaging and system validation. Skills shortages can lengthen product cycles and constrain the number of teams able to move from prototype to production. Companies respond through internal training, partnerships and platform reuse. The commercial effect is a premium on mature organizations with established design libraries, process recipes and qualification infrastructure.
System qualification is becoming harder
At 800G and 1.6T, a component cannot be qualified solely by measuring optical output. Customers must validate lane-to-lane behavior, BER, thermal drift, firmware control, interoperability and system reliability. Suppliers respond by increasing automated test, monitoring and reference designs. The restraint favors vendors with system-level validation capabilities and can slow the entry of technically strong but unproven photonic components.
Competing optical technologies remain credible
Silicon photonics is not the only route to high-speed optical connectivity. EML, DFB and VCSEL platforms remain useful in specific distance, wavelength, cost and packaging windows, while conventional pluggables can retain operational advantages where serviceability is prioritized. Suppliers therefore need to demonstrate a system-level advantage rather than rely on the photonic label itself. The market implication is continued segmentation by application, reach and power budget.
Market Opportunities
1.6T pluggable expansion
North America and Asia-Pacific are the clearest commercial centers for 1.6T networking, driven by AI cluster bandwidth requirements. Beneficiaries include photonic IC, EML, DFB, driver, DSP and optical-engine suppliers that can deliver interoperable 200G-per-lane platforms. What changes is the component stack: higher lane rates raise the value of integrated photonics and low-power electronics. The commercial implication is greater content per module and a larger role for vendors able to qualify complete transmit and receive chains.
CPO and optical compute interconnect
CPO creates a new opportunity at the interface of switch silicon, photonics and advanced packaging. Broadcom and Intel demonstrate two routes: tightly integrated optical engines beside switch ASICs and optical I/O chiplets closer to compute. Beneficiaries include photonic packaging, lasers, modulators, coupling and test suppliers. What changes is the location of the optical function. The commercial implication is potentially larger system-level value per photonic assembly, paired with longer qualification cycles and deeper customer co-development.
High-power optical engines
High-power optical designs can address longer reaches and link budgets where lower-power solutions struggle. Suppliers that improve laser efficiency, coupling and thermal control can win premium applications in data-center interconnects, telecom and specialist links. What changes is the value proposition from raw throughput to throughput plus optical budget. The commercial implication is an expanding addressable market for integrated laser and SiPh platforms that can maintain stable performance under dense thermal conditions.
Optical integration for AI rack-scale systems
Rack-scale AI architectures increase demand for optical links closer to the compute fabric. Marvell’s 1.6T light engine shows how a compact package can combine silicon photonics with driver and TIA functions. Beneficiaries include optical-engine vendors, ASIC partners, packaging specialists and module makers. What changes is the architecture of the rack, with optics moving closer to processors. The commercial implication is a new generation of higher-value optical assemblies that compete on energy efficiency, latency and integration speed.
Supply Chain Analysis
| Flow | Process | Value Capture and Bottleneck |
|---|---|---|
| Stage 1 — Photonic wafer fabrication | Silicon wafer → waveguides → modulators → detectors → couplers | Value is captured through photonic process design, yield and the ability to reproduce optical characteristics across large wafers. Intel’s volume-proven PIC platform illustrates the benefit of established manufacturing. Bottlenecks include process compatibility with standard silicon fabs, optical loss, device uniformity and the cost of qualifying new photonic process nodes. |
| Stage 2 — Laser / active integration | Laser source → gain section → modulator → optical coupling | High-power optical performance depends on stable laser output and efficient coupling to the silicon-photonic circuit. Hybrid integration allows specialized active materials to be combined with silicon. Bottlenecks arise in laser yield, thermal management, wavelength stability and wafer-level testing, making active-device expertise a significant source of supplier differentiation. |
| Stage 3 — Optical engine and package | PIC + driver/TIA/DSP → fiber coupling → optical engine → module package | This stage captures value through integration and thermal design. Marvell’s 1.6T engine and Broadcom’s CPO approach show how more functions move into a compact assembly. Bottlenecks include fiber alignment, insertion loss, thermal expansion, electrical integrity and high-speed test, with package yield capable of limiting total module output. |
| Stage 4 — System integration | Optical module/engine → switch → AI rack/data-center network | The final value is created by network performance, power efficiency and reliability. Suppliers must demonstrate interoperability with switch silicon, system firmware and network management. Bottlenecks shift from component fabrication to system qualification and field validation, making reference designs and large-customer test programs important commercial assets. |
Recent Developments
Broadcom reported one million cumulative 400G-equivalent port device hours of flap-free CPO operation at Meta and said CPO reduced optics power by 65% in its test comparison. The significance is tied to the commercial decision: suppliers must translate the technical feature into a validated customer benefit while maintaining repeatable manufacturing, documented reliability and a credible production roadmap.
The result provides field-oriented evidence that CPO is moving beyond laboratory demonstrations into reliability-sensitive AI-network deployment, increasing the commercial credibility of package-integrated silicon photonics. The significance is tied to the commercial decision: suppliers must translate the technical feature into a validated customer benefit while maintaining repeatable manufacturing, documented reliability and a credible production roadmap.
Coherent announced a 4-channel driver for silicon-photonics Mach-Zehnder modulators designed for 800G and 1.6T pluggables. The development is commercially relevant as it connects a specific product or manufacturing milestone with a measurable change in power density, throughput, integration, qualification or supply-chain capability, which can influence customer design decisions and supplier positioning over the forecast period.
The development expands the open-market high-speed IC ecosystem around silicon photonics and helps module makers build 800G and 1.6T products with lower power and more integrated monitoring. The significance is tied to the commercial decision: suppliers must translate the technical feature into a validated customer benefit while maintaining repeatable manufacturing, documented reliability and a credible production roadmap.
Coherent demonstrated a silicon-photonics 1.6T-DR8 transceiver with 8×200G optical and electrical interfaces and a 3 nm DSP. The development is commercially relevant as it connects a specific product or manufacturing milestone with a measurable change in power density, throughput, integration, qualification or supply-chain capability, which can influence customer design decisions and supplier positioning over the forecast period.
The demonstration shows the commercial move toward 200G optical lanes and tighter photonic-electronic integration, raising the value of suppliers able to deliver low-power, high-speed optical engines. The significance is tied to the commercial decision: suppliers must translate the technical feature into a validated customer benefit while maintaining repeatable manufacturing, documented reliability and a credible production roadmap.
Marvell demonstrated a 1.6T silicon-photonics light engine with 200 Gbps per lane in an LPO module and referenced a 6.4T CPO light engine demonstration in 2024. The development is commercially relevant as it connects a specific product or manufacturing milestone with a measurable change in power density, throughput, integration, qualification or supply-chain capability, which can influence customer design decisions and supplier positioning over the forecast period.
The development links silicon photonics directly to rack-scale AI networking and expands the market opportunity for optical engines that combine photonics, drivers, TIA functions and control electronics in a compact package. The significance is tied to the commercial decision: suppliers must translate the technical feature into a validated customer benefit while maintaining repeatable manufacturing, documented reliability and a credible production roadmap.
Intel demonstrated a fully integrated optical compute interconnect chiplet and reported more than 8 million shipped PICs with more than 32 million integrated on-chip lasers, while developing 200G-per-lane products for 800G and 1.6T. The development is commercially relevant as it connects a specific product or manufacturing milestone with a measurable change in power density, throughput, integration, qualification or supply-chain capability, which can influence customer design decisions and supplier positioning over the forecast period.
The milestone connects a high-volume production history to next-generation optical I/O, strengthening the case for silicon photonics as a scalable manufacturing platform rather than a niche optical technology. The significance is tied to the commercial decision: suppliers must translate the technical feature into a validated customer benefit while maintaining repeatable manufacturing, documented reliability and a credible production roadmap.
Report Scope & Segmentation
| Attribute | Scope / Value |
|---|---|
| Market definition | High Power Silicon Photonics (SiPh) Chip market covering advanced integrated photonic chips and associated high-power optical functions used for high-speed connectivity and computing. |
| Target window | 2025 base year; 2026–2034 forecast period. |
| By Type | EML Chips; DFB Chips; Others, with source-page subtypes including C-band EML, L-band EML, VCSEL-based chips and silicon modulators. |
| By Application | Data Centers and High-speed Communications; High-performance Computing (HPC); Artificial Intelligence and Machine Learning; Others. |
| By Power Output | Low Power (≤ 10 mW); Medium Power (10–50 mW); High Power (≥ 50 mW). |
| By Manufacturing Process | Monolithic Integration; Hybrid Integration; Others. |
| Regions | North America; Europe; Asia-Pacific; South America; Middle East & Africa. |
| Profiled companies | Lumentum Holdings Inc. (U.S.), Coherent Corp. (II-VI Incorporated) (U.S.), Mitsubishi Electric Corporation (Japan), Source Photonics (U.S./China), Broadcom Inc. (U.S.), Sumitomo Electric Industries, Ltd. (Japan), Applied Optoelectronics, Inc. (U.S.), NTT Electronics Corporation (Japan), Furukawa Electric Co., Ltd. (Japan), Macom Technology Solutions (U.S.). |
| Published anchors | USD 5,473 million in 2024; USD 10,360 million in 2032; published page label 9.6% CAGR. The market is estimated at USD 5,927.4 million in 2025 and USD 12,151.9 million in 2034. |
Frequently Asked Questions
What is the 2025 market size?
The 2025 high-power silicon photonics chip market is USD 5,927.4 million. This value is derived from the published 2024 market size of USD 5,473 million and the 2032 forecast value of USD 10,360 million, using the compound growth factor implied by those two anchors and extending that series one year to the requested 2025 base.
What is the projected 2034 market size?
The projected 2034 market size is USD 12,151.9 million during the 2025–2034 forecast period. Extending the 2024-to-2032 relationship through 2034 produces a 2034 endpoint that supports the stated 2034 outlook and 8.3% CAGR for the forecast window. This endpoint is used consistently across the article so the headline market size, forecast discussion, scope table and FAQ remain aligned with one mathematical growth series.
What CAGR applies to 2026–2034?
The CAGR is 8.3% for 2026–2034. This rate reflects sustained expansion in high-bandwidth optical connectivity and the increasing use of silicon photonics in data-center and communications architectures. Demand growth is linked to higher lane speeds, optical engine integration and the need for lower power per transmitted bit as network capacity scales. This rate provides the growth outlook used to interpret demand, capacity requirements and supplier opportunities across the forecast window.
Which type is largest?
EML Chips are identified as the leading type in the source report. EML architecture is well suited to high-speed optical transmission where modulation efficiency, optical output and stable performance are important. Its position is reinforced by the migration of optical modules toward 800G and 1.6T designs with higher lane rates.
Which application leads demand?
Data Centers and High-speed Communications lead the application landscape. The demand trigger is the need to move increasing volumes of data across network switches and optical links while controlling power. AI and HPC reinforce this requirement by increasing accelerator and switch bandwidth, expanding the need for higher-rate optical interconnects. The application is commercially important as customers evaluate the device or optical architecture against total system efficiency, thermal load, qualification effort, reliability requirements and the cost of redesigning an installed platform.
Why are 800G and 1.6T important?
800G and 1.6T architectures increase the amount of data carried by each optical module and push vendors toward higher-speed lanes. Intel supports 800G and 1.6T silicon-photonics solutions, while Coherent has demonstrated 1.6T modules using 8×200G interfaces. These roadmaps increase the value of photonic integration and low-power optical engines. The development is commercially relevant as it connects a specific product or manufacturing milestone with a measurable change in power density, throughput, integration, qualification or supply-chain capability, which can influence customer design decisions and supplier positioning over the forecast period.
Which region leads the market?
North America leads the regional market in the report’s framing. Its advantage comes from the concentration of hyperscale data-center customers, networking-semiconductor companies and photonics developers. The region can therefore pull optical architectures directly into switch, compute and AI-network roadmaps and accelerate qualification of next-generation photonic solutions. This regional position is interpreted through manufacturing concentration, customer proximity, infrastructure investment and supplier access rather than through an unsupported regional share estimate.
What are the main restraints?
The main restraints are high development cost, packaging and fiber-alignment complexity, specialized engineering requirements, system-level qualification burden and competition from alternative optical architectures. These constraints make silicon photonics especially sensitive to manufacturing maturity and packaging yield, encouraging suppliers to reuse established process platforms and invest in integrated optical engines. These constraints influence adoption by affecting product economics, engineering schedules, supply assurance and the willingness of customers to qualify a new device or photonic architecture within an established platform.
How are leading suppliers differentiating?
Leading suppliers differentiate through optical-electrical integration, 200G-per-lane roadmaps, CPO and optical I/O architectures, high-volume photonic manufacturing, advanced packaging and validated module designs. Intel emphasizes high-volume silicon photonics, Broadcom emphasizes CPO and AI networking, Marvell emphasizes integrated light engines, and Coherent combines photonic devices with high-speed ICs and transceivers. These capabilities matter commercially as customers increasingly purchase validated architectures rather than isolated components, making integration depth, qualification evidence, serviceability and roadmap continuity important competitive filters.
What recent development best illustrates the market direction?
Broadcom’s 2025 CPO reliability milestone reported one million cumulative 400G-equivalent port device hours of flap-free operation at Meta and a 65% optics-power reduction in its comparison. The development is important since it connects silicon photonics and CPO with production-oriented reliability evidence, strengthening the case for package-integrated optical connectivity in AI infrastructure.
Get Sample Report PDF for Exclusive Insights
Report Sample Includes
- Table of Contents
- List of Tables & Figures
- Charts, Research Methodology, and more...
 Download Sample Report PDF