Whole House Surge Protection Device Market, Trends, Business Strategies 2025-2032

Whole House Surge Protection Device Market was valued at 1149 million in 2024 and is projected to reach US$ 1799 million by 2032, at a CAGR of 6.7% during the forecast period.

PDF Icon Download Sample Report PDF
  • Quick Dispatch

    All Orders

  • Secure Payment

    100% Secure Payment

Price range: $1,500.00 through $4,250.00

Clear

MARKET INSIGHTS

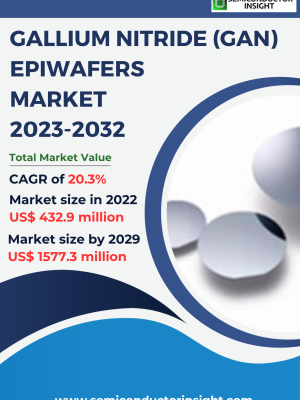
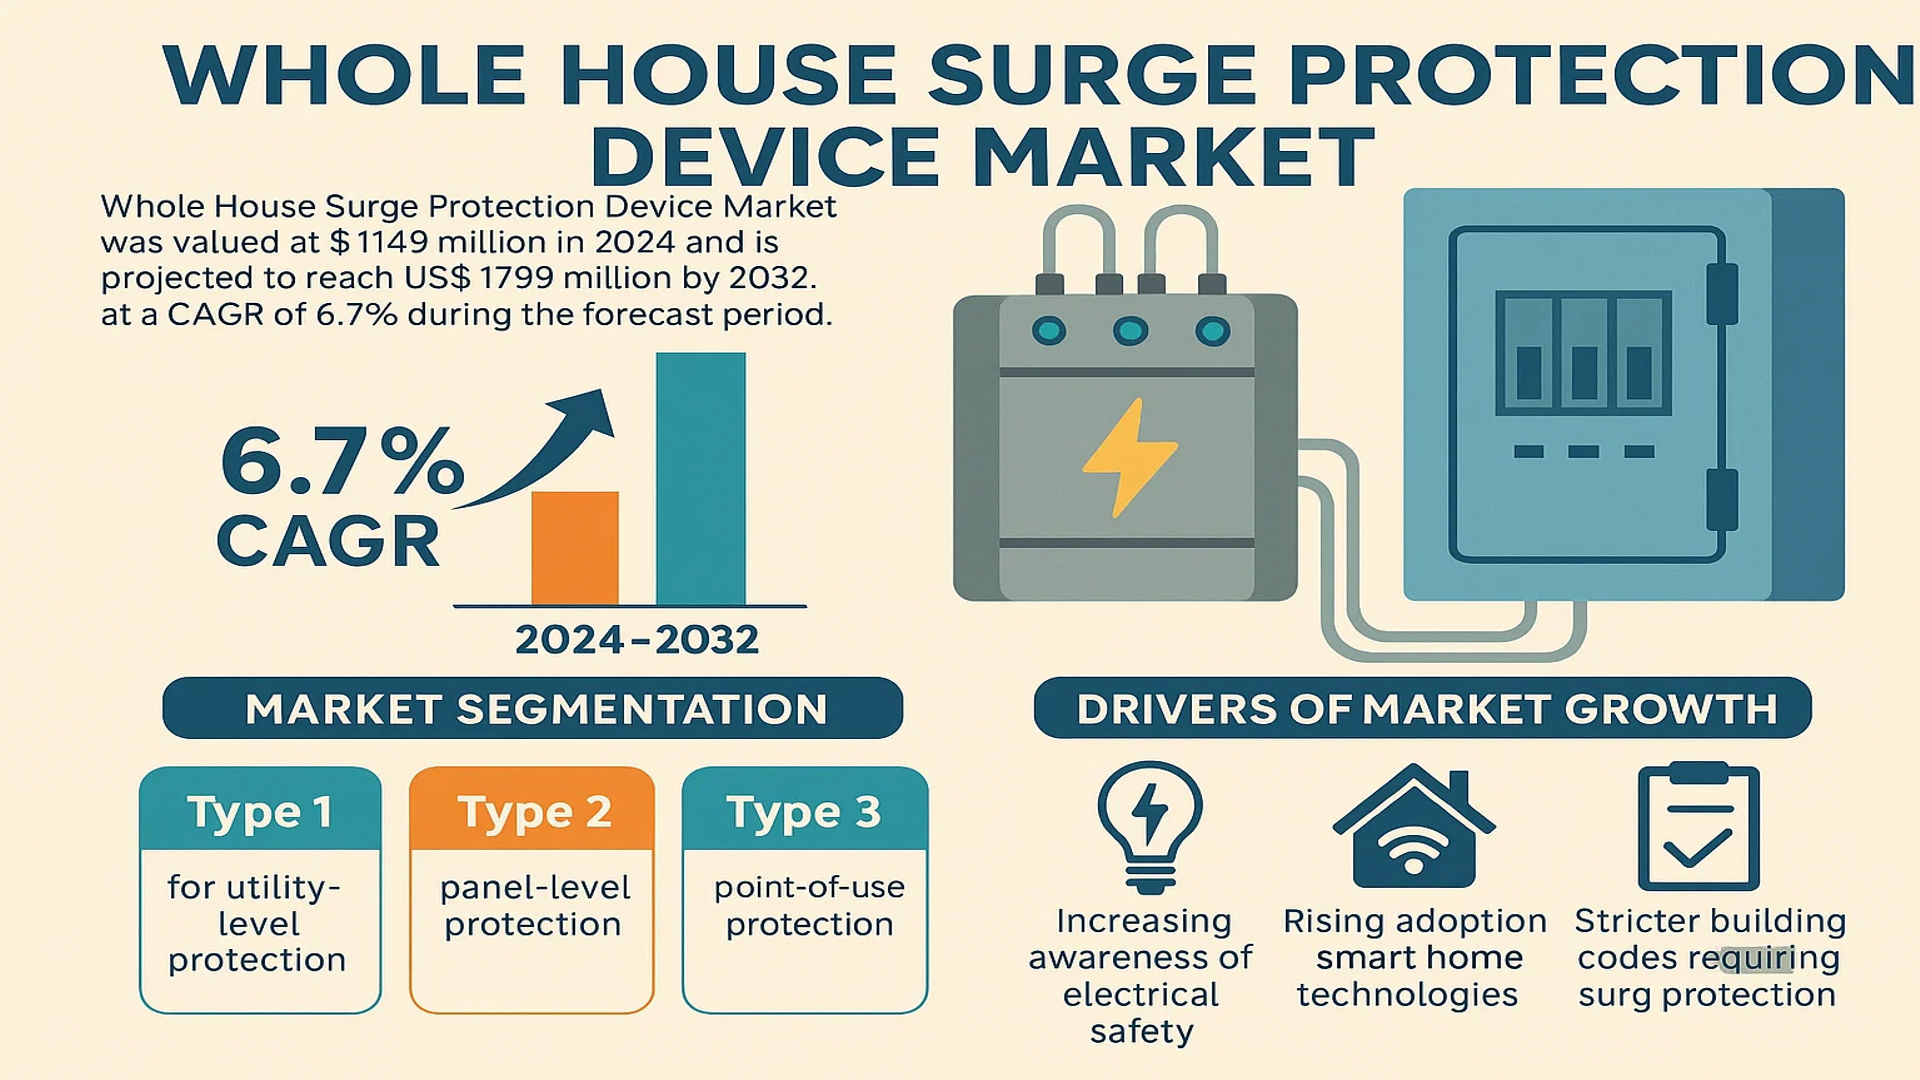
The global Whole House Surge Protection Device Market was valued at 1149 million in 2024 and is projected to reach US$ 1799 million by 2032, at a CAGR of 6.7% during the forecast period.

A whole-house surge protector is an electrical device designed to safeguard an entire residential or commercial electrical system from damaging voltage spikes. These devices are typically installed at the main electrical panel and provide comprehensive protection by diverting excess voltage away from sensitive electronics and appliances. The surge protection market is segmented into Type 1 (for utility-level protection), Type 2 (panel-level protection), and Type 3 (point-of-use protection) devices.

The market growth is driven by increasing awareness of electrical safety, rising adoption of smart home technologies, and stricter building codes requiring surge protection. Furthermore, the growing frequency of extreme weather events causing power fluctuations has heightened demand for reliable surge protection solutions. Key players like Siemens, Eaton, and Schneider Electric are investing in advanced technologies, including IoT-enabled surge protectors that offer real-time monitoring and remote diagnostics capabilities.

Whole House Surge Protection Device Market

MARKET DYNAMICS

MARKET DRIVERS

Growing Smart Home Adoption and Electrical Infrastructure Modernization to Fuel Market Growth

The proliferation of smart home devices, which now account for over 30% of household electronics globally, is creating unprecedented demand for whole house surge protection. High-end appliances and integrated home automation systems with sensitive microelectronics require robust voltage protection to prevent costly damage from power spikes. With electrical grid modernization investments increasing by 12% annually in developed nations, utility infrastructure upgrades are further driving adoption of these protective systems. The convergence of these trends is expected to accelerate market expansion through 2032.

Stringent Electrical Safety Regulations Push Adoption Across Commercial Sectors

Building codes in developed economies now mandate surge protection for new commercial constructions, with retrofit requirements increasingly common in renovation projects. The latest iteration of the National Electrical Code (NEC) expanded surge protection requirements for commercial facilities handling sensitive data. Data centers, healthcare facilities, and financial institutions – representing over 45% of commercial surge protector demand – are leading this regulatory-driven adoption wave. Enforcement of these safety standards is expected to remain a key market driver throughout the forecast period.

Climate Change Impacts Intensify Need for Protective Solutions

The increased frequency of extreme weather events has significantly elevated electrical surge risks, with lightning-related power disturbances rising by nearly 18% over the past decade in vulnerable regions. Tropical storm-prone areas are witnessing particularly strong market growth, where surge protector installations have increased by 23% since 2020. Insurance industry data shows properties with whole-house protection experience 60% fewer electronics claims, creating powerful economic incentives for homeowners in high-risk areas to adopt these solutions.

MARKET RESTRAINTS

High Installation Costs and Technical Complexity Limit Market Penetration

While whole-house surge protectors offer superior protection, their installation costs can range between 4-8 times that of point-of-use devices, creating a significant adoption barrier. The requirement for professional electrical work adds substantial implementation expenses, particularly in older homes where panel upgrades may be necessary. This pricing disparity contributes to point-of-use alternatives maintaining a dominant 72% market share in the overall surge protection sector, despite their limitations in comprehensive coverage.

Lack of Consumer Awareness Hinders Residential Market Growth

Surveys indicate only 38% of homeowners understand the critical differences between whole-house solutions and power strip protectors. This knowledge gap, combined with the “out of sight, out of mind” nature of electrical protection, results in low prioritization during home improvement budgeting. Even among informed consumers, 65% underestimate their risk exposure to damaging power surges, viewing such events as rare occurrences rather than routine electrical phenomena requiring mitigation.

Other Restraints

Technical Limitations in High-Load Environments
Industrial facilities with heavy machinery and variable loads present engineering challenges for surge protection systems. Voltage clamping performance degrades significantly above certain current thresholds, requiring costly custom solutions that can accommodate complex industrial power profiles while maintaining protective capabilities.

MARKET CHALLENGES

Supply Chain Disruptions Impact Component Availability and Costs

The surge protection industry faces persistent challenges in sourcing high-performance metal-oxide varistors (MOVs) and gas discharge tubes, with lead times extending to 26 weeks for some crucial components. These supply constraints have increased material costs by 22-35%, forcing manufacturers to either absorb margin impacts or implement price increases that further dampen market demand. The situation is particularly acute for products requiring military-grade components, where specialty semiconductors remain in critically short supply.

Competition from Substitute Products Creates Market Pressure

Integrated power conditioning systems that combine surge protection with voltage regulation and backup power capabilities are gaining market share, particularly in commercial applications. These hybrid solutions, while more expensive, offer comprehensive power quality management that threatens to marginalize standalone surge protection devices. Traditional surge protector manufacturers must either adapt through product diversification or risk losing their value proposition in key market segments.

MARKET OPPORTUNITIES

Smart Grid Integration Creates New Value Proposition for Advanced Protection Systems

The transition to smart grid infrastructure presents significant opportunities for next-generation surge protection devices with communication capabilities. Prototypes demonstrating real-time monitoring and predictive analytics functions have shown 40% improvement in preventive maintenance effectiveness. Utilities increasingly view these intelligent systems as critical components for grid resilience, with pilot programs showing promising results in reducing outage-related surge events by up to 28%.

Emerging Market Urbanization Drives Infrastructure Investment

Rapid urbanization in developing nations is creating substantial demand for modern electrical protection solutions. Major cities in Southeast Asia and Africa are implementing building codes that incorporate surge protection requirements for the first time. With middle-class expansion increasing electronics ownership in these regions, the addressable market is projected to grow at nearly double the global average rate through 2030.

Renewable Energy Integration Expands Application Scope

The renewable energy sector represents a high-growth application area, with solar installations requiring specialized DC surge protection solutions. As residential solar penetrates 15% of the housing market in leading countries, the accompanying microinverters and battery systems create new protection requirements. Manufacturers developing hybrid AC/DC solutions tailored for renewable applications are capturing this emerging segment, which is growing at 19% annually.

WHOLE HOUSE SURGE PROTECTION DEVICE MARKET TRENDS

Integration of Smart Technology to Drive Market Growth

The global whole house surge protection device market is witnessing a significant shift toward smart and connected solutions. With the rising adoption of IoT-enabled surge protectors, homeowners now have access to real-time power monitoring, surge event logging, and mobile alerts. Modern devices offer remote diagnostics, predictive maintenance capabilities, and energy consumption analytics, which align with the broader smart home ecosystem. According to industry analysis, surge protection devices with smart features are projected to grow at a CAGR of 8.2% from 2024 to 2032, significantly outpacing traditional models. This trend is further supported by increasing investments in residential infrastructure upgrades and demand for preventative power management.

Other Trends

Increased Adoption in Commercial Applications

While residential installations dominate market share at approximately 62% in 2024, the commercial sector is emerging as a key growth driver. Businesses are prioritizing surge protection to safeguard sensitive IT infrastructure, medical equipment, and industrial automation systems. Stringent regulatory requirements for electrical safety, particularly in data centers and healthcare facilities, are accelerating demand. Additionally, insurance providers are incentivizing commercial property owners to install whole-house surge protection systems, as they mitigate costly equipment failures and downtime.

Sustainability and Energy Efficiency Focus

Manufacturers are emphasizing eco-friendly materials and low-power designs to align with global sustainability goals. New-generation surge protectors demonstrate 98-99% surge energy absorption efficiency while minimizing standby power consumption. Concurrently, modular designs allow for easier upgrades and replacements without complete system overhauls. This approach not only extends product lifecycles but also reduces electronic waste. Regionally, Europe leads in adoption of sustainable solutions due to rigorous energy efficiency standards, while North America sees growing demand for LEED-compliant building technologies incorporating advanced surge protection.

COMPETITIVE LANDSCAPE

Key Industry Players

Leading Manufacturers Expand Global Footprint Amid Rising Demand for Smart Surge Protection

The global whole house surge protection device market features a moderately consolidated competitive environment dominated by multinational electrical equipment manufacturers. Siemens and Schneider Electric collectively hold over 25% market share as of 2024, owing to their extensive product lines and established distribution networks across residential and commercial sectors. These industry leaders continue to invest in R&D to develop intelligent surge protection solutions compatible with smart home ecosystems.

Eaton Corporation maintains a strong position in North America and Europe through its innovative whole house surge protectors with integrated energy monitoring capabilities. Meanwhile, Leviton has gained significant traction in the U.S. residential market by offering UL-listed devices that combine robust protection with easy installation features preferred by electricians.

The competitive intensity is increasing as manufacturers focus on technological differentiation. While established players emphasize smart connectivity and cloud-based monitoring, emerging competitors like Prosurge and PSP Products are gaining market share through cost-competitive offerings tailored for price-sensitive regions in Asia and Latin America.

Strategic partnerships represent another key battleground, with companies such as Legrand forming alliances with home automation providers to integrate surge protection into comprehensive electrical systems. This trend is expected to accelerate as the Internet of Things penetrates deeper into residential infrastructure worldwide.

List of Major Whole House Surge Protection Device Manufacturers

Segment Analysis:

By Type

Type 2 Surge Protection Device Segment Dominates Due to Optimal Balance of Performance and Cost

The market is segmented based on type into:

  • Type 1 Surge Protection Device
    • Features: High-voltage surge protection, typically used for external surge protection
  • Type 2 Surge Protection Device
    • Features: Most common for whole-house protection, installed at main distribution panels
  • Type 3 Surge Protection Device
    • Features: Point-of-use protection, often used in combination with Type 2 devices

By Application

Civilian Segment Leads Due to Increasing Adoption in Smart Homes

The market is segmented based on application into:

  • Civilian
    • Sub-segments: Residential homes, apartments, villas
  • Commercial
    • Sub-segments: Office buildings, retail spaces, small businesses

By Technology

Smart Surge Protection Devices Gain Traction with IoT Integration

The market is segmented based on technology into:

  • Conventional Surge Protection
  • Smart/Connected Surge Protection
    • Features: Remote monitoring, energy tracking, mobile alerts

By Installation

Hardwired Installations Dominate for Long-term Protection

The market is segmented based on installation type into:

  • Hardwired Installation
  • Plug-in Installation

Regional Analysis: Whole House Surge Protection Device Market

North America
North America dominates the global whole house surge protection device market, accounting for approximately 32% of global revenue in 2024. The region’s leadership stems from high consumer awareness about electrical safety, frequent lightning strikes in areas like Florida and Texas, and stringent electrical safety codes mandating surge protection in new constructions. The U.S. National Electrical Code (NEC) has progressively updated requirements for transient voltage surge suppressors, driving adoption in both residential and commercial segments. Market leaders like Eaton, Leviton, and Siemens have introduced smart surge protectors with IoT connectivity to capitalize on the region’s advanced smart home infrastructure. While the market is mature, growth continues through replacement cycles and technology upgrades, particularly in smart energy management systems.

Europe
The European market is characterized by strict CE and EN 61643 standards for surge protective devices, creating a quality-driven competitive landscape. Germany and France collectively represent over 45% of regional demand, with industrial and commercial applications showing above-average growth rates. The EU’s focus on renewable energy integration has created demand for specialized surge protection solutions in solar PV installations. However, market expansion faces challenges from price sensitivity in Southern and Eastern European countries and competition from Asian imports. Leading manufacturers like Dehn and Schneider Electric emphasize modular designs that comply with diverse national electrical standards while offering remote monitoring capabilities aligned with Europe’s smart grid initiatives.

Asia-Pacific
Asia-Pacific is the fastest-growing region, projected to expand at an 8.2% CAGR through 2032, driven by urbanization and infrastructure development. China accounts for nearly 60% of regional demand, supported by government initiatives for safe residential electrification and the world’s largest smart meter deployment program. However, the market remains highly price-sensitive, with local manufacturers like CHINT competing aggressively on cost. In contrast, Japan and South Korea feature sophisticated demand for high-performance surge protectors integrated with home automation systems. The region presents notable growth opportunities in emerging economies like India and Vietnam, where increasing disposable incomes and lightning-related damage awareness are driving adoption.

South America
The South American market, though relatively small, is expanding as countries modernize electrical grids and adopt updated safety standards. Brazil leads regional demand, with surge protection becoming a standard feature in premium residential developments. However, economic instability and currency fluctuations continue to restrain market growth, creating preference for basic protection devices over advanced solutions. Manufacturers are adapting through localized production and simplified distribution channels to serve price-conscious consumers. The commercial sector, particularly data centers and industrial facilities, presents the most consistent growth segment due to mission-critical power protection requirements.

Middle East & Africa
This region shows the highest growth potential long-term, though from a small base. GCC countries are driving demand through mega construction projects incorporating smart building technologies, with the UAE and Saudi Arabia accounting for over 70% of regional surge protector sales. Harsh environmental conditions and frequent voltage fluctuations make surge protection essential, though market penetration remains low outside premium properties. In Africa, market development is slower due to infrastructure limitations, but increasing electrification rates and mobile payment-enabled financing models are creating new opportunities in urban centers. Regional players face the challenge of balancing ruggedness requirements with affordability constraints.

Report Scope

This market research report provides a comprehensive analysis of the Global Whole House Surge Protection Device Market, covering the forecast period 2024–2032. It offers detailed insights into market dynamics, technological advancements, competitive landscape, and key trends shaping the industry.

Key focus areas of the report include:

  • Market Size & Forecast: Historical data and future projections for revenue, unit shipments, and market value across major regions and segments. The market was valued at USD 1,149 million in 2024 and is projected to reach USD 1,799 million by 2032, growing at a CAGR of 6.7%.
  • Segmentation Analysis: Detailed breakdown by product type (Type 1, Type 2, Type 3), application (Civilian, Commercial), and end-user industry to identify high-growth segments and investment opportunities.
  • Regional Outlook: Insights into market performance across North America, Europe, Asia-Pacific, Latin America, and the Middle East & Africa, including country-level analysis where relevant. North America and Asia-Pacific are key growth regions.
  • Competitive Landscape: Profiles of leading market participants, including their product offerings, R&D focus, manufacturing capacity, pricing strategies, and recent developments such as mergers, acquisitions, and partnerships.
  • Technology Trends & Innovation: Assessment of emerging technologies, integration of smart home capabilities, AI-driven monitoring, and evolving industry standards for surge protection.
  • Market Drivers & Restraints: Evaluation of factors driving market growth, such as increasing demand for electronic device protection, along with challenges like supply chain constraints and regulatory compliance.
  • Stakeholder Analysis: Insights for component suppliers, OEMs, system integrators, investors, and policymakers regarding the evolving ecosystem and strategic opportunities.

Primary and secondary research methods are employed, including interviews with industry experts, data from verified sources, and real-time market intelligence to ensure the accuracy and reliability of the insights presented.

FREQUENTLY ASKED QUESTIONS:

What is the current market size of Global Whole House Surge Protection Device Market?

-> Whole House Surge Protection Device Market was valued at 1149 million in 2024 and is projected to reach US$ 1799 million by 2032, at a CAGR of 6.7% during the forecast period..

Which key companies operate in Global Whole House Surge Protection Device Market?

-> Key players include Siemens, Eaton, Schneider Electric, Leviton, Intermatic, Mersen, Dehn, Prosurge, PSP Products, Legrand, LSP, and CHINT.

What are the key growth drivers?

-> Key growth drivers include rising demand for smart home solutions, increasing electronic device penetration, and stricter electrical safety regulations.

Which region dominates the market?

-> North America holds the largest market share, while Asia-Pacific is expected to witness the fastest growth.

What are the emerging trends?

-> Emerging trends include smart surge protectors with IoT connectivity, energy-efficient designs, and modular protection solutions.

Whole House Surge Protection Device Market, Trends, Business Strategies 2025-2032

Get Sample Report PDF for Exclusive Insights

Report Sample Includes

  • Table of Contents
  • List of Tables & Figures
  • Charts, Research Methodology, and more...
PDF Icon Download Sample Report PDF

Download Sample Report

Table of Content

1 Introduction to Research & Analysis Reports
1.1 Whole House Surge Protection Device Market Definition
1.2 Market Segments
1.2.1 Segment by Type
1.2.2 Segment by Application
1.3 Global Whole House Surge Protection Device Market Overview
1.4 Features & Benefits of This Report
1.5 Methodology & Sources of Information
1.5.1 Research Methodology
1.5.2 Research Process
1.5.3 Base Year
1.5.4 Report Assumptions & Caveats
2 Global Whole House Surge Protection Device Overall Market Size
2.1 Global Whole House Surge Protection Device Market Size: 2024 VS 2032
2.2 Global Whole House Surge Protection Device Market Size, Prospects & Forecasts: 2020-2032
2.3 Global Whole House Surge Protection Device Sales: 2020-2032
3 Company Landscape
3.1 Top Whole House Surge Protection Device Players in Global Market
3.2 Top Global Whole House Surge Protection Device Companies Ranked by Revenue
3.3 Global Whole House Surge Protection Device Revenue by Companies
3.4 Global Whole House Surge Protection Device Sales by Companies
3.5 Global Whole House Surge Protection Device Price by Manufacturer (2020-2025)
3.6 Top 3 and Top 5 Whole House Surge Protection Device Companies in Global Market, by Revenue in 2024
3.7 Global Manufacturers Whole House Surge Protection Device Product Type
3.8 Tier 1, Tier 2, and Tier 3 Whole House Surge Protection Device Players in Global Market
3.8.1 List of Global Tier 1 Whole House Surge Protection Device Companies
3.8.2 List of Global Tier 2 and Tier 3 Whole House Surge Protection Device Companies
4 Sights by Product
4.1 Overview
4.1.1 Segment by Type – Global Whole House Surge Protection Device Market Size Markets, 2024 & 2032
4.1.2 Type 1 Surge Protection Device
4.1.3 Type 2 Surge Protection Device
4.1.4 Type 3 Surge Protection Device
4.2 Segment by Type – Global Whole House Surge Protection Device Revenue & Forecasts
4.2.1 Segment by Type – Global Whole House Surge Protection Device Revenue, 2020-2025
4.2.2 Segment by Type – Global Whole House Surge Protection Device Revenue, 2026-2032
4.2.3 Segment by Type – Global Whole House Surge Protection Device Revenue Market Share, 2020-2032
4.3 Segment by Type – Global Whole House Surge Protection Device Sales & Forecasts
4.3.1 Segment by Type – Global Whole House Surge Protection Device Sales, 2020-2025
4.3.2 Segment by Type – Global Whole House Surge Protection Device Sales, 2026-2032
4.3.3 Segment by Type – Global Whole House Surge Protection Device Sales Market Share, 2020-2032
4.4 Segment by Type – Global Whole House Surge Protection Device Price (Manufacturers Selling Prices), 2020-2032
5 Sights by Application
5.1 Overview
5.1.1 Segment by Application – Global Whole House Surge Protection Device Market Size, 2024 & 2032
5.1.2 Civilian
5.1.3 Commercial
5.2 Segment by Application – Global Whole House Surge Protection Device Revenue & Forecasts
5.2.1 Segment by Application – Global Whole House Surge Protection Device Revenue, 2020-2025
5.2.2 Segment by Application – Global Whole House Surge Protection Device Revenue, 2026-2032
5.2.3 Segment by Application – Global Whole House Surge Protection Device Revenue Market Share, 2020-2032
5.3 Segment by Application – Global Whole House Surge Protection Device Sales & Forecasts
5.3.1 Segment by Application – Global Whole House Surge Protection Device Sales, 2020-2025
5.3.2 Segment by Application – Global Whole House Surge Protection Device Sales, 2026-2032
5.3.3 Segment by Application – Global Whole House Surge Protection Device Sales Market Share, 2020-2032
5.4 Segment by Application – Global Whole House Surge Protection Device Price (Manufacturers Selling Prices), 2020-2032
6 Sights by Region
6.1 By Region – Global Whole House Surge Protection Device Market Size, 2024 & 2032
6.2 By Region – Global Whole House Surge Protection Device Revenue & Forecasts
6.2.1 By Region – Global Whole House Surge Protection Device Revenue, 2020-2025
6.2.2 By Region – Global Whole House Surge Protection Device Revenue, 2026-2032
6.2.3 By Region – Global Whole House Surge Protection Device Revenue Market Share, 2020-2032
6.3 By Region – Global Whole House Surge Protection Device Sales & Forecasts
6.3.1 By Region – Global Whole House Surge Protection Device Sales, 2020-2025
6.3.2 By Region – Global Whole House Surge Protection Device Sales, 2026-2032
6.3.3 By Region – Global Whole House Surge Protection Device Sales Market Share, 2020-2032
6.4 North America
6.4.1 By Country – North America Whole House Surge Protection Device Revenue, 2020-2032
6.4.2 By Country – North America Whole House Surge Protection Device Sales, 2020-2032
6.4.3 United States Whole House Surge Protection Device Market Size, 2020-2032
6.4.4 Canada Whole House Surge Protection Device Market Size, 2020-2032
6.4.5 Mexico Whole House Surge Protection Device Market Size, 2020-2032
6.5 Europe
6.5.1 By Country – Europe Whole House Surge Protection Device Revenue, 2020-2032
6.5.2 By Country – Europe Whole House Surge Protection Device Sales, 2020-2032
6.5.3 Germany Whole House Surge Protection Device Market Size, 2020-2032
6.5.4 France Whole House Surge Protection Device Market Size, 2020-2032
6.5.5 U.K. Whole House Surge Protection Device Market Size, 2020-2032
6.5.6 Italy Whole House Surge Protection Device Market Size, 2020-2032
6.5.7 Russia Whole House Surge Protection Device Market Size, 2020-2032
6.5.8 Nordic Countries Whole House Surge Protection Device Market Size, 2020-2032
6.5.9 Benelux Whole House Surge Protection Device Market Size, 2020-2032
6.6 Asia
6.6.1 By Region – Asia Whole House Surge Protection Device Revenue, 2020-2032
6.6.2 By Region – Asia Whole House Surge Protection Device Sales, 2020-2032
6.6.3 China Whole House Surge Protection Device Market Size, 2020-2032
6.6.4 Japan Whole House Surge Protection Device Market Size, 2020-2032
6.6.5 South Korea Whole House Surge Protection Device Market Size, 2020-2032
6.6.6 Southeast Asia Whole House Surge Protection Device Market Size, 2020-2032
6.6.7 India Whole House Surge Protection Device Market Size, 2020-2032
6.7 South America
6.7.1 By Country – South America Whole House Surge Protection Device Revenue, 2020-2032
6.7.2 By Country – South America Whole House Surge Protection Device Sales, 2020-2032
6.7.3 Brazil Whole House Surge Protection Device Market Size, 2020-2032
6.7.4 Argentina Whole House Surge Protection Device Market Size, 2020-2032
6.8 Middle East & Africa
6.8.1 By Country – Middle East & Africa Whole House Surge Protection Device Revenue, 2020-2032
6.8.2 By Country – Middle East & Africa Whole House Surge Protection Device Sales, 2020-2032
6.8.3 Turkey Whole House Surge Protection Device Market Size, 2020-2032
6.8.4 Israel Whole House Surge Protection Device Market Size, 2020-2032
6.8.5 Saudi Arabia Whole House Surge Protection Device Market Size, 2020-2032
6.8.6 UAE Whole House Surge Protection Device Market Size, 2020-2032
7 Manufacturers & Brands Profiles
7.1 Siemens
7.1.1 Siemens Company Summary
7.1.2 Siemens Business Overview
7.1.3 Siemens Whole House Surge Protection Device Major Product Offerings
7.1.4 Siemens Whole House Surge Protection Device Sales and Revenue in Global (2020-2025)
7.1.5 Siemens Key News & Latest Developments
7.2 Eaton
7.2.1 Eaton Company Summary
7.2.2 Eaton Business Overview
7.2.3 Eaton Whole House Surge Protection Device Major Product Offerings
7.2.4 Eaton Whole House Surge Protection Device Sales and Revenue in Global (2020-2025)
7.2.5 Eaton Key News & Latest Developments
7.3 Schneider Electric
7.3.1 Schneider Electric Company Summary
7.3.2 Schneider Electric Business Overview
7.3.3 Schneider Electric Whole House Surge Protection Device Major Product Offerings
7.3.4 Schneider Electric Whole House Surge Protection Device Sales and Revenue in Global (2020-2025)
7.3.5 Schneider Electric Key News & Latest Developments
7.4 Leviton
7.4.1 Leviton Company Summary
7.4.2 Leviton Business Overview
7.4.3 Leviton Whole House Surge Protection Device Major Product Offerings
7.4.4 Leviton Whole House Surge Protection Device Sales and Revenue in Global (2020-2025)
7.4.5 Leviton Key News & Latest Developments
7.5 Intermatic
7.5.1 Intermatic Company Summary
7.5.2 Intermatic Business Overview
7.5.3 Intermatic Whole House Surge Protection Device Major Product Offerings
7.5.4 Intermatic Whole House Surge Protection Device Sales and Revenue in Global (2020-2025)
7.5.5 Intermatic Key News & Latest Developments
7.6 Mersen
7.6.1 Mersen Company Summary
7.6.2 Mersen Business Overview
7.6.3 Mersen Whole House Surge Protection Device Major Product Offerings
7.6.4 Mersen Whole House Surge Protection Device Sales and Revenue in Global (2020-2025)
7.6.5 Mersen Key News & Latest Developments
7.7 Dehn
7.7.1 Dehn Company Summary
7.7.2 Dehn Business Overview
7.7.3 Dehn Whole House Surge Protection Device Major Product Offerings
7.7.4 Dehn Whole House Surge Protection Device Sales and Revenue in Global (2020-2025)
7.7.5 Dehn Key News & Latest Developments
7.8 Prosurge
7.8.1 Prosurge Company Summary
7.8.2 Prosurge Business Overview
7.8.3 Prosurge Whole House Surge Protection Device Major Product Offerings
7.8.4 Prosurge Whole House Surge Protection Device Sales and Revenue in Global (2020-2025)
7.8.5 Prosurge Key News & Latest Developments
7.9 PSP Products
7.9.1 PSP Products Company Summary
7.9.2 PSP Products Business Overview
7.9.3 PSP Products Whole House Surge Protection Device Major Product Offerings
7.9.4 PSP Products Whole House Surge Protection Device Sales and Revenue in Global (2020-2025)
7.9.5 PSP Products Key News & Latest Developments
7.10 Legrand
7.10.1 Legrand Company Summary
7.10.2 Legrand Business Overview
7.10.3 Legrand Whole House Surge Protection Device Major Product Offerings
7.10.4 Legrand Whole House Surge Protection Device Sales and Revenue in Global (2020-2025)
7.10.5 Legrand Key News & Latest Developments
7.11 LSP
7.11.1 LSP Company Summary
7.11.2 LSP Business Overview
7.11.3 LSP Whole House Surge Protection Device Major Product Offerings
7.11.4 LSP Whole House Surge Protection Device Sales and Revenue in Global (2020-2025)
7.11.5 LSP Key News & Latest Developments
7.12 CHINT
7.12.1 CHINT Company Summary
7.12.2 CHINT Business Overview
7.12.3 CHINT Whole House Surge Protection Device Major Product Offerings
7.12.4 CHINT Whole House Surge Protection Device Sales and Revenue in Global (2020-2025)
7.12.5 CHINT Key News & Latest Developments
8 Global Whole House Surge Protection Device Production Capacity, Analysis
8.1 Global Whole House Surge Protection Device Production Capacity, 2020-2032
8.2 Whole House Surge Protection Device Production Capacity of Key Manufacturers in Global Market
8.3 Global Whole House Surge Protection Device Production by Region
9 Key Market Trends, Opportunity, Drivers and Restraints
9.1 Market Opportunities & Trends
9.2 Market Drivers
9.3 Market Restraints
10 Whole House Surge Protection Device Supply Chain Analysis
10.1 Whole House Surge Protection Device Industry Value Chain
10.2 Whole House Surge Protection Device Upstream Market
10.3 Whole House Surge Protection Device Downstream and Clients
10.4 Marketing Channels Analysis
10.4.1 Marketing Channels
10.4.2 Whole House Surge Protection Device Distributors and Sales Agents in Global
11 Conclusion
12 Appendix
12.1 Note
12.2 Examples of Clients
12.3 DisclaimerList of Tables
Table 1. Key Players of Whole House Surge Protection Device in Global Market
Table 2. Top Whole House Surge Protection Device Players in Global Market, Ranking by Revenue (2024)
Table 3. Global Whole House Surge Protection Device Revenue by Companies, (US$, Mn), 2020-2025
Table 4. Global Whole House Surge Protection Device Revenue Share by Companies, 2020-2025
Table 5. Global Whole House Surge Protection Device Sales by Companies, (K Units), 2020-2025
Table 6. Global Whole House Surge Protection Device Sales Share by Companies, 2020-2025
Table 7. Key Manufacturers Whole House Surge Protection Device Price (2020-2025) & (US$/Unit)
Table 8. Global Manufacturers Whole House Surge Protection Device Product Type
Table 9. List of Global Tier 1 Whole House Surge Protection Device Companies, Revenue (US$, Mn) in 2024 and Market Share
Table 10. List of Global Tier 2 and Tier 3 Whole House Surge Protection Device Companies, Revenue (US$, Mn) in 2024 and Market Share
Table 11. Segment by Type – Global Whole House Surge Protection Device Revenue, (US$, Mn), 2024 & 2032
Table 12. Segment by Type – Global Whole House Surge Protection Device Revenue (US$, Mn), 2020-2025
Table 13. Segment by Type – Global Whole House Surge Protection Device Revenue (US$, Mn), 2026-2032
Table 14. Segment by Type – Global Whole House Surge Protection Device Sales (K Units), 2020-2025
Table 15. Segment by Type – Global Whole House Surge Protection Device Sales (K Units), 2026-2032
Table 16. Segment by Application – Global Whole House Surge Protection Device Revenue, (US$, Mn), 2024 & 2032
Table 17. Segment by Application – Global Whole House Surge Protection Device Revenue, (US$, Mn), 2020-2025
Table 18. Segment by Application – Global Whole House Surge Protection Device Revenue, (US$, Mn), 2026-2032
Table 19. Segment by Application – Global Whole House Surge Protection Device Sales, (K Units), 2020-2025
Table 20. Segment by Application – Global Whole House Surge Protection Device Sales, (K Units), 2026-2032
Table 21. By Region – Global Whole House Surge Protection Device Revenue, (US$, Mn), 2025-2032
Table 22. By Region – Global Whole House Surge Protection Device Revenue, (US$, Mn), 2020-2025
Table 23. By Region – Global Whole House Surge Protection Device Revenue, (US$, Mn), 2026-2032
Table 24. By Region – Global Whole House Surge Protection Device Sales, (K Units), 2020-2025
Table 25. By Region – Global Whole House Surge Protection Device Sales, (K Units), 2026-2032
Table 26. By Country – North America Whole House Surge Protection Device Revenue, (US$, Mn), 2020-2025
Table 27. By Country – North America Whole House Surge Protection Device Revenue, (US$, Mn), 2026-2032
Table 28. By Country – North America Whole House Surge Protection Device Sales, (K Units), 2020-2025
Table 29. By Country – North America Whole House Surge Protection Device Sales, (K Units), 2026-2032
Table 30. By Country – Europe Whole House Surge Protection Device Revenue, (US$, Mn), 2020-2025
Table 31. By Country – Europe Whole House Surge Protection Device Revenue, (US$, Mn), 2026-2032
Table 32. By Country – Europe Whole House Surge Protection Device Sales, (K Units), 2020-2025
Table 33. By Country – Europe Whole House Surge Protection Device Sales, (K Units), 2026-2032
Table 34. By Region – Asia Whole House Surge Protection Device Revenue, (US$, Mn), 2020-2025
Table 35. By Region – Asia Whole House Surge Protection Device Revenue, (US$, Mn), 2026-2032
Table 36. By Region – Asia Whole House Surge Protection Device Sales, (K Units), 2020-2025
Table 37. By Region – Asia Whole House Surge Protection Device Sales, (K Units), 2026-2032
Table 38. By Country – South America Whole House Surge Protection Device Revenue, (US$, Mn), 2020-2025
Table 39. By Country – South America Whole House Surge Protection Device Revenue, (US$, Mn), 2026-2032
Table 40. By Country – South America Whole House Surge Protection Device Sales, (K Units), 2020-2025
Table 41. By Country – South America Whole House Surge Protection Device Sales, (K Units), 2026-2032
Table 42. By Country – Middle East & Africa Whole House Surge Protection Device Revenue, (US$, Mn), 2020-2025
Table 43. By Country – Middle East & Africa Whole House Surge Protection Device Revenue, (US$, Mn), 2026-2032
Table 44. By Country – Middle East & Africa Whole House Surge Protection Device Sales, (K Units), 2020-2025
Table 45. By Country – Middle East & Africa Whole House Surge Protection Device Sales, (K Units), 2026-2032
Table 46. Siemens Company Summary
Table 47. Siemens Whole House Surge Protection Device Product Offerings
Table 48. Siemens Whole House Surge Protection Device Sales (K Units), Revenue (US$, Mn) and Average Price (US$/Unit) & (2020-2025)
Table 49. Siemens Key News & Latest Developments
Table 50. Eaton Company Summary
Table 51. Eaton Whole House Surge Protection Device Product Offerings
Table 52. Eaton Whole House Surge Protection Device Sales (K Units), Revenue (US$, Mn) and Average Price (US$/Unit) & (2020-2025)
Table 53. Eaton Key News & Latest Developments
Table 54. Schneider Electric Company Summary
Table 55. Schneider Electric Whole House Surge Protection Device Product Offerings
Table 56. Schneider Electric Whole House Surge Protection Device Sales (K Units), Revenue (US$, Mn) and Average Price (US$/Unit) & (2020-2025)
Table 57. Schneider Electric Key News & Latest Developments
Table 58. Leviton Company Summary
Table 59. Leviton Whole House Surge Protection Device Product Offerings
Table 60. Leviton Whole House Surge Protection Device Sales (K Units), Revenue (US$, Mn) and Average Price (US$/Unit) & (2020-2025)
Table 61. Leviton Key News & Latest Developments
Table 62. Intermatic Company Summary
Table 63. Intermatic Whole House Surge Protection Device Product Offerings
Table 64. Intermatic Whole House Surge Protection Device Sales (K Units), Revenue (US$, Mn) and Average Price (US$/Unit) & (2020-2025)
Table 65. Intermatic Key News & Latest Developments
Table 66. Mersen Company Summary
Table 67. Mersen Whole House Surge Protection Device Product Offerings
Table 68. Mersen Whole House Surge Protection Device Sales (K Units), Revenue (US$, Mn) and Average Price (US$/Unit) & (2020-2025)
Table 69. Mersen Key News & Latest Developments
Table 70. Dehn Company Summary
Table 71. Dehn Whole House Surge Protection Device Product Offerings
Table 72. Dehn Whole House Surge Protection Device Sales (K Units), Revenue (US$, Mn) and Average Price (US$/Unit) & (2020-2025)
Table 73. Dehn Key News & Latest Developments
Table 74. Prosurge Company Summary
Table 75. Prosurge Whole House Surge Protection Device Product Offerings
Table 76. Prosurge Whole House Surge Protection Device Sales (K Units), Revenue (US$, Mn) and Average Price (US$/Unit) & (2020-2025)
Table 77. Prosurge Key News & Latest Developments
Table 78. PSP Products Company Summary
Table 79. PSP Products Whole House Surge Protection Device Product Offerings
Table 80. PSP Products Whole House Surge Protection Device Sales (K Units), Revenue (US$, Mn) and Average Price (US$/Unit) & (2020-2025)
Table 81. PSP Products Key News & Latest Developments
Table 82. Legrand Company Summary
Table 83. Legrand Whole House Surge Protection Device Product Offerings
Table 84. Legrand Whole House Surge Protection Device Sales (K Units), Revenue (US$, Mn) and Average Price (US$/Unit) & (2020-2025)
Table 85. Legrand Key News & Latest Developments
Table 86. LSP Company Summary
Table 87. LSP Whole House Surge Protection Device Product Offerings
Table 88. LSP Whole House Surge Protection Device Sales (K Units), Revenue (US$, Mn) and Average Price (US$/Unit) & (2020-2025)
Table 89. LSP Key News & Latest Developments
Table 90. CHINT Company Summary
Table 91. CHINT Whole House Surge Protection Device Product Offerings
Table 92. CHINT Whole House Surge Protection Device Sales (K Units), Revenue (US$, Mn) and Average Price (US$/Unit) & (2020-2025)
Table 93. CHINT Key News & Latest Developments
Table 94. Whole House Surge Protection Device Capacity of Key Manufacturers in Global Market, 2023-2025 (K Units)
Table 95. Global Whole House Surge Protection Device Capacity Market Share of Key Manufacturers, 2023-2025
Table 96. Global Whole House Surge Protection Device Production by Region, 2020-2025 (K Units)
Table 97. Global Whole House Surge Protection Device Production by Region, 2026-2032 (K Units)
Table 98. Whole House Surge Protection Device Market Opportunities & Trends in Global Market
Table 99. Whole House Surge Protection Device Market Drivers in Global Market
Table 100. Whole House Surge Protection Device Market Restraints in Global Market
Table 101. Whole House Surge Protection Device Raw Materials
Table 102. Whole House Surge Protection Device Raw Materials Suppliers in Global Market
Table 103. Typical Whole House Surge Protection Device Downstream
Table 104. Whole House Surge Protection Device Downstream Clients in Global Market
Table 105. Whole House Surge Protection Device Distributors and Sales Agents in Global Market

List of Figures
Figure 1. Whole House Surge Protection Device Product Picture
Figure 2. Whole House Surge Protection Device Segment by Type in 2024
Figure 3. Whole House Surge Protection Device Segment by Application in 2024
Figure 4. Global Whole House Surge Protection Device Market Overview: 2024
Figure 5. Key Caveats
Figure 6. Global Whole House Surge Protection Device Market Size: 2024 VS 2032 (US$, Mn)
Figure 7. Global Whole House Surge Protection Device Revenue: 2020-2032 (US$, Mn)
Figure 8. Whole House Surge Protection Device Sales in Global Market: 2020-2032 (K Units)
Figure 9. The Top 3 and 5 Players Market Share by Whole House Surge Protection Device Revenue in 2024
Figure 10. Segment by Type – Global Whole House Surge Protection Device Revenue, (US$, Mn), 2024 & 2032
Figure 11. Segment by Type – Global Whole House Surge Protection Device Revenue Market Share, 2020-2032
Figure 12. Segment by Type – Global Whole House Surge Protection Device Sales Market Share, 2020-2032
Figure 13. Segment by Type – Global Whole House Surge Protection Device Price (US$/Unit), 2020-2032
Figure 14. Segment by Application – Global Whole House Surge Protection Device Revenue, (US$, Mn), 2024 & 2032
Figure 15. Segment by Application – Global Whole House Surge Protection Device Revenue Market Share, 2020-2032
Figure 16. Segment by Application – Global Whole House Surge Protection Device Sales Market Share, 2020-2032
Figure 17. Segment by Application -Global Whole House Surge Protection Device Price (US$/Unit), 2020-2032
Figure 18. By Region – Global Whole House Surge Protection Device Revenue, (US$, Mn), 2025 & 2032
Figure 19. By Region – Global Whole House Surge Protection Device Revenue Market Share, 2020 VS 2024 VS 2032
Figure 20. By Region – Global Whole House Surge Protection Device Revenue Market Share, 2020-2032
Figure 21. By Region – Global Whole House Surge Protection Device Sales Market Share, 2020-2032
Figure 22. By Country – North America Whole House Surge Protection Device Revenue Market Share, 2020-2032
Figure 23. By Country – North America Whole House Surge Protection Device Sales Market Share, 2020-2032
Figure 24. United States Whole House Surge Protection Device Revenue, (US$, Mn), 2020-2032
Figure 25. Canada Whole House Surge Protection Device Revenue, (US$, Mn), 2020-2032
Figure 26. Mexico Whole House Surge Protection Device Revenue, (US$, Mn), 2020-2032
Figure 27. By Country – Europe Whole House Surge Protection Device Revenue Market Share, 2020-2032
Figure 28. By Country – Europe Whole House Surge Protection Device Sales Market Share, 2020-2032
Figure 29. Germany Whole House Surge Protection Device Revenue, (US$, Mn), 2020-2032
Figure 30. France Whole House Surge Protection Device Revenue, (US$, Mn), 2020-2032
Figure 31. U.K. Whole House Surge Protection Device Revenue, (US$, Mn), 2020-2032
Figure 32. Italy Whole House Surge Protection Device Revenue, (US$, Mn), 2020-2032
Figure 33. Russia Whole House Surge Protection Device Revenue, (US$, Mn), 2020-2032
Figure 34. Nordic Countries Whole House Surge Protection Device Revenue, (US$, Mn), 2020-2032
Figure 35. Benelux Whole House Surge Protection Device Revenue, (US$, Mn), 2020-2032
Figure 36. By Region – Asia Whole House Surge Protection Device Revenue Market Share, 2020-2032
Figure 37. By Region – Asia Whole House Surge Protection Device Sales Market Share, 2020-2032
Figure 38. China Whole House Surge Protection Device Revenue, (US$, Mn), 2020-2032
Figure 39. Japan Whole House Surge Protection Device Revenue, (US$, Mn), 2020-2032
Figure 40. South Korea Whole House Surge Protection Device Revenue, (US$, Mn), 2020-2032
Figure 41. Southeast Asia Whole House Surge Protection Device Revenue, (US$, Mn), 2020-2032
Figure 42. India Whole House Surge Protection Device Revenue, (US$, Mn), 2020-2032
Figure 43. By Country – South America Whole House Surge Protection Device Revenue Market Share, 2020-2032
Figure 44. By Country – South America Whole House Surge Protection Device Sales, Market Share, 2020-2032
Figure 45. Brazil Whole House Surge Protection Device Revenue, (US$, Mn), 2020-2032
Figure 46. Argentina Whole House Surge Protection Device Revenue, (US$, Mn), 2020-2032
Figure 47. By Country – Middle East & Africa Whole House Surge Protection Device Revenue, Market Share, 2020-2032
Figure 48. By Country – Middle East & Africa Whole House Surge Protection Device Sales, Market Share, 2020-2032
Figure 49. Turkey Whole House Surge Protection Device Revenue, (US$, Mn), 2020-2032
Figure 50. Israel Whole House Surge Protection Device Revenue, (US$, Mn), 2020-2032
Figure 51. Saudi Arabia Whole House Surge Protection Device Revenue, (US$, Mn), 2020-2032
Figure 52. UAE Whole House Surge Protection Device Revenue, (US$, Mn), 2020-2032
Figure 53. Global Whole House Surge Protection Device Production Capacity (K Units), 2020-2032
Figure 54. The Percentage of Production Whole House Surge Protection Device by Region, 2024 VS 2032
Figure 55. Whole House Surge Protection Device Industry Value Chain
Figure 56. Marketing Channels