Key Statistics
Key Takeaways
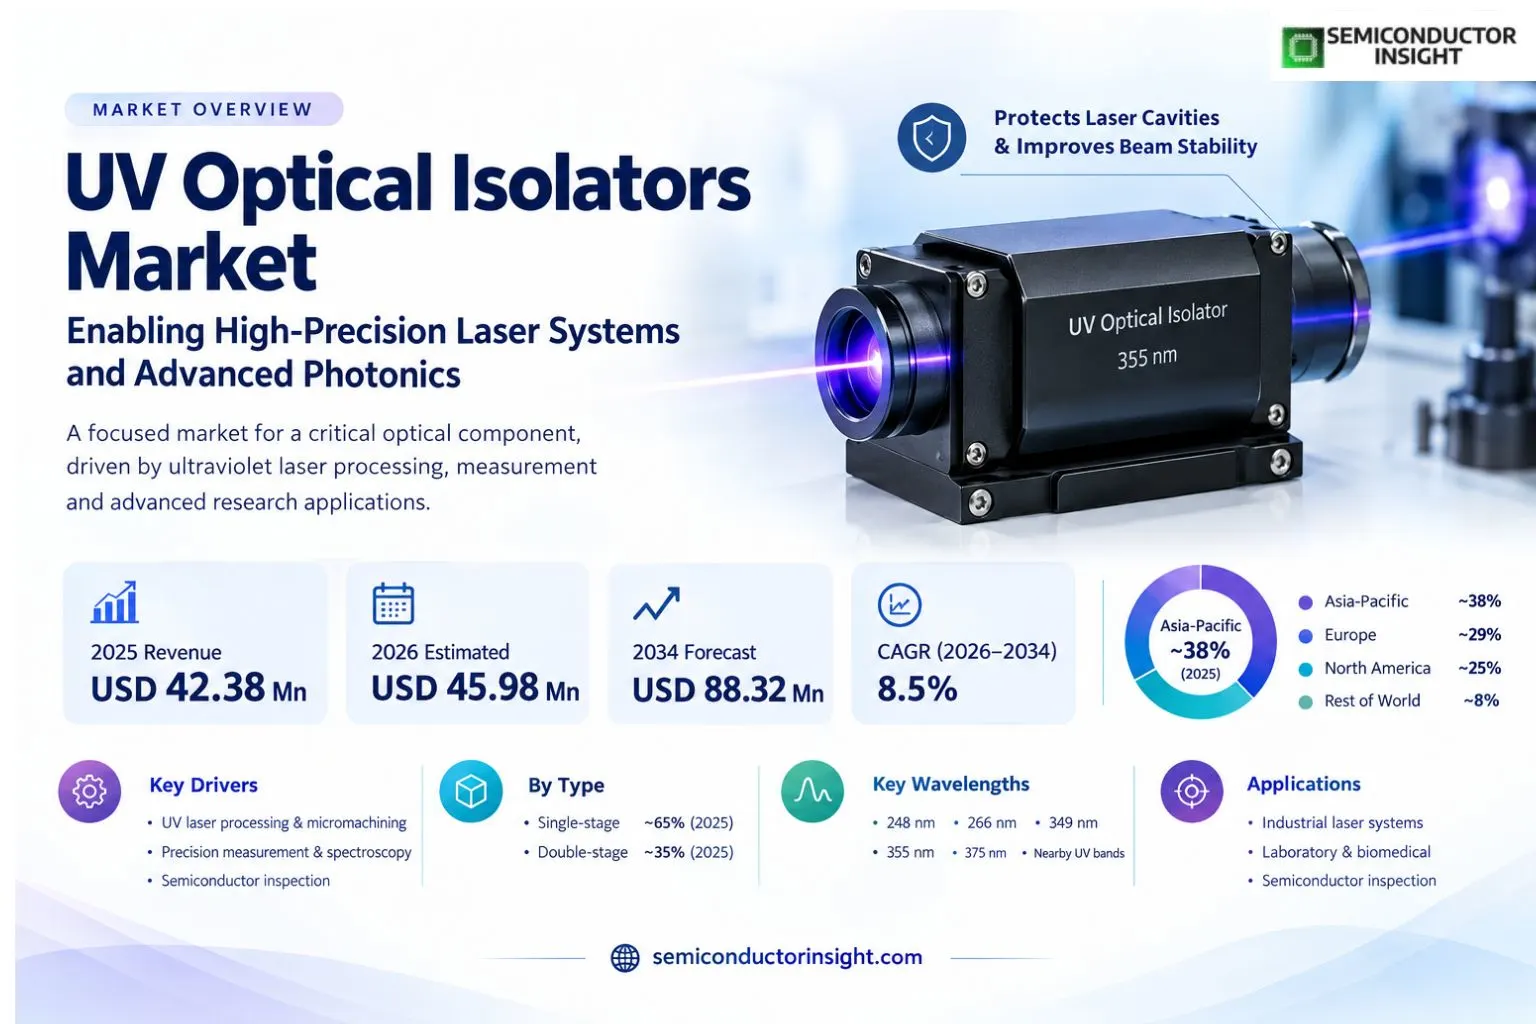
- Global demand: the UV optical isolators market was valued at USD 42.38 million in 2025 and is projected to reach USD 88.32 million by 2034, expanding at 8.5% as ultraviolet laser equipment becomes more precise and feedback-sensitive.
- Single-stage designs account for an estimated ~65% of type revenue in 2025 because compact Faraday rotators and polarizers meet the isolation needs of many laboratory, inspection and marking instruments without the optical losses of a second stage.
- Double-stage products represent an estimated ~35% of type revenue and are modeled to grow at ~9.4% CAGR where sensitive laser oscillators require higher reverse attenuation, although available ultraviolet wavelengths and power ratings vary materially by supplier.
- Semiconductor applications form the largest end-use category at an estimated ~43% of 2025 revenue; medical instruments contribute ~26%, telecommunications ~18% and other scientific and industrial systems ~13% under a mutually exclusive application allocation.
- Asia-Pacific demand holds an estimated ~38% regional share, followed by Europe at ~29% and North America at ~25%; regional leadership is an allocation informed by photonics manufacturing rather than a directly reported audited market share.
UV Optical Isolators Market Overview
UV optical isolators market connects a small but technically demanding component business to a wider shift in ultraviolet laser processing and measurement. Worldwide revenue was USD 42.38 million in 2025, is estimated at USD 45.98 million in 2026, and is projected to reach USD 88.32 million in 2034 at a 8.5% compound annual growth rate. Asia-Pacific represents an estimated ~38% of 2025 demand, supported by electronics production and optical-instrument assembly, while European suppliers retain specialized design capability.
An ultraviolet optical isolator is a non-reciprocal component placed in the beam path to reduce light returning toward a laser cavity. Its Faraday rotator and polarizing elements transmit the desired forward beam while attenuating reflections from lenses, workpieces, fibre couplers and other downstream optics. The purchase decision depends on wavelength, isolation, insertion loss, beam aperture, damage threshold, packaging and the mechanical stability of the alignment assembly. The relevant commercial unit is a finished optical isolator, not a laser source or a complete manufacturing machine.
The revenue boundary covers separately sold and OEM-integrated ultraviolet free-space Faraday isolators in single-stage and double-stage configurations, including wavelength-specific versions for 248 nm, 266 nm, 349 nm, 355 nm, 375 nm and nearby ultraviolet bands. It excludes stand-alone Faraday crystals, generic polarizers, finished laser systems, photodiodes and visible-only telecommunications components. Where a photonics manufacturer sells a complete ultraviolet laser, only the isolator component value belongs inside this defined product market; equipment sales are evidence of downstream demand rather than isolator revenue.
Performance trade-offs make the market different from high-volume electronic components. A 355 nm beam may require carefully selected coatings and rotator materials, while 266 nm deep-ultraviolet exposure raises optical absorption and lifetime concerns. A compact 3 mm or 4 mm aperture can reduce housing size but also restrict alignment tolerance for a larger beam. Designers compare isolation above 30 dB against forward transmission, and they must account for reflected power rather than treating a single catalogue attenuation figure as sufficient proof of application suitability.
Industrial laser upgrades support recurring purchases through equipment integration, refurbishment and replacement. Ultraviolet marking and micromachining use short wavelengths to concentrate energy on delicate materials; laboratory spectroscopy and biomedical imaging require stable low-noise illumination; semiconductor inspection needs repeatable beams during long operating cycles. These customers do not necessarily buy the same isolator design. Industrial integrators emphasize power handling and field life, whereas research buyers can prioritize spectral tuning, polarization extinction and rapid optical-bench reconfiguration.
The regional picture is not a direct census of isolator invoices. An estimated ~38% of 2025 revenue is assigned to Asia-Pacific, where laser-processing equipment and optoelectronic assembly are concentrated; Europe is modeled at ~29% because of precision photonics suppliers and scientific instrument production. North America is modeled at ~25% despite a separate publisher narrative favoring that region. This conflict is treated as an allocation uncertainty, not a reason to invent a more precise country revenue series or suppress the competing industrial evidence.
Segment Analysis: By Type
Single-stage isolators are the dominant ultraviolet configuration by modeled revenue, with an estimated ~65% share in 2025 and ~8.0% annual growth. Double-stage assemblies hold an estimated ~35% and a faster ~9.4% growth outlook, reflecting high-isolation specifications for selected laboratory and OEM systems. The two categories are differentiated by optical path design and rejection requirements, not by the application in which the component is installed.
| Type | Function and configuration | Market position |
|---|---|---|
| Single-stage | A single non-reciprocal Faraday rotation path provides reverse-light attenuation with relatively high forward transmission; selection is sensitive to the 266 nm, 355 nm or 375 nm wavelength and the beam aperture. | Largest type in 2025 (~65% share), with modeled ~8.0% CAGR. Typical demand comes from compact instruments and laser subsystems that value throughput, straightforward alignment and fewer coated surfaces. |
| Double-stage | A second isolation stage raises suppression of reflected light but introduces additional optical surfaces, insertion loss and alignment work; deep-UV availability must be checked for each vendor rather than assumed. | Estimated ~35% share in 2025 and modeled ~9.4% CAGR. Premium demand is associated with particularly sensitive laser resonators, higher-feedback paths and experiments where return light cannot be tolerated. |
Single-stage isolators: balancing throughput and protection
The single-stage choice starts with the permitted return signal rather than the headline price. CrystaLaser lists ultraviolet units at 266 nm, 355 nm and 375 nm with isolation specifications that vary by model; a 4 mm clear aperture is one of the catalogue configurations. Integrators compare optical throughput with the spatial envelope available between the laser head and downstream focusing optics. When the instrument operates at one fixed wavelength, a narrow optimized band can be preferable to a broadly tunable assembly with additional adjustment steps.
For the modeled ~65% type allocation, growth is tied to repeatable OEM builds and replacement orders rather than to an assumed uniform installed-base turnover. A 355 nm microprocessing station can require several optical components, but the isolator is only one part of that bill of materials. The distinction matters when evaluating the revenue impact of higher laser output power: a stronger laser may demand a different isolator rating without increasing the number of units in every instrument.
Double-stage isolators: high-rejection specialist demand
A second stage can materially improve isolation, yet the additional loss may be unacceptable in photon-limited experiments. TOPTICA describes double-stage products with reverse attenuation exceeding 60 dB for supported wavelength ranges, while its ultraviolet offering is not identical to its visible and near-infrared catalogue. Buyers must confirm the actual ultraviolet wavelength and avoid applying a 660 nm specification to a 355 nm order. That technical qualification is a commercial differentiator for suppliers offering custom optics and factory alignment.
Double-stage revenue is modeled at ~35% of the 2025 total, with ~9.4% growth as sensitive sources and precision measurement systems gain share. This does not imply that every UV isolator can be upgraded by adding another stage. Magneto-optic rotation, coating survivability, magnetic housing dimensions and beam divergence may require a different mechanical platform, especially for shorter wavelengths or higher pulse energy. Premium designs therefore compete on engineering support and lifetime evidence as much as on nominal attenuation.
Segment Analysis: By Application
Semiconductor equipment is the largest modeled application at ~43% of 2025 revenue, followed by medical instrumentation (~26%), telecommunications and specialty optical networks (~18%) and other scientific or industrial uses (~13%). These are primary end-use classifications: an isolator installed in a semiconductor laser-inspection tool is counted once under semiconductor, even if the same laser architecture could also serve a medical laboratory.
| Application | Demand characteristics |
|---|---|
| Semiconductor | Largest application (~43% share) and modeled ~9.4% CAGR. Ultraviolet laser inspection, packaging micromachining and precision material processing create demand for stable beam delivery. Qualification weighs contamination control, uptime, vibration tolerance and the ability to manage back-reflections from patterned substrates. |
| Medical | Estimated ~26% share with ~8.8% modeled CAGR. Flow cytometry, fluorescence microscopy and diagnostic instruments value stable short-wavelength excitation, compact optics and predictable noise. Lower-power instruments may choose a small-aperture isolator, while more demanding platforms require tighter wavelength-specific alignment. |
| Telecommunication | Estimated ~18% share and ~7.4% modeled CAGR. Demand is concentrated in research, specialized optical links and laboratory photonics rather than ordinary fibre network isolators, which commonly operate at longer wavelengths and fall outside the ultraviolet product boundary. |
| Others | Estimated ~13% share with ~6.1% modeled CAGR. University spectroscopy, industrial prototypes, metrology benches and customized laser demonstrations generate fragmented orders with long specification discussions and smaller production runs than established semiconductor equipment programmes. |
Semiconductor users often purchase isolators as one item within a validated optical train. Reflection from a coated wafer, package surface or focusing lens can destabilize a source even when average laser power remains within specification. The relevant buying cycle therefore follows equipment qualification and maintenance schedules rather than annual semiconductor chip shipments one-for-one. A customer may retain the same approved 355 nm isolator for multiple machine generations if its mechanical interface and optical loss remain acceptable.
Medical and research applications have a different cost structure because low-noise fluorescence measurements can be sensitive to beam fluctuations that would be inconsequential in marking. The availability of 349 nm, 355 nm and 375 nm laser sources widens the set of excitation architectures, but it does not establish isolator shipment volumes. In the modeled ~26% medical category, specialized distributor support and integration testing can account for a meaningful portion of supplier differentiation without being counted as separate market revenue.
Regional Analysis
Asia-Pacific leads the modeled 2025 allocation with ~38% share and a ~9.3% regional CAGR, followed by Europe at ~29% and ~8.0%, and North America at ~25% and ~7.4%. South America (~5%, ~8.8% CAGR) and Middle East & Africa (~3%, ~10.9% CAGR) are smaller specialist markets. The shares represent estimated isolator demand, not the location of every upstream crystal supplier or the output value of complete UV laser systems.
How do regional UV laser ecosystems shape isolator purchasing?
Manufacturing location and final customer location are distinct. A European optical component may be installed in a laser assembled in China and ultimately sold to an American laboratory. For regional demand allocation, the model follows the intended end market of the isolator-bearing system rather than counting the component again at each border crossing. This avoids treating the value of a laser, an isolator and the finished processing machine as three separate instances of ultraviolet isolation demand.
The regional growth ranking is driven by the mix of electronics equipment investment, laser research, healthcare instrumentation and the availability of specialized photonics distribution. Asia-Pacific has the largest modeled share at ~38%, while the Middle East & Africa has the highest modeled rate at ~10.9% from a much smaller starting base. Europe retains important precision optical design capabilities; North America benefits from scientific laboratories and established equipment integrators. None of these modeled rates is a published national isolator sales statistic.
| Region | Position | Growth outlook | Demand profile | What decides supplier selection |
|---|---|---|---|---|
| Asia-Pacific | Largest (~38%) | ~9.3% CAGR | Electronics assembly, optical instrumentation and laser micromachining | Wavelength availability, OEM qualification and import lead time |
| Europe | Second (~29%) | ~8.0% CAGR | Specialist photonics engineering and laboratory lasers | Optical performance documentation and custom integration |
| North America | Third (~25%) | ~7.4% CAGR | Scientific research, laser OEMs and medical instrumentation | Domestic service, laser safety and traceable specifications |
| South America | Smaller (~5%) | ~8.8% CAGR | Imported instruments and industrial laser service | Distributor inventory and landed component cost |
| Middle East & Africa | Emerging (~3%) | ~10.9% CAGR | Research institutes and selective advanced manufacturing | Procurement support and installation expertise |
Competitive Landscape of UV Optical Isolators
Competition is concentrated among specialist optical component designers and photonics equipment suppliers rather than broad semiconductor manufacturers. The three named product-market participants are Thorlabs, TOPTICA and CrystaLaser. Their roles differ: catalogue distribution, laser-system integration and wavelength-specific Faraday component engineering create separate routes to customers. Other optical suppliers and ultraviolet laser manufacturers inform the ecosystem, but adjacent lasers or polarizers are not counted as isolator vendors without a qualifying product.
CrystaLaser publishes individual ultraviolet isolator configurations, including models centered on 266 nm, 355 nm and 375 nm, with model-specific transmission, aperture and isolation data. This creates a specification-led sales channel for OEMs that know their beam geometry. An integrator may require a 3 mm or 4 mm aperture and a rejection path that safely handles returned energy, making the supplier’s drawing and operating conditions more consequential than a broad claim of high isolation.
TOPTICA sells precision optical components and laser systems, including tunable free-space isolators with stated single-stage performance and a separate range of double-stage products. Its published specifications distinguish the available wavelength bands for each stage configuration. Buyers seeking a deep-ultraviolet double-stage unit should obtain a wavelength-specific quotation rather than extrapolate from the visible-range portfolio. This differentiation matters because engineering capability does not imply that every listed isolation figure applies to every ultraviolet laser.
Thorlabs reaches researchers and equipment developers through an extensive photonics distribution channel, while specialist resellers can help users locate wavelength-matched products and accessories. A distributor’s catalogue listing should not be mistaken for proof that it manufactures the isolator. For OEM procurement, qualification commonly involves a bill-of-materials part number, optical performance test, mechanical fit check and replacement supply agreement. These steps can create customer retention even where several vendors publish similar nominal attenuation ratings.
The market has limited transparent, comparable revenue disclosures for ultraviolet isolators alone. A laser maker’s consolidated sales, a distributor’s photonics revenue or a laboratory’s equipment budget cannot be used as the isolator market share of that organization. Competitive positioning is therefore assessed through verified product offerings, wavelength coverage, engineering support and access to end customers. The modeled regional and application allocations should not be read as measured supplier shares or audited concentration ratios.
Tier structure
| Tier | Companies | Basis of competition |
|---|---|---|
| Tier 1 | Thorlabs; TOPTICA; CrystaLaser | Named product-market participants with optical isolator catalogue or engineering capability; competitive positions are qualitative, not a revenue ranking. |
| Tier 2 | Specialist optical distributors and qualified OEM integration partners | Channels for wavelength-specific procurement, service and custom mounts; reseller activity is distinguished from original manufacture. |
| Adjacent | Coherent; IPG Photonics; MKS Spectra-Physics; Photonics Industries | UV laser system providers that influence isolator specifications and downstream demand; not automatically direct isolator competitors. |
Key companies profiled
- Thorlabs — photonics catalogue and system-integration supply
- TOPTICA Photonics — wavelength-tunable isolation and custom optical components
- CrystaLaser — compact ultraviolet Faraday isolators and wavelength-specific models
Production Capacity, Technology and Qualification
Ultraviolet isolator production is a specialized optical assembly process with lower unit volumes and more model variation than mainstream optoelectronic devices. Capacity depends on qualified magneto-optic materials, polarizers, coatings, magnets, precision machining and test equipment. The final assembly must be verified at the intended wavelength and beam geometry, so a supplier’s broad optical component output is not a reliable proxy for available 266 nm or 355 nm isolator capacity.
The optical path typically contains a Faraday rotator, polarizing elements and a magnet assembly inside a mechanically stable housing. Material absorption and coating durability become increasingly demanding toward the deep ultraviolet, where a component designed for 375 nm cannot simply be relabeled for 248 nm service. Production yield depends on optical quality, rotation accuracy and alignment repeatability. Even when a supplier can machine housings quickly, its throughput may be limited by test time and the availability of qualified coated optics.
Laser OEM qualification often starts with a sample lot tested for insertion loss, reverse attenuation, beam pointing and thermal behavior. A design that passes an optical-bench demonstration may still fail an industrial requirement if vibration, duty cycle or contamination changes its performance. High-power pulsed ultraviolet systems require attention to peak fluence as well as average wattage, and rejection-port design can matter when reflected energy is concentrated. The market rewards suppliers able to document these operating limits rather than advertise one maximum power figure.
The component business is also exposed to customization risk. Small changes in center wavelength, clear aperture or mounting envelope can require a new optical layout and acceptance test. A vendor serving laboratory customers may keep flexible inventory, whereas an OEM programme may require locked drawings and long-term part traceability. This split affects margins, lead times and the pace at which new wavelength variants reach commercial use. It also explains why demand growth need not translate into proportional factory floor expansion.
UV Optical Isolators Market Dynamics and Growth Opportunities
Growth reflects expanding ultraviolet laser use in precision processing and measurement, tempered by specialized coating costs and application-specific qualification. The contribution model attributes 11.50 percentage points of gross annual growth to five drivers and subtracts 3.00 points across three restraints, producing the modeled annual growth rate. These contributions are an analytical decomposition of the forecast, not independently measured causal coefficients or a claim that each factor changes all customer segments equally.
MARKET DRIVERS
Drivers Impact Analysis*
| Market Drivers | Impact Rank | CAGR Contribution (%) | 2026–2028 | 2029–2031 | 2032–2034 |
|---|---|---|---|---|---|
| UV semiconductor processing and inspection | High | +3.40% | High | High | High |
| Precision laser micromachining investment | Medium-High | +2.90% | High | High | Medium |
| Biomedical and spectroscopy instrumentation | Medium | +2.20% | Medium | High | High |
| Higher laser stability and feedback control | Low-Medium | +1.80% | Medium | Medium | High |
| Others (custom optics and laboratory upgrades) | Low | +1.20% | Medium | Medium | Low |
Semiconductor processing creates a repeatable optical qualification need
Ultraviolet processing and inspection systems must maintain stable beam properties while interacting with reflective wafers, packages and optical surfaces. Back-reflections can disturb the source and reduce measurement repeatability, making a properly specified isolator valuable even when its price is small relative to the equipment. This driver contributes an estimated +3.40 percentage points to annual market growth. The effect is strongest where OEM platforms move from prototype builds to validated production configurations and retain the same optical component across multiple machines.
Short-wavelength industrial lasers widen equipment integration
Industrial users employ 355 nm ultraviolet beams for marking, micromachining and material removal on heat-sensitive substrates. As laser suppliers increase throughput and reliability, system designers pay more attention to protecting the source from reflected energy throughout the operating cycle. The modeled contribution is +2.90 percentage points. This is not a direct multiplication of laser wattage by isolator demand: higher-power systems may use a more expensive protective assembly while some enclosed laser heads already incorporate the required optical isolation.
Medical optics rewards low-noise excitation stability
Fluorescence instruments and advanced microscopy require controlled illumination, especially when weak signals are measured against a low-noise background. A small optical feedback path can change the laser’s stability and compromise measurement quality. The modeled +2.20 percentage-point contribution comes from growing instrument sophistication rather than from a universal requirement that every medical UV source contain a Faraday isolator. The purchasing decision remains sensitive to available wavelengths, space, alignment and transmission loss.
Feedback-sensitive lasers increase premium component value
Precision sources may operate close to limits where reflected light produces amplitude fluctuations, mode instability or cavity disturbances. Higher-isolation designs can be justified when the reduction in measurement error outweighs insertion loss and component cost. This factor adds an estimated +1.80 percentage points to annual growth, with demand concentrated in systems that have difficult optical feedback paths. The opportunity is selective because some applications can reduce reflection through beam-path redesign or tilted optics without adding another isolation stage.
Custom wavelength projects and replacement cycles support specialist suppliers
Smaller research and industrial programmes periodically require nonstandard center wavelengths, beam apertures or mounting geometries. These orders can command engineering attention and may later become standardized OEM parts if the underlying instrument scales. The residual modeled driver contributes +1.20 percentage points and is intentionally separated from the larger industrial and medical channels. Replacement demand also exists when coatings degrade or mechanical assemblies are damaged, but service events are not assumed to occur at a fixed annual rate.
MARKET RESTRAINTS
Restraints Impact Analysis*
| Market Restraints | Impact Rank | CAGR Contribution (%) | 2026–2028 | 2029–2031 | 2032–2034 |
|---|---|---|---|---|---|
| Ultraviolet coating and material costs | High | -1.20% | High | High | Medium |
| Qualification time and limited wavelength availability | Medium | -0.90% | High | Medium | Medium |
| Others (insertion loss and alternative reflection controls) | Low | -0.90% | Medium | Medium | Low |
Coatings and rotator materials limit easy scale-up
Deep-ultraviolet optical assemblies need materials and coatings that preserve performance under short-wavelength exposure. Higher rejection specifications can require additional optical surfaces, more testing and careful thermal design. The modeled restraint subtracts 1.20 percentage points from annual growth because production yield and qualification cost can keep selling prices high and delay adoption in price-sensitive equipment. The cost problem is more acute for custom low-volume wavelengths than for a mature 355 nm configuration with an established supply chain.
OEM validation delays conversion from inquiry to revenue
An isolator may be evaluated for months before an equipment maker locks the design, particularly if beam pointing, mechanical fit and lifetime must be checked under realistic duty cycles. The modeled negative contribution is 0.90 percentage points. This is a timing restraint rather than evidence that customers do not need feedback control. A supplier can reduce the delay by offering clear wavelength-specific specifications, sample traceability and integration drawings that fit the customer’s existing optical assembly.
Alternative beam-path designs reduce the addressable socket count
Not every ultraviolet laser architecture requires a separately purchased Faraday isolator. Some systems reduce reflections using tilted optics, beam dumps, optical coatings or integrated source protection, while others operate at power levels where a simpler solution is adequate. The resulting demand reduction is assessed at 0.90 percentage points, particularly in equipment with integrated optical feedback management. It also limits the validity of forecasting isolator units directly from ultraviolet laser shipments, because the number of protected optical paths varies across instruments and applications.
MARKET OPPORTUNITIES
Application-specific 266 nm and 355 nm variants
A supplier able to verify transmission, rejection and damage resistance at short ultraviolet wavelengths can address projects that general-purpose visible isolators cannot serve. Customers may accept a longer qualification cycle when a component protects a costly laser source. This creates opportunities for carefully documented custom designs and higher-value OEM partnerships, particularly where the beam aperture and mechanical envelope must remain fixed during a system redesign.
Compact modules for biomedical and scientific instruments
Space-constrained measurement systems create demand for small housings, predictable alignment and low optical loss. A manufacturer that can supply a compact isolator with reliable mounting and technical drawings may be selected early in instrument development. The opportunity is not limited to new laboratories; established systems can also require replacement parts when a source wavelength changes or an optical train is upgraded for better signal stability.
Long-life components for industrial UV equipment
Laser sources are being designed for longer maintenance intervals, increasing the importance of every optical element in the beam path. A component supplier can differentiate through coating durability, environmental testing and repeatable production tolerances. If the isolator avoids an unscheduled equipment shutdown, its economic value to an industrial customer may exceed the initial purchase price, supporting premium specifications without implying a universal rise in unit selling prices.
UV Optical Isolators Supply Chain and Value Creation
The value chain begins with optical-grade materials and coating processes, proceeds through magneto-optic assembly and wavelength-specific testing, and ends with laser OEMs, research buyers and maintenance channels. Technical risk is concentrated at the interfaces between these stages. A polarizer may meet its standalone specification yet perform poorly after integration if beam angle, heat or housing stress changes, so acceptance testing at the final assembly level remains important.
Materials. The ultraviolet region imposes different absorption and coating requirements from visible and near-infrared optics. Suppliers must select polarizing and magneto-optic materials for the intended center wavelength and the expected optical fluence. A design that works at 375 nm may not remain efficient at 266 nm, so material qualification is a source of engineering cost. The supply chain also depends on machining and magnetic assembly tolerances that affect beam alignment and final insertion loss.
Assembly. The manufacturer integrates the rotator, polarizers and magnetic housing, then verifies the optical path against acceptance limits. Isolation in decibels, forward transmission, clear aperture and mechanical fit must be evaluated together. High-rejection variants may need additional alignment steps, and industrial versions may require environmental testing. A customer’s ability to order the same qualified assembly repeatedly can be more valuable than a marginal improvement in a single catalogue specification.
Commercial channels. Some isolators are sold directly to laser OEMs under a controlled part number; others reach laboratories through specialist photonics distributors. The direct route supports engineering customization and predictable production planning, while catalogue channels offer faster access to small quantities. Both routes require accurate wavelength and power information. A distributor’s gross sales should not be conflated with the component manufacturer’s revenue when assessing the market boundary.
Installed systems. The isolator protects the optical source against unwanted feedback, but it is not a substitute for overall laser safety or a guarantee against every type of source damage. Service teams may replace the component after alignment drift, coating degradation or accidental mechanical damage. End users evaluate downtime risk, optical stability and replacement availability; these factors determine whether a premium design is economical even in an instrument with relatively low annual operating hours.
Recent Developments in Ultraviolet Lasers and Isolation Components
- 21 October 2025 Updated
Photonics Industries announced an enhanced DX-355-50 ultraviolet nanosecond laser delivering 50 W at 100 kHz, with pulse energy above 1 mJ and pulse duration near 12 ns. The product development is relevant because faster industrial processing places more stringent demands on the stability of downstream beam paths. It is evidence of adjacent UV laser capability, not a published shipment or revenue figure for optical isolators. Source - 23 June 2025 Launched
MKS introduced its Spectra-Physics Talon APX ultraviolet nanosecond laser family with 15–30 W output and a stated 40,000-hour UV operating-life capability. Longer service intervals can shift equipment integrators toward optical components with comparable durability and documented environmental performance. The announcement concerns the laser source itself; the isolator opportunity depends on the actual optical train and must not be inferred as one unit per laser. Source - 30 June 2025 Introduced
A Japanese photonics distributor highlighted the Cobolt Kizomba 349 nm laser for flow cytometry, describing output up to 50 mW and narrow-linewidth low-noise operation. This illustrates the medical-instrument demand for stable ultraviolet excitation. Whether an isolator is needed depends on feedback sensitivity and system architecture, so the laser product announcement is used as an application signal rather than direct isolator market revenue. Source - 2026 product portfolio Specified
TOPTICA published tunable free-space optical isolator specifications covering ultraviolet and longer wavelengths, including single-stage designs exceeding 35 dB isolation and separate double-stage designs exceeding 60 dB in supported ranges. The distinction between ranges matters to engineers seeking a particular ultraviolet part. The portfolio information establishes technical capability and commercial product scope, but it does not establish a new product launch date or company market share. Source - 2026 product catalogue Available
CrystaLaser listed compact Faraday optical isolators with ultraviolet center wavelengths including 266 nm, 355 nm and 375 nm, together with individual aperture, transmission and attenuation characteristics. Its model-specific entries show why procurement must check more than a generic ultraviolet label. The catalogue is used to verify product availability and technical choices; no unsupported claim about a newly introduced model or annual sales volume is made. Source - 2026 product specifications Documented
Coherent maintained ultraviolet laser options within its OBIS LG and XT portfolio, including sources near 320 nm, 349 nm, 355 nm and 360 nm for scientific and biomedical optical systems. This range demonstrates the diversity of wavelengths encountered by instrument designers and the need for matching protective optics. It remains adjacent demand evidence rather than a direct announcement of ultraviolet isolator production capacity. Source
REPORT SCOPE & SEGMENTATION
| Attribute | Details |
|---|---|
| Study Period | 2021–2034 |
| Base Year | 2025 |
| Estimated Year | 2026 |
| Forecast Period | 2026–2034 |
| Historical Reference | 2023 |
| Market Size 2025 | USD 42.38 million |
| Market Size 2026 | USD 45.98 million |
| Market Size 2034 | USD 88.32 million |
| Growth Rate | CAGR of 8.5% from 2025–2034 |
| Unit | Revenue in USD million |
| Segmentation | By Type, By Application, and By Region |
| By Type | Single-stage · Double-stage |
| By Application | Telecommunication · Semiconductor · Medical · Others |
| By Region | Five global regions, with country-level application and supplier-access discussion North AmericaUnited States, Canada, Mexico EuropeGermany, France, United Kingdom, Italy, Russia and other Europe Asia-PacificChina, Japan, South Korea, Taiwan, India and Southeast Asia South AmericaBrazil, Argentina, Chile, Colombia and other South America Middle East & AfricaSaudi Arabia, UAE, Israel, South Africa, Egypt and other countries |
| Key Companies Profiled | Thorlabs; TOPTICA Photonics; CrystaLaser |
| Customization Scope | Optional customization covers wavelength-specific products, industrial versus laboratory use, OEM supply routes, regional demand scenarios and deeper comparisons of single-stage and double-stage optical isolation. |
Frequently Asked Questions
How large is the ultraviolet optical isolators market?
Global UV optical isolator revenue is estimated at USD 42.38 million in 2025 and is projected to reach USD 88.32 million by 2034, representing a 8.5% CAGR. The outlook reflects increasing demand for short-wavelength laser stability in industrial and scientific equipment, while the product boundary excludes the value of complete ultraviolet lasers and other optical instruments.
What is the function of a UV Faraday isolator?
The component allows a selected ultraviolet laser beam to travel forward while attenuating light reflected back toward the source. A magneto-optic rotator and polarizing optics create the non-reciprocal effect. Correct selection requires checking the operating wavelength, beam diameter, reverse isolation, insertion loss and power rating; an optical isolator does not replace broader laser safety procedures or guarantee protection under every fault condition.
Which UV optical isolator type has the largest market share?
Single-stage designs are assigned an estimated ~65% of 2025 type revenue because their simpler optical path can provide useful feedback suppression with lower insertion loss and a compact footprint. Double-stage designs represent about ~35% and address more demanding rejection requirements. Actual availability at 266 nm or 355 nm must be confirmed by supplier; a visible-range double-stage specification cannot automatically be transferred to deep-ultraviolet use.
Which end-use application buys the most ultraviolet optical isolators?
Semiconductor applications lead the modeled allocation at ~43%, reflecting inspection, laser-assisted processing and precision equipment that must control reflected light. Medical instruments follow at ~26%, specialty telecommunications and photonics research at ~18%, and other scientific and industrial uses at ~13%. These are mutually exclusive primary-use categories, not independently audited transaction shares.
Which region leads global demand for UV optical isolation?
Asia-Pacific is modeled as the largest regional destination with ~38% of 2025 revenue and a ~9.3% regional CAGR. Europe follows at ~29%, while North America holds ~25% under the same allocation. The ranking reflects equipment production and photonics activity; competing narrative claims of North American leadership are not converted into a precise audited figure without consistent underlying sales data.
How does a single-stage device differ from a double-stage design?
A single-stage unit uses one non-reciprocal isolation path and is generally simpler to align. A double-stage assembly adds another isolation path to achieve stronger reverse attenuation at the cost of additional optics and potentially greater insertion loss. The appropriate design depends on how much feedback a laser can tolerate, the available space and the actual wavelength-specific performance promised by the manufacturer.
Why are 355 nm and 266 nm specifications important?
These wavelengths serve different ultraviolet processing and measurement applications, and optical coatings or rotator materials may not behave identically at both. A model optimized around 355 nm may offer a different transmission and attenuation profile at 266 nm, if it operates there at all. Engineers therefore need a stated operating band and beam-aperture specification instead of relying on the broad label ultraviolet compatible.
Who are the main named suppliers of UV optical isolators?
The identified product-market participants are Thorlabs, TOPTICA and CrystaLaser, each reaching customers through different combinations of catalogue sales, photonics engineering and OEM integration. Companies that sell ultraviolet laser sources or separate polarizing optics are relevant to the supply chain but are not automatically counted as direct isolator manufacturers. Supplier comparisons are based on verified product offerings rather than unavailable isolator-only revenue disclosures.
What limits market growth despite stronger demand for UV lasers?
Specialized ultraviolet coatings, material absorption, wavelength-specific engineering and lengthy OEM qualification can delay purchases. Some systems also manage reflections through tilted optics or integrated source protection, reducing the need for a separate isolator. These restraints matter most where the component price or alignment complexity is high relative to the value of the laser system being protected.
What should an OEM verify before ordering a UV optical isolator?
The purchasing specification should state center wavelength and tolerance, expected forward power and peak pulse fluence, beam diameter, polarization, allowable insertion loss, required reverse attenuation and the mechanical envelope. A rejection port may be important when significant reflected energy is present. Sample testing under actual duty-cycle conditions is preferable to selecting a part solely from a nominal decibel rating or a broad product-family description.
Research Sources & Evidence Base
Get Sample Report PDF for Exclusive Insights
Report Sample Includes
- Table of Contents
- List of Tables & Figures
- Charts, Research Methodology, and more...
 Download Sample Report PDF