
MARKET INSIGHTS
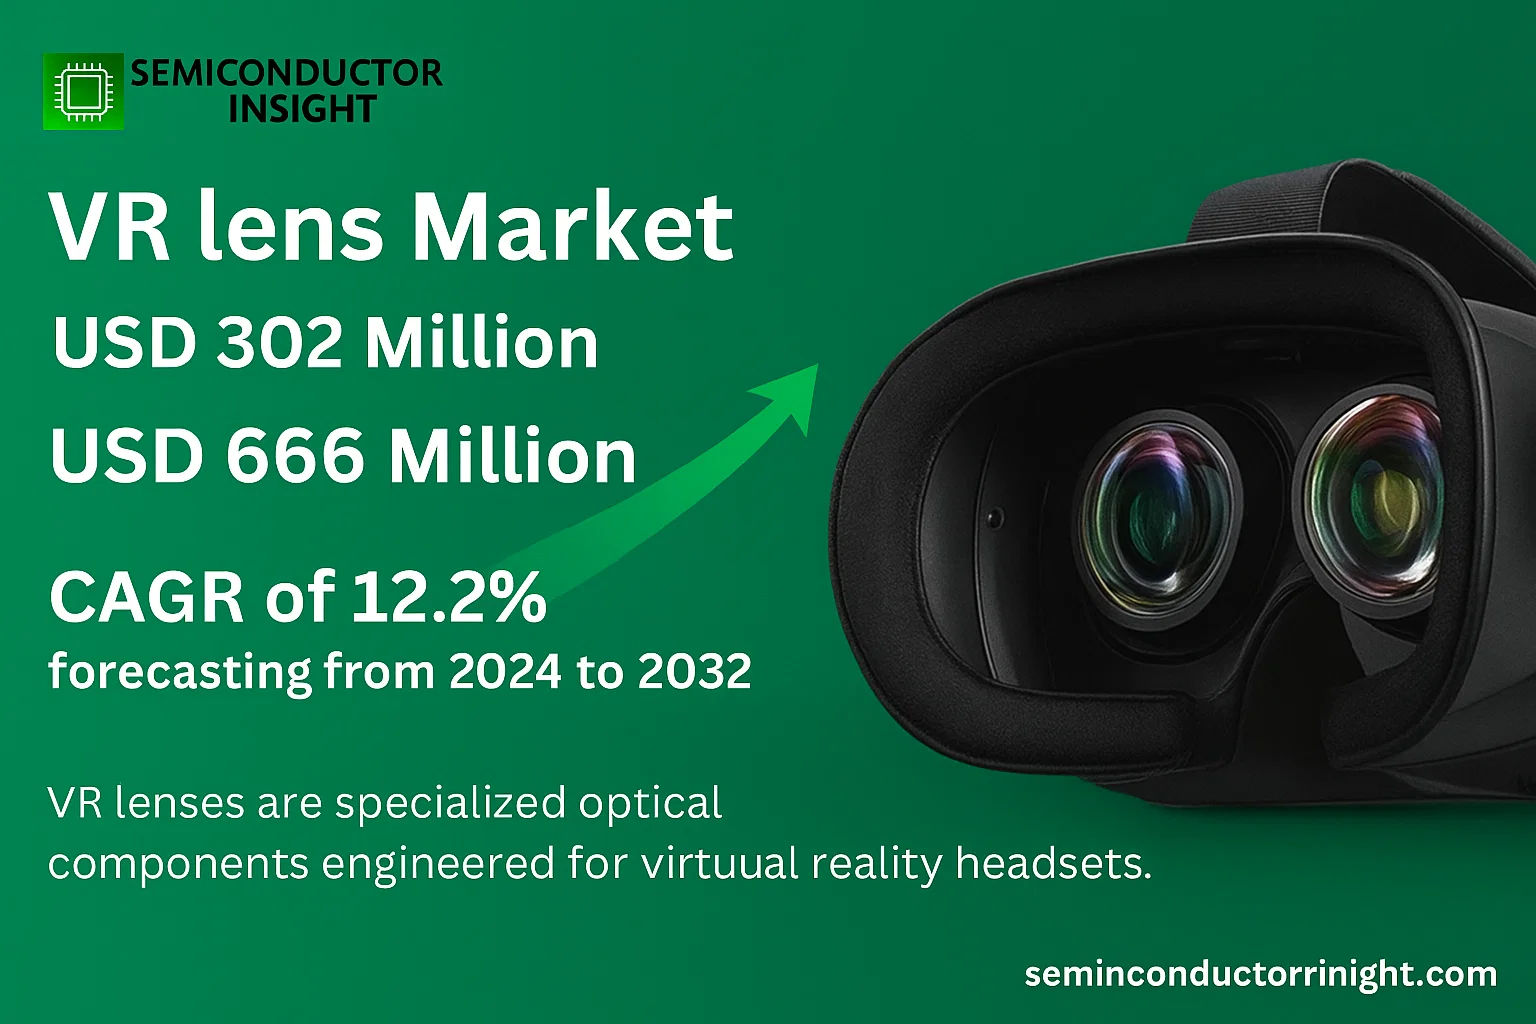
Global VR lens Market was valued at USD 302 million in 2024 and is projected to reach USD 666 million by 2032, exhibiting a CAGR of 12.2% during the forecast period.
VR lenses are specialized optical components engineered for virtual reality headsets. They are designed to simulate the human eye’s field of view and correct for optical distortions, providing a more immersive experience. Key categories include Fresnel lenses, which are lightweight and cost-effective, and non-Fresnel (or spherical/aspheric) lenses, which offer higher clarity but at increased cost and weight.
The market growth is primarily driven by the expanding consumer electronics and gaming sectors, where VR adoption is accelerating. The rising demand for high-quality visual experiences in these applications is pushing manufacturers to innovate. Additionally, increasing investments in industrial and medical applications of VR, such as in training simulations and surgical planning, are creating new growth avenues. However, the market faces challenges from the high cost of advanced lens systems and the complexity of integrating them into existing hardware.
Geographically, China is the dominant production hub, accounting for about 60% of the global market. This is largely due to its extensive electronics manufacturing ecosystem and the presence of major players like Goertek and Sunny Optical Technology. North America and Europe are also significant markets, primarily driven by high consumer demand and strong R&D investments.
MARKET DRIVERS
Rising Adoption of VR Headsets Across Industries
The primary driver for the VR lens market is the expanding use of virtual reality headsets, not only in gaming and entertainment but also in enterprise applications. Sectors such as healthcare for surgical simulation, real estate for virtual property tours, and manufacturing for design prototyping are increasingly integrating VR technology. This widespread adoption directly fuels the demand for high-quality, specialized VR lenses that deliver immersive and comfortable visual experiences for prolonged use.
Technological Advancements in Optical Design
Continuous innovation in optical engineering is a significant market driver. Manufacturers are developing lenses with improved field of view (FOV), higher resolution, and reduced screen-door effect. The development of advanced lens materials, including high-refractive-index polymers and hybrid aspherical elements, allows for thinner, lighter, and more distortion-free lenses. These enhancements are critical for reducing user fatigue and increasing the overall appeal of VR systems.
➤ The global market size for VR headsets is projected to grow significantly in the coming years, directly correlating with the demand for integrated optics.
Furthermore, the growing consumer expectation for premium visual fidelity is pushing headset manufacturers to prioritize lens quality as a key differentiator. This focus on superior optics to enhance immersion and realism ensures sustained investment and development in the VR lens segment.
MARKET CHALLENGES
High Manufacturing Costs and Technical Precision
The production of high-performance VR lenses requires extremely precise molding and coating processes to minimize optical aberrations like chromatic distortion and god rays. Achieving this level of precision with materials that are also durable and lightweight leads to high manufacturing costs. These costs can be a barrier to producing affordable consumer-grade headsets, creating a challenge for market penetration in price-sensitive segments.
Other Challenges
Addressing the Vergence-Accommodation Conflict
A fundamental optical challenge in VR is the vergence-accommodation conflict, where the eyes’ focus (accommodation) does not naturally match the 3D depth cues (vergence) provided by the fixed-focus lenses. This discrepancy can cause visual discomfort, eyestrain, and nausea for some users, a phenomenon known as VR sickness. Developing lens solutions, such as varifocal or light field displays, to mitigate this issue remains a complex and costly engineering hurdle.
Standardization and Compatibility
The lack of standardization across different VR headset platforms presents a challenge for lens manufacturers. Lenses must be specifically designed to match the unique display panels, software distortion profiles, and physical housing of each headset model. This limits the potential for universal or interchangeable lenses, requiring custom development for each application and increasing complexity.
MARKET RESTRAINTS
Market Saturation and Slower-than-Expected Consumer Adoption
While enterprise adoption is growing, the consumer VR market has not expanded as rapidly as some initial projections suggested. High initial costs for high-fidelity headsets and a sometimes limited library of compelling content have tempered widespread consumer adoption. This slower growth in the overall VR hardware market acts as a direct restraint on the demand for VR lenses, as volume production is critical for achieving economies of scale and reducing costs.
Intense Competition and Price Pressure
The VR lens market is characterized by intense competition among established optical manufacturers and new entrants. This competition, coupled with the price sensitivity of the consumer electronics market, creates significant downward pressure on lens pricing. Manufacturers are constrained in their ability to invest in next-generation R&D when profit margins are continually squeezed, potentially slowing the pace of innovation.
MARKET OPPORTUNITIES
Emergence of AR/VR Convergence and Metaverse Applications
The growing interest in the metaverse and the convergence of augmented and virtual reality (AR/VR) presents a significant opportunity. These platforms demand advanced optical systems that can seamlessly blend digital content with the real world or create persistent virtual environments. This trend will drive the need for innovative lens technologies, such as pancake lenses for slimmer form factors and specialized coatings for mixed-reality passthrough, opening new revenue streams for lens developers.
Customization and Prescription Lenses
There is a substantial opportunity in addressing the needs of the large percentage of the population that requires vision correction. Developing easily integrable prescription lens inserts or designing headsets with built-in diopter adjustment mechanisms can significantly enhance accessibility and comfort. Tapping into this underserved market segment can drive sales and foster greater inclusivity within the VR ecosystem.
Advancements in Varifocal and Eye-Tracking Technology
The integration of eye-tracking with advanced lens systems represents a frontier for growth. Varifocal lenses that dynamically adjust focus based on the user’s gaze can fundamentally solve the vergence-accommodation conflict. Companies that pioneer the mass production of reliable and cost-effective adaptive optics for VR will be well-positioned to lead the next wave of immersive technology.
VR Lens Market Trends
Robust Market Growth Fueled by Expanding VR Ecosystem
The global VR Lens market is experiencing significant expansion, with the market valued at $302 million in 2024 and projected to reach $666 million by 2032. This represents a compound annual growth rate (CAGR) of 12.2%. A primary driver of this trend is the increasing adoption of virtual reality across a multitude of sectors, creating substantial demand for the specialized optical components required for high-quality near-eye displays (NEDs). These lenses are engineered to precisely simulate the human eye’s characteristics, including its size, position, and field of view, which is critical for an immersive user experience.
Other Trends
Dominance of Chinese Manufacturing and Key Players
The production landscape is heavily concentrated, with China being the leading production region, accounting for approximately 60% of the global market. The industry is further consolidated among a few key manufacturers, with the top two companies, Goertek and Sunny Optical Technology, collectively holding a market share exceeding 66%. This concentration gives these players significant influence over production capacity, innovation, and pricing.
Application Diversity and Gaming Leadership
The application of VR lenses is diversifying, though the gaming and entertainment sector remains the dominant end-user, representing the most significant application segment. This is closely followed by retail and marketing, where virtual showrooms and interactive advertisements are gaining traction. The remote education segment is also emerging as a key area of growth, reflecting a broader trend towards digital and immersive learning solutions.
Technological Segmentation and Optical Design
From a technological standpoint, the market is segmented primarily into Fresnel and Non-Fresnel lenses, each with distinct optical properties suited for different VR headset designs. The unique design of VR lenses, where the aperture is located on the front rather than inside, is a critical trend. This allows the imaging system’s entrance pupil to be positioned within the headset exactly where the human eye would be, enabling accurate testing and ensuring the final display meets stringent visual performance standards. This focus on optical precision is paramount as applications demand higher resolutions and wider fields of view.
COMPETITIVE LANDSCAPE
Key Industry Players
A Market Dominated by Optical Specialists with Strong Regional Concentration
The global VR Lens market is characterized by a high degree of concentration, with the top two manufacturers, Goertek and Sunny Optical Technology, collectively holding over 66% of the market share. These behemoths leverage extensive manufacturing capabilities, significant R&D investments, and established supply chain relationships to maintain their dominance. The market structure is further defined by its geographical footprint, with China being the world’s leading production region, accounting for approximately 60% of the global output. This concentration drives intense competition on cost-efficiency and scalability, particularly for high-volume consumer VR headset applications like gaming and entertainment, which is the largest application segment. The competitive dynamics are shaped by the need for continuous innovation in optical design, such as the development of both Non-Fresnel and Fresnel lenses, to improve image quality, reduce weight, and enhance the user experience in increasingly sophisticated near-eye displays.
Beyond the market leaders, a tier of significant niche players and specialized manufacturers contributes to the competitive landscape. Companies like Genius Electronic Optical (GSEO) and Lianchuang Electronic Technology are key contenders, often focusing on specific optical technologies or forming strategic partnerships with VR headset brands. Furthermore, specialist firms such as Radiant Vision Systems play a crucial role by providing advanced measurement and testing solutions tailored for VR lenses, ensuring quality and performance standards are met. Other notable international component suppliers and emerging innovators are also vying for market share, particularly by targeting growing application areas like remote education and retail marketing, where specific optical performance characteristics may be prioritized. The competitive environment is dynamic, with ongoing developments in mergers, acquisitions, and technological advancements being critical for maintaining a competitive edge.
List of Key VR Lens Companies Profiled
- Goertek
- Sunny Optical Technology
- Genius Electronic Optical (GSEO)
- Lianchuang Electronic Technology
- Radiant Vision Systems
- Largan Precision
- Kopin Corporation
- Himax Technologies
- Asia Optical
- Ofilm Group
- Anteryon (a TRUMPF company)
- AMS OSRAM
- Seiko Epson
- Optinvent
- eMagin Corporation
Segment Analysis:
| Segment Category | Sub-Segments | Key Insights |
| By Type |
|
Fresnel Lens represents the dominant technology, widely favored for its lightweight design and compact profile, which are essential for modern, comfortable head-mounted displays. These lenses offer a thinner form factor, enabling sleeker and more ergonomic VR headset designs without sacrificing optical performance. Conversely, non-Fresnel lenses, while sometimes valued for superior image clarity with minimal optical artifacts like glare, are typically associated with bulkier and heavier hardware. The market trend strongly favors the Fresnel design due to the critical industry drive toward consumer-friendly, wearable devices that prioritize comfort for extended use. |
| By Application |
|
Gaming and Entertainment is the primary driver of the VR lens market, demanding the highest standards of optical immersion and low latency to create compelling virtual worlds. This segment’s requirements for high-resolution, wide field-of-view, and minimal screen-door effect push continuous innovation in lens technology. Following this, the retail and marketing segment leverages VR lenses for creating interactive product demonstrations and virtual showrooms, which enhances customer engagement. Remote education is an emerging high-growth area, utilizing VR to create immersive learning environments that transcend geographical limitations, indicating significant future potential beyond the core entertainment sector. |
| By End User |
|
Consumer Electronics companies are the leading end users, as they are the primary manufacturers of VR headsets for the mass market. These firms drive demand for high-volume, cost-effective lens production while aggressively pursuing technological advancements to gain a competitive edge. Entertainment enterprises constitute a significant customer base, utilizing VR for content creation and experiential offerings. Educational institutions represent a growing segment, adopting VR technology to enhance pedagogical tools, though their purchasing cycles and budget allocations differ markedly from the fast-paced consumer electronics industry, influencing market dynamics. |
| By Technology Integration |
|
Standalone VR Headsets are the most influential segment in shaping current lens design priorities, emphasizing a balance between optical performance, power efficiency, and lightweight construction for untethered mobility. The lens requirements for these all-in-one devices are particularly stringent. Tethered headsets connected to powerful PCs allow for more complex and higher-resolution lens systems that deliver premium visual fidelity for demanding applications. Smartphone-based VR, which was an early market driver, now represents a more niche segment with a focus on extremely low-cost lens solutions, though its influence has waned as the market has matured toward dedicated hardware. |
| By Optical Performance Tier |
|
Entry-Level/Mass Market lenses dominate unit volume, driven by the need for cost-optimized manufacturing to enable affordable consumer headset prices. This segment prioritizes adequate performance and reliability over cutting-edge features. The mid-range enthusiast segment demands a noticeable step up in optical clarity, field of view, and comfort, driving innovation in lens materials and aspherical designs. The high-end enterprise segment, while smaller in volume, is critical for pioneering advanced technologies like pancake lenses and custom optical coatings, which often trickle down to consumer products over time, setting the long-term trajectory for the entire VR lens market. |
Regional Analysis: VR Lens Market
Asia-Pacific’s leadership is rooted in its unparalleled manufacturing ecosystem. Concentrated production facilities for displays, sensors, and precision optics enable economies of scale and rapid iteration for VR lens makers. This integrated supply chain reduces costs and shortens time-to-market for new, advanced lens designs, giving regional players a significant competitive advantage in meeting global demand.
A massive, youthful, and digitally native population eagerly adopts new technologies, creating a strong pull for VR hardware. High smartphone penetration has familiarized users with immersive screens, smoothing the transition to dedicated VR headsets. This high demand encourages continuous investment in lens R&D to improve clarity, reduce screen-door effect, and enhance the overall immersive experience for gaming and content consumption.
Strategic national initiatives promoting digital transformation and the metaverse in countries like China, South Korea, and Japan funnel substantial public and private investment into VR technologies. This support accelerates foundational research in advanced optics, including pancake lenses and varifocal systems, ensuring the region remains at the forefront of innovation and sets global standards for VR lens performance.
Beyond consumer entertainment, VR is rapidly being adopted for training, simulation, and virtual collaboration across Asia-Pacific’s industrial and educational sectors. This diversification of application creates demand for specialized, high-performance VR lenses that offer superior visual fidelity for professional use, driving a more sophisticated and resilient market segment within the region.
North America
North America represents a highly mature and innovation-driven market for VR lenses, characterized by strong demand from both enterprise and premium consumer segments. The region is home to leading VR headset manufacturers and technology giants who invest heavily in proprietary optical systems, pushing for advancements like compact form factors and higher pixel-per-degree densities. The enterprise sector, including aerospace, automotive design, and healthcare, is a major adopter, requiring lenses with exceptional clarity and minimal distortion for professional simulations. A strong venture capital ecosystem fuels startups focused on next-generation optic technologies, such as holographic and light-field displays, which will define future lens requirements. High consumer purchasing power supports the adoption of premium VR devices, encouraging continuous refinement of lens quality to reduce eye strain and enhance comfort during extended use.
Europe
The European VR lens market is distinguished by its strong emphasis on research, quality, and specialized industrial applications. The region benefits from world-renowned research institutions and optical engineering companies, particularly in Germany and the UK, which contribute to high-precision lens manufacturing for professional and medical VR systems. There is significant growth in the use of VR for automotive design, architectural visualization, and advanced training simulators, demanding lenses that offer ultra-high resolution and colour accuracy. Stricter regulations and a focus on user safety and comfort influence lens design, promoting innovations that minimize visual fatigue. Collaboration between academia and industry fosters the development of novel optical solutions, positioning Europe as a key hub for high-end, specialized VR lens technology.
South America
The VR lens market in South America is an emerging market with growth primarily fueled by the expanding gaming and entertainment sectors, especially in countries like Brazil and Argentina. While the market is smaller, there is increasing interest from the education and training sectors, which are beginning to explore VR for immersive learning experiences. The region faces challenges related to economic volatility and higher import costs for advanced components, which can slow the adoption of the latest VR headset models containing cutting-edge lenses. However, growing internet penetration and a young demographic present a significant growth opportunity. Market players often focus on providing cost-effective VR solutions, which influences the demand for reliable, mid-range lens technology that balances performance and affordability.
Middle East & Africa
The VR lens market in the Middle East & Africa is nascent but shows promising growth potential, driven largely by strategic investments in smart city initiatives and tourism in Gulf Cooperation Council countries. Governments are exploring VR for heritage preservation, virtual tourism, and infrastructure planning, creating niche demand for high-quality visualization tools. In Africa, pilot projects in education and healthcare are introducing VR technology, though widespread adoption is constrained by infrastructure limitations and cost sensitivity. The market currently relies heavily on imports, with limited local manufacturing or specialized R&D for optics. As digital infrastructure improves, the demand for VR lenses is expected to grow, initially focusing on durable and cost-effective solutions suited to the region’s specific application needs.
Report Scope
This market research report provides a comprehensive analysis of the VR Lens Market , covering the forecast period 2025–2032. It offers detailed insights into market dynamics, technological advancements, competitive landscape, and key trends shaping the industry.
Key focus areas of the report include:
- Market Overview: The report begins with an overview outlining its current market scenario, key growth indicators, and industry transformation drivers. It discusses macroeconomic factors, demand–supply balance, regulatory landscape, and the strategic role of semiconductors in powering advancements across industries such as automotive, telecommunications, consumer electronics, and industrial automation.
- Market Size & Forecast: Historical data and future projections for revenue, unit shipments, and market value across major regions and segments.
- Segmentation Analysis: Detailed breakdown by product type, technology, application, and end-user industry to identify high-growth segments and investment opportunities.
- Regional Insights: Insights into market performance across North America, Europe, Asia-Pacific, Latin America, and the Middle East & Africa, including country-level analysis where relevant.
- Competitive Landscape: Profiles of leading market participants, including their product offerings, R&D focus, manufacturing capacity, pricing strategies, and recent developments such as mergers, acquisitions, and partnerships.
- Technology Trends & Innovation: Assessment of emerging technologies, integration of AI/IoT, semiconductor design trends, fabrication techniques, and evolving industry standards.
- Market Drivers & Restraints: Evaluation of factors driving market growth along with challenges, supply chain constraints, regulatory issues, and market-entry barriers.
- Stakeholder Insights: Insights for component suppliers, OEMs, system integrators, investors, and policymakers regarding the evolving ecosystem and strategic opportunities.
Primary and secondary research methods are employed, including interviews with industry experts, data from verified sources, and real-time market intelligence to ensure the accuracy and reliability of the insights presented.
FREQUENTLY ASKED QUESTIONS:
What is the current market size of VR Lens Market?
-> Global VR Lens Market was valued at USD 302 million in 2024 and is projected to reach USD 666 million by 2032, exhibiting a CAGR of 12.2% during the forecast period.
Which key companies operate in VR Lens Market?
-> Key players include Goertek, Sunny Optical Technology, Genius Electronic Optical (GSEO), Lianchuang Electronic Technology, and Radiant Vision Systems, among others. The top two manufacturers, Goertek and Sunny Optical Technology, hold a combined market share of over 66%.
What are the key growth drivers?
-> Key growth drivers include the increasing adoption of virtual reality technology, expanding applications in gaming and entertainment, and continuous technological advancements in near-eye display (NED) systems.
Which region dominates the market?
-> China is the world’s leading production region for VR Lens, accounting for approximately 60% of the global market share.
What are the emerging trends?
-> Emerging trends include the development of advanced optical designs for enhanced user experience, integration of VR technology in retail and marketing applications, and the growing use of VR Lens in remote education.

Get Sample Report PDF for Exclusive Insights
Report Sample Includes
- Table of Contents
- List of Tables & Figures
- Charts, Research Methodology, and more...






Be the first to review “VR Lens Market Size, Emerging Trends, Technological Advancements, and Business Strategies 2025-2032”