SEMICONDUCTOR INSIGHT
MARKET RESEARCH REPORT

Optical Transponder Market

2026 to 2034
MARKET INTELLIGENCE
ACROSS KEY REGIONS
2026 EDITION
COMMUNICATION SYSTEMS Semiconductor Market Research

Optical Transponder Market

◷
UPDATED 19 October 2026
▤
REPORT LENGTH Detailed Report
▣
REPORT CODE 353dab997a0e
▯
FORMATS PDF

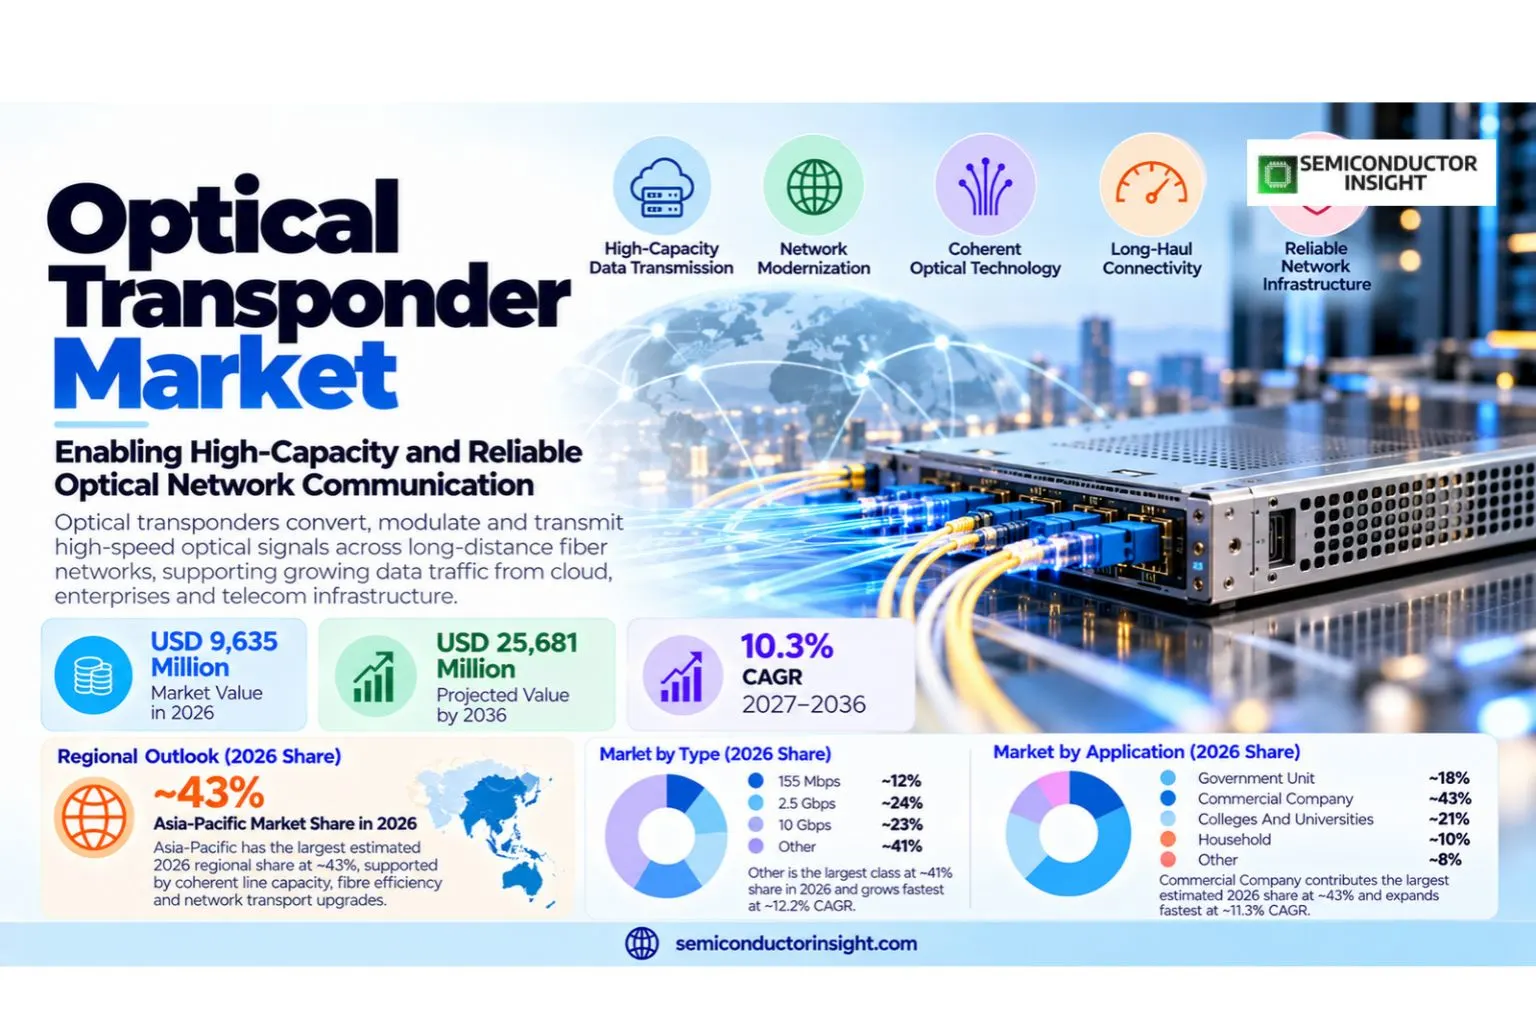
Optical transponder market was valued at USD 9,635 million in 2026 and is projected to reach USD 25,681 million by 2036, recording a CAGR of 10.3% during 2027–2036. Asia-Pacific has the largest estimated 2026 regional share at ~43%, supported by coherent line capacity, fibre efficiency and network transport upgrades.

Get the sample PDF with study scope, segmentation and methodology details.

Key Statistics

2026 Market Size
USD 9,635 million
2036 Projected Size
USD 25,681 million
CAGR (2027–2036)
10.3%
Largest Market in 2026
Asia-Pacific (~43%)

Key Takeaways

  • Market trajectory: the optical transponder market has a 2026 value of USD 9,635 million and a 2036 projection of USD 25,681 million, representing 10.3% CAGR during 2027–2036. Demand is connected to coherent line capacity, fibre efficiency and network transport upgrades, although each procurement decision depends on lifecycle performance, field support and clear purchasing accountability. Unlike entire network or electrical infrastructure spending, the relevant products require an identifiable equipment sale.
  • Other leads: Other represents an estimated ~41% of 2026 revenue, the leading type category. Other is the fastest-growing type at around ~12.2% CAGR from a ~41% base share. The mix reflects application fit, production economics, installed compatibility and the pace at which buyers replace previously qualified hardware. This matters for optical transponder purchasing because technology upgrade timing determines whether a technically valid design reaches stable operating performance. System operators evaluate the equipment within a defined service environment, checking field reliability, supplier support, installation complexity and the consequences of an outage. The commercial outcome therefore depends on total installed cost and a credible lifecycle improvement, rather than an isolated component specification.
  • Commercial Company is the largest application: Commercial Company accounts for an estimated ~43% of 2026 revenue and supports purchases triggered by operating capacity and reliability needs. Commercial Company expands at about ~11.3% CAGR, but its spending pattern differs from other buyer classes in project scale, specifications and service life. This matters for optical transponder purchasing because application-specific operating constraints determines whether a technically valid design reaches stable operating performance. System operators evaluate the equipment within a defined service environment, checking field reliability, supplier support, installation complexity and the consequences of an outage. The commercial outcome therefore depends on total installed cost and a credible lifecycle improvement, rather than an isolated component specification.
  • Asia-Pacific has the largest geographical contribution: Asia-Pacific leads with an estimated ~43% base-year share; Middle East & Africa has the highest modeled regional expansion at roughly ~11.2% CAGR. Countries buy through different contracting and commissioning arrangements, and regional production concentration should not be confused with the place of final equipment installation. This matters for optical transponder purchasing because geographic procurement and qualification determines whether a technically valid design reaches stable operating performance. System operators evaluate the equipment within a defined service environment, checking field reliability, supplier support, installation complexity and the consequences of an outage. The commercial outcome therefore depends on total installed cost and a credible lifecycle improvement, rather than an isolated component specification.
  • Chief commercial restraint: legacy line-rate obsolescence limits adoption even when equipment has favorable engineering performance. Procurement teams examine integration cost, legacy compatibility and availability of qualified maintenance personnel, so higher technical capability does not always generate immediate equipment sales. Suppliers winning repeat programmes combine verified performance with training, parts availability and after-sales execution. This matters for optical transponder purchasing because installed-site economics determines whether a technically valid design reaches stable operating performance. System operators evaluate the equipment within a defined service environment, checking field reliability, supplier support, installation complexity and the consequences of an outage. The commercial outcome therefore depends on total installed cost and a credible lifecycle improvement, rather than an isolated component specification.

Optical Transponder Market Overview

Optical transponder market was valued at USD 9,635 million in 2026 and is projected to reach USD 25,681 million by 2036, recording a CAGR of 10.3% during 2027–2036. Asia-Pacific has the largest estimated 2026 regional share at ~43%, supported by coherent line capacity, fibre efficiency and network transport upgrades.

Base year: 2026 · Estimated year: 2027 · Forecast period: 2027–2036 · Historical data: 2021–2025 · Values in USD million

Optical transponders transform client data streams into controlled optical channels and recover them at the far end of fiber networks. The established legacy speed classes include 155 Mbps, 2.5 Gbps, 10 Gbps and Other; commercially important modern 100G, 400G and 800G coherent systems fall within the Other category and should not be silently renamed. The purchasing case depends on technical interfaces, installation conditions, qualification by operating organizations and subsequent maintenance commitments. A sale is commercially meaningful only when the device or equipment has a usable role in an operating infrastructure rather than a laboratory demonstration.

The revenue boundary covers standalone optical transponders, pluggable optical channel interfaces and transport transponder line cards sold to fiber-network operators, enterprises and integrators; excludes the value of an entire router, fiber cable and duplicated downstream network services. In many installations several firms supply interacting hardware, software, design services and ongoing network or power-system operation. Counting all associated spending as direct sensor or optical equipment sales would obscure product pricing and exaggerate the contribution of any one component class. Engineering and user support are relevant because they influence final purchasing, not because every related service must be priced as a component.

Product architecture is becoming more important as operating networks demand higher performance without complete reconstruction of existing infrastructure. Metro and long-haul traffic growth and cloud data-center interconnection are commercially important when equipment lifetime, space and electrical power influence total costs. Standards-based interfaces offer buyers more predictable acceptance procedures, but successful installation still requires careful engineering of the actual site.

The purchasing cycle is often triggered by an infrastructure upgrade, customer capacity requirement or safety review rather than a continuous sequence of device replacements. Documentation from manufacturers, standards bodies and infrastructure agencies connects optical transponder applications with verified changes in operational needs. These external drivers explain where spending pressure originates without equating broad network or electricity investment with this specific market revenue.

Competition increasingly rewards measurable reliability and integration efficiency. Transport platform vendors, network integrators, enterprise infrastructure teams and telecom carriers compare existing assets with proposed equipment on performance, installation burden, availability and service continuity. Regional procurement is heterogeneous: a network greenfield project may favor a new architecture, while a heavily standardized brownfield site may postpone replacement. Suppliers must support migration as well as superior hardware specifications.

Segment Analysis: By Type

By type, optical transponder is segmented into 155 Mbps, 2.5 Gbps, 10 Gbps, Other. Other is the largest class at an estimated ~41% share in 2026; Other grows fastest at approximately ~12.2% CAGR from a ~41% starting share. Equipment economics are determined by field suitability, installation engineering and attainable performance within an installed environment.

Type Function Market position
155 Mbps Legacy synchronous optical transponders serve retained low-speed circuits and maintenance needs in old optical access and transport infrastructure; deployment is increasingly related to replacement parts instead of major greenfield investment. In service, the equipment must meet the stated measurement or throughput envelope, survive environmental changes and provide installation documentation that operating technicians can follow. Purchasing authorities also consider spare components, maintenance frequency and interoperability with the remaining network or electrical controls. Specialized type: estimated ~7% share in 2026, ~6.9% CAGR. Legacy synchronous optical transponders serve retained low-speed circuits and maintenance needs in old optical access and transport infrastructure; deployment is increasingly related to replacement parts instead of major greenfield investment. Price competition and qualification timelines differ materially from other type classes; a large installed fleet can generate steady replacement sales while a smaller technology class expands more quickly because of new deployments.
2.5 Gbps Traditional 2.5 Gbps optical interfaces support surviving SONET/SDH-style circuits and long-lived operator equipment where low-cost support can be more important than upgrading to coherent transport. In service, the equipment must meet the stated measurement or throughput envelope, survive environmental changes and provide installation documentation that operating technicians can follow. Purchasing authorities also consider spare components, maintenance frequency and interoperability with the remaining network or electrical controls. Specialized type: estimated ~17% share in 2026, ~8.2% CAGR. Traditional 2.5 Gbps optical interfaces support surviving SONET/SDH-style circuits and long-lived operator equipment where low-cost support can be more important than upgrading to coherent transport. Price competition and qualification timelines differ materially from other type classes; a large installed fleet can generate steady replacement sales while a smaller technology class expands more quickly because of new deployments.
10 Gbps 10 Gbps optical transponders are used for established access aggregation, enterprise links and lower-capacity transport. Interoperability and replacement economics matter where migration to higher coherent rates is gradual. In service, the equipment must meet the stated measurement or throughput envelope, survive environmental changes and provide installation documentation that operating technicians can follow. Purchasing authorities also consider spare components, maintenance frequency and interoperability with the remaining network or electrical controls. Specialized type: estimated ~35% share in 2026, ~9.5% CAGR. 10 Gbps optical transponders are used for established access aggregation, enterprise links and lower-capacity transport. Interoperability and replacement economics matter where migration to higher coherent rates is gradual. Price competition and qualification timelines differ materially from other type classes; a large installed fleet can generate steady replacement sales while a smaller technology class expands more quickly because of new deployments.
Other The Other category encompasses modern 100G, 400G and 800G coherent interfaces as well as rates not separately disclosed in the type segmentation. Pluggable ZR and higher-capacity wavelength engines represent substantial technology-driven demand. In service, the equipment must meet the stated measurement or throughput envelope, survive environmental changes and provide installation documentation that operating technicians can follow. Purchasing authorities also consider spare components, maintenance frequency and interoperability with the remaining network or electrical controls. Largest type: estimated ~41% share in 2026, ~12.2% CAGR. The Other category encompasses modern 100G, 400G and 800G coherent interfaces as well as rates not separately disclosed in the type segmentation. Pluggable ZR and higher-capacity wavelength engines represent substantial technology-driven demand. Price competition and qualification timelines differ materially from other type classes; a large installed fleet can generate steady replacement sales while a smaller technology class expands more quickly because of new deployments.

Segment Analysis: By Application

Principal applications include Government Unit, Commercial Company, Colleges And Universities, Household, Other. Commercial Company contributes the largest estimated 2026 share at ~43%, while Commercial Company expands fastest at ~11.3% CAGR. End users have distinct demand mechanisms: technology purchases are governed by plant or network investment, not automatically by the number of consumers using the finished service.

Application Demand characteristics
Government Unit Estimated ~14% of 2026 revenue; ~9.3% CAGR. Government communications networks purchase optical transport for resilient campus, city, defense and public infrastructure links requiring documented acceptance. Orders are tied to a procurement event such as a new facility, upgrade, renewal or required system safety evaluation. Each buyer assesses specification compliance, technical training, installation burden and supplier continuity before approving a site-wide deployment.
Commercial Company Estimated ~43% of 2026 revenue; ~11.3% CAGR. Cloud, telecom and enterprise network operators purchase transport interfaces to move high-bandwidth client traffic between data centers and regional nodes. Orders are tied to a procurement event such as a new facility, upgrade, renewal or required system safety evaluation. Each buyer assesses specification compliance, technical training, installation burden and supplier continuity before approving a site-wide deployment.
Colleges And Universities Estimated ~10% of 2026 revenue; ~9.4% CAGR. University and research campuses connect scientific instruments and regional research networks using optical links with long service horizons. Orders are tied to a procurement event such as a new facility, upgrade, renewal or required system safety evaluation. Each buyer assesses specification compliance, technical training, installation burden and supplier continuity before approving a site-wide deployment.
Household Estimated ~21% of 2026 revenue; ~9.2% CAGR. Household end-use is indirect because consumers receive services through optical backbone systems; residential connectivity expansion can create upstream transport demand. Orders are tied to a procurement event such as a new facility, upgrade, renewal or required system safety evaluation. Each buyer assesses specification compliance, technical training, installation burden and supplier continuity before approving a site-wide deployment.
Other Estimated ~12% of 2026 revenue; ~10.1% CAGR. Specialized transport, metro aggregation and wholesale routes create orders outside named buyer categories, including shared infrastructure projects. Orders are tied to a procurement event such as a new facility, upgrade, renewal or required system safety evaluation. Each buyer assesses specification compliance, technical training, installation burden and supplier continuity before approving a site-wide deployment.

The selling channel runs through transport platform vendors, network integrators, enterprise infrastructure teams and telecom carriers. Technical proposals must clarify who provides commissioning, equipment diagnostics, compatibility testing and spare units over the installed life. Long sales cycles are common because procurement involves users, consulting engineers and infrastructure owners. Distributors can accelerate replacement sales, but full architectural redesign requires deeper systems integration and clear responsibility for the installed solution.


Regional Analysis

Asia-Pacific is the leading region with an estimated ~43% of 2026 revenue. North America contributes about ~26% and Europe around ~20%. Middle East & Africa has the strongest estimated regional expansion at ~11.2% CAGR. Regional market positions reflect different installation schedules and procurement profiles; manufacturing bases do not necessarily correspond to local deployment markets.

How does regional optical transponder demand differ?

Five regions buy through different operating ecosystems. China, Japan and India operate distinct optical transport investment cycles. Chinese carriers build national backbone and metropolitan capacity, Japanese operators prioritize quality and energy consumption, and Indian network builders increasingly trial high-capacity coherent channels. Regional equipment assembly and optical component production shorten delivery routes while intensifying price competition. In North America and Europe, standards and brownfield asset protection shape many equipment purchases; across South America and the Middle East and Africa, large individual projects and integrator presence can be more decisive than continuous replacement demand. This is why regional growth is not a uniform multiple of population, telecom subscriptions or electricity capacity.

Region Position Growth outlook Demand profile What decides supplier selection
Asia-Pacific Largest (~43%) ~11.1% CAGR Optical capacity upgrades Equipment qualification, country-specific installation skills, upfront funding and verified service continuity matter in Asia-Pacific. Buyers increasingly assess procurement for 2027 through 2036 against the operating needs of installed networks, buildings or electric grid systems. Contractors need clear functional acceptance tests, approved components and a practical plan for diagnostics and long-term replacement inventory.
North America Second (~26%) ~9.6% CAGR Optical capacity upgrades Equipment qualification, country-specific installation skills, upfront funding and verified service continuity matter in North America. Buyers increasingly assess procurement for 2027 through 2036 against the operating needs of installed networks, buildings or electric grid systems. Contractors need clear functional acceptance tests, approved components and a practical plan for diagnostics and long-term replacement inventory.
Europe Third (~20%) ~8.7% CAGR Optical capacity upgrades Equipment qualification, country-specific installation skills, upfront funding and verified service continuity matter in Europe. Buyers increasingly assess procurement for 2027 through 2036 against the operating needs of installed networks, buildings or electric grid systems. Contractors need clear functional acceptance tests, approved components and a practical plan for diagnostics and long-term replacement inventory.
South America Fourth (~6%) ~10.9% CAGR Optical capacity upgrades Equipment qualification, country-specific installation skills, upfront funding and verified service continuity matter in South America. Buyers increasingly assess procurement for 2027 through 2036 against the operating needs of installed networks, buildings or electric grid systems. Contractors need clear functional acceptance tests, approved components and a practical plan for diagnostics and long-term replacement inventory.
Middle East & Africa Fifth (~5%) ~11.2% CAGR Optical capacity upgrades Equipment qualification, country-specific installation skills, upfront funding and verified service continuity matter in Middle East & Africa. Buyers increasingly assess procurement for 2027 through 2036 against the operating needs of installed networks, buildings or electric grid systems. Contractors need clear functional acceptance tests, approved components and a practical plan for diagnostics and long-term replacement inventory.

Asia-Pacific LARGEST · ~43% SHARE

What shapes the Asia-Pacific optical transponder market?

Asia-Pacific accounts for an estimated ~43% of 2026 revenue, growing at approximately ~11.1% CAGR through 2036. China, Japan and India operate distinct optical transport investment cycles. Chinese carriers build national backbone and metropolitan capacity, Japanese operators prioritize quality and energy consumption, and Indian network builders increasingly trial high-capacity coherent channels. Regional equipment assembly and optical component production shorten delivery routes while intensifying price competition. The high regional share is connected to local production ecosystems and large investment programmes. However, different countries often deploy on different schedules and favor different system integrators, so growth should not be attributed solely to the manufacturing concentration in the region.

Market positionLargest (~43%)
Growth outlook~11.1% CAGR
Demand profileOptical bandwidth upgrades
Market access gateIntegrator and lifecycle qualification
Country Position in region What drives demand
China Major demand base China is an important part of the Asia-Pacific commercial landscape for optical transponder because of DWDM transport, network modernization and supplier field support. China, Japan and India operate distinct optical transport investment cycles. For equipment purchases from 2027 through 2036, local customers will need support for applicable standards and long-term field service. National buying institutions make different trade-offs between capital affordability, technical specifications, procurement schedule and maintenance responsibilities. A successful installation therefore depends on both the physical equipment and the expertise needed to operate it reliably.
Japan Infrastructure upgrades Japan is an important part of the Asia-Pacific commercial landscape for optical transponder because of DWDM transport, network modernization and supplier field support. China, Japan and India operate distinct optical transport investment cycles. For equipment purchases from 2027 through 2036, local customers will need support for applicable standards and long-term field service. National buying institutions make different trade-offs between capital affordability, technical specifications, procurement schedule and maintenance responsibilities. A successful installation therefore depends on both the physical equipment and the expertise needed to operate it reliably.
India Selective projects India is an important part of the Asia-Pacific commercial landscape for optical transponder because of DWDM transport, network modernization and supplier field support. China, Japan and India operate distinct optical transport investment cycles. For equipment purchases from 2027 through 2036, local customers will need support for applicable standards and long-term field service. National buying institutions make different trade-offs between capital affordability, technical specifications, procurement schedule and maintenance responsibilities. A successful installation therefore depends on both the physical equipment and the expertise needed to operate it reliably.
South Korea Technical applications South Korea is an important part of the Asia-Pacific commercial landscape for optical transponder because of DWDM transport, network modernization and supplier field support. China, Japan and India operate distinct optical transport investment cycles. For equipment purchases from 2027 through 2036, local customers will need support for applicable standards and long-term field service. National buying institutions make different trade-offs between capital affordability, technical specifications, procurement schedule and maintenance responsibilities. A successful installation therefore depends on both the physical equipment and the expertise needed to operate it reliably.

Market instances

  • China: metro and long-haul traffic growth. Projects in China show how China, Japan and India operate distinct optical transport investment cycles. Between 2027 and 2036, Metro and long-haul traffic growth provides an identifiable commercial reason to evaluate optical transponder equipment. The implications extend beyond purchase price because installation quality, interoperability and long-term service all affect usable lifetime. Engineering consultants and operating customers typically need documented performance before scaling a project across multiple network sites or facilities.
  • Japan: cloud data-center interconnection. Projects in Japan show how China, Japan and India operate distinct optical transport investment cycles. Between 2027 and 2036, Cloud data-center interconnection provides an identifiable commercial reason to evaluate optical transponder equipment. The implications extend beyond purchase price because installation quality, interoperability and long-term service all affect usable lifetime. Engineering consultants and operating customers typically need documented performance before scaling a project across multiple network sites or facilities.
  • India: coherent modulation and wdm advances. Projects in India show how China, Japan and India operate distinct optical transport investment cycles. Between 2027 and 2036, Coherent modulation and WDM advances provides an identifiable commercial reason to evaluate optical transponder equipment. The implications extend beyond purchase price because installation quality, interoperability and long-term service all affect usable lifetime. Engineering consultants and operating customers typically need documented performance before scaling a project across multiple network sites or facilities.
In the full report: country-specific optical transponder revenue, supplier position, installation counts, pricing, customer project structures and procurement forecasts for China, Japan, India, South Korea.

North America SECOND · ~26% SHARE

What shapes the North America optical transponder market?

North America accounts for an estimated ~26% of 2026 revenue, growing at approximately ~9.6% CAGR through 2036. United States cloud data-center corridors and long-haul carrier routes account for dense high-value optical transport requirements. Canada adds long-distance fiber and intercity networks, while Mexico contributes cross-border connectivity and regional cloud infrastructure. Buyers focus on interoperability, spectrum efficiency, power per bit and assured delivery under demanding network service-level agreements. The installed base supports replacement demand but also creates demanding interoperability and cybersecurity reviews. Procurement is generally weighted toward service guarantees, reduced outage exposure and the ability to migrate a mature site without abandoning existing usable infrastructure.

Market positionSecond (~26%)
Growth outlook~9.6% CAGR
Demand profileOptical bandwidth upgrades
Market access gateIntegrator and lifecycle qualification
Country Position in region What drives demand
United States Major demand base United States is an important part of the North America commercial landscape for optical transponder because of DWDM transport, network modernization and supplier field support. United States cloud data-center corridors and long-haul carrier routes account for dense high-value optical transport requirements. For equipment purchases from 2027 through 2036, local customers will need support for applicable standards and long-term field service. National buying institutions make different trade-offs between capital affordability, technical specifications, procurement schedule and maintenance responsibilities. A successful installation therefore depends on both the physical equipment and the expertise needed to operate it reliably.
Canada Infrastructure upgrades Canada is an important part of the North America commercial landscape for optical transponder because of DWDM transport, network modernization and supplier field support. United States cloud data-center corridors and long-haul carrier routes account for dense high-value optical transport requirements. For equipment purchases from 2027 through 2036, local customers will need support for applicable standards and long-term field service. National buying institutions make different trade-offs between capital affordability, technical specifications, procurement schedule and maintenance responsibilities. A successful installation therefore depends on both the physical equipment and the expertise needed to operate it reliably.
Mexico Selective projects Mexico is an important part of the North America commercial landscape for optical transponder because of DWDM transport, network modernization and supplier field support. United States cloud data-center corridors and long-haul carrier routes account for dense high-value optical transport requirements. For equipment purchases from 2027 through 2036, local customers will need support for applicable standards and long-term field service. National buying institutions make different trade-offs between capital affordability, technical specifications, procurement schedule and maintenance responsibilities. A successful installation therefore depends on both the physical equipment and the expertise needed to operate it reliably.

Market instances

  • United States: metro and long-haul traffic growth. Projects in United States show how United States cloud data-center corridors and long-haul carrier routes account for dense high-value optical transport requirements. Between 2027 and 2036, Metro and long-haul traffic growth provides an identifiable commercial reason to evaluate optical transponder equipment. The implications extend beyond purchase price because installation quality, interoperability and long-term service all affect usable lifetime. Engineering consultants and operating customers typically need documented performance before scaling a project across multiple network sites or facilities.
  • Canada: cloud data-center interconnection. Projects in Canada show how United States cloud data-center corridors and long-haul carrier routes account for dense high-value optical transport requirements. Between 2027 and 2036, Cloud data-center interconnection provides an identifiable commercial reason to evaluate optical transponder equipment. The implications extend beyond purchase price because installation quality, interoperability and long-term service all affect usable lifetime. Engineering consultants and operating customers typically need documented performance before scaling a project across multiple network sites or facilities.
  • Mexico: coherent modulation and wdm advances. Projects in Mexico show how United States cloud data-center corridors and long-haul carrier routes account for dense high-value optical transport requirements. Between 2027 and 2036, Coherent modulation and WDM advances provides an identifiable commercial reason to evaluate optical transponder equipment. The implications extend beyond purchase price because installation quality, interoperability and long-term service all affect usable lifetime. Engineering consultants and operating customers typically need documented performance before scaling a project across multiple network sites or facilities.
In the full report: country-specific optical transponder revenue, supplier position, installation counts, pricing, customer project structures and procurement forecasts for United States, Canada, Mexico.

Europe THIRD · ~20% SHARE

What shapes the Europe optical transponder market?

Europe accounts for an estimated ~20% of 2026 revenue, growing at approximately ~8.7% CAGR through 2036. Germany, France and the United Kingdom serve as major regional hubs for long-haul and cross-border optical transport, while the Nordic countries provide examples of high-capacity data-center interconnect needs. Network groups increasingly seek vendor-neutral coherent interfaces and the ability to maximize existing fiber assets. European energy and resilience priorities shape procurement and lifecycle service commitments. Energy, resilience and lifecycle criteria give enterprise and network engineers a broader evaluation framework than device price. Standards and regulatory compliance tend to extend qualification while making traceability and well-documented equipment interfaces particularly important.

Market positionThird (~20%)
Growth outlook~8.7% CAGR
Demand profileOptical bandwidth upgrades
Market access gateIntegrator and lifecycle qualification
Country Position in region What drives demand
Germany Major demand base Germany is an important part of the Europe commercial landscape for optical transponder because of DWDM transport, network modernization and supplier field support. Germany, France and the United Kingdom serve as major regional hubs for long-haul and cross-border optical transport, while the Nordic countries provide examples of high-capacity data-center interconnect needs. For equipment purchases from 2027 through 2036, local customers will need support for applicable standards and long-term field service. National buying institutions make different trade-offs between capital affordability, technical specifications, procurement schedule and maintenance responsibilities. A successful installation therefore depends on both the physical equipment and the expertise needed to operate it reliably.
United Kingdom Infrastructure upgrades United Kingdom is an important part of the Europe commercial landscape for optical transponder because of DWDM transport, network modernization and supplier field support. Germany, France and the United Kingdom serve as major regional hubs for long-haul and cross-border optical transport, while the Nordic countries provide examples of high-capacity data-center interconnect needs. For equipment purchases from 2027 through 2036, local customers will need support for applicable standards and long-term field service. National buying institutions make different trade-offs between capital affordability, technical specifications, procurement schedule and maintenance responsibilities. A successful installation therefore depends on both the physical equipment and the expertise needed to operate it reliably.
France Selective projects France is an important part of the Europe commercial landscape for optical transponder because of DWDM transport, network modernization and supplier field support. Germany, France and the United Kingdom serve as major regional hubs for long-haul and cross-border optical transport, while the Nordic countries provide examples of high-capacity data-center interconnect needs. For equipment purchases from 2027 through 2036, local customers will need support for applicable standards and long-term field service. National buying institutions make different trade-offs between capital affordability, technical specifications, procurement schedule and maintenance responsibilities. A successful installation therefore depends on both the physical equipment and the expertise needed to operate it reliably.

Market instances

  • Germany: metro and long-haul traffic growth. Projects in Germany show how Germany, France and the United Kingdom serve as major regional hubs for long-haul and cross-border optical transport, while the Nordic countries provide examples of high-capacity data-center interconnect needs. Between 2027 and 2036, Metro and long-haul traffic growth provides an identifiable commercial reason to evaluate optical transponder equipment. The implications extend beyond purchase price because installation quality, interoperability and long-term service all affect usable lifetime. Engineering consultants and operating customers typically need documented performance before scaling a project across multiple network sites or facilities.
  • United Kingdom: cloud data-center interconnection. Projects in United Kingdom show how Germany, France and the United Kingdom serve as major regional hubs for long-haul and cross-border optical transport, while the Nordic countries provide examples of high-capacity data-center interconnect needs. Between 2027 and 2036, Cloud data-center interconnection provides an identifiable commercial reason to evaluate optical transponder equipment. The implications extend beyond purchase price because installation quality, interoperability and long-term service all affect usable lifetime. Engineering consultants and operating customers typically need documented performance before scaling a project across multiple network sites or facilities.
  • France: coherent modulation and wdm advances. Projects in France show how Germany, France and the United Kingdom serve as major regional hubs for long-haul and cross-border optical transport, while the Nordic countries provide examples of high-capacity data-center interconnect needs. Between 2027 and 2036, Coherent modulation and WDM advances provides an identifiable commercial reason to evaluate optical transponder equipment. The implications extend beyond purchase price because installation quality, interoperability and long-term service all affect usable lifetime. Engineering consultants and operating customers typically need documented performance before scaling a project across multiple network sites or facilities.
In the full report: country-specific optical transponder revenue, supplier position, installation counts, pricing, customer project structures and procurement forecasts for Germany, United Kingdom, France.

South America FOURTH · ~6% SHARE

What shapes the South America optical transponder market?

South America accounts for an estimated ~6% of 2026 revenue, growing at approximately ~10.9% CAGR through 2036. Brazilian carriers and cloud interconnect operators drive the largest concentration of optical backbone upgrades, with Chile and Colombia providing cross-border and metropolitan expansion projects. International submarine cable landing stations increase demand for inland optical capacity. Operators can defer equipment refreshes when finance or currency conditions are unfavorable, creating uneven project timing. Project completion depends on budget cycles, import access, local installation capabilities and telecommunications or electricity investment. Technology adoption can therefore be uneven, with individual large deployments advancing while other customers preserve their previous operating equipment.

Market positionFourth (~6%)
Growth outlook~10.9% CAGR
Demand profileOptical bandwidth upgrades
Market access gateIntegrator and lifecycle qualification
Country Position in region What drives demand
Brazil Major demand base Brazil is an important part of the South America commercial landscape for optical transponder because of DWDM transport, network modernization and supplier field support. Brazilian carriers and cloud interconnect operators drive the largest concentration of optical backbone upgrades, with Chile and Colombia providing cross-border and metropolitan expansion projects. For equipment purchases from 2027 through 2036, local customers will need support for applicable standards and long-term field service. National buying institutions make different trade-offs between capital affordability, technical specifications, procurement schedule and maintenance responsibilities. A successful installation therefore depends on both the physical equipment and the expertise needed to operate it reliably.
Chile Infrastructure upgrades Chile is an important part of the South America commercial landscape for optical transponder because of DWDM transport, network modernization and supplier field support. Brazilian carriers and cloud interconnect operators drive the largest concentration of optical backbone upgrades, with Chile and Colombia providing cross-border and metropolitan expansion projects. For equipment purchases from 2027 through 2036, local customers will need support for applicable standards and long-term field service. National buying institutions make different trade-offs between capital affordability, technical specifications, procurement schedule and maintenance responsibilities. A successful installation therefore depends on both the physical equipment and the expertise needed to operate it reliably.
Colombia Selective projects Colombia is an important part of the South America commercial landscape for optical transponder because of DWDM transport, network modernization and supplier field support. Brazilian carriers and cloud interconnect operators drive the largest concentration of optical backbone upgrades, with Chile and Colombia providing cross-border and metropolitan expansion projects. For equipment purchases from 2027 through 2036, local customers will need support for applicable standards and long-term field service. National buying institutions make different trade-offs between capital affordability, technical specifications, procurement schedule and maintenance responsibilities. A successful installation therefore depends on both the physical equipment and the expertise needed to operate it reliably.

Market instances

  • Brazil: metro and long-haul traffic growth. Projects in Brazil show how Brazilian carriers and cloud interconnect operators drive the largest concentration of optical backbone upgrades, with Chile and Colombia providing cross-border and metropolitan expansion projects. Between 2027 and 2036, Metro and long-haul traffic growth provides an identifiable commercial reason to evaluate optical transponder equipment. The implications extend beyond purchase price because installation quality, interoperability and long-term service all affect usable lifetime. Engineering consultants and operating customers typically need documented performance before scaling a project across multiple network sites or facilities.
  • Chile: cloud data-center interconnection. Projects in Chile show how Brazilian carriers and cloud interconnect operators drive the largest concentration of optical backbone upgrades, with Chile and Colombia providing cross-border and metropolitan expansion projects. Between 2027 and 2036, Cloud data-center interconnection provides an identifiable commercial reason to evaluate optical transponder equipment. The implications extend beyond purchase price because installation quality, interoperability and long-term service all affect usable lifetime. Engineering consultants and operating customers typically need documented performance before scaling a project across multiple network sites or facilities.
  • Colombia: coherent modulation and wdm advances. Projects in Colombia show how Brazilian carriers and cloud interconnect operators drive the largest concentration of optical backbone upgrades, with Chile and Colombia providing cross-border and metropolitan expansion projects. Between 2027 and 2036, Coherent modulation and WDM advances provides an identifiable commercial reason to evaluate optical transponder equipment. The implications extend beyond purchase price because installation quality, interoperability and long-term service all affect usable lifetime. Engineering consultants and operating customers typically need documented performance before scaling a project across multiple network sites or facilities.
In the full report: country-specific optical transponder revenue, supplier position, installation counts, pricing, customer project structures and procurement forecasts for Brazil, Chile, Colombia.

Middle East & Africa FIFTH · ~5% SHARE · FASTEST-GROWING

What shapes the Middle East & Africa optical transponder market?

Middle East & Africa accounts for an estimated ~5% of 2026 revenue, growing at approximately ~11.2% CAGR through 2036. United Arab Emirates optical-network investments have included commercially deployed terabit-per-wavelength coherent links, demonstrating high-capacity requirements beyond consumer access. Saudi Arabia is investing in national digital infrastructure; South Africa is a regional backhaul and cloud gateway. Capital spending is frequently project-driven, with vendor finance, power availability and technical support affecting tender outcomes. Several Gulf projects can specify modern infrastructure during construction, while African demand is frequently linked to selected transport, campus or electrical grid assets. Installation climate, training and service continuity remain essential to realizing promised performance improvements.

Market positionFifth (~5%)
Growth outlook~11.2% CAGR
Demand profileOptical bandwidth upgrades
Market access gateIntegrator and lifecycle qualification
Country Position in region What drives demand
Saudi Arabia Major demand base Saudi Arabia is an important part of the Middle East & Africa commercial landscape for optical transponder because of DWDM transport, network modernization and supplier field support. United Arab Emirates optical-network investments have included commercially deployed terabit-per-wavelength coherent links, demonstrating high-capacity requirements beyond consumer access. For equipment purchases from 2027 through 2036, local customers will need support for applicable standards and long-term field service. National buying institutions make different trade-offs between capital affordability, technical specifications, procurement schedule and maintenance responsibilities. A successful installation therefore depends on both the physical equipment and the expertise needed to operate it reliably.
United Arab Emirates Infrastructure upgrades United Arab Emirates is an important part of the Middle East & Africa commercial landscape for optical transponder because of DWDM transport, network modernization and supplier field support. United Arab Emirates optical-network investments have included commercially deployed terabit-per-wavelength coherent links, demonstrating high-capacity requirements beyond consumer access. For equipment purchases from 2027 through 2036, local customers will need support for applicable standards and long-term field service. National buying institutions make different trade-offs between capital affordability, technical specifications, procurement schedule and maintenance responsibilities. A successful installation therefore depends on both the physical equipment and the expertise needed to operate it reliably.
South Africa Selective projects South Africa is an important part of the Middle East & Africa commercial landscape for optical transponder because of DWDM transport, network modernization and supplier field support. United Arab Emirates optical-network investments have included commercially deployed terabit-per-wavelength coherent links, demonstrating high-capacity requirements beyond consumer access. For equipment purchases from 2027 through 2036, local customers will need support for applicable standards and long-term field service. National buying institutions make different trade-offs between capital affordability, technical specifications, procurement schedule and maintenance responsibilities. A successful installation therefore depends on both the physical equipment and the expertise needed to operate it reliably.

Market instances

  • Saudi Arabia: metro and long-haul traffic growth. Projects in Saudi Arabia show how United Arab Emirates optical-network investments have included commercially deployed terabit-per-wavelength coherent links, demonstrating high-capacity requirements beyond consumer access. Between 2027 and 2036, Metro and long-haul traffic growth provides an identifiable commercial reason to evaluate optical transponder equipment. The implications extend beyond purchase price because installation quality, interoperability and long-term service all affect usable lifetime. Engineering consultants and operating customers typically need documented performance before scaling a project across multiple network sites or facilities.
  • United Arab Emirates: cloud data-center interconnection. Projects in United Arab Emirates show how United Arab Emirates optical-network investments have included commercially deployed terabit-per-wavelength coherent links, demonstrating high-capacity requirements beyond consumer access. Between 2027 and 2036, Cloud data-center interconnection provides an identifiable commercial reason to evaluate optical transponder equipment. The implications extend beyond purchase price because installation quality, interoperability and long-term service all affect usable lifetime. Engineering consultants and operating customers typically need documented performance before scaling a project across multiple network sites or facilities.
  • South Africa: coherent modulation and wdm advances. Projects in South Africa show how United Arab Emirates optical-network investments have included commercially deployed terabit-per-wavelength coherent links, demonstrating high-capacity requirements beyond consumer access. Between 2027 and 2036, Coherent modulation and WDM advances provides an identifiable commercial reason to evaluate optical transponder equipment. The implications extend beyond purchase price because installation quality, interoperability and long-term service all affect usable lifetime. Engineering consultants and operating customers typically need documented performance before scaling a project across multiple network sites or facilities.
In the full report: country-specific optical transponder revenue, supplier position, installation counts, pricing, customer project structures and procurement forecasts for Saudi Arabia, United Arab Emirates, South Africa.

Competitive Landscape

Optical Transponder competition depends on the ability to deliver equipment that can be installed, qualified and maintained in complex operating systems. Relevant companies in the competitive landscape include Finisar, Avago, Sumitomo, JDSU, Lumentum, OpLink. Historical brands, acquired operations and adjacent component suppliers do not necessarily compete as independent present-day manufacturers, making current product availability more important than inherited company lists.

Platform vendors compete on whole-system qualification and channel support. Lumentum and Source Photonics illustrate the range of companies associated with this sector, although product scope differs across suppliers. Winning long deployment programmes requires dependable maintenance, documentation and firmware or interface compatibility, not only short laboratory performance demonstrations. This matters for optical transponder purchasing because qualification and life-cycle service determines whether a technically valid design reaches stable operating performance. System operators evaluate the equipment within a defined service environment, checking field reliability, supplier support, installation complexity and the consequences of an outage. The commercial outcome therefore depends on total installed cost and a credible lifecycle improvement, rather than an isolated component specification.

Companies serving more than one networking or sensing market often disclose broad company revenue, which includes products beyond optical transponder. Commercial comparisons therefore depend on catalog-level verification, qualified installation references and confirmed manufacturing or service responsibility. A supplier specializing in an optical subsystem may have different risk exposure from a vendor delivering an entire transport or power-control platform.

Systems procurement is frequently formal and technical. Purchasers request vendor qualifications, test data, expected availability, replacement procedures and defined support periods. Transport platform vendors, network integrators, enterprise infrastructure teams and telecom carriers can shorten implementation risk when they have relevant application experience. Distribution reach is valuable for installed equipment support but does not guarantee success in greenfield competitive tenders.

Technology competition includes maintaining existing equipment. Installed components and associated service skills can favor long-term incumbents, while standards-based designs open selective opportunities for new suppliers. The lowest quoted unit cost rarely reflects the full project economics: downtime exposure, spare inventory, calibration, training and energy consumption can alter the best commercially defensible choice.

Tier structure

Tier Companies Basis of competition
Direct equipment leaders Lumentum, Fujitsu, Source Photonics This group competes with active product families, integration support and large network or industrial customer relationships. Purchasing decisions reward field performance, technical engineering coverage and the ability to support predictable supplies over the installation lifetime. This matters for optical transponder purchasing because enterprise and utility qualification determines whether a technically valid design reaches stable operating performance. System operators evaluate the equipment within a defined service environment, checking field reliability, supplier support, installation complexity and the consequences of an outage. The commercial outcome therefore depends on total installed cost and a credible lifecycle improvement, rather than an isolated component specification.
Specialized and related suppliers Sumitomo, EMCORE, Coherent (Finisar legacy), Broadcom (Avago legacy) These participants supply qualified modules, related optical devices and system infrastructure in different commercial roles. Customer qualification can differ significantly between legacy products, modern replacements and products sold only as a subassembly to a larger equipment manufacturer. This matters for optical transponder purchasing because product scope and supply continuity determines whether a technically valid design reaches stable operating performance. System operators evaluate the equipment within a defined service environment, checking field reliability, supplier support, installation complexity and the consequences of an outage. The commercial outcome therefore depends on total installed cost and a credible lifecycle improvement, rather than an isolated component specification.
Systems and enabling ecosystem Component makers, equipment integrators, standards laboratories System integrators and component vendors influence design feasibility, testing, maintenance and interoperability but are not automatically independent sellers of the whole end-market product. Their bargaining power follows equipment qualification, installation competence and long-term service requirements. This matters for optical transponder purchasing because vendor-channel responsibilities determines whether a technically valid design reaches stable operating performance. System operators evaluate the equipment within a defined service environment, checking field reliability, supplier support, installation complexity and the consequences of an outage. The commercial outcome therefore depends on total installed cost and a credible lifecycle improvement, rather than an isolated component specification.

Key companies profiled

  • Finisar
  • Avago
  • Sumitomo
  • JDSU
  • Lumentum
  • OpLink
  • Fujitsu
  • Source Photonics
  • NeoPhotonics
  • Emcore
  • Hitachi Metals
  • Ruby Tech
  • WTD
  • Hioso
  • Wantong
  • Green Well
  • Huahuan
  • CMR
  • Bricom

Production Capacity Analysis

Capacity for optical transponder is governed by equipment manufacturing and specialist installation expertise together. Component throughput, supplier qualification, field acceptance and spare-system availability affect delivery schedules. Capital spending on facilities or networks is not itself equivalent to product output, and supplier claims about larger technology portfolios do not establish sales volumes for every market type.

Production depends on the upstream optical or electronic elements used in optical transponder, coupled with assembly and system testing. Manufacturers need reproducible performance and controlled documentation because a small component deviation can cause expensive field troubleshooting. Geographic diversification can reduce delivery concentration but also creates additional factory qualification work. This matters for optical transponder purchasing because supply chain capacity and quality determines whether a technically valid design reaches stable operating performance. System operators evaluate the equipment within a defined service environment, checking field reliability, supplier support, installation complexity and the consequences of an outage. The commercial outcome therefore depends on total installed cost and a credible lifecycle improvement, rather than an isolated component specification.

Overseas and diversified manufacturing help reduce logistics and origin risks, but changing a material supplier or factory is not always transparent to equipment buyers. Qualified bills of materials, agreed change-control processes and availability of repair or replacement units matter during project commissioning. The best sourcing decisions balance factory efficiency with customer-specific service expectations.

The upstream constraint is often specialist components, not simple enclosure assembly. Power and thermal budgets can restrict usable output even if nominal hardware production is high. Maintaining multiple approved suppliers is expensive, but single-source dependency can increase schedule risk when a service provider or utility operates a critical communications or electrical system.

Market Dynamics

The market evolves through infrastructure investment, device modernization and installed-base replacement. Metro and long-haul traffic growth supports demand while legacy line-rate obsolescence can delay projects. Market growth is not uniform: an upgrade may substantially raise the performance of a system without increasing the number of sites, and equipment price declines can alter revenue even when deployed unit counts rise.

MARKET DRIVERS

Drivers Impact Analysis*

Driver (~) % impact on CAGR forecast Geographic relevance Impact timeline
Metro and long-haul traffic growth +1.8% Asia-Pacific 2027–2030
Cloud data-center interconnection +1.3% North America 2028–2032
Coherent modulation and WDM advances +1.1% Europe 2027–2033
Fiber backbone refresh programmes +0.7% South America 2030–2036
Metro and long-haul traffic growth +0.6% Middle East & Africa 2029–2035

Metro and long-haul traffic growth

Metro and long-haul traffic growth creates demand where higher-capacity or safer operations cannot be achieved through an inexpensive incremental change to existing devices. The commercial response involves equipment specifications, systems integration and repeatable acceptance testing. In many customer installations, projects compete for capital with other priorities, so manufacturers benefit from quantifying reliability, operating cost and migration impact in procurement discussions.

Cloud data-center interconnection

Cloud data-center interconnection creates demand where higher-capacity or safer operations cannot be achieved through an inexpensive incremental change to existing devices. The commercial response involves equipment specifications, systems integration and repeatable acceptance testing. In many customer installations, projects compete for capital with other priorities, so manufacturers benefit from quantifying reliability, operating cost and migration impact in procurement discussions.

Coherent modulation and WDM advances

Coherent modulation and WDM advances creates demand where higher-capacity or safer operations cannot be achieved through an inexpensive incremental change to existing devices. The commercial response involves equipment specifications, systems integration and repeatable acceptance testing. In many customer installations, projects compete for capital with other priorities, so manufacturers benefit from quantifying reliability, operating cost and migration impact in procurement discussions.

Fiber backbone refresh programmes

Fiber backbone refresh programmes creates demand where higher-capacity or safer operations cannot be achieved through an inexpensive incremental change to existing devices. The commercial response involves equipment specifications, systems integration and repeatable acceptance testing. In many customer installations, projects compete for capital with other priorities, so manufacturers benefit from quantifying reliability, operating cost and migration impact in procurement discussions.

MARKET RESTRAINTS

Restraints Impact Analysis*

Restraint (~) % impact on CAGR forecast Geographic relevance Impact timeline
Legacy line-rate obsolescence -1.5% Asia-Pacific 2027–2033
Power and thermal budgets -1.0% North America 2027–2036
Optical system qualification cost -0.8% Europe 2028–2032
Price pressure and supply concentration -0.6% South America 2027–2034

Legacy line-rate obsolescence

Legacy line-rate obsolescence reduces near-term equipment adoption because technical improvements do not remove the need for customer retraining, accepted engineering interfaces and site-specific installation. Purchasers can postpone a refresh when working infrastructure still meets required service or safety levels. Suppliers mitigate this risk with incremental migration paths, transparent qualification evidence, field support and engineering services matched to the actual operating system.

Power and thermal budgets

Power and thermal budgets reduces near-term equipment adoption because technical improvements do not remove the need for customer retraining, accepted engineering interfaces and site-specific installation. Purchasers can postpone a refresh when working infrastructure still meets required service or safety levels. Suppliers mitigate this risk with incremental migration paths, transparent qualification evidence, field support and engineering services matched to the actual operating system.

Optical system qualification cost

Optical system qualification cost reduces near-term equipment adoption because technical improvements do not remove the need for customer retraining, accepted engineering interfaces and site-specific installation. Purchasers can postpone a refresh when working infrastructure still meets required service or safety levels. Suppliers mitigate this risk with incremental migration paths, transparent qualification evidence, field support and engineering services matched to the actual operating system.

Price pressure and supply concentration

Price pressure and supply concentration reduces near-term equipment adoption because technical improvements do not remove the need for customer retraining, accepted engineering interfaces and site-specific installation. Purchasers can postpone a refresh when working infrastructure still meets required service or safety levels. Suppliers mitigate this risk with incremental migration paths, transparent qualification evidence, field support and engineering services matched to the actual operating system.

MARKET OPPORTUNITIES

800ZR coherent pluggable systems

800ZR coherent pluggable systems offers a commercial opening when a new technical requirement intersects with a scheduled infrastructure decision. Equipment suppliers can develop offerings that reduce integration risk and make the installation outcome more predictable. Adoption remains tied to qualification, investment budgets, supply assurance and availability of maintenance skills; an attractive technological capability alone is not sufficient to generate a confirmed order.

Interoperable IP over DWDM

Interoperable IP over DWDM offers a commercial opening when a new technical requirement intersects with a scheduled infrastructure decision. Equipment suppliers can develop offerings that reduce integration risk and make the installation outcome more predictable. Adoption remains tied to qualification, investment budgets, supply assurance and availability of maintenance skills; an attractive technological capability alone is not sufficient to generate a confirmed order.

Cross-border cloud transport

Cross-border cloud transport offers a commercial opening when a new technical requirement intersects with a scheduled infrastructure decision. Equipment suppliers can develop offerings that reduce integration risk and make the installation outcome more predictable. Adoption remains tied to qualification, investment budgets, supply assurance and availability of maintenance skills; an attractive technological capability alone is not sufficient to generate a confirmed order.

Subsea-to-inland backbone scaling

Subsea-to-inland backbone scaling offers a commercial opening when a new technical requirement intersects with a scheduled infrastructure decision. Equipment suppliers can develop offerings that reduce integration risk and make the installation outcome more predictable. Adoption remains tied to qualification, investment budgets, supply assurance and availability of maintenance skills; an attractive technological capability alone is not sufficient to generate a confirmed order.

Supply Chain Analysis

The optical transponder value chain links upstream engineered materials and specialty parts with equipment assembly, testing, project integration and the operating customer. Each handoff can affect delivery timing and serviceability. Mature supply relationships reduce the probability that a minor unqualified substitution changes performance or forces a costly acceptance test after the equipment has already been installed.

UpstreamOptical materials, precision electronic devices, high-reliability housings and interface standards are selected to satisfy the operating environment. Supply risk is concentrated in components that require specialist calibration or qualification. This matters for optical transponder purchasing because upstream qualification determines whether a technically valid design reaches stable operating performance. System operators evaluate the equipment within a defined service environment, checking field reliability, supplier support, installation complexity and the consequences of an outage. The commercial outcome therefore depends on total installed cost and a credible lifecycle improvement, rather than an isolated component specification.
ManufacturingEquipment production joins component assembly, end-of-line functional testing, controlled configuration and traceable documentation. Manufacturing yield alone is insufficient where the customer requires reproducible operating acceptance. This matters for optical transponder purchasing because assembly reliability determines whether a technically valid design reaches stable operating performance. System operators evaluate the equipment within a defined service environment, checking field reliability, supplier support, installation complexity and the consequences of an outage. The commercial outcome therefore depends on total installed cost and a credible lifecycle improvement, rather than an isolated component specification.
ChannelTransport platform vendors, network integrators, enterprise infrastructure teams and telecom carriers coordinate equipment specification, freight, installation, commissioning and user training. These services connect the manufacturer with practical purchasing decisions. This matters for optical transponder purchasing because channel integration determines whether a technically valid design reaches stable operating performance. System operators evaluate the equipment within a defined service environment, checking field reliability, supplier support, installation complexity and the consequences of an outage. The commercial outcome therefore depends on total installed cost and a credible lifecycle improvement, rather than an isolated component specification.
DownstreamOperators assess reliable operation, current support availability, service intervals and lifecycle expense. Approved alternatives must retain relevant performance and safety characteristics. This matters for optical transponder purchasing because downstream operations determines whether a technically valid design reaches stable operating performance. System operators evaluate the equipment within a defined service environment, checking field reliability, supplier support, installation complexity and the consequences of an outage. The commercial outcome therefore depends on total installed cost and a credible lifecycle improvement, rather than an isolated component specification.

Upstream sourcing. Specialty materials and components need lot traceability. Reliability depends on clear acceptance thresholds and named engineering responsibilities. Long-lived equipment purchases benefit when replacement units, firmware or test interfaces remain available during operations. Commercial leverage follows the ability to protect customer uptime while controlling total installed cost. This matters for optical transponder purchasing because Upstream sourcing determines whether a technically valid design reaches stable operating performance. System operators evaluate the equipment within a defined service environment, checking field reliability, supplier support, installation complexity and the consequences of an outage. The commercial outcome therefore depends on total installed cost and a credible lifecycle improvement, rather than an isolated component specification.

Manufacturing qualification. Systems must be tested before delivery. Reliability depends on clear acceptance thresholds and named engineering responsibilities. Long-lived equipment purchases benefit when replacement units, firmware or test interfaces remain available during operations. Commercial leverage follows the ability to protect customer uptime while controlling total installed cost. This matters for optical transponder purchasing because Manufacturing qualification determines whether a technically valid design reaches stable operating performance. System operators evaluate the equipment within a defined service environment, checking field reliability, supplier support, installation complexity and the consequences of an outage. The commercial outcome therefore depends on total installed cost and a credible lifecycle improvement, rather than an isolated component specification.

Distribution and field integration. Integrators coordinate on-site network or electrical work. Reliability depends on clear acceptance thresholds and named engineering responsibilities. Long-lived equipment purchases benefit when replacement units, firmware or test interfaces remain available during operations. Commercial leverage follows the ability to protect customer uptime while controlling total installed cost. This matters for optical transponder purchasing because Distribution and field integration determines whether a technically valid design reaches stable operating performance. System operators evaluate the equipment within a defined service environment, checking field reliability, supplier support, installation complexity and the consequences of an outage. The commercial outcome therefore depends on total installed cost and a credible lifecycle improvement, rather than an isolated component specification.

Downstream lifecycle. Customers maintain deployed systems over many years. Reliability depends on clear acceptance thresholds and named engineering responsibilities. Long-lived equipment purchases benefit when replacement units, firmware or test interfaces remain available during operations. Commercial leverage follows the ability to protect customer uptime while controlling total installed cost. This matters for optical transponder purchasing because Downstream lifecycle determines whether a technically valid design reaches stable operating performance. System operators evaluate the equipment within a defined service environment, checking field reliability, supplier support, installation complexity and the consequences of an outage. The commercial outcome therefore depends on total installed cost and a credible lifecycle improvement, rather than an isolated component specification.

Recent Developments

  • September 2026 Announced
    Constl and Ciena completed 1.6 Tb/s transmission over a live Indian long-haul network using WaveLogic 6 Extreme. The milestone demonstrates increasing optical capacity and interest in existing-fiber utilization, while also showing why next-generation equipment fits the Other type class rather than the much slower explicitly named legacy bands. This matters for optical transponder purchasing because coherent line capacity, fibre efficiency and network transport upgrades determines whether a technically valid design reaches stable operating performance. System operators evaluate the equipment within a defined service environment, checking field reliability, supplier support, installation complexity and the consequences of an outage. The commercial outcome therefore depends on total installed cost and a credible lifecycle improvement, rather than an isolated component specification. Source
  • September 2025 Announced
    Adtran reported multi-vendor coherent transceiver interoperability at ECOC 2025, using its open line system and 100ZR+/400ZRE modules. Interoperability reduces dependence on tightly coupled transport hardware, potentially improving tender competitiveness and migration economics for operators that want to retain installed line-system assets. This matters for optical transponder purchasing because coherent line capacity, fibre efficiency and network transport upgrades determines whether a technically valid design reaches stable operating performance. System operators evaluate the equipment within a defined service environment, checking field reliability, supplier support, installation complexity and the consequences of an outage. The commercial outcome therefore depends on total installed cost and a credible lifecycle improvement, rather than an isolated component specification. Source
  • March 2025 Announced
    Coherent announced commercial availability of its 800G ZR/ZR+ QSFP-DD transceiver for metro, regional and data-center interconnection. The launch signals growing value in pluggable optical transport and can shift equipment procurement from dedicated transponder shelves to router-integrated solutions in eligible network applications. This matters for optical transponder purchasing because coherent line capacity, fibre efficiency and network transport upgrades determines whether a technically valid design reaches stable operating performance. System operators evaluate the equipment within a defined service environment, checking field reliability, supplier support, installation complexity and the consequences of an outage. The commercial outcome therefore depends on total installed cost and a credible lifecycle improvement, rather than an isolated component specification. Source
  • March 2025 Published
    Adtran demonstrated 100G through 800G coherent interfaces across a multi-vendor transport test configuration at OFC. Open optical line systems can give carriers an alternative to full vendor stack replacement, but validation of real spans, operational monitoring and maintenance procedures remains necessary before commercial introduction. This matters for optical transponder purchasing because coherent line capacity, fibre efficiency and network transport upgrades determines whether a technically valid design reaches stable operating performance. System operators evaluate the equipment within a defined service environment, checking field reliability, supplier support, installation complexity and the consequences of an outage. The commercial outcome therefore depends on total installed cost and a credible lifecycle improvement, rather than an isolated component specification. Source
  • March 2025 Announced
    Adtran unveiled its FSP 3000 IP open line system in response to demands for simpler transport from AI workloads and cloud connections. The design emphasizes small footprints, capacity scaling and optical monitoring, indicating that equipment integration and operating power are increasingly central to transport procurement. This matters for optical transponder purchasing because coherent line capacity, fibre efficiency and network transport upgrades determines whether a technically valid design reaches stable operating performance. System operators evaluate the equipment within a defined service environment, checking field reliability, supplier support, installation complexity and the consequences of an outage. The commercial outcome therefore depends on total installed cost and a credible lifecycle improvement, rather than an isolated component specification. Source
  • February 2025 Reported
    Ciena and e& UAE reported a live deployment of WaveLogic 6 Extreme delivering a 1.6 Tb/s wavelength in the Middle East and Africa. It illustrates how network operators use coherent technology to expand capacity over existing optical footprints while bringing additional engineering requirements for span qualification and energy budgeting. This matters for optical transponder purchasing because coherent line capacity, fibre efficiency and network transport upgrades determines whether a technically valid design reaches stable operating performance. System operators evaluate the equipment within a defined service environment, checking field reliability, supplier support, installation complexity and the consequences of an outage. The commercial outcome therefore depends on total installed cost and a credible lifecycle improvement, rather than an isolated component specification. Source

REPORT SCOPE & SEGMENTATION

Attribute Details
Study Period 2021–2036
Base Year 2026
Estimated Year 2027
Forecast Period 2027–2036
Historical Period 2021–2025
2026 Market Size USD 9,635 million
2027 Estimated Size USD 10,627 million
2036 Forecast Size USD 25,681 million
Growth Rate 10.3%
Revenue Unit USD million
Market Definition standalone optical transponders, pluggable optical channel interfaces and transport transponder line cards sold to fiber-network operators, enterprises and integrators; excludes the value of an entire router, fiber cable and duplicated downstream network services
By Type 155 Mbps · 2.5 Gbps · 10 Gbps · Other
By Application Government Unit · Commercial Company · Colleges And Universities · Household · Other
By Region Coverage by purchase geography; region estimates refer to 2026 equipment revenue.
Asia-PacificChina · Japan · India · South Korea
North AmericaUnited States · Canada · Mexico
EuropeGermany · United Kingdom · France
South AmericaBrazil · Chile · Colombia
Middle East & AfricaSaudi Arabia · United Arab Emirates · South Africa
Key Companies Profiled Finisar; Avago; Sumitomo; JDSU; Lumentum; OpLink; Fujitsu; Source Photonics; NeoPhotonics; Emcore; Hitachi Metals; Ruby Tech; WTD; Hioso; Wantong; Green Well; Huahuan; CMR; Bricom
Customization Scope country-level equipment purchases, the listed type and application classes, supplier qualification, installed-base renewal, regional pricing and supply-chain information for optical transponder.

Frequently Asked Questions

What is the global optical transponder market size?

The global optical transponder market stands at USD 9,635 million for 2026 and is projected at USD 25,681 million by 2036, a 10.3% CAGR during 2027–2036. Sales depend on infrastructure investment, qualification and operating conditions rather than a simple multiplication of subscriber, building or electricity-load figures. Product cost and associated integration requirements can also move differently over time.

Which region leads the optical transponder market?

Asia-Pacific holds the leading estimated 2026 share of ~43%, ahead of North America at ~26% and Europe at ~20%. Demand reflects customer projects, supply capability and system integration services. Region of component manufacture does not invariably equal region of the ultimate installation or equipment purchase. This matters for optical transponder purchasing because FAQ commercial relevance determines whether a technically valid design reaches stable operating performance. System operators evaluate the equipment within a defined service environment, checking field reliability, supplier support, installation complexity and the consequences of an outage. The commercial outcome therefore depends on total installed cost and a credible lifecycle improvement, rather than an isolated component specification.

Which region is growing most quickly?

Middle East & Africa shows the highest estimated regional growth at ~11.2% CAGR through 2036. United Arab Emirates optical-network investments have included commercially deployed terabit-per-wavelength coherent links, demonstrating high-capacity requirements beyond consumer access. Saudi Arabia is investing in national digital infrastructure; South Africa is a regional backhaul and cloud gateway. Capital spending is frequently project-driven, with vendor finance, power availability and technical support affecting tender outcomes. The pace of conversion into purchase orders still depends on procurement budgets, local installer capabilities and compatibility with the equipment already in service.

What is the largest market segment by type?

Other leads with an estimated ~41% of 2026 revenue. The position is driven by product fit, relative equipment price and installed use cases. Demand for other types is shaped by separate engineering constraints, so a segment with the greatest shipment volume need not be the class with the highest average unit value.

Which type has the fastest growth?

Other has the strongest estimated type expansion at ~12.2% CAGR and an initial share of ~41%. Growth requires the product to satisfy real operating environments and integration standards, while more established types can continue generating revenue through maintenance and replacement requirements rather than new installations alone. This matters for optical transponder purchasing because FAQ commercial relevance determines whether a technically valid design reaches stable operating performance. System operators evaluate the equipment within a defined service environment, checking field reliability, supplier support, installation complexity and the consequences of an outage. The commercial outcome therefore depends on total installed cost and a credible lifecycle improvement, rather than an isolated component specification.

What is the leading application?

Commercial Company is the largest application at an estimated ~43% of 2026 sales. Project demand is connected with metro and long-haul traffic growth and reliable hardware availability. Purchasers specify site operating requirements before considering the optical equipment, which means overall infrastructure budgets cannot directly be interpreted as equipment revenue. This matters for optical transponder purchasing because FAQ commercial relevance determines whether a technically valid design reaches stable operating performance. System operators evaluate the equipment within a defined service environment, checking field reliability, supplier support, installation complexity and the consequences of an outage. The commercial outcome therefore depends on total installed cost and a credible lifecycle improvement, rather than an isolated component specification.

Which application expands fastest?

Commercial Company expands at an estimated ~11.3% CAGR from roughly ~43% initial share. Its purchasing dynamics are shaped by customer procurement cycles, technical regulation and system replacement plans. Suppliers must support design review, field commissioning and continuity of supply to convert growing application demand into repeatable sales. This matters for optical transponder purchasing because FAQ commercial relevance determines whether a technically valid design reaches stable operating performance. System operators evaluate the equipment within a defined service environment, checking field reliability, supplier support, installation complexity and the consequences of an outage. The commercial outcome therefore depends on total installed cost and a credible lifecycle improvement, rather than an isolated component specification.

Who are the important companies in this market?

Relevant companies in the competitive landscape include Finisar, Avago, Sumitomo, JDSU, Lumentum, OpLink, Fujitsu. These participants have different roles, including original equipment supply, optical components, system integration and historical acquired product lines. Present-day direct supplier status must be assessed at the product-family level rather than inferred from broad corporate revenues or former company names.

What restrains faster market adoption?

Legacy line-rate obsolescence and power and thermal budgets are important barriers, alongside integration cost and customer reliance on existing equipment. A purchaser may defer adoption until scheduled refurbishment even when optical systems improve performance. Regulatory acceptance, training, field testing and end-to-end serviceability can matter more to a safety-critical or mission-critical operator than a headline technology specification.

What are the report period and segmentation?

The study uses 2026 as the base year, 2027 as the estimated year and 2036 as the forecast endpoint, with historical context from 2021 through 2025. Segmentation covers 155 Mbps, 2.5 Gbps, 10 Gbps, Other by type and Government Unit, Commercial Company, Colleges And Universities, Household, Other by application across all five world regions. The discussion addresses equipment supply, qualification and procurement channels as well as customer needs.

Research Sources & Evidence Base

View research sources used for this overview
  1. Ciena. e& UAE coherent deployment, 27 February 2025 launch of 1.6 Tb/s per wavelength transmission
  2. Ciena. WaveLogic 6 uptake, manufacturer 2025 account of 72 WL6e customers by fiscal year end
  3. Ciena. Constl India coherent field test, 29 September 2026 live-network 1.6 Tb/s channel statement
  4. Nokia. PSE-6s coherent engine, manufacturer details of coherent transponder architecture and per-bit efficiency
  5. Nokia. GlobalConnect optical trial, 1.2 Tb/s live single-wavelength coherent optical transport in Northern Europe
  6. Nokia. Coherent metro data-centre interconnection, vendor technical study of PSE-6s and 400ZR operating differences
  7. Coherent. 800ZR optical modules, 28 March 2025 launch of commercial 800G ZR/ZR+ QSFP-DD
  8. ADTRAN. OFC 2025 multi-rate transport, 26 March 2025 transport 100G-800G interoperability demonstration
  9. ADTRAN. ECOC 2025 open networking, 25 September 2025 100ZR+ and 400ZRE multi-vendor testing
  10. ADTRAN. FSP 3000 IP OLS, 25 March 2025 optical line system supporting 400G to 1.6T
  11. OIF. 800ZR Implementation Agreement, 8 October 2024 interoperation specification for coherent interfaces
  12. ITU. ITU-T G.698.2 DWDM interfaces, 2018 standard on amplified metro WDM interoperability
  13. ITU. 800G optical interface standards work, 2026 standards work item to expand G.698.2 metro channel classes
  14. ITU. Worldwide fixed network traffic, 2025 statistics on 7.3 ZB estimated fixed-broadband traffic
  15. GSMA. Mobile Economy 2025, industry association outlook for mobile traffic demand
  16. GSMA. Asia Pacific connectivity 2026, association outlook for regional communications investment
  17. ITU. Broadband subscriptions, 2025 official subscriber growth evidence
Optical Transponder Market

Get Sample Report PDF for Exclusive Insights

Report Sample Includes

  • Table of Contents
  • List of Tables & Figures
  • Charts, Research Methodology, and more...

PDF Icon Download Sample Report PDF

Download Sample Report

Table of Content

Table of Contents
1 Research Methodology and Statistical Scope
1.1 Market Definition and Statistical Scope of Optical Transponder
1.2 Key Market Segments
1.2.1 Optical Transponder Segment by Type
1.2.2 Optical Transponder Segment by Application
1.3 Methodology & Sources of Information
1.3.1 Research Methodology
1.3.2 Research Process
1.3.3 Market Breakdown and Data Triangulation
1.3.4 Base Year
1.3.5 Report Assumptions & Caveats
2 Optical Transponder Market Overview
2.1 Global Market Overview
2.1.1 Global Optical Transponder Market Size (M USD) Estimates and Forecasts (2026-2034)
2.1.2 Global Optical Transponder Sales Estimates and Forecasts (2026-2034)
2.2 Market Segment Executive Summary
2.3 Global Market Size by Region
3 Optical Transponder Market Competitive Landscape
3.1 Global Optical Transponder Sales by Manufacturers (2019-2025)
3.2 Global Optical Transponder Revenue Market Share by Manufacturers (2019-2025)
3.3 Optical Transponder Market Share by Company Type (Tier 1, Tier 2, and Tier 3)
3.4 Global Optical Transponder Average Price by Manufacturers (2019-2025)
3.5 Manufacturers Optical Transponder Sales Sites, Area Served, Product Type
3.6 Optical Transponder Market Competitive Situation and Trends
3.6.1 Optical Transponder Market Concentration Rate
3.6.2 Global 5 and 10 Largest Optical Transponder Players Market Share by Revenue
3.6.3 Mergers & Acquisitions, Expansion
4 Optical Transponder Industry Chain Analysis
4.1 Optical Transponder Industry Chain Analysis
4.2 Market Overview of Key Raw Materials
4.3 Midstream Market Analysis
4.4 Downstream Customer Analysis
5 The Development and Dynamics of Optical Transponder Market
5.1 Key Development Trends
5.2 Driving Factors
5.3 Market Challenges
5.4 Market Restraints
5.5 Industry News
5.5.1 New Product Developments
5.5.2 Mergers & Acquisitions
5.5.3 Expansions
5.5.4 Collaboration/Supply Contracts
5.6 Industry Policies
6 Optical Transponder Market Segmentation by Type
6.1 Evaluation Matrix of Segment Market Development Potential (Type)
6.2 Global Optical Transponder Sales Market Share by Type (2019-2025)
6.3 Global Optical Transponder Market Size Market Share by Type (2019-2025)
6.4 Global Optical Transponder Price by Type (2019-2025)
7 Optical Transponder Market Segmentation by Application
7.1 Evaluation Matrix of Segment Market Development Potential (Application)
7.2 Global Optical Transponder Market Sales by Application (2019-2025)
7.3 Global Optical Transponder Market Size (M USD) by Application (2019-2025)
7.4 Global Optical Transponder Sales Growth Rate by Application (2019-2025)
8 Optical Transponder Market Consumption by Region
8.1 Global Optical Transponder Sales by Region
8.1.1 Global Optical Transponder Sales by Region
8.1.2 Global Optical Transponder Sales Market Share by Region
8.2 North America
8.2.1 North America Optical Transponder Sales by Country
8.2.2 U.S.
8.2.3 Canada
8.2.4 Mexico
8.3 Europe
8.3.1 Europe Optical Transponder Sales by Country
8.3.2 Germany
8.3.3 France
8.3.4 U.K.
8.3.5 Italy
8.3.6 Russia
8.4 Asia Pacific
8.4.1 Asia Pacific Optical Transponder Sales by Region
8.4.2 China
8.4.3 Japan
8.4.4 South Korea
8.4.5 India
8.4.6 Southeast Asia
8.5 South America
8.5.1 South America Optical Transponder Sales by Country
8.5.2 Brazil
8.5.3 Argentina
8.5.4 Columbia
8.6 Middle East and Africa
8.6.1 Middle East and Africa Optical Transponder Sales by Region
8.6.2 Saudi Arabia
8.6.3 UAE
8.6.4 Egypt
8.6.5 Nigeria
8.6.6 South Africa
9 Optical Transponder Market Production by Region
9.1 Global Production of Optical Transponder by Region (2019-2025)
9.2 Global Optical Transponder Revenue Market Share by Region (2019-2025)
9.3 Global Optical Transponder Production, Revenue, Price and Gross Margin (2019-2025)
9.4 North America Optical Transponder Production
9.4.1 North America Optical Transponder Production Growth Rate (2019-2025)
9.4.2 North America Optical Transponder Production, Revenue, Price and Gross Margin (2019-2025)
9.5 Europe Optical Transponder Production
9.5.1 Europe Optical Transponder Production Growth Rate (2019-2025)
9.5.2 Europe Optical Transponder Production, Revenue, Price and Gross Margin (2019-2025)
9.6 Japan Optical Transponder Production (2019-2025)
9.6.1 Japan Optical Transponder Production Growth Rate (2019-2025)
9.6.2 Japan Optical Transponder Production, Revenue, Price and Gross Margin (2019-2025)
9.7 China Optical Transponder Production (2019-2025)
9.7.1 China Optical Transponder Production Growth Rate (2019-2025)
9.7.2 China Optical Transponder Production, Revenue, Price and Gross Margin (2019-2025)
10 Key Companies Profile
10.1 Finisar
10.1.1 Finisar Optical Transponder Basic Information
10.1.2 Finisar Optical Transponder Product Overview
10.1.3 Finisar Optical Transponder Product Market Performance
10.1.4 Finisar Business Overview
10.1.5 Finisar Optical Transponder SWOT Analysis
10.1.6 Finisar Recent Developments
10.2 Avago
10.2.1 Avago Optical Transponder Basic Information
10.2.2 Avago Optical Transponder Product Overview
10.2.3 Avago Optical Transponder Product Market Performance
10.2.4 Avago Business Overview
10.2.5 Avago Optical Transponder SWOT Analysis
10.2.6 Avago Recent Developments
10.3 Sumitomo
10.3.1 Sumitomo Optical Transponder Basic Information
10.3.2 Sumitomo Optical Transponder Product Overview
10.3.3 Sumitomo Optical Transponder Product Market Performance
10.3.4 Sumitomo Optical Transponder SWOT Analysis
10.3.5 Sumitomo Business Overview
10.3.6 Sumitomo Recent Developments
10.4 JDSU
10.4.1 JDSU Optical Transponder Basic Information
10.4.2 JDSU Optical Transponder Product Overview
10.4.3 JDSU Optical Transponder Product Market Performance
10.4.4 JDSU Business Overview
10.4.5 JDSU Recent Developments
10.5 Lumentum
10.5.1 Lumentum Optical Transponder Basic Information
10.5.2 Lumentum Optical Transponder Product Overview
10.5.3 Lumentum Optical Transponder Product Market Performance
10.5.4 Lumentum Business Overview
10.5.5 Lumentum Recent Developments
10.6 OpLink
10.6.1 OpLink Optical Transponder Basic Information
10.6.2 OpLink Optical Transponder Product Overview
10.6.3 OpLink Optical Transponder Product Market Performance
10.6.4 OpLink Business Overview
10.6.5 OpLink Recent Developments
10.7 Fujitsu
10.7.1 Fujitsu Optical Transponder Basic Information
10.7.2 Fujitsu Optical Transponder Product Overview
10.7.3 Fujitsu Optical Transponder Product Market Performance
10.7.4 Fujitsu Business Overview
10.7.5 Fujitsu Recent Developments
10.8 Source Photonics
10.8.1 Source Photonics Optical Transponder Basic Information
10.8.2 Source Photonics Optical Transponder Product Overview
10.8.3 Source Photonics Optical Transponder Product Market Performance
10.8.4 Source Photonics Business Overview
10.8.5 Source Photonics Recent Developments
10.9 NeoPhotonics
10.9.1 NeoPhotonics Optical Transponder Basic Information
10.9.2 NeoPhotonics Optical Transponder Product Overview
10.9.3 NeoPhotonics Optical Transponder Product Market Performance
10.9.4 NeoPhotonics Business Overview
10.9.5 NeoPhotonics Recent Developments
10.10 Emcore
10.10.1 Emcore Optical Transponder Basic Information
10.10.2 Emcore Optical Transponder Product Overview
10.10.3 Emcore Optical Transponder Product Market Performance
10.10.4 Emcore Business Overview
10.10.5 Emcore Recent Developments
10.11 Hitachi Metals
10.11.1 Hitachi Metals Optical Transponder Basic Information
10.11.2 Hitachi Metals Optical Transponder Product Overview
10.11.3 Hitachi Metals Optical Transponder Product Market Performance
10.11.4 Hitachi Metals Business Overview
10.11.5 Hitachi Metals Recent Developments
10.12 Ruby Tech
10.12.1 Ruby Tech Optical Transponder Basic Information
10.12.2 Ruby Tech Optical Transponder Product Overview
10.12.3 Ruby Tech Optical Transponder Product Market Performance
10.12.4 Ruby Tech Business Overview
10.12.5 Ruby Tech Recent Developments
10.13 WTD
10.13.1 WTD Optical Transponder Basic Information
10.13.2 WTD Optical Transponder Product Overview
10.13.3 WTD Optical Transponder Product Market Performance
10.13.4 WTD Business Overview
10.13.5 WTD Recent Developments
10.14 Hioso
10.14.1 Hioso Optical Transponder Basic Information
10.14.2 Hioso Optical Transponder Product Overview
10.14.3 Hioso Optical Transponder Product Market Performance
10.14.4 Hioso Business Overview
10.14.5 Hioso Recent Developments
10.15 Wantong
10.15.1 Wantong Optical Transponder Basic Information
10.15.2 Wantong Optical Transponder Product Overview
10.15.3 Wantong Optical Transponder Product Market Performance
10.15.4 Wantong Business Overview
10.15.5 Wantong Recent Developments
10.16 Green Well
10.16.1 Green Well Optical Transponder Basic Information
10.16.2 Green Well Optical Transponder Product Overview
10.16.3 Green Well Optical Transponder Product Market Performance
10.16.4 Green Well Business Overview
10.16.5 Green Well Recent Developments
10.17 Huahuan
10.17.1 Huahuan Optical Transponder Basic Information
10.17.2 Huahuan Optical Transponder Product Overview
10.17.3 Huahuan Optical Transponder Product Market Performance
10.17.4 Huahuan Business Overview
10.17.5 Huahuan Recent Developments
10.18 CMR
10.18.1 CMR Optical Transponder Basic Information
10.18.2 CMR Optical Transponder Product Overview
10.18.3 CMR Optical Transponder Product Market Performance
10.18.4 CMR Business Overview
10.18.5 CMR Recent Developments
10.19 Bricom
10.19.1 Bricom Optical Transponder Basic Information
10.19.2 Bricom Optical Transponder Product Overview
10.19.3 Bricom Optical Transponder Product Market Performance
10.19.4 Bricom Business Overview
10.19.5 Bricom Recent Developments
11 Optical Transponder Market Forecast by Region
11.1 Global Optical Transponder Market Size Forecast
11.2 Global Optical Transponder Market Forecast by Region
11.2.1 North America Market Size Forecast by Country
11.2.2 Europe Optical Transponder Market Size Forecast by Country
11.2.3 Asia Pacific Optical Transponder Market Size Forecast by Region
11.2.4 South America Optical Transponder Market Size Forecast by Country
11.2.5 Middle East and Africa Forecasted Consumption of Optical Transponder by Country
12 Forecast Market by Type and by Application (2025-2032)
12.1 Global Optical Transponder Market Forecast by Type (2025-2032)
12.1.1 Global Forecasted Sales of Optical Transponder by Type (2025-2032)
12.1.2 Global Optical Transponder Market Size Forecast by Type (2025-2032)
12.1.3 Global Forecasted Price of Optical Transponder by Type (2025-2032)
12.2 Global Optical Transponder Market Forecast by Application (2025-2032)
12.2.1 Global Optical Transponder Sales (K Units) Forecast by Application
12.2.2 Global Optical Transponder Market Size (M USD) Forecast by Application (2025-2032)
13 Conclusion and Key FindingsList of Tables
Table 1. Introduction of the Type
Table 2. Introduction of the Application
Table 3. Market Size (M USD) Segment Executive Summary
Table 4. Optical Transponder Market Size Comparison by Region (M USD)
Table 5. Global Optical Transponder Sales (K Units) by Manufacturers (2019-2025)
Table 6. Global Optical Transponder Sales Market Share by Manufacturers (2019-2025)
Table 7. Global Optical Transponder Revenue (M USD) by Manufacturers (2019-2025)
Table 8. Global Optical Transponder Revenue Share by Manufacturers (2019-2025)
Table 9. Company Type (Tier 1, Tier 2, and Tier 3) & (based on the Revenue in Optical Transponder as of 2022)
Table 10. Global Market Optical Transponder Average Price (USD/Unit) of Key Manufacturers (2019-2025)
Table 11. Manufacturers Optical Transponder Sales Sites and Area Served
Table 12. Manufacturers Optical Transponder Product Type
Table 13. Global Optical Transponder Manufacturers Market Concentration Ratio (CR5 and HHI)
Table 14. Mergers & Acquisitions, Expansion Plans
Table 15. Industry Chain Map of Optical Transponder
Table 16. Market Overview of Key Raw Materials
Table 17. Midstream Market Analysis
Table 18. Downstream Customer Analysis
Table 19. Key Development Trends
Table 20. Driving Factors
Table 21. Optical Transponder Market Challenges
Table 22. Global Optical Transponder Sales by Type (K Units)
Table 23. Global Optical Transponder Market Size by Type (M USD)
Table 24. Global Optical Transponder Sales (K Units) by Type (2019-2025)
Table 25. Global Optical Transponder Sales Market Share by Type (2019-2025)
Table 26. Global Optical Transponder Market Size (M USD) by Type (2019-2025)
Table 27. Global Optical Transponder Market Size Share by Type (2019-2025)
Table 28. Global Optical Transponder Price (USD/Unit) by Type (2019-2025)
Table 29. Global Optical Transponder Sales (K Units) by Application
Table 30. Global Optical Transponder Market Size by Application
Table 31. Global Optical Transponder Sales by Application (2019-2025) & (K Units)
Table 32. Global Optical Transponder Sales Market Share by Application (2019-2025)
Table 33. Global Optical Transponder Sales by Application (2019-2025) & (M USD)
Table 34. Global Optical Transponder Market Share by Application (2019-2025)
Table 35. Global Optical Transponder Sales Growth Rate by Application (2019-2025)
Table 36. Global Optical Transponder Sales by Region (2019-2025) & (K Units)
Table 37. Global Optical Transponder Sales Market Share by Region (2019-2025)
Table 38. North America Optical Transponder Sales by Country (2019-2025) & (K Units)
Table 39. Europe Optical Transponder Sales by Country (2019-2025) & (K Units)
Table 40. Asia Pacific Optical Transponder Sales by Region (2019-2025) & (K Units)
Table 41. South America Optical Transponder Sales by Country (2019-2025) & (K Units)
Table 42. Middle East and Africa Optical Transponder Sales by Region (2019-2025) & (K Units)
Table 43. Global Optical Transponder Production (K Units) by Region (2019-2025)
Table 44. Global Optical Transponder Revenue (US$ Million) by Region (2019-2025)
Table 45. Global Optical Transponder Revenue Market Share by Region (2019-2025)
Table 46. Global Optical Transponder Production (K Units), Revenue (US$ Million), Price (USD/Unit) and Gross Margin (2019-2025)
Table 47. North America Optical Transponder Production (K Units), Revenue (US$ Million), Price (USD/Unit) and Gross Margin (2019-2025)
Table 48. Europe Optical Transponder Production (K Units), Revenue (US$ Million), Price (USD/Unit) and Gross Margin (2019-2025)
Table 49. Japan Optical Transponder Production (K Units), Revenue (US$ Million), Price (USD/Unit) and Gross Margin (2019-2025)
Table 50. China Optical Transponder Production (K Units), Revenue (US$ Million), Price (USD/Unit) and Gross Margin (2019-2025)
Table 51. Finisar Optical Transponder Basic Information
Table 52. Finisar Optical Transponder Product Overview
Table 53. Finisar Optical Transponder Sales (K Units), Revenue (M USD), Price (USD/Unit) and Gross Margin (2019-2025)
Table 54. Finisar Business Overview
Table 55. Finisar Optical Transponder SWOT Analysis
Table 56. Finisar Recent Developments
Table 57. Avago Optical Transponder Basic Information
Table 58. Avago Optical Transponder Product Overview
Table 59. Avago Optical Transponder Sales (K Units), Revenue (M USD), Price (USD/Unit) and Gross Margin (2019-2025)
Table 60. Avago Business Overview
Table 61. Avago Optical Transponder SWOT Analysis
Table 62. Avago Recent Developments
Table 63. Sumitomo Optical Transponder Basic Information
Table 64. Sumitomo Optical Transponder Product Overview
Table 65. Sumitomo Optical Transponder Sales (K Units), Revenue (M USD), Price (USD/Unit) and Gross Margin (2019-2025)
Table 66. Sumitomo Optical Transponder SWOT Analysis
Table 67. Sumitomo Business Overview
Table 68. Sumitomo Recent Developments
Table 69. JDSU Optical Transponder Basic Information
Table 70. JDSU Optical Transponder Product Overview
Table 71. JDSU Optical Transponder Sales (K Units), Revenue (M USD), Price (USD/Unit) and Gross Margin (2019-2025)
Table 72. JDSU Business Overview
Table 73. JDSU Recent Developments
Table 74. Lumentum Optical Transponder Basic Information
Table 75. Lumentum Optical Transponder Product Overview
Table 76. Lumentum Optical Transponder Sales (K Units), Revenue (M USD), Price (USD/Unit) and Gross Margin (2019-2025)
Table 77. Lumentum Business Overview
Table 78. Lumentum Recent Developments
Table 79. OpLink Optical Transponder Basic Information
Table 80. OpLink Optical Transponder Product Overview
Table 81. OpLink Optical Transponder Sales (K Units), Revenue (M USD), Price (USD/Unit) and Gross Margin (2019-2025)
Table 82. OpLink Business Overview
Table 83. OpLink Recent Developments
Table 84. Fujitsu Optical Transponder Basic Information
Table 85. Fujitsu Optical Transponder Product Overview
Table 86. Fujitsu Optical Transponder Sales (K Units), Revenue (M USD), Price (USD/Unit) and Gross Margin (2019-2025)
Table 87. Fujitsu Business Overview
Table 88. Fujitsu Recent Developments
Table 89. Source Photonics Optical Transponder Basic Information
Table 90. Source Photonics Optical Transponder Product Overview
Table 91. Source Photonics Optical Transponder Sales (K Units), Revenue (M USD), Price (USD/Unit) and Gross Margin (2019-2025)
Table 92. Source Photonics Business Overview
Table 93. Source Photonics Recent Developments
Table 94. NeoPhotonics Optical Transponder Basic Information
Table 95. NeoPhotonics Optical Transponder Product Overview
Table 96. NeoPhotonics Optical Transponder Sales (K Units), Revenue (M USD), Price (USD/Unit) and Gross Margin (2019-2025)
Table 97. NeoPhotonics Business Overview
Table 98. NeoPhotonics Recent Developments
Table 99. Emcore Optical Transponder Basic Information
Table 100. Emcore Optical Transponder Product Overview
Table 101. Emcore Optical Transponder Sales (K Units), Revenue (M USD), Price (USD/Unit) and Gross Margin (2019-2025)
Table 102. Emcore Business Overview
Table 103. Emcore Recent Developments
Table 104. Hitachi Metals Optical Transponder Basic Information
Table 105. Hitachi Metals Optical Transponder Product Overview
Table 106. Hitachi Metals Optical Transponder Sales (K Units), Revenue (M USD), Price (USD/Unit) and Gross Margin (2019-2025)
Table 107. Hitachi Metals Business Overview
Table 108. Hitachi Metals Recent Developments
Table 109. Ruby Tech Optical Transponder Basic Information
Table 110. Ruby Tech Optical Transponder Product Overview
Table 111. Ruby Tech Optical Transponder Sales (K Units), Revenue (M USD), Price (USD/Unit) and Gross Margin (2019-2025)
Table 112. Ruby Tech Business Overview
Table 113. Ruby Tech Recent Developments
Table 114. WTD Optical Transponder Basic Information
Table 115. WTD Optical Transponder Product Overview
Table 116. WTD Optical Transponder Sales (K Units), Revenue (M USD), Price (USD/Unit) and Gross Margin (2019-2025)
Table 117. WTD Business Overview
Table 118. WTD Recent Developments
Table 119. Hioso Optical Transponder Basic Information
Table 120. Hioso Optical Transponder Product Overview
Table 121. Hioso Optical Transponder Sales (K Units), Revenue (M USD), Price (USD/Unit) and Gross Margin (2019-2025)
Table 122. Hioso Business Overview
Table 123. Hioso Recent Developments
Table 124. Wantong Optical Transponder Basic Information
Table 125. Wantong Optical Transponder Product Overview
Table 126. Wantong Optical Transponder Sales (K Units), Revenue (M USD), Price (USD/Unit) and Gross Margin (2019-2025)
Table 127. Wantong Business Overview
Table 128. Wantong Recent Developments
Table 129. Green Well Optical Transponder Basic Information
Table 130. Green Well Optical Transponder Product Overview
Table 131. Green Well Optical Transponder Sales (K Units), Revenue (M USD), Price (USD/Unit) and Gross Margin (2019-2025)
Table 132. Green Well Business Overview
Table 133. Green Well Recent Developments
Table 134. Huahuan Optical Transponder Basic Information
Table 135. Huahuan Optical Transponder Product Overview
Table 136. Huahuan Optical Transponder Sales (K Units), Revenue (M USD), Price (USD/Unit) and Gross Margin (2019-2025)
Table 137. Huahuan Business Overview
Table 138. Huahuan Recent Developments
Table 139. CMR Optical Transponder Basic Information
Table 140. CMR Optical Transponder Product Overview
Table 141. CMR Optical Transponder Sales (K Units), Revenue (M USD), Price (USD/Unit) and Gross Margin (2019-2025)
Table 142. CMR Business Overview
Table 143. CMR Recent Developments
Table 144. Bricom Optical Transponder Basic Information
Table 145. Bricom Optical Transponder Product Overview
Table 146. Bricom Optical Transponder Sales (K Units), Revenue (M USD), Price (USD/Unit) and Gross Margin (2019-2025)
Table 147. Bricom Business Overview
Table 148. Bricom Recent Developments
Table 149. Global Optical Transponder Sales Forecast by Region (2025-2032) & (K Units)
Table 150. Global Optical Transponder Market Size Forecast by Region (2025-2032) & (M USD)
Table 151. North America Optical Transponder Sales Forecast by Country (2025-2032) & (K Units)
Table 152. North America Optical Transponder Market Size Forecast by Country (2025-2032) & (M USD)
Table 153. Europe Optical Transponder Sales Forecast by Country (2025-2032) & (K Units)
Table 154. Europe Optical Transponder Market Size Forecast by Country (2025-2032) & (M USD)
Table 155. Asia Pacific Optical Transponder Sales Forecast by Region (2025-2032) & (K Units)
Table 156. Asia Pacific Optical Transponder Market Size Forecast by Region (2025-2032) & (M USD)
Table 157. South America Optical Transponder Sales Forecast by Country (2025-2032) & (K Units)
Table 158. South America Optical Transponder Market Size Forecast by Country (2025-2032) & (M USD)
Table 159. Middle East and Africa Optical Transponder Consumption Forecast by Country (2025-2032) & (Units)
Table 160. Middle East and Africa Optical Transponder Market Size Forecast by Country (2025-2032) & (M USD)
Table 161. Global Optical Transponder Sales Forecast by Type (2025-2032) & (K Units)
Table 162. Global Optical Transponder Market Size Forecast by Type (2025-2032) & (M USD)
Table 163. Global Optical Transponder Price Forecast by Type (2025-2032) & (USD/Unit)
Table 164. Global Optical Transponder Sales (K Units) Forecast by Application (2025-2032)
Table 165. Global Optical Transponder Market Size Forecast by Application (2025-2032) & (M USD)
List of Figures
Figure 1. Product Picture of Optical Transponder
Figure 2. Data Triangulation
Figure 3. Key Caveats
Figure 4. Global Optical Transponder Market Size (M USD), 2026-2034
Figure 5. Global Optical Transponder Market Size (M USD) (2026-2034)
Figure 6. Global Optical Transponder Sales (K Units) & (2026-2034)
Figure 7. Evaluation Matrix of Segment Market Development Potential (Type)
Figure 8. Evaluation Matrix of Segment Market Development Potential (Application)
Figure 9. Evaluation Matrix of Regional Market Development Potential
Figure 10. Optical Transponder Market Size by Country (M USD)
Figure 11. Optical Transponder Sales Share by Manufacturers in 2023
Figure 12. Global Optical Transponder Revenue Share by Manufacturers in 2023
Figure 13. Optical Transponder Market Share by Company Type (Tier 1, Tier 2 and Tier 3): 2023
Figure 14. Global Market Optical Transponder Average Price (USD/Unit) of Key Manufacturers in 2023
Figure 15. The Global 5 and 10 Largest Players: Market Share by Optical Transponder Revenue in 2023
Figure 16. Evaluation Matrix of Segment Market Development Potential (Type)
Figure 17. Global Optical Transponder Market Share by Type
Figure 18. Sales Market Share of Optical Transponder by Type (2019-2025)
Figure 19. Sales Market Share of Optical Transponder by Type in 2023
Figure 20. Market Size Share of Optical Transponder by Type (2019-2025)
Figure 21. Market Size Market Share of Optical Transponder by Type in 2023
Figure 22. Evaluation Matrix of Segment Market Development Potential (Application)
Figure 23. Global Optical Transponder Market Share by Application
Figure 24. Global Optical Transponder Sales Market Share by Application (2019-2025)
Figure 25. Global Optical Transponder Sales Market Share by Application in 2023
Figure 26. Global Optical Transponder Market Share by Application (2019-2025)
Figure 27. Global Optical Transponder Market Share by Application in 2023
Figure 28. Global Optical Transponder Sales Growth Rate by Application (2019-2025)
Figure 29. Global Optical Transponder Sales Market Share by Region (2019-2025)
Figure 30. North America Optical Transponder Sales and Growth Rate (2019-2025) & (K Units)
Figure 31. North America Optical Transponder Sales Market Share by Country in 2023
Figure 32. U.S. Optical Transponder Sales and Growth Rate (2019-2025) & (K Units)
Figure 33. Canada Optical Transponder Sales (K Units) and Growth Rate (2019-2025)
Figure 34. Mexico Optical Transponder Sales (Units) and Growth Rate (2019-2025)
Figure 35. Europe Optical Transponder Sales and Growth Rate (2019-2025) & (K Units)
Figure 36. Europe Optical Transponder Sales Market Share by Country in 2023
Figure 37. Germany Optical Transponder Sales and Growth Rate (2019-2025) & (K Units)
Figure 38. France Optical Transponder Sales and Growth Rate (2019-2025) & (K Units)
Figure 39. U.K. Optical Transponder Sales and Growth Rate (2019-2025) & (K Units)
Figure 40. Italy Optical Transponder Sales and Growth Rate (2019-2025) & (K Units)
Figure 41. Russia Optical Transponder Sales and Growth Rate (2019-2025) & (K Units)
Figure 42. Asia Pacific Optical Transponder Sales and Growth Rate (K Units)
Figure 43. Asia Pacific Optical Transponder Sales Market Share by Region in 2023
Figure 44. China Optical Transponder Sales and Growth Rate (2019-2025) & (K Units)
Figure 45. Japan Optical Transponder Sales and Growth Rate (2019-2025) & (K Units)
Figure 46. South Korea Optical Transponder Sales and Growth Rate (2019-2025) & (K Units)
Figure 47. India Optical Transponder Sales and Growth Rate (2019-2025) & (K Units)
Figure 48. Southeast Asia Optical Transponder Sales and Growth Rate (2019-2025) & (K Units)
Figure 49. South America Optical Transponder Sales and Growth Rate (K Units)
Figure 50. South America Optical Transponder Sales Market Share by Country in 2023
Figure 51. Brazil Optical Transponder Sales and Growth Rate (2019-2025) & (K Units)
Figure 52. Argentina Optical Transponder Sales and Growth Rate (2019-2025) & (K Units)
Figure 53. Columbia Optical Transponder Sales and Growth Rate (2019-2025) & (K Units)
Figure 54. Middle East and Africa Optical Transponder Sales and Growth Rate (K Units)
Figure 55. Middle East and Africa Optical Transponder Sales Market Share by Region in 2023
Figure 56. Saudi Arabia Optical Transponder Sales and Growth Rate (2019-2025) & (K Units)
Figure 57. UAE Optical Transponder Sales and Growth Rate (2019-2025) & (K Units)
Figure 58. Egypt Optical Transponder Sales and Growth Rate (2019-2025) & (K Units)
Figure 59. Nigeria Optical Transponder Sales and Growth Rate (2019-2025) & (K Units)
Figure 60. South Africa Optical Transponder Sales and Growth Rate (2019-2025) & (K Units)
Figure 61. Global Optical Transponder Production Market Share by Region (2019-2025)
Figure 62. North America Optical Transponder Production (K Units) Growth Rate (2019-2025)
Figure 63. Europe Optical Transponder Production (K Units) Growth Rate (2019-2025)
Figure 64. Japan Optical Transponder Production (K Units) Growth Rate (2019-2025)
Figure 65. China Optical Transponder Production (K Units) Growth Rate (2019-2025)
Figure 66. Global Optical Transponder Sales Forecast by Volume (2026-2034) & (K Units)
Figure 67. Global Optical Transponder Market Size Forecast by Value (2026-2034) & (M USD)
Figure 68. Global Optical Transponder Sales Market Share Forecast by Type (2025-2032)
Figure 69. Global Optical Transponder Market Share Forecast by Type (2025-2032)
Figure 70. Global Optical Transponder Sales Forecast by Application (2025-2032)
Figure 71. Global Optical Transponder Market Share Forecast by Application (2025-2032)