
Key Statistics
Key Takeaways
- The validated forecast places the market at USD 295.8 million in 2025 and USD 484.3 million by 2034, representing a 5.6% CAGR during 2026–2034. The calculation is rebased from the report’s 2024 and 2032 anchors using their endpoint-implied compound relationship.
- Single-mode fiber platforms form the principal technology category because coherent reflectometry, high-resolution distributed measurements, and telecom-derived optical components are commonly designed around controlled single-mode propagation.
- Strain, temperature, and optical-component testing provide the core application mix, while aerospace structures, advanced materials, energy assets, photonic devices, and civil infrastructure create specialized engineering-led opportunities.
- North America is the largest market through its concentration of aerospace and defense engineering, research laboratories, photonics development, infrastructure testing, and established optical-test suppliers.
- Workflow performance is the competitive issue. Buyers evaluate the interrogator together with sensing fiber, installation method, calibration, analytics, data interfaces, training, and service because field execution determines whether spatial resolution becomes actionable information.
Optical Frequency Domain Reflectometry Market Overview
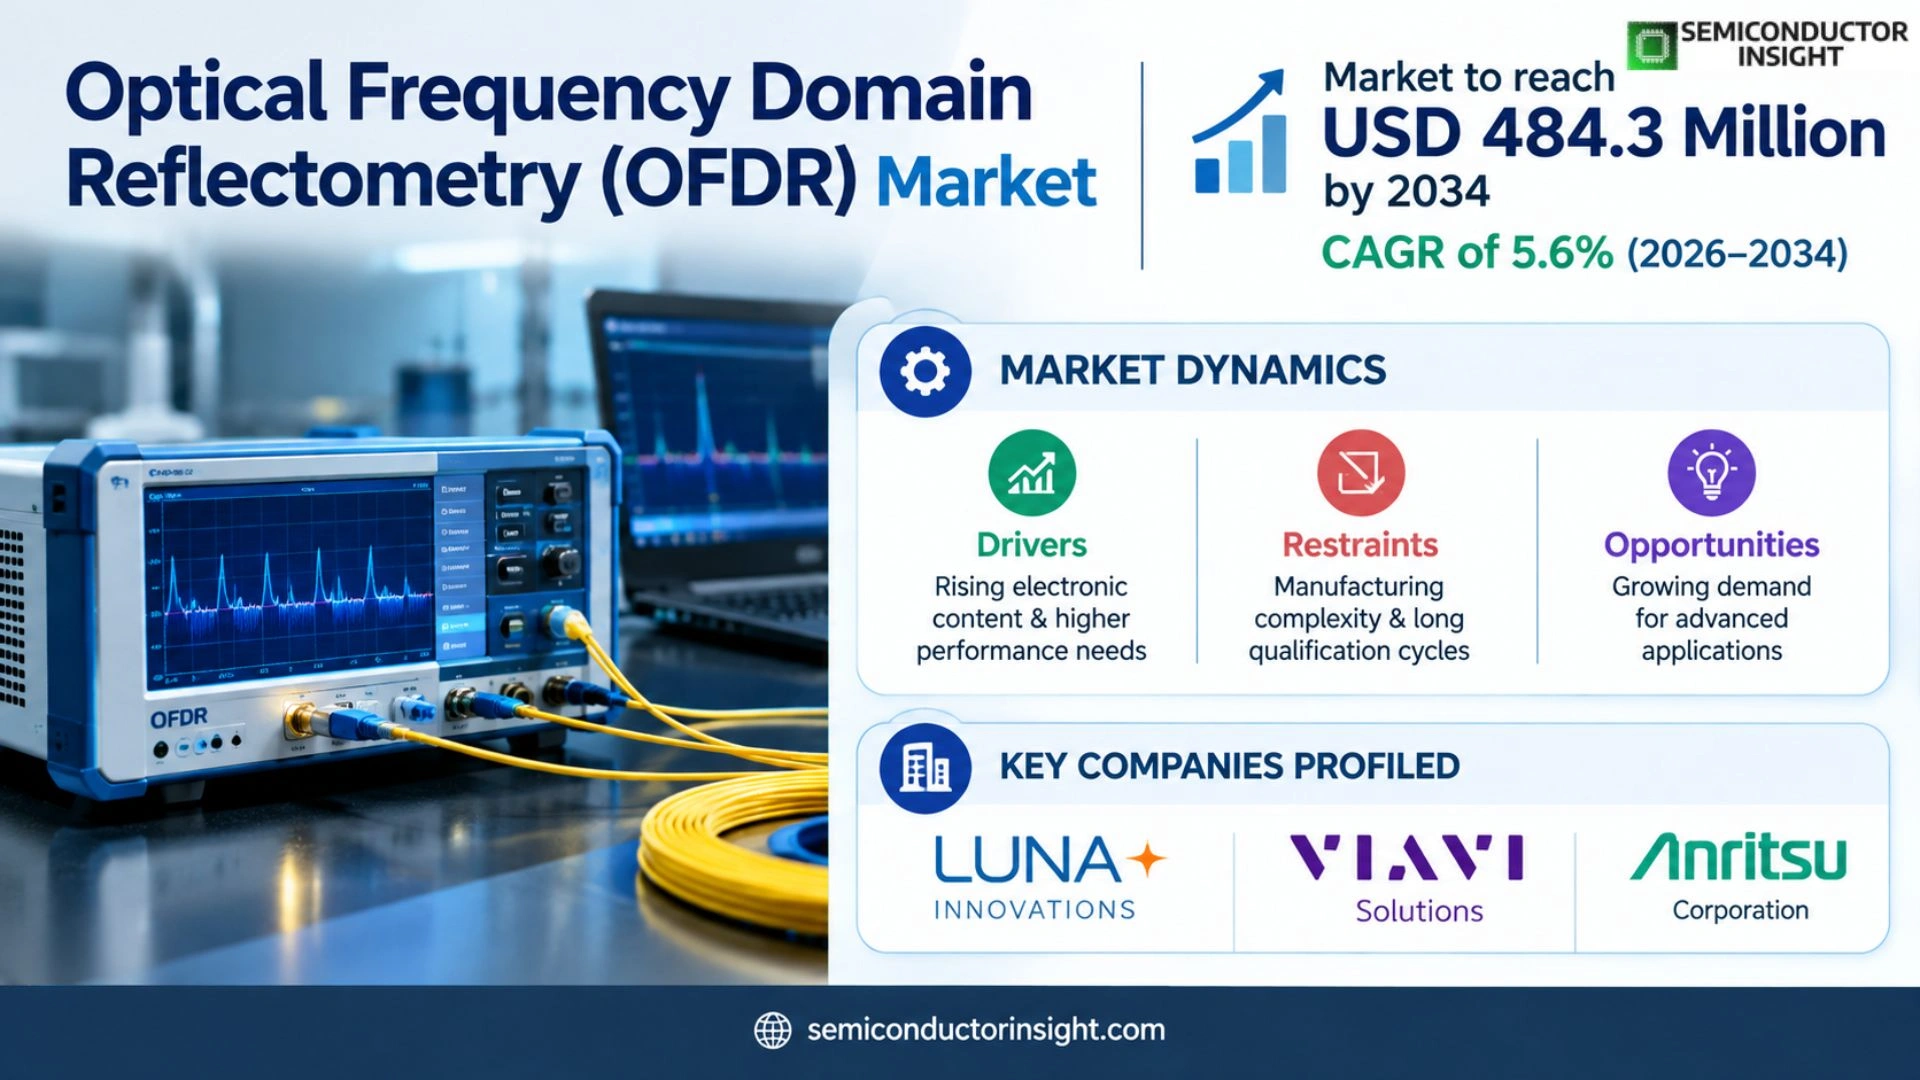
Optical Frequency Domain Reflectometry Market was valued at USD 295.8 million in 2025 and is projected to reach USD 484.3 million by 2034, growing at a CAGR of 5.6% during 2026–2034. North America held the largest regional position in 2025, supported by concentrated manufacturing, downstream electronics production and established component supply networks.
Optical frequency domain reflectometry uses a frequency-swept coherent optical signal to locate and characterize reflections or Rayleigh backscatter along an optical path. Its high spatial resolution supports component diagnostics, distributed strain and temperature measurement, and structural-health monitoring where conventional point sensors cannot reveal localized changes. Commercial demand therefore depends on measurement fidelity, sweep linearity, processing software, sensor installation practice, and calibration traceability rather than on instrument count alone.
The forecast is rebased from the report anchors of USD 280 million in 2024 and USD 434 million in 2032. Those endpoints imply annual compound growth of 5.631%, and the same endpoint relationship is extended through the requested horizon. This method preserves the source-page trajectory, avoids importing an unrelated publisher estimate, and applies one rounding convention consistently throughout the requested presentation.
Demand is broadening from laboratory optical-component inspection into aerospace structures, wind assets, civil infrastructure, batteries, pipelines, and other environments where distributed measurements can reduce sensor wiring and expose localized strain or temperature patterns. Adoption remains engineering-led: buyers assess gauge length, spatial resolution, measurement range, acquisition speed, environmental ruggedness, software integration, and the availability of application support before qualifying a platform.
Segment Analysis: By Type
By type, the OFDR market is segmented into Single-Mode Fiber · Multimode Fiber. Each category represents a different degree of integration, qualification burden and value capture, so suppliers compete through a combination of material performance, design support, manufacturing consistency, package architecture and application-specific testing rather than through unit price alone. Procurement decisions also reflect lifecycle support, interoperability, regulatory obligations, and the cost of unsuccessful qualification.
| Type | Market relevance |
|---|---|
| Single-Mode Fiber | Distinct performance, condition, integration, and qualification requirements shape demand and supplier positioning. |
| Multimode Fiber | Distinct performance, condition, integration, and qualification requirements shape demand and supplier positioning. |
Segment Analysis: By Application
By application, the market covers Temperature Sensing · Acoustic Sensing · Strain Measurement · Optical Component Testing · Other Research and Monitoring Applications. Demand varies by production volume and qualification intensity: consumer programmes reward scale and miniaturisation, while automotive, industrial, aerospace, medical or security designs place greater weight on reliability evidence, long product availability and system-level performance under demanding operating conditions. Channel design, service coverage, documentation, and total ownership economics further determine which application converts technical interest into repeat purchasing.
| Application | Market relevance |
|---|---|
| Temperature Sensing | Purchasing criteria reflect use-case economics, technical requirements, warranty expectations, and channel support. |
| Acoustic Sensing | Purchasing criteria reflect use-case economics, technical requirements, warranty expectations, and channel support. |
| Strain Measurement | Purchasing criteria reflect use-case economics, technical requirements, warranty expectations, and channel support. |
| Optical Component Testing | Purchasing criteria reflect use-case economics, technical requirements, warranty expectations, and channel support. |
| Other Research and Monitoring Applications | Purchasing criteria reflect use-case economics, technical requirements, warranty expectations, and channel support. |
Regional Analysis
North America is the largest regional market for OFDR products, combining an established component-production ecosystem with major downstream customers. North America and Europe are strategically important for premium, automotive, aerospace, industrial and specialised applications, while South America and Middle East & Africa are primarily import- and project-led markets where distributor reach, local support and supply continuity shape vendor selection.
How does regional demand differ across this market?
For OFDR, North America holds the largest position, supported by an established customer base, supplier presence, and mature purchasing channels. Europe contributes regulation, industrial demand, and technical expertise, while Asia Pacific combines electronics manufacturing, large device populations, and expanding engineering capability. South America and the Middle East and Africa develop through targeted infrastructure, enterprise, research, consumer, or public-sector programs rather than uniform adoption.
| Region | Position |
|---|---|
| North America | Largest and most established demand base |
| Europe | Developing demand shaped by local applications, channels, and qualification conditions |
| Asia Pacific | Developing demand shaped by local applications, channels, and qualification conditions |
| South America | Developing demand shaped by local applications, channels, and qualification conditions |
| Middle East & Africa | Developing demand shaped by local applications, channels, and qualification conditions |
Key OFDR Manufacturers and Competitive Landscape
The OFDR competitive landscape includes global technology leaders, diversified semiconductor or component groups, RF and imaging specialists, and regional manufacturers. The report profiles every named company across product positioning, manufacturing footprint, application exposure, recent development activity and strategic strengths; the complete coverage list is reproduced below so the intended company universe is explicit.
Competition combines specialist OFDR developers, diversified optical-test suppliers, fiber-sensing integrators, and application-focused engineering firms. VIAVI and Luna bring strong reflectometry and optical-analysis heritage; Anritsu, Yokogawa, and EXFO contribute global test-and-measurement channels; while APEX Technologies, FBGS Technologies, Optromix, and Mega-Sense compete through specialized instruments, sensing packages, and deployment support. Differentiation rests on usable resolution, dynamic range, scan speed, software analytics, calibration, and field service.
Commercial positioning is increasingly shaped by the complete measurement workflow. A technically capable interrogator may still lose a program if the supplier cannot provide suitable sensing fiber, installation guidance, strain-transfer characterization, application software, data interfaces, and evidence for repeatable field performance. Partnerships with aerospace laboratories, civil-engineering contractors, utilities, universities, and optical-component manufacturers can therefore be as important as improvements in the interrogator hardware itself.
Key companies profiled
- Luna Innovations
- VIAVI Solutions
- Anritsu Corporation
- Yokogawa Electric Corporation
- EXFO
- APEX Technologies
- FBGS Technologies
- Optromix
- Mega-Sense
OFDR Instrument Engineering, Calibration and Deployment Capacity Analysis
For OFDR, the relevant capacity measure is calibrated system and deployment throughput rather than commodity production volume. Effective capacity combines qualified tunable lasers and coherent receivers with optical assembly, reference artifacts, controlled software releases, calibration benches, environmental verification, applications engineering, and field-support resources capable of converting an instrument into a repeatable measurement workflow.
For OFDR, the relevant capacity measure is not commodity production tonnage but the number of fully calibrated interrogators and sensing systems that can pass optical, electronic, environmental, and software acceptance tests. Effective output depends on tunable-laser availability, coherent receiver assembly, low-noise electronics, reference artifacts, calibration benches, firmware validation, and technicians capable of diagnosing sub-system interactions before shipment.
High-resolution systems require careful control of sweep linearity, polarization behavior, clock stability, detector noise, connector cleanliness, and thermal drift. Capacity expansion therefore involves metrology equipment, automated test sequences, controlled assembly processes, and trained applications engineers in addition to component procurement. Vendors with reusable calibration methods and modular platforms can add throughput more reliably than firms that depend on extensive manual adjustment for every system.
Deployment capacity is another constraint because distributed sensing performance depends on fiber routing, bonding, strain transfer, temperature compensation, and reference measurements. Suppliers that certify installation partners and provide field-replaceable components can convert factory capacity into usable customer capacity. Service turnaround, remote diagnostics, software maintenance, and regional calibration support directly influence lifetime cost and renewal decisions for research and industrial users.
OFDR Market Dynamics: Drivers, Restraints and Opportunities
OFDR market growth reflects expanding electronic content and higher performance requirements, moderated by manufacturing complexity, long qualification cycles and competing technologies. The impact ranges below are directional analytical estimates rather than additive forecasts; they show the relative pressure each factor can place on the baseline CAGR when other assumptions remain broadly stable.
Growth is supported by structural-health monitoring, denser optical networks, renewable-energy assets, aerospace lightweighting, and research demand for spatially continuous measurements. The addressable market expands when users value early anomaly localization or reduced wiring strongly enough to offset specialized equipment and integration expense. Program timing can nevertheless be uneven because many purchases follow funded projects, asset-maintenance cycles, or multi-stage engineering qualification.
The baseline outlook balances improving instrument usability against physical and commercial tradeoffs. Longer reach, finer resolution, faster acquisition, and wider dynamic range cannot always be optimized simultaneously, while exposed sensing fiber may require protection in harsh environments. Competing technologies such as time-domain reflectometry, distributed acoustic sensing, fiber Bragg grating arrays, and conventional electrical sensors remain preferable for some range, speed, or cost requirements.
MARKET DRIVERS
Drivers Impact Analysis*
| Driver | (~) % impact on CAGR forecast | Geographic relevance | Impact timeline |
|---|---|---|---|
| Aerospace and composite structural-health monitoring | +1.4% | North America and Europe | Long term (≥4 years) |
| Distributed strain and temperature sensing | +1.2% | Global industrial and research markets | Medium term (2–4 years) |
| Optical-component and photonic-circuit diagnostics | +0.9% | North America, Europe, Asia Pacific | Medium term (2–4 years) |
| Renewable energy and infrastructure monitoring | +0.8% | Europe, North America, Asia Pacific | Long term (≥4 years) |
| Improved analytics and digital-twin integration | +0.6% | Global engineering centres | Short term (≤2 years) |
| Rental and measurement-as-a-service models | +0.4% | Project-led markets | Medium term (2–4 years) |
Aerospace and advanced-material programs are important demand drivers because bonded or embedded optical fiber can map strain over complex structures with far fewer lead wires than dense point-sensor arrays. OFDR is especially relevant during design validation, fatigue testing, and localized damage studies where high spatial resolution provides engineering value. Repeat demand depends on qualification evidence, integration with simulation workflows, and confidence that installation effects are understood.
Optical-component and photonic-circuit testing supports a second demand stream. Reflectometric analysis can locate reflections, discontinuities, and distributed loss through components, assemblies, and short optical networks, helping engineers diagnose packaging or connection problems. Growth in coherent communications, silicon photonics, sensing modules, and dense fiber assemblies increases the number of technically demanding devices, although each use case requires a suitable balance of measurement range and resolution.
Civil infrastructure, energy, and industrial monitoring broaden the market when operators need continuous information along bridges, tunnels, pipelines, power assets, wind blades, or process equipment. Adoption improves when analytics translate raw backscatter into actionable strain or temperature events and when sensing fibers survive installation. Systems that offer documented interfaces and remote monitoring can integrate more readily with asset-management platforms and inspection programs.
MARKET RESTRAINTS
Restraints Impact Analysis*
| Restraint | (~) % impact on CAGR forecast | Geographic relevance | Impact timeline |
|---|---|---|---|
| Specialized equipment and installation cost | −1.3% | Global price-sensitive projects | Persistent |
| Range, speed and spatial-resolution tradeoffs | −0.9% | All technical applications | Persistent |
| Installation and calibration complexity | −0.8% | Field deployments | Medium term (2–4 years) |
| Competition from time-domain, FBG and electrical sensors | −0.7% | Global | Medium term (2–4 years) |
| Long safety-critical qualification cycles | −0.5% | Aerospace, energy and infrastructure | Long term (≥4 years) |
Specialized interrogators, sensing fiber, installation labor, and engineering analysis create a higher initial cost than conventional point instruments for small or simple measurement tasks. Buyers often require a quantified operational benefit before funding deployment, particularly when an existing inspection regime is already accepted. The economic case becomes stronger for large structures or distributed failure modes, but it can remain difficult for low-value assets and short-duration projects.
Measurement quality can be sensitive to fiber attachment, strain transfer, temperature cross-sensitivity, connector condition, and the algorithm used to correlate backscatter signatures. These factors increase training and validation requirements and can complicate comparisons between suppliers. In safety-relevant applications, users may insist on reference sensors, redundant methods, environmental testing, and long observation periods before relying on OFDR results for maintenance decisions.
Alternative fiber-sensing and electronic technologies constrain adoption. Time-domain methods offer longer reach in many network applications, fiber Bragg grating arrays provide mature multiplexed point sensing, and electrical gauges remain inexpensive and familiar. OFDR vendors must show a clear advantage in spatial detail, sensor density, installation burden, or diagnostic insight; otherwise customers may choose a simpler technology with a larger installed support base.
MARKET OPPORTUNITIES
Battery, hydrogen, and composite-manufacturing research offers attractive opportunities because distributed fiber measurements can reveal localized strain and temperature behavior inside or along complex test articles. Suppliers can capture more value by offering application fixtures, protective coatings, validated installation procedures, and analysis templates rather than selling a general-purpose interrogator alone. Cooperative development with laboratories and equipment builders can shorten the path from experiment to repeatable production monitoring.
Software is a major opportunity layer. Automated event classification, uncertainty reporting, digital-twin alignment, and open data interfaces can reduce the specialist effort needed to interpret large distributed datasets. Edge processing and selective data retention are also useful where continuous acquisition produces more information than operators can economically transmit or review. Vendors that make results understandable to structural, maintenance, or process engineers can expand beyond photonics specialists.
Regional calibration, rental, and measurement-as-a-service models can reduce adoption barriers for customers with intermittent projects. A service provider can spread instrument utilization across multiple programs while maintaining trained staff and installation tools. Manufacturers benefit by reaching users that are not ready for capital purchase, generating application evidence, and building a pipeline for later system sales, software subscriptions, and recurring calibration or support contracts.
OFDR Technology Ecosystem and Deployment Value-Chain Analysis
The OFDR technology ecosystem links tunable optical sources, coherent detection, timing and processing electronics, reference standards, specialized sensing fiber, calibration software, installation engineering, and downstream analytics. Commercial resilience depends on controlled component substitution, traceable calibration, stable software, field service, and deployment partners because nominally similar optical inputs are not interchangeable until system performance has been revalidated.
The OFDR ecosystem begins with tunable lasers, optical couplers, circulators, photodetectors, analog electronics, timing devices, processors, reference components, connectors, and specialized sensing fiber. System manufacturers integrate these inputs with calibration methods and signal-processing software. Deployment partners then design routing and attachment, while laboratories, asset owners, and OEM engineering teams convert distributed measurements into qualification, maintenance, or process decisions.
Resilience depends on more than holding optical components in inventory. Changes in laser tuning behavior, detector response, connector geometry, fiber coating, or firmware can affect calibrated performance and may require revalidation. Strong suppliers maintain traceable component lots, controlled software releases, reference artifacts, repair capability, and qualified alternatives. Clear custody of calibration data and installation records is particularly important where measurements support regulated or safety-relevant decisions.
Recent Developments in the OFDR Market
Developments tracked to September 2026 and linked to official company or industry sources.
- 2025 Published
Luna continued to position the ODiSI 6000 series as a high-definition distributed fiber-optic sensing platform based on Rayleigh backscatter, supporting strain and temperature measurement workflows across aerospace, automotive, energy, and research applications. Source - 2025 Published
VIAVI maintained a broad fiber-test and monitoring portfolio for optical networks and components, reinforcing the commercial value of integrated instruments, software, automation, and service capability around advanced optical characterization workflows. Source - 2024 Published
Anritsu continued official optical test-and-measurement product and application updates for high-speed and coherent communications, where precise component and network characterization supports adjacent demand for reflection, loss, and connectivity diagnostics. Source - 2024 Published
Yokogawa continued official product and application updates across optical spectrum, component, and network analysis, supporting laboratories that require traceable optical test workflows alongside specialized reflectometric measurements. Source - 2024 Published
EXFO maintained fiber characterization, optical testing, and network-assurance resources for laboratory and field users, illustrating continued supplier investment in integrated optical measurement, analysis software, and technician workflows. Source
REPORT SCOPE & SEGMENTATION
| Attribute | Details |
|---|---|
| Study Period | 2021–2034 |
| Base Year | 2025 |
| Estimated Year | 2026 |
| Forecast Period | 2026–2034 |
| Historical Period | 2021–2025 |
| Market Size 2025 | USD 295.8 million |
| Market Size 2034 | USD 484.3 million |
| Growth Rate | CAGR of 5.6% from 2026–2034 |
| Unit | Value in USD billion and shipment or production volume where disclosed |
| Segmentation | By Type, By Application, additional technology axis and By Region |
| By Type | Single-Mode Fiber · Multimode Fiber |
| By Application | Temperature Sensing · Acoustic Sensing · Strain Measurement · Optical Component Testing · Other Research and Monitoring Applications |
| By End User | Telecommunication · Oil & Gas · Aerospace & Defense · Energy & Utilities · Research & Development |
| By Region | Each region analysed by type, application and countryNorth AmericaU.S., Canada, MexicoEuropeGermany, France, U.K., Italy, Nordic Countries, BeneluxAsia PacificChina, Japan, South Korea, India, Southeast AsiaSouth AmericaBrazil, Argentina, Rest of South AmericaMiddle East & AfricaTurkey, Israel, Saudi Arabia, UAE, Rest of MEA |
| Key Companies Profiled | Luna Innovations; VIAVI Solutions; Anritsu Corporation; Yokogawa Electric Corporation; EXFO; APEX Technologies; FBGS Technologies; Optromix; Mega-Sense |
| Customization Scope | Free report customization equivalent to up to four analyst working days with purchase, including additions or alterations to country, regional and segment coverage. |
Frequently Asked Questions
What is OFDR?
The Optical Frequency Domain Reflectometry Market is valued at USD 295.8 million in 2025 and is projected to reach USD 484.3 million by 2034, representing a 5.6% CAGR during 2026–2034. The estimate covers the complete stated product, application, technology and regional scope, and the 2034 endpoint was extended from the report’s published anchors using the endpoint-implied compound annual relationship rather than an unrelated third-party forecast.
How was the 2034 forecast calculated?
The 2034 OFDR projection extends the report’s published endpoint relationship through the requested horizon. It should be interpreted as a constant-rate rebasing scenario: actual annual results can vary with device production, qualification timing, technology substitution, pricing and regional investment, but the method keeps the terminal value mathematically consistent with the validated source anchors and the forecast period used throughout this overview.
Which fiber category is most important?
Single-mode fiber is the principal category for many OFDR platforms because coherent backscatter analysis and telecom-derived components are commonly designed around single-mode propagation. Multimode fiber remains relevant in specialized component, laboratory, or sensing configurations. The appropriate choice depends on the interrogator architecture, distance, modal behavior, connection environment, sensing objective, and availability of validated installation procedures.
Which applications create demand?
Demand comes from distributed strain and temperature sensing, acoustic or vibration-related research, optical-component inspection, photonic-circuit diagnostics, and structural-health monitoring. Aerospace and advanced-material programs value dense strain information, while telecom and component laboratories value reflection and loss localization. Energy and civil-infrastructure users focus on durable installation, actionable analytics, remote operation, and integration with existing asset-management practices.
Why does North America lead?
North America combines aerospace and defense engineering, university and national-laboratory research, photonics development, civil-infrastructure testing, and established optical-test suppliers. These conditions create demand for premium measurement platforms and application services. Leadership does not imply uniform adoption: budgets, project timing, procurement rules, and qualification requirements vary by customer, and European and Asia-Pacific suppliers remain important competitors.
What limits OFDR adoption?
The main constraints are specialized instrument cost, installation effort, technical training, interpretation complexity, and tradeoffs among range, speed, and spatial resolution. Fiber attachment and environmental conditions can influence measurement quality, so safety-relevant users may require comparison sensors and long qualification programs. Alternative time-domain, grating-based, and electrical sensing technologies also remain more economical for some tasks.
How do vendors compete?
Vendors compete through optical performance, calibration stability, software usability, sensing-fiber options, ruggedization, service responsiveness, and application engineering. A high specification on a datasheet is not sufficient if customers cannot install the fiber reproducibly or translate data into decisions. Demonstrated workflows, open interfaces, training, local support, and credible lifetime maintenance can therefore decide competitive outcomes.
What is the role of software?
Software linearizes the sweep, correlates backscatter signatures, converts spectral shifts into engineering units, manages reference states, visualizes spatial data, and identifies events. Better analytics can lower the expertise required to operate a system and reduce review time. Users should assess traceability, uncertainty reporting, data export, cybersecurity, version control, and whether algorithms remain valid across fiber types and environmental conditions.
What opportunities are emerging?
Emerging opportunities include battery and hydrogen-system testing, composite process monitoring, wind-energy structures, advanced aerospace qualification, and service-based deployment models. These applications reward localized measurements and integration with simulations or digital twins. Commercial success will depend on validated installation methods, domain-specific analytics, protective sensor packages, and partnerships that translate photonics performance into an operational or engineering benefit.
Which companies are covered?
The report covers Luna Innovations, VIAVI Solutions, Anritsu Corporation, Yokogawa Electric Corporation, EXFO, APEX Technologies, FBGS Technologies, Optromix, and Mega-Sense. Coverage evaluates product positioning, geographic reach, application focus, system architecture, software and service capability, partnerships, and recent developments. Company inclusion identifies the intended competitive universe and does not by itself imply a market-share ranking.

Get Sample Report PDF for Exclusive Insights
Report Sample Includes
- Table of Contents
- List of Tables & Figures
- Charts, Research Methodology, and more...
 Download Sample Report PDF



