Strain Gage Market, Global Business Strategies 2026-2034

Strain Gage Market was valued at USD 164 million in 2026 and is projected to reach USD 229 million by 2034, exhibiting a CAGR of 4.9% during the forecast period.

PDF Icon Download Sample Report PDF
  • Quick Dispatch

    All Orders

  • Secure Payment

    100% Secure Payment

Price range: $1,500.00 through $4,250.00

Clear

Market Insights

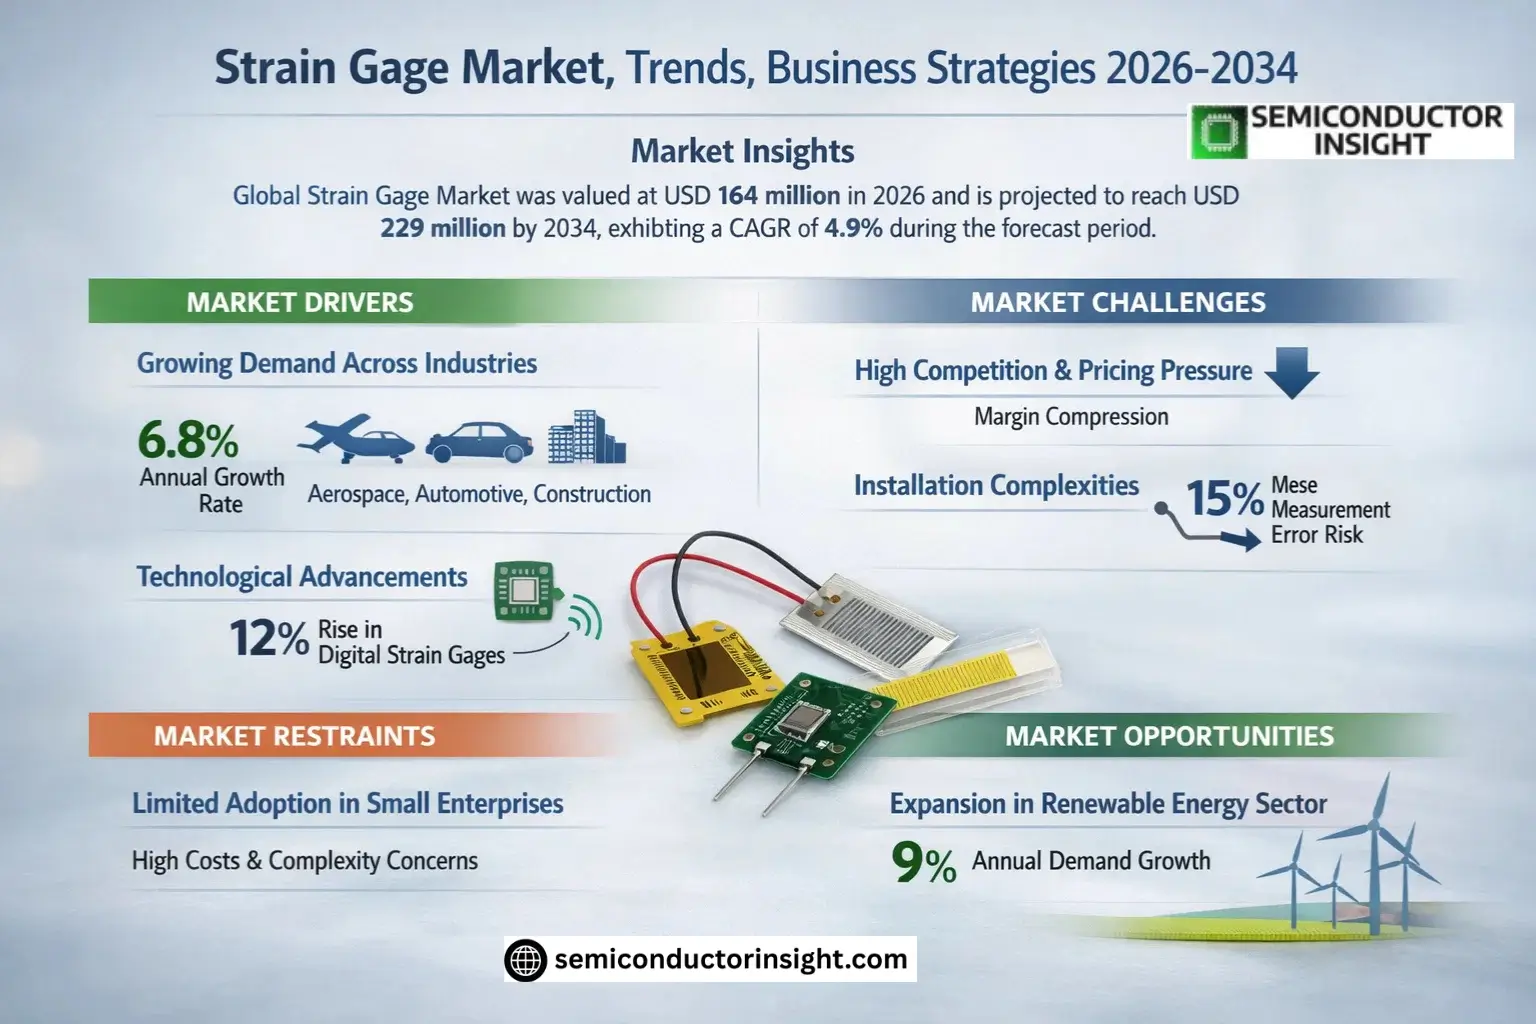
Global Strain Gage Market was valued at USD 164 million in 2026 and is projected to reach USD 229 million by 2034, exhibiting a CAGR of 4.9% during the forecast period.

Strain Gage Market is a sensor used to measure deformation (strain) in materials or structures by detecting minute changes in resistance when subjected to external force. These devices typically consist of a metal foil, conductive carbon fabric, or thin film attached to the object being measured. Strain gages are critical for applications such as structural health monitoring, aerospace testing, automotive engineering, and materials research. The industry maintains an average gross profit margin of approximately 30%, with global sales reaching 267.65 million units annually at an average price point of USD 669 per thousand pieces.

The market growth is driven by increasing demand for precision measurement across industries and technological advancements in sensor design, including wireless data acquisition and flexible substrate solutions. Key players like HBK (formerly HBM), Vishay Micro-Measurements, and KYOWA dominate the competitive landscape through continuous innovation in product reliability and application-specific solutions.

Strain Gage Market Insights

MARKET DRIVERS

Growing Demand Across Industries

Strain Gage Market is experiencing significant growth due to increasing adoption in aerospace, automotive, and construction sectors. These devices are crucial for structural health monitoring and load measurement applications, driving demand by approximately 6.8% annually. The need for precise stress analysis in critical infrastructure projects further accelerates market expansion.

Technological Advancements

Recent innovations in micro-electromechanical systems (MEMS) and wireless strain gage technology have enhanced measurement accuracy and durability. The market has seen a 12% increase in adoption of digital strain gages, which offer higher precision compared to traditional foil gages.

As industries prioritize real-time data collection and asset longevity, the Strain Gage Market is positioned for sustained growth.

MARKET CHALLENGES

High Competition and Pricing Pressure

Strain Gage Market faces intense competition from both established players and low-cost manufacturers, leading to margin compression. Smaller manufacturers struggle with R&D investments required for advanced gage development, creating a market bifurcation between premium and budget segments.

Other Challenges

Installation Complexities
Proper installation of strain gages requires specialized expertise, and incorrect mounting can lead to measurement errors exceeding 15%. This creates barriers for end-users without technical teams.

MARKET RESTRAINTS

Limited Adoption in Small Enterprises

High initial costs and perceived complexity restrain strain gage adoption among SMEs. While large corporations allocate budgets for precision measurement, smaller businesses often opt for less accurate alternatives due to cost considerations, affecting overall market penetration.

MARKET OPPORTUNITIES

Expansion in Renewable Energy Sector

Strain Gage Market is poised for growth in wind turbine monitoring, with an estimated 9% annual demand increase. Structural monitoring of turbine blades and towers creates substantial opportunities for high-accuracy strain measurement solutions.
Strain Gage Market Trends

Shift Towards Thin-Film and Flexible Strain Gage Solutions

Strain Gage Market is witnessing a significant transition from traditional metal foil variants to advanced thin-film and flexible substrate solutions. This evolution is driven by the demand for higher precision, durability, and adaptability in complex measurement environments. Industries such as aerospace and automotive increasingly require strain gages that conform to curved surfaces while maintaining measurement accuracy under dynamic stress conditions.

Other Trends

Integration of Wireless and Smart Sensing Capabilities

Modern Strain Gage systems now incorporate wireless data transmission and IoT connectivity, enabling real-time structural health monitoring without wired constraints. This trend aligns with Industry 4.0 requirements for predictive maintenance in manufacturing and infrastructure sectors. Multi-channel data acquisition systems combined with temperature compensation features are becoming standard in new installations.

Emerging Applications in Composite Material Testing

The growing use of advanced composites in wind energy, automotive lightweighting, and aerospace structures has expanded the Strain Gage Market into new application areas. Specialized gages for carbon fiber and polymer matrix composites now account for over 18% of industrial demand, requiring unique adhesive formulations and installation techniques to ensure measurement accuracy on anisotropic materials.

Other Trends

Regional Market Diversification

While North America and Europe maintain their dominance in high-end Strain Gage applications, Asia-Pacific has emerged as the fastest-growing market, particularly in infrastructure monitoring and electronic manufacturing. Countries like China and Japan are increasing investments in domestic production capabilities, with local manufacturers now capturing 32% of the regional market share.

COMPETITIVE LANDSCAPE

Key Industry Players

Global Strain Gage Market Dominated by Sensor Giants and Niche Specialists

Strain Gage Market is characterized by established sensor manufacturers with strong technical capabilities and global distribution networks. HBK (formerly HBM) and Vishay (Micro-Measurements) lead the market with comprehensive product portfolios and advanced strain measurement solutions. These players hold significant market share due to their precision manufacturing capabilities, extensive R&D investments, and strong presence in aerospace, automotive, and industrial applications. The competitive landscape shows moderate consolidation, with the top five companies accounting for approximately 45% of global revenue in 2026.

Specialized manufacturers like KYOWA and TML have carved out strong positions in specific segments such as construction monitoring and high-temperature applications. Regional players, particularly in Asia, are gaining traction through cost-competitive offerings and localized service networks. Emerging competitors are focusing on innovative solutions like wireless strain gages and flexible substrates, challenging traditional players with differentiated technologies.

List of Key Strain Gage Companies Profiled

Segment Analysis:

Segment Category Sub-Segments Key Insights
By Type
  • Foil Type
  • Wire Type
  • Thin Film
Foil Type dominates due to its balance of accuracy, durability and cost-effectiveness:

  • Preferred for industrial applications requiring high stability and repeatability
  • Continuous innovation in materials is improving temperature resistance and fatigue life
  • Thin film variants gaining traction in specialized aerospace and medical applications
By Application
  • Structural Health Monitoring
  • Aerospace & Defense
  • Automotive Testing
  • Energy Infrastructure
  • Materials Research
Structural Health Monitoring shows strongest growth potential:

  • Increasing adoption in bridges, dams and aging infrastructure for preventive maintenance
  • Integration with wireless technologies enabling real-time structural integrity assessment
  • Stringent safety regulations driving demand in seismic monitoring applications
By End User
  • Manufacturing Industries
  • Research Institutions
  • Construction Firms
  • Energy Providers
Manufacturing Industries remain primary adopters:

  • Critical for quality control in heavy machinery and precision equipment production
  • Increasing automation driving demand for integrated sensor solutions
  • Emerging applications in smart manufacturing and Industry 4.0 initiatives
By Technology
  • Conventional Strain Gages
  • Wireless Strain Sensing
  • Fiber Optic Strain Sensors
  • Smart Sensors with IoT
Smart Sensors with IoT represent the technology frontier:

  • Enabling condition monitoring and predictive maintenance capabilities
  • Integration challenges being addressed through innovative packaging solutions
  • Growing demand for energy harvesting sensors in remote monitoring applications
By Installation Method
  • Adhesive Bonding
  • Welded Installation
  • Embedded Sensors
  • Clamp-on Solutions
Adhesive Bonding maintains market leadership:

  • Preferred for non-destructive testing applications requiring temporary installations
  • Ongoing improvements in adhesive formulations enhancing bond strength and longevity
  • Embedded solutions gaining traction in composite materials and smart structures

Regional Analysis: Global Strain Gage Market

North America

North America dominates the global strain gage market due to its advanced industrial base and high adoption of precision measurement technologies. The region benefits from strong aerospace, automotive, and defense sectors where strain gages are critical for structural testing and quality control. Technological leadership in microelectromechanical systems (MEMS) and wireless strain measurement solutions further strengthens North America’s position. Significant R&D investments by both established manufacturers and startups drive continuous innovation in strain measurement accuracy and miniaturization. The presence of stringent safety regulations across industries creates sustained demand for high-performance strain gaging solutions. Collaborative initiatives between academic institutions and corporations ensure a steady pipeline of advanced strain measurement technologies.

Industrial Applications
The U.S. industrial sector extensively utilizes strain gages for machinery condition monitoring and structural health assessment. Automotive manufacturers employ advanced strain measurement for crash testing and component durability evaluation. Energy companies leverage strain gaging technology for pipeline monitoring and offshore platform structural integrity assessments.
Research & Innovation
North American research institutions lead in developing next-generation strain gages with nanotechnology integration. Several universities collaborate with aerospace companies on advanced composite material strain measurement solutions. Emerging smart strain gage projects focus on IoT integration for real-time structural monitoring applications.
Market Drivers
Growing emphasis on infrastructure health monitoring drives adoption of strain gage technology. Increasing aerospace testing requirements and aircraft maintenance programs create substantial demand. The expansion of electric vehicle production necessitates new strain measurement solutions for battery systems and lightweight components.
Competitive Landscape
The region hosts several leading strain gage manufacturers with comprehensive product portfolios. Established players focus on developing application-specific solutions for niche industrial segments. Strategic partnerships between sensor companies and software providers are creating integrated measurement ecosystems.

Europe
Europe represents a mature strain gage market characterized by sophisticated industrial applications and stringent quality standards. The automotive and aerospace sectors drive significant demand, particularly in Germany and France where precision engineering is well-established. Infrastructure monitoring projects across the EU utilize strain gages for bridge and building safety assessments. The region sees growing adoption of wireless strain measurement systems in industrial automation contexts. Environmental regulations promoting energy efficiency boost strain gage usage in wind turbine monitoring applications. Collaborative research initiatives between European universities advance optical strain measurement technologies.

Asia-Pacific
The Asia-Pacific strain gage market is experiencing rapid growth fueled by industrial expansion and infrastructure development. China leads regional adoption with extensive use in manufacturing and construction sectors. Japan maintains a strong position in high-precision strain measurement for electronics and automotive applications. Emerging economies are investing in strain gage technology for railway and energy infrastructure monitoring. The region benefits from cost-competitive manufacturing of strain gage components. Increasing automation in Southeast Asian factories creates opportunities for strain measurement system providers.

South America
South America’s strain gage market shows steady growth concentrated in Brazil and Argentina. The oil and gas industry utilizes strain measurement for pipeline monitoring and offshore operations. Mining operations increasingly adopt strain gages for equipment health monitoring in challenging environments. Infrastructure development projects create demand for structural monitoring solutions. The region sees growing interest in strain gage technology for agricultural machinery optimization. Local manufacturers focus on cost-effective solutions tailored to regional industrial requirements.

Middle East & Africa
The Middle East’s strain gage market is primarily driven by oilfield applications and infrastructure megaprojects. Gulf countries invest in advanced structural monitoring for high-rise buildings and bridges. Africa shows emerging potential in mining and energy sector applications. The region experiences growing adoption of strain measurement in railway infrastructure maintenance. Localized challenges include harsh environmental conditions requiring specialized strain gage solutions. Market growth is supported by international partnerships bringing advanced measurement technologies to the region.

Report Scope

This market research report provides a comprehensive analysis of the Strain Gage Market , covering the forecast period 2026–2034. It offers detailed insights into market dynamics, technological advancements, competitive landscape, and key trends shaping the industry.

Key focus areas of the report include:

  • Market Overview: The report begins with an overview outlining its current market scenario, key growth indicators, and industry transformation drivers. It discusses macroeconomic factors, demand–supply balance, regulatory landscape, and the strategic role of strain gauges in powering advancements across industries such as aerospace, automotive, construction, and materials research.
  • Market Size & Forecast: Historical data and future projections for revenue, unit shipments, and market value across major regions and segments.
  • Segmentation Analysis: Detailed breakdown by product type, installation method, application environment, and end-use industry to identify high-growth segments and investment opportunities.
  • Regional Insights: Insights into market performance across North America, Europe, Asia-Pacific, Latin America, and the Middle East & Africa, including country-level analysis where relevant.
  • Competitive Landscape: Profiles of leading market participants, including their product offerings, R&D focus, manufacturing capacity, pricing strategies, and recent developments such as mergers, acquisitions, and partnerships.
  • Technology Trends & Innovation: Assessment of emerging technologies, including thin-film flexible substrates, wireless sensing, temperature compensation, and intelligent sensing solutions.
  • Market Drivers & Restraints: Evaluation of factors driving market growth along with challenges, supply chain constraints, regulatory issues, and market-entry barriers.
  • Stakeholder Insights: Insights for component suppliers, OEMs, system integrators, investors, and policymakers regarding the evolving ecosystem and strategic opportunities.

Primary and secondary research methods are employed, including interviews with industry experts, data from verified sources, and real-time market intelligence to ensure the accuracy and reliability of the insights presented.

FREQUENTLY ASKED QUESTIONS:

What is the current market size of Strain Gage Market?

-> Strain Gage Market was valued at USD 164 million in 2026 and is projected to reach USD 229 million by 2034, exhibiting a CAGR of 4.9% during the forecast period.

Which key companies operate in Strain Gage Market?

-> Key players include HBK (formerly HBM), Vishay (Micro-Measurements), MinebeaMitsumi, KYOWA, Omega, TML, BCM, and ZEMIC, among others.

What are the key growth drivers?

-> Key growth drivers include demand for high-precision deformation measurement in aerospace and automotive sectors, infrastructure development, and technological advancements in wireless sensing solutions.

Which region dominates the market?

-> Asia holds the largest market share, with significant contributions from China, Japan, and South Korea, while North America and Europe remain key markets for advanced applications.

What are the emerging trends?

-> Emerging trends include thin-film flexible substrates, intelligent sensing solutions, integration of temperature compensation technologies, and expansion in infrastructure monitoring applications.

Strain Gage Market, Global Business Strategies  2026-2034

Get Sample Report PDF for Exclusive Insights

Report Sample Includes

  • Table of Contents
  • List of Tables & Figures
  • Charts, Research Methodology, and more...
PDF Icon Download Sample Report PDF

Download Sample Report

Table of Content

1 Introduction to Research & Analysis Reports
1.1 Strain Gage Market Definition
1.2 Market Segments
1.2.1 Segment by Type
1.2.2 Segment by Application
1.3 Global Strain Gage Market Overview
1.4 Features & Benefits of This Report
1.5 Methodology & Sources of Information
1.5.1 Research Methodology
1.5.2 Research Process
1.5.3 Base Year
1.5.4 Report Assumptions & Caveats
2 Global Strain Gage Overall Market Size
2.1 Global Strain Gage Market Size: 2024 VS 2032
2.2 Global Strain Gage Market Size, Prospects & Forecasts: 2020-2032
2.3 Global Strain Gage Sales: 2020-2032
3 Company Landscape
3.1 Top Strain Gage Players in Global Market
3.2 Top Global Strain Gage Companies Ranked by Revenue
3.3 Global Strain Gage Revenue by Companies
3.4 Global Strain Gage Sales by Companies
3.5 Global Strain Gage Price by Manufacturer (2020-2025)
3.6 Top 3 and Top 5 Strain Gage Companies in Global Market, by Revenue in 2024
3.7 Global Manufacturers Strain Gage Product Type
3.8 Tier 1, Tier 2, and Tier 3 Strain Gage Players in Global Market
3.8.1 List of Global Tier 1 Strain Gage Companies
3.8.2 List of Global Tier 2 and Tier 3 Strain Gage Companies
4 Sights by Product
4.1 Overview
4.1.1 Segment by Type – Global Strain Gage Market Size Markets, 2024 & 2032
4.1.2 Alloy Steel Sensor
4.1.3 Stainless Steel Sensor
4.1.4 Aluminum Sensor
4.2 Segment by Type – Global Strain Gage Revenue & Forecasts
4.2.1 Segment by Type – Global Strain Gage Revenue, 2020-2025
4.2.2 Segment by Type – Global Strain Gage Revenue, 2026-2032
4.2.3 Segment by Type – Global Strain Gage Revenue Market Share, 2020-2032
4.3 Segment by Type – Global Strain Gage Sales & Forecasts
4.3.1 Segment by Type – Global Strain Gage Sales, 2020-2025
4.3.2 Segment by Type – Global Strain Gage Sales, 2026-2032
4.3.3 Segment by Type – Global Strain Gage Sales Market Share, 2020-2032
4.4 Segment by Type – Global Strain Gage Price (Manufacturers Selling Prices), 2020-2032
5 Sights by Application
5.1 Overview
5.1.1 Segment by Application – Global Strain Gage Market Size, 2024 & 2032
5.1.2 Commercial Weighing
5.1.3 Industrial Measurement and Control
5.1.4 Automobile Comprehensive Performance Testing
5.1.5 Other
5.2 Segment by Application – Global Strain Gage Revenue & Forecasts
5.2.1 Segment by Application – Global Strain Gage Revenue, 2020-2025
5.2.2 Segment by Application – Global Strain Gage Revenue, 2026-2032
5.2.3 Segment by Application – Global Strain Gage Revenue Market Share, 2020-2032
5.3 Segment by Application – Global Strain Gage Sales & Forecasts
5.3.1 Segment by Application – Global Strain Gage Sales, 2020-2025
5.3.2 Segment by Application – Global Strain Gage Sales, 2026-2032
5.3.3 Segment by Application – Global Strain Gage Sales Market Share, 2020-2032
5.4 Segment by Application – Global Strain Gage Price (Manufacturers Selling Prices), 2020-2032
6 Sights by Region
6.1 By Region – Global Strain Gage Market Size, 2024 & 2032
6.2 By Region – Global Strain Gage Revenue & Forecasts
6.2.1 By Region – Global Strain Gage Revenue, 2020-2025
6.2.2 By Region – Global Strain Gage Revenue, 2026-2032
6.2.3 By Region – Global Strain Gage Revenue Market Share, 2020-2032
6.3 By Region – Global Strain Gage Sales & Forecasts
6.3.1 By Region – Global Strain Gage Sales, 2020-2025
6.3.2 By Region – Global Strain Gage Sales, 2026-2032
6.3.3 By Region – Global Strain Gage Sales Market Share, 2020-2032
6.4 North America
6.4.1 By Country – North America Strain Gage Revenue, 2020-2032
6.4.2 By Country – North America Strain Gage Sales, 2020-2032
6.4.3 United States Strain Gage Market Size, 2020-2032
6.4.4 Canada Strain Gage Market Size, 2020-2032
6.4.5 Mexico Strain Gage Market Size, 2020-2032
6.5 Europe
6.5.1 By Country – Europe Strain Gage Revenue, 2020-2032
6.5.2 By Country – Europe Strain Gage Sales, 2020-2032
6.5.3 Germany Strain Gage Market Size, 2020-2032
6.5.4 France Strain Gage Market Size, 2020-2032
6.5.5 U.K. Strain Gage Market Size, 2020-2032
6.5.6 Italy Strain Gage Market Size, 2020-2032
6.5.7 Russia Strain Gage Market Size, 2020-2032
6.5.8 Nordic Countries Strain Gage Market Size, 2020-2032
6.5.9 Benelux Strain Gage Market Size, 2020-2032
6.6 Asia
6.6.1 By Region – Asia Strain Gage Revenue, 2020-2032
6.6.2 By Region – Asia Strain Gage Sales, 2020-2032
6.6.3 China Strain Gage Market Size, 2020-2032
6.6.4 Japan Strain Gage Market Size, 2020-2032
6.6.5 South Korea Strain Gage Market Size, 2020-2032
6.6.6 Southeast Asia Strain Gage Market Size, 2020-2032
6.6.7 India Strain Gage Market Size, 2020-2032
6.7 South America
6.7.1 By Country – South America Strain Gage Revenue, 2020-2032
6.7.2 By Country – South America Strain Gage Sales, 2020-2032
6.7.3 Brazil Strain Gage Market Size, 2020-2032
6.7.4 Argentina Strain Gage Market Size, 2020-2032
6.8 Middle East & Africa
6.8.1 By Country – Middle East & Africa Strain Gage Revenue, 2020-2032
6.8.2 By Country – Middle East & Africa Strain Gage Sales, 2020-2032
6.8.3 Turkey Strain Gage Market Size, 2020-2032
6.8.4 Israel Strain Gage Market Size, 2020-2032
6.8.5 Saudi Arabia Strain Gage Market Size, 2020-2032
6.8.6 UAE Strain Gage Market Size, 2020-2032
7 Manufacturers & Brands Profiles
7.1 Vishay
7.1.1 Vishay Company Summary
7.1.2 Vishay Business Overview
7.1.3 Vishay Strain Gage Major Product Offerings
7.1.4 Vishay Strain Gage Sales and Revenue in Global (2020-2025)
7.1.5 Vishay Key News & Latest Developments
7.2 HBM
7.2.1 HBM Company Summary
7.2.2 HBM Business Overview
7.2.3 HBM Strain Gage Major Product Offerings
7.2.4 HBM Strain Gage Sales and Revenue in Global (2020-2025)
7.2.5 HBM Key News & Latest Developments
7.3 Mettler-Toledo
7.3.1 Mettler-Toledo Company Summary
7.3.2 Mettler-Toledo Business Overview
7.3.3 Mettler-Toledo Strain Gage Major Product Offerings
7.3.4 Mettler-Toledo Strain Gage Sales and Revenue in Global (2020-2025)
7.3.5 Mettler-Toledo Key News & Latest Developments
7.4 Flintec
7.4.1 Flintec Company Summary
7.4.2 Flintec Business Overview
7.4.3 Flintec Strain Gage Major Product Offerings
7.4.4 Flintec Strain Gage Sales and Revenue in Global (2020-2025)
7.4.5 Flintec Key News & Latest Developments
7.5 Minebea
7.5.1 Minebea Company Summary
7.5.2 Minebea Business Overview
7.5.3 Minebea Strain Gage Major Product Offerings
7.5.4 Minebea Strain Gage Sales and Revenue in Global (2020-2025)
7.5.5 Minebea Key News & Latest Developments
7.6 ZEMIC
7.6.1 ZEMIC Company Summary
7.6.2 ZEMIC Business Overview
7.6.3 ZEMIC Strain Gage Major Product Offerings
7.6.4 ZEMIC Strain Gage Sales and Revenue in Global (2020-2025)
7.6.5 ZEMIC Key News & Latest Developments
7.7 KeLi Sensing Technology
7.7.1 KeLi Sensing Technology Company Summary
7.7.2 KeLi Sensing Technology Business Overview
7.7.3 KeLi Sensing Technology Strain Gage Major Product Offerings
7.7.4 KeLi Sensing Technology Strain Gage Sales and Revenue in Global (2020-2025)
7.7.5 KeLi Sensing Technology Key News & Latest Developments
7.8 Ningbo Boda
7.8.1 Ningbo Boda Company Summary
7.8.2 Ningbo Boda Business Overview
7.8.3 Ningbo Boda Strain Gage Major Product Offerings
7.8.4 Ningbo Boda Strain Gage Sales and Revenue in Global (2020-2025)
7.8.5 Ningbo Boda Key News & Latest Developments
7.9 Dongguan SouthChinaSea
7.9.1 Dongguan SouthChinaSea Company Summary
7.9.2 Dongguan SouthChinaSea Business Overview
7.9.3 Dongguan SouthChinaSea Strain Gage Major Product Offerings
7.9.4 Dongguan SouthChinaSea Strain Gage Sales and Revenue in Global (2020-2025)
7.9.5 Dongguan SouthChinaSea Key News & Latest Developments
7.10 Guangzhou Electrical Measuring Instruments Factory
7.10.1 Guangzhou Electrical Measuring Instruments Factory Company Summary
7.10.2 Guangzhou Electrical Measuring Instruments Factory Business Overview
7.10.3 Guangzhou Electrical Measuring Instruments Factory Strain Gage Major Product Offerings
7.10.4 Guangzhou Electrical Measuring Instruments Factory Strain Gage Sales and Revenue in Global (2020-2025)
7.10.5 Guangzhou Electrical Measuring Instruments Factory Key News & Latest Developments
8 Global Strain Gage Production Capacity, Analysis
8.1 Global Strain Gage Production Capacity, 2020-2032
8.2 Strain Gage Production Capacity of Key Manufacturers in Global Market
8.3 Global Strain Gage Production by Region
9 Key Market Trends, Opportunity, Drivers and Restraints
9.1 Market Opportunities & Trends
9.2 Market Drivers
9.3 Market Restraints
10 Strain Gage Supply Chain Analysis
10.1 Strain Gage Industry Value Chain
10.2 Strain Gage Upstream Market
10.3 Strain Gage Downstream and Clients
10.4 Marketing Channels Analysis
10.4.1 Marketing Channels
10.4.2 Strain Gage Distributors and Sales Agents in Global
11 Conclusion
12 Appendix
12.1 Note
12.2 Examples of Clients
12.3 DisclaimerList of Tables
Table 1. Key Players of Strain Gage in Global Market
Table 2. Top Strain Gage Players in Global Market, Ranking by Revenue (2024)
Table 3. Global Strain Gage Revenue by Companies, (US$, Mn), 2020-2025
Table 4. Global Strain Gage Revenue Share by Companies, 2020-2025
Table 5. Global Strain Gage Sales by Companies, (K Units), 2020-2025
Table 6. Global Strain Gage Sales Share by Companies, 2020-2025
Table 7. Key Manufacturers Strain Gage Price (2020-2025) & (USD/Unit)
Table 8. Global Manufacturers Strain Gage Product Type
Table 9. List of Global Tier 1 Strain Gage Companies, Revenue (US$, Mn) in 2024 and Market Share
Table 10. List of Global Tier 2 and Tier 3 Strain Gage Companies, Revenue (US$, Mn) in 2024 and Market Share
Table 11. Segment by Type – Global Strain Gage Revenue, (US$, Mn), 2024 & 2032
Table 12. Segment by Type – Global Strain Gage Revenue (US$, Mn), 2020-2025
Table 13. Segment by Type – Global Strain Gage Revenue (US$, Mn), 2026-2032
Table 14. Segment by Type – Global Strain Gage Sales (K Units), 2020-2025
Table 15. Segment by Type – Global Strain Gage Sales (K Units), 2026-2032
Table 16. Segment by Application – Global Strain Gage Revenue, (US$, Mn), 2024 & 2032
Table 17. Segment by Application – Global Strain Gage Revenue, (US$, Mn), 2020-2025
Table 18. Segment by Application – Global Strain Gage Revenue, (US$, Mn), 2026-2032
Table 19. Segment by Application – Global Strain Gage Sales, (K Units), 2020-2025
Table 20. Segment by Application – Global Strain Gage Sales, (K Units), 2026-2032
Table 21. By Region – Global Strain Gage Revenue, (US$, Mn), 2025-2032
Table 22. By Region – Global Strain Gage Revenue, (US$, Mn), 2020-2025
Table 23. By Region – Global Strain Gage Revenue, (US$, Mn), 2026-2032
Table 24. By Region – Global Strain Gage Sales, (K Units), 2020-2025
Table 25. By Region – Global Strain Gage Sales, (K Units), 2026-2032
Table 26. By Country – North America Strain Gage Revenue, (US$, Mn), 2020-2025
Table 27. By Country – North America Strain Gage Revenue, (US$, Mn), 2026-2032
Table 28. By Country – North America Strain Gage Sales, (K Units), 2020-2025
Table 29. By Country – North America Strain Gage Sales, (K Units), 2026-2032
Table 30. By Country – Europe Strain Gage Revenue, (US$, Mn), 2020-2025
Table 31. By Country – Europe Strain Gage Revenue, (US$, Mn), 2026-2032
Table 32. By Country – Europe Strain Gage Sales, (K Units), 2020-2025
Table 33. By Country – Europe Strain Gage Sales, (K Units), 2026-2032
Table 34. By Region – Asia Strain Gage Revenue, (US$, Mn), 2020-2025
Table 35. By Region – Asia Strain Gage Revenue, (US$, Mn), 2026-2032
Table 36. By Region – Asia Strain Gage Sales, (K Units), 2020-2025
Table 37. By Region – Asia Strain Gage Sales, (K Units), 2026-2032
Table 38. By Country – South America Strain Gage Revenue, (US$, Mn), 2020-2025
Table 39. By Country – South America Strain Gage Revenue, (US$, Mn), 2026-2032
Table 40. By Country – South America Strain Gage Sales, (K Units), 2020-2025
Table 41. By Country – South America Strain Gage Sales, (K Units), 2026-2032
Table 42. By Country – Middle East & Africa Strain Gage Revenue, (US$, Mn), 2020-2025
Table 43. By Country – Middle East & Africa Strain Gage Revenue, (US$, Mn), 2026-2032
Table 44. By Country – Middle East & Africa Strain Gage Sales, (K Units), 2020-2025
Table 45. By Country – Middle East & Africa Strain Gage Sales, (K Units), 2026-2032
Table 46. Vishay Company Summary
Table 47. Vishay Strain Gage Product Offerings
Table 48. Vishay Strain Gage Sales (K Units), Revenue (US$, Mn) and Average Price (USD/Unit) & (2020-2025)
Table 49. Vishay Key News & Latest Developments
Table 50. HBM Company Summary
Table 51. HBM Strain Gage Product Offerings
Table 52. HBM Strain Gage Sales (K Units), Revenue (US$, Mn) and Average Price (USD/Unit) & (2020-2025)
Table 53. HBM Key News & Latest Developments
Table 54. Mettler-Toledo Company Summary
Table 55. Mettler-Toledo Strain Gage Product Offerings
Table 56. Mettler-Toledo Strain Gage Sales (K Units), Revenue (US$, Mn) and Average Price (USD/Unit) & (2020-2025)
Table 57. Mettler-Toledo Key News & Latest Developments
Table 58. Flintec Company Summary
Table 59. Flintec Strain Gage Product Offerings
Table 60. Flintec Strain Gage Sales (K Units), Revenue (US$, Mn) and Average Price (USD/Unit) & (2020-2025)
Table 61. Flintec Key News & Latest Developments
Table 62. Minebea Company Summary
Table 63. Minebea Strain Gage Product Offerings
Table 64. Minebea Strain Gage Sales (K Units), Revenue (US$, Mn) and Average Price (USD/Unit) & (2020-2025)
Table 65. Minebea Key News & Latest Developments
Table 66. ZEMIC Company Summary
Table 67. ZEMIC Strain Gage Product Offerings
Table 68. ZEMIC Strain Gage Sales (K Units), Revenue (US$, Mn) and Average Price (USD/Unit) & (2020-2025)
Table 69. ZEMIC Key News & Latest Developments
Table 70. KeLi Sensing Technology Company Summary
Table 71. KeLi Sensing Technology Strain Gage Product Offerings
Table 72. KeLi Sensing Technology Strain Gage Sales (K Units), Revenue (US$, Mn) and Average Price (USD/Unit) & (2020-2025)
Table 73. KeLi Sensing Technology Key News & Latest Developments
Table 74. Ningbo Boda Company Summary
Table 75. Ningbo Boda Strain Gage Product Offerings
Table 76. Ningbo Boda Strain Gage Sales (K Units), Revenue (US$, Mn) and Average Price (USD/Unit) & (2020-2025)
Table 77. Ningbo Boda Key News & Latest Developments
Table 78. Dongguan SouthChinaSea Company Summary
Table 79. Dongguan SouthChinaSea Strain Gage Product Offerings
Table 80. Dongguan SouthChinaSea Strain Gage Sales (K Units), Revenue (US$, Mn) and Average Price (USD/Unit) & (2020-2025)
Table 81. Dongguan SouthChinaSea Key News & Latest Developments
Table 82. Guangzhou Electrical Measuring Instruments Factory Company Summary
Table 83. Guangzhou Electrical Measuring Instruments Factory Strain Gage Product Offerings
Table 84. Guangzhou Electrical Measuring Instruments Factory Strain Gage Sales (K Units), Revenue (US$, Mn) and Average Price (USD/Unit) & (2020-2025)
Table 85. Guangzhou Electrical Measuring Instruments Factory Key News & Latest Developments
Table 86. Strain Gage Capacity of Key Manufacturers in Global Market, 2023-2025 (K Units)
Table 87. Global Strain Gage Capacity Market Share of Key Manufacturers, 2023-2025
Table 88. Global Strain Gage Production by Region, 2020-2025 (K Units)
Table 89. Global Strain Gage Production by Region, 2026-2032 (K Units)
Table 90. Strain Gage Market Opportunities & Trends in Global Market
Table 91. Strain Gage Market Drivers in Global Market
Table 92. Strain Gage Market Restraints in Global Market
Table 93. Strain Gage Raw Materials
Table 94. Strain Gage Raw Materials Suppliers in Global Market
Table 95. Typical Strain Gage Downstream
Table 96. Strain Gage Downstream Clients in Global Market
Table 97. Strain Gage Distributors and Sales Agents in Global Market

List of Figures
Figure 1. Strain Gage Product Picture
Figure 2. Strain Gage Segment by Type in 2024
Figure 3. Strain Gage Segment by Application in 2024
Figure 4. Global Strain Gage Market Overview: 2024
Figure 5. Key Caveats
Figure 6. Global Strain Gage Market Size: 2024 VS 2032 (US$, Mn)
Figure 7. Global Strain Gage Revenue: 2020-2032 (US$, Mn)
Figure 8. Strain Gage Sales in Global Market: 2020-2032 (K Units)
Figure 9. The Top 3 and 5 Players Market Share by Strain Gage Revenue in 2024
Figure 10. Segment by Type – Global Strain Gage Revenue, (US$, Mn), 2024 & 2032
Figure 11. Segment by Type – Global Strain Gage Revenue Market Share, 2020-2032
Figure 12. Segment by Type – Global Strain Gage Sales Market Share, 2020-2032
Figure 13. Segment by Type – Global Strain Gage Price (USD/Unit), 2020-2032
Figure 14. Segment by Application – Global Strain Gage Revenue, (US$, Mn), 2024 & 2032
Figure 15. Segment by Application – Global Strain Gage Revenue Market Share, 2020-2032
Figure 16. Segment by Application – Global Strain Gage Sales Market Share, 2020-2032
Figure 17. Segment by Application -Global Strain Gage Price (USD/Unit), 2020-2032
Figure 18. By Region – Global Strain Gage Revenue, (US$, Mn), 2025 & 2032
Figure 19. By Region – Global Strain Gage Revenue Market Share, 2020 VS 2024 VS 2032
Figure 20. By Region – Global Strain Gage Revenue Market Share, 2020-2032
Figure 21. By Region – Global Strain Gage Sales Market Share, 2020-2032
Figure 22. By Country – North America Strain Gage Revenue Market Share, 2020-2032
Figure 23. By Country – North America Strain Gage Sales Market Share, 2020-2032
Figure 24. United States Strain Gage Revenue, (US$, Mn), 2020-2032
Figure 25. Canada Strain Gage Revenue, (US$, Mn), 2020-2032
Figure 26. Mexico Strain Gage Revenue, (US$, Mn), 2020-2032
Figure 27. By Country – Europe Strain Gage Revenue Market Share, 2020-2032
Figure 28. By Country – Europe Strain Gage Sales Market Share, 2020-2032
Figure 29. Germany Strain Gage Revenue, (US$, Mn), 2020-2032
Figure 30. France Strain Gage Revenue, (US$, Mn), 2020-2032
Figure 31. U.K. Strain Gage Revenue, (US$, Mn), 2020-2032
Figure 32. Italy Strain Gage Revenue, (US$, Mn), 2020-2032
Figure 33. Russia Strain Gage Revenue, (US$, Mn), 2020-2032
Figure 34. Nordic Countries Strain Gage Revenue, (US$, Mn), 2020-2032
Figure 35. Benelux Strain Gage Revenue, (US$, Mn), 2020-2032
Figure 36. By Region – Asia Strain Gage Revenue Market Share, 2020-2032
Figure 37. By Region – Asia Strain Gage Sales Market Share, 2020-2032
Figure 38. China Strain Gage Revenue, (US$, Mn), 2020-2032
Figure 39. Japan Strain Gage Revenue, (US$, Mn), 2020-2032
Figure 40. South Korea Strain Gage Revenue, (US$, Mn), 2020-2032
Figure 41. Southeast Asia Strain Gage Revenue, (US$, Mn), 2020-2032
Figure 42. India Strain Gage Revenue, (US$, Mn), 2020-2032
Figure 43. By Country – South America Strain Gage Revenue Market Share, 2020-2032
Figure 44. By Country – South America Strain Gage Sales, Market Share, 2020-2032
Figure 45. Brazil Strain Gage Revenue, (US$, Mn), 2020-2032
Figure 46. Argentina Strain Gage Revenue, (US$, Mn), 2020-2032
Figure 47. By Country – Middle East & Africa Strain Gage Revenue, Market Share, 2020-2032
Figure 48. By Country – Middle East & Africa Strain Gage Sales, Market Share, 2020-2032
Figure 49. Turkey Strain Gage Revenue, (US$, Mn), 2020-2032
Figure 50. Israel Strain Gage Revenue, (US$, Mn), 2020-2032
Figure 51. Saudi Arabia Strain Gage Revenue, (US$, Mn), 2020-2032
Figure 52. UAE Strain Gage Revenue, (US$, Mn), 2020-2032
Figure 53. Global Strain Gage Production Capacity (K Units), 2020-2032
Figure 54. The Percentage of Production Strain Gage by Region, 2024 VS 2032
Figure 55. Strain Gage Industry Value Chain
Figure 56. Marketing Channels