KNX Products Market, Global Business Strategies 2026-2033

KNX Products Market was valued at USD 3.87 billion in 2025 and is projected to reach USD 9.34 billion by 2033, exhibiting a CAGR of 13.8% during the forecast period.

PDF Icon Download Sample Report PDF
  • Quick Dispatch

    All Orders

  • Secure Payment

    100% Secure Payment

Price range: $1,500.00 through $4,250.00

Clear

Market Insights

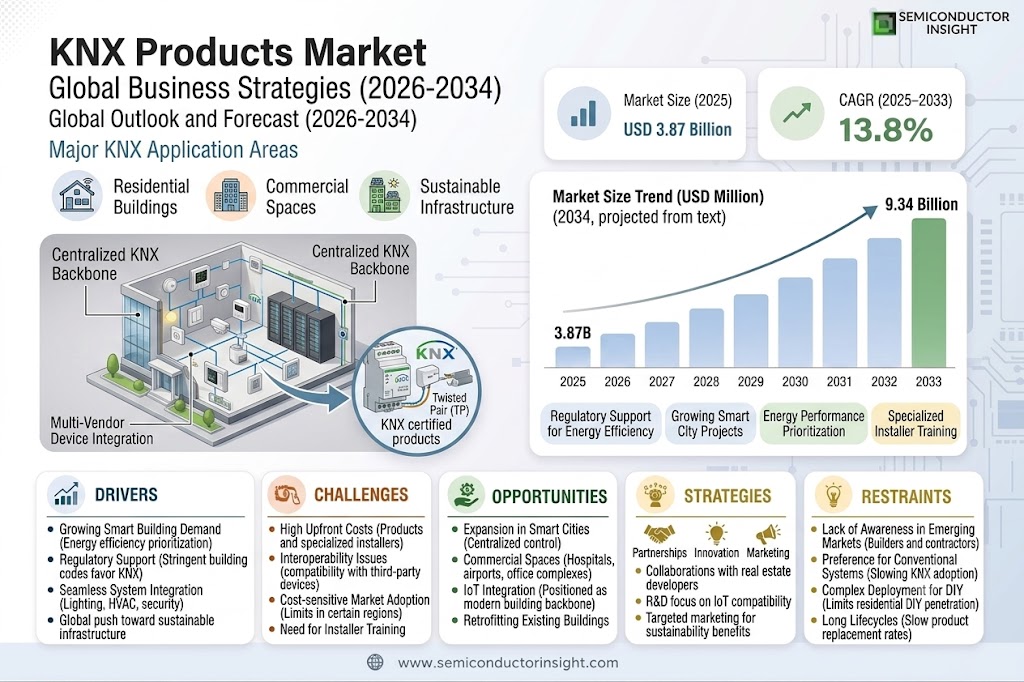
Global KNX Products Market was valued at USD 3.87 billion in 2025 and is projected to reach USD 9.34 billion by 2033, exhibiting a CAGR of 13.8% during the forecast period.

KNX Products (Konnex) represent the worldwide standard for home and building automation, integrating multiple functionalities into a unified intelligent system. The technology operates across various communication media, including twisted pair wiring, powerline networking, radio frequency (KNX-RF), infrared, and Ethernet (KNXnet/IP). It enables centralized control of HVAC systems, lighting, security, energy management, and other critical building operations.

The market growth is driven by increasing demand for energy-efficient solutions and smart building technologies. Key players such as Schneider Electric, ABB, and Siemens dominate the competitive landscape, collectively holding a significant share in regions like China. Residential buildings account for over 53% of KNX applications due to rising adoption of automated living spaces.

Xyz market size & forecast

MARKET DRIVERS

Growing Demand for Smart Building Solutions

KNX Products Market is experiencing significant growth due to the rising adoption of smart building technologies. With energy efficiency becoming a priority, KNX-certified products offer seamless integration for lighting, HVAC, and security systems. Global push toward sustainable infrastructure is accelerating demand for KNX-based automation.

Regulatory Support for Energy Efficiency

Government initiatives promoting energy-efficient buildings are boosting the KNX Products Market. Regions like Europe and North America have implemented stringent building codes that favor KNX-compliant solutions. This regulatory framework is driving commercial and residential projects to adopt KNX-certified systems.

With IoT integration becoming mainstream, KNX products are positioned as the backbone of modern building automation systems.

MARKET CHALLENGES

High Initial Installation Costs

Despite their benefits, KNX products face adoption barriers due to higher upfront costs compared to conventional systems. The need for specialized installers and training adds to deployment expenses, limiting market penetration in cost-sensitive regions.

Other Challenges

Interoperability Issues with Non-KNX Devices
While KNX is a standardized protocol, compatibility with third-party products can sometimes pose integration challenges. This can deter clients seeking multi-vendor ecosystems.

MARKET RESTRAINTS

Lack of Awareness in Emerging Markets

In developing economies, low awareness about KNX technology restricts market growth. Many builders and contractors still rely on traditional systems, slowing the adoption of KNX-certified automation solutions.

MARKET OPPORTUNITIES

Expansion in Smart Cities and Commercial Spaces

KNX Products Market has strong potential in smart city projects and large-scale commercial buildings. Hospitals, airports, and office complexes are increasingly adopting KNX solutions for centralized control and energy savings.

Growing Demand for Retrofit Solutions

With older buildings seeking to modernize, retrofit KNX products offer a lucrative opportunity. Modular KNX systems allow seamless upgrades without extensive infrastructural changes.
KNX Products Market Trends

Strong Global Growth Projected for KNX Products Market

Global KNX Products Market, valued at USD 3.87 billion in 2025, is projected to reach USD 9.34 billion by 2033, growing at a CAGR of 13.8%. This robust growth is driven by increasing demand for smart building automation solutions across residential and commercial sectors. KNX technology’s ability to integrate multiple building systems like HVAC, lighting, and security into one intelligent platform continues to gain traction among energy-conscious consumers and businesses.

Other Trends

Dominance of Residential Applications

Residential buildings account for 53% of KNX product applications, making it the largest market segment. Homeowners are increasingly adopting KNX solutions for energy efficiency, with remote control systems representing approximately 14% of product demand. The commercial building sector follows closely, leveraging KNX for comprehensive facility management.

Regional Market Dynamics

Europe currently leads in KNX adoption due to stringent energy regulations, while Asia shows the fastest growth potential with China emerging as a key manufacturing hub. Schneider Electric, ABB, and Siemens dominate the competitive landscape, collectively holding 26% market share in China. The industry remains moderately consolidated with the top five players controlling about 14% of the Chinese market.

Technological Advancements in KNX Systems

Recent innovations in KNX products include expanded support for multiple communication protocols (twisted pair, powerline, RF, and Ethernet) and improved interoperability with IoT devices. These developments enhance system flexibility while lowering installation costs, making KNX solutions more accessible to mid-market builders and homeowners. The technology’s open standard continues to drive ecosystem expansion, with new vendors entering the market annually.

COMPETITIVE LANDSCAPE

Key Industry Players

Global KNX Products Market Dominated by European Giants with Strong Chinese Presence

KNX Products Market is led by multinational corporations Schneider Electric, ABB, and Siemens, which collectively hold 26% of the Chinese market share – the largest regional segment. These tier-1 players dominate through comprehensive product portfolios spanning energy management, HVAC controls, and lighting systems. The market exhibits an oligopolistic structure with the top five manufacturers controlling 14% of China’s KNX sector, demonstrating consolidation among premium brands.

Niche players like GIRA, JUNG, and Theben AG specialize in smart home solutions, while Asian manufacturers HDL and Tiansu are gaining traction in cost-sensitive markets. Regional leaders such as Legrand (France), Hager (Germany), and Somfy (France) maintain strong positions in European commercial building automation, complemented by innovative monitoring systems from STEINEL and B.E.G.

List of Key KNX Products Companies Profiled

  • Schneider Electric
  • ABB
  • SIEMENS
  • Hager (Berker)
  • Legrand
  • Somfy
  • JUNG
  • GIRA
  • HDL
  • STEINEL
  • Urmet
  • B.E.G.
  • DALITEK
  • JOBO Smartech
  • Tiansu

Segment Analysis:

Segment Category Sub-Segments Key Insights
By Type
  • Energy Management
  • HVAC Systems
  • Lighting
  • Remote Control
  • Security Systems
Remote Control maintains dominance due to:

  • Growing demand for home automation solutions with convenient access
  • Integration with multiple smart devices through centralized control
  • Strong adoption in retrofit projects where wired solutions are impractical
By Application
  • Residential Buildings
  • Commercial Buildings
  • Industrial Facilities
  • Hospitality Sector
Residential Buildings show strongest adoption because:

  • Increasing consumer awareness of smart home benefits
  • Government incentives for energy-efficient housing solutions
  • Premium real estate developers incorporating KNX as standard feature
  • Growing DIY market with KNX-compatible smart devices
By End User
  • Homeowners
  • Building Contractors
  • System Integrators
  • Facility Management
System Integrators are key adopters driven by:

  • Growing complexity of multi-vendor installation requirements
  • Need for certified KNX professionals in high-value projects
  • Increasing demand for customized automation solutions
  • Higher profit margins in integrated system deployments
By Installation Type
  • New Constructions
  • Retrofit Projects
  • Building Renovations
New Constructions dominate because:

  • Easier integration during initial wiring phase
  • Higher budgets allocated for future-proof building automation
  • Municipal regulations encouraging smart building standards
  • Developer focus on value-added features for property differentiation
By Technology
  • Twisted Pair
  • Powerline
  • RF Wireless
  • IP/Ethernet
Twisted Pair remains preferred due to:

  • Highest reliability for mission-critical building operations
  • Lower interference compared to wireless alternatives
  • Standard architecture in European building automation
  • Established ecosystem of compatible devices and tools

Regional Analysis: Europe KNX Products Market

Western Europe

Western Europe leads the KNX products market with Germany at its core, benefiting from early smart home adoption and stringent building automation standards. The region hosts most KNX Association members and showcases the highest concentration of KNX-certified professionals. Government mandates for energy-efficient buildings and strong HVAC integration drive demand for KNX lighting controls and sensors. German engineering expertise coupled with France’s smart city initiatives create a robust KNX ecosystem. The mature market sees steady retrofitting of KNX systems in commercial buildings alongside new residential installations. KNX products in Western Europe emphasize interoperability with other IoT protocols while maintaining backward compatibility.

Regulatory Environment
Stringent EU directives on energy performance of buildings (EPBD) mandate KNX-compatible systems. Germany’s EnEV regulations specifically reference KNX for new constructions. KNX products must comply with regional electrical safety standards like VDE in Germany and NF in France.
Installation Network
Western Europe has over 60% of global KNX partners. Germany alone has more certified KNX installers than Asia-Pacific. The KNX user clubs in France and Benelux countries facilitate knowledge sharing. Major architecture firms specify KNX products in building designs.
Product Innovation
German manufacturers develop KNX RF products for retrofit markets. French companies lead in KNX-DALI gateway solutions. KNX Secure implementations are most advanced in Switzerland. Italian designers integrate KNX with luxury home automation systems.
Market Challenges
High labor costs for KNX installations limit adoption in some sectors. Competing standards like LON and BACnet hold niche positions. New wireless protocols challenge KNX in retrofit projects. Brexit created certification complexities for UK KNX products.

Northern Europe
Scandinavian countries prioritize KNX products for energy monitoring in smart buildings. Sweden’s HVAC-focused integrations demonstrate KNX capabilities in cold climates. Norway leads in KNX implementations for commercial lighting control. The region’s high renewable energy adoption complements KNX power management features. KNX systems integrate with district heating networks in Finland and Denmark.

Southern Europe
Italy and Spain show growing KNX adoption in luxury residential segments. KNX Mediterranean Alliance promotes standards harmonization. Portugal sees increasing KNX use in hotel automation. Greek installers focus on KNX security systems for high-end properties. The market benefits from tourism-driven smart hospitality projects.

Eastern Europe
Poland emerges as the KNX growth leader with new construction projects. Czech Republic and Hungary follow with KNX training center expansions. Russian KNX implementations concentrate in Moscow commercial complexes. The region benefits from lower installation costs compared to Western Europe.

United Kingdom
The UK maintains distinct KNX market dynamics post-Brexit. KNX products integrate with British building management standards. London leads in KNX-based office automation retrofits. The market shows resilience despite initial certification challenges, with strong KNX training infrastructure.

Report Scope

This market research report provides a comprehensive analysis of the KNX Products Market , covering the forecast period 2025–2033. It offers detailed insights into market dynamics, technological advancements, competitive landscape, and key trends shaping the industry.

Key focus areas of the report include:

  • Market Overview: The report begins with an overview outlining its current market scenario, key growth indicators, and industry transformation drivers. It discusses macroeconomic factors, demand–supply balance, regulatory landscape, and the strategic role of semiconductors in powering advancements across industries such as automotive, telecommunications, consumer electronics, and industrial automation.
  • Market Size & Forecast: Historical data and future projections for revenue, unit shipments, and market value across major regions and segments.
  • Segmentation Analysis: Detailed breakdown by product type, technology, application, and end-user industry to identify high-growth segments and investment opportunities.
  • Regional Insights: Insights into market performance across North America, Europe, Asia-Pacific, Latin America, and the Middle East & Africa, including country-level analysis where relevant.
  • Competitive Landscape: Profiles of leading market participants, including their product offerings, R&D focus, manufacturing capacity, pricing strategies, and recent developments such as mergers, acquisitions, and partnerships.
  • Technology Trends & Innovation: Assessment of emerging technologies, integration of AI/IoT, semiconductor design trends, fabrication techniques, and evolving industry standards.
  • Market Drivers & Restraints: Evaluation of factors driving market growth along with challenges, supply chain constraints, regulatory issues, and market-entry barriers.
  • Stakeholder Insights: Insights for component suppliers, OEMs, system integrators, investors, and policymakers regarding the evolving ecosystem and strategic opportunities.

Primary and secondary research methods are employed, including interviews with industry experts, data from verified sources, and real-time market intelligence to ensure the accuracy and reliability of the insights presented.

FREQUENTLY ASKED QUESTIONS:

What is the current market size of KNX Products Market?

-> KNX Products Market was valued at USD 3.87 billion in 2025 and is projected to reach USD 9.34 billion by 2033, exhibiting a CAGR of 13.8% during the forecast period.

Which key companies operate in KNX Products Market?

-> Key players include Schneider Electric, ABB, SIEMENS, Hager (Berker), Legrand, Somfy, JUNG, GIRA, HDL, STEINEL, Urmet, GVS, B.E.G., DALITEK, JOBO Smartech, Tiansu, Theben AG, and Rishun Technology.

What are the key growth drivers?

-> Key growth drivers include increased demand for smart building automation, energy-efficient solutions, and integration of KNX technology across residential and commercial buildings.

Which region dominates the market?

-> Asia-Pacific shows significant growth potential, while Europe remains a dominant market due to extensive adoption of KNX standards.

What are the emerging trends?

-> Emerging trends include advancements in IoT integration, wireless KNX solutions, and increasing adoption in residential buildings (53% market share).

KNX Products Market, Global Business Strategies 2026-2033

Get Sample Report PDF for Exclusive Insights

Report Sample Includes

  • Table of Contents
  • List of Tables & Figures
  • Charts, Research Methodology, and more...
PDF Icon Download Sample Report PDF

Download Sample Report

Table of Content

1 Introduction to Research & Analysis Reports
1.1 KNX Products Market Definition
1.2 Market Segments
1.2.1 Segment by Type
1.2.2 Segment by Application
1.3 Global KNX Products Market Overview
1.4 Features & Benefits of This Report
1.5 Methodology & Sources of Information
1.5.1 Research Methodology
1.5.2 Research Process
1.5.3 Base Year
1.5.4 Report Assumptions & Caveats
2 Global KNX Products Overall Market Size
2.1 Global KNX Products Market Size: 2024 VS 2032
2.2 Global KNX Products Market Size, Prospects & Forecasts: 2020-2032
2.3 Global KNX Products Sales: 2020-2032
3 Company Landscape
3.1 Top KNX Products Players in Global Market
3.2 Top Global KNX Products Companies Ranked by Revenue
3.3 Global KNX Products Revenue by Companies
3.4 Global KNX Products Sales by Companies
3.5 Global KNX Products Price by Manufacturer (2020-2025)
3.6 Top 3 and Top 5 KNX Products Companies in Global Market, by Revenue in 2024
3.7 Global Manufacturers KNX Products Product Type
3.8 Tier 1, Tier 2, and Tier 3 KNX Products Players in Global Market
3.8.1 List of Global Tier 1 KNX Products Companies
3.8.2 List of Global Tier 2 and Tier 3 KNX Products Companies
4 Sights by Product
4.1 Overview
4.1.1 Segment by Type – Global KNX Products Market Size Markets, 2024 & 2032
4.1.2 Energy Management
4.1.3 HVAC Systems
4.1.4 Blinds & Shutters
4.1.5 Metering
4.1.6 Remote Control
4.1.7 Monitoring Systems
4.1.8 Fire & Smoke Detection
4.1.9 White Goods
4.1.10 Lighting
4.2 Segment by Type – Global KNX Products Revenue & Forecasts
4.2.1 Segment by Type – Global KNX Products Revenue, 2020-2025
4.2.2 Segment by Type – Global KNX Products Revenue, 2026-2032
4.2.3 Segment by Type – Global KNX Products Revenue Market Share, 2020-2032
4.3 Segment by Type – Global KNX Products Sales & Forecasts
4.3.1 Segment by Type – Global KNX Products Sales, 2020-2025
4.3.2 Segment by Type – Global KNX Products Sales, 2026-2032
4.3.3 Segment by Type – Global KNX Products Sales Market Share, 2020-2032
4.4 Segment by Type – Global KNX Products Price (Manufacturers Selling Prices), 2020-2032
5 Sights by Application
5.1 Overview
5.1.1 Segment by Application – Global KNX Products Market Size, 2024 & 2032
5.1.2 Commercial Building
5.1.3 Residential Building
5.1.4 Other
5.2 Segment by Application – Global KNX Products Revenue & Forecasts
5.2.1 Segment by Application – Global KNX Products Revenue, 2020-2025
5.2.2 Segment by Application – Global KNX Products Revenue, 2026-2032
5.2.3 Segment by Application – Global KNX Products Revenue Market Share, 2020-2032
5.3 Segment by Application – Global KNX Products Sales & Forecasts
5.3.1 Segment by Application – Global KNX Products Sales, 2020-2025
5.3.2 Segment by Application – Global KNX Products Sales, 2026-2032
5.3.3 Segment by Application – Global KNX Products Sales Market Share, 2020-2032
5.4 Segment by Application – Global KNX Products Price (Manufacturers Selling Prices), 2020-2032
6 Sights by Region
6.1 By Region – Global KNX Products Market Size, 2024 & 2032
6.2 By Region – Global KNX Products Revenue & Forecasts
6.2.1 By Region – Global KNX Products Revenue, 2020-2025
6.2.2 By Region – Global KNX Products Revenue, 2026-2032
6.2.3 By Region – Global KNX Products Revenue Market Share, 2020-2032
6.3 By Region – Global KNX Products Sales & Forecasts
6.3.1 By Region – Global KNX Products Sales, 2020-2025
6.3.2 By Region – Global KNX Products Sales, 2026-2032
6.3.3 By Region – Global KNX Products Sales Market Share, 2020-2032
6.4 North America
6.4.1 By Country – North America KNX Products Revenue, 2020-2032
6.4.2 By Country – North America KNX Products Sales, 2020-2032
6.4.3 United States KNX Products Market Size, 2020-2032
6.4.4 Canada KNX Products Market Size, 2020-2032
6.4.5 Mexico KNX Products Market Size, 2020-2032
6.5 Europe
6.5.1 By Country – Europe KNX Products Revenue, 2020-2032
6.5.2 By Country – Europe KNX Products Sales, 2020-2032
6.5.3 Germany KNX Products Market Size, 2020-2032
6.5.4 France KNX Products Market Size, 2020-2032
6.5.5 U.K. KNX Products Market Size, 2020-2032
6.5.6 Italy KNX Products Market Size, 2020-2032
6.5.7 Russia KNX Products Market Size, 2020-2032
6.5.8 Nordic Countries KNX Products Market Size, 2020-2032
6.5.9 Benelux KNX Products Market Size, 2020-2032
6.6 Asia
6.6.1 By Region – Asia KNX Products Revenue, 2020-2032
6.6.2 By Region – Asia KNX Products Sales, 2020-2032
6.6.3 China KNX Products Market Size, 2020-2032
6.6.4 Japan KNX Products Market Size, 2020-2032
6.6.5 South Korea KNX Products Market Size, 2020-2032
6.6.6 Southeast Asia KNX Products Market Size, 2020-2032
6.6.7 India KNX Products Market Size, 2020-2032
6.7 South America
6.7.1 By Country – South America KNX Products Revenue, 2020-2032
6.7.2 By Country – South America KNX Products Sales, 2020-2032
6.7.3 Brazil KNX Products Market Size, 2020-2032
6.7.4 Argentina KNX Products Market Size, 2020-2032
6.8 Middle East & Africa
6.8.1 By Country – Middle East & Africa KNX Products Revenue, 2020-2032
6.8.2 By Country – Middle East & Africa KNX Products Sales, 2020-2032
6.8.3 Turkey KNX Products Market Size, 2020-2032
6.8.4 Israel KNX Products Market Size, 2020-2032
6.8.5 Saudi Arabia KNX Products Market Size, 2020-2032
6.8.6 UAE KNX Products Market Size, 2020-2032
7 Manufacturers & Brands Profiles
7.1 Schneider Electric
7.1.1 Schneider Electric Company Summary
7.1.2 Schneider Electric Business Overview
7.1.3 Schneider Electric KNX Products Major Product Offerings
7.1.4 Schneider Electric KNX Products Sales and Revenue in Global (2020-2025)
7.1.5 Schneider Electric Key News & Latest Developments
7.2 ABB
7.2.1 ABB Company Summary
7.2.2 ABB Business Overview
7.2.3 ABB KNX Products Major Product Offerings
7.2.4 ABB KNX Products Sales and Revenue in Global (2020-2025)
7.2.5 ABB Key News & Latest Developments
7.3 SIEMENS
7.3.1 SIEMENS Company Summary
7.3.2 SIEMENS Business Overview
7.3.3 SIEMENS KNX Products Major Product Offerings
7.3.4 SIEMENS KNX Products Sales and Revenue in Global (2020-2025)
7.3.5 SIEMENS Key News & Latest Developments
7.4 Hager (Berker)
7.4.1 Hager (Berker) Company Summary
7.4.2 Hager (Berker) Business Overview
7.4.3 Hager (Berker) KNX Products Major Product Offerings
7.4.4 Hager (Berker) KNX Products Sales and Revenue in Global (2020-2025)
7.4.5 Hager (Berker) Key News & Latest Developments
7.5 Legrand
7.5.1 Legrand Company Summary
7.5.2 Legrand Business Overview
7.5.3 Legrand KNX Products Major Product Offerings
7.5.4 Legrand KNX Products Sales and Revenue in Global (2020-2025)
7.5.5 Legrand Key News & Latest Developments
7.6 Somfy
7.6.1 Somfy Company Summary
7.6.2 Somfy Business Overview
7.6.3 Somfy KNX Products Major Product Offerings
7.6.4 Somfy KNX Products Sales and Revenue in Global (2020-2025)
7.6.5 Somfy Key News & Latest Developments
7.7 JUNG
7.7.1 JUNG Company Summary
7.7.2 JUNG Business Overview
7.7.3 JUNG KNX Products Major Product Offerings
7.7.4 JUNG KNX Products Sales and Revenue in Global (2020-2025)
7.7.5 JUNG Key News & Latest Developments
7.8 GIRA
7.8.1 GIRA Company Summary
7.8.2 GIRA Business Overview
7.8.3 GIRA KNX Products Major Product Offerings
7.8.4 GIRA KNX Products Sales and Revenue in Global (2020-2025)
7.8.5 GIRA Key News & Latest Developments
7.9 HDL
7.9.1 HDL Company Summary
7.9.2 HDL Business Overview
7.9.3 HDL KNX Products Major Product Offerings
7.9.4 HDL KNX Products Sales and Revenue in Global (2020-2025)
7.9.5 HDL Key News & Latest Developments
7.10 STEINEL
7.10.1 STEINEL Company Summary
7.10.2 STEINEL Business Overview
7.10.3 STEINEL KNX Products Major Product Offerings
7.10.4 STEINEL KNX Products Sales and Revenue in Global (2020-2025)
7.10.5 STEINEL Key News & Latest Developments
7.11 Urmet
7.11.1 Urmet Company Summary
7.11.2 Urmet Business Overview
7.11.3 Urmet KNX Products Major Product Offerings
7.11.4 Urmet KNX Products Sales and Revenue in Global (2020-2025)
7.11.5 Urmet Key News & Latest Developments
7.12 GVS
7.12.1 GVS Company Summary
7.12.2 GVS Business Overview
7.12.3 GVS KNX Products Major Product Offerings
7.12.4 GVS KNX Products Sales and Revenue in Global (2020-2025)
7.12.5 GVS Key News & Latest Developments
7.13 B.E.G.
7.13.1 B.E.G. Company Summary
7.13.2 B.E.G. Business Overview
7.13.3 B.E.G. KNX Products Major Product Offerings
7.13.4 B.E.G. KNX Products Sales and Revenue in Global (2020-2025)
7.13.5 B.E.G. Key News & Latest Developments
7.14 DALITEK
7.14.1 DALITEK Company Summary
7.14.2 DALITEK Business Overview
7.14.3 DALITEK KNX Products Major Product Offerings
7.14.4 DALITEK KNX Products Sales and Revenue in Global (2020-2025)
7.14.5 DALITEK Key News & Latest Developments
7.15 JOBO Smartech
7.15.1 JOBO Smartech Company Summary
7.15.2 JOBO Smartech Business Overview
7.15.3 JOBO Smartech KNX Products Major Product Offerings
7.15.4 JOBO Smartech KNX Products Sales and Revenue in Global (2020-2025)
7.15.5 JOBO Smartech Key News & Latest Developments
7.16 Tiansu
7.16.1 Tiansu Company Summary
7.16.2 Tiansu Business Overview
7.16.3 Tiansu KNX Products Major Product Offerings
7.16.4 Tiansu KNX Products Sales and Revenue in Global (2020-2025)
7.16.5 Tiansu Key News & Latest Developments
7.17 Theben AG
7.17.1 Theben AG Company Summary
7.17.2 Theben AG Business Overview
7.17.3 Theben AG KNX Products Major Product Offerings
7.17.4 Theben AG KNX Products Sales and Revenue in Global (2020-2025)
7.17.5 Theben AG Key News & Latest Developments
7.18 Rishun Technology
7.18.1 Rishun Technology Company Summary
7.18.2 Rishun Technology Business Overview
7.18.3 Rishun Technology KNX Products Major Product Offerings
7.18.4 Rishun Technology KNX Products Sales and Revenue in Global (2020-2025)
7.18.5 Rishun Technology Key News & Latest Developments
8 Global KNX Products Production Capacity, Analysis
8.1 Global KNX Products Production Capacity, 2020-2032
8.2 KNX Products Production Capacity of Key Manufacturers in Global Market
8.3 Global KNX Products Production by Region
9 Key Market Trends, Opportunity, Drivers and Restraints
9.1 Market Opportunities & Trends
9.2 Market Drivers
9.3 Market Restraints
10 KNX Products Supply Chain Analysis
10.1 KNX Products Industry Value Chain
10.2 KNX Products Upstream Market
10.3 KNX Products Downstream and Clients
10.4 Marketing Channels Analysis
10.4.1 Marketing Channels
10.4.2 KNX Products Distributors and Sales Agents in Global
11 Conclusion
12 Appendix
12.1 Note
12.2 Examples of Clients
12.3 DisclaimerList of Tables
Table 1. Key Players of KNX Products in Global Market
Table 2. Top KNX Products Players in Global Market, Ranking by Revenue (2024)
Table 3. Global KNX Products Revenue by Companies, (US$, Mn), 2020-2025
Table 4. Global KNX Products Revenue Share by Companies, 2020-2025
Table 5. Global KNX Products Sales by Companies, (K Units), 2020-2025
Table 6. Global KNX Products Sales Share by Companies, 2020-2025
Table 7. Key Manufacturers KNX Products Price (2020-2025) & (USD/Unit)
Table 8. Global Manufacturers KNX Products Product Type
Table 9. List of Global Tier 1 KNX Products Companies, Revenue (US$, Mn) in 2024 and Market Share
Table 10. List of Global Tier 2 and Tier 3 KNX Products Companies, Revenue (US$, Mn) in 2024 and Market Share
Table 11. Segment by Type – Global KNX Products Revenue, (US$, Mn), 2024 & 2032
Table 12. Segment by Type – Global KNX Products Revenue (US$, Mn), 2020-2025
Table 13. Segment by Type – Global KNX Products Revenue (US$, Mn), 2026-2032
Table 14. Segment by Type – Global KNX Products Sales (K Units), 2020-2025
Table 15. Segment by Type – Global KNX Products Sales (K Units), 2026-2032
Table 16. Segment by Application – Global KNX Products Revenue, (US$, Mn), 2024 & 2032
Table 17. Segment by Application – Global KNX Products Revenue, (US$, Mn), 2020-2025
Table 18. Segment by Application – Global KNX Products Revenue, (US$, Mn), 2026-2032
Table 19. Segment by Application – Global KNX Products Sales, (K Units), 2020-2025
Table 20. Segment by Application – Global KNX Products Sales, (K Units), 2026-2032
Table 21. By Region – Global KNX Products Revenue, (US$, Mn), 2025-2032
Table 22. By Region – Global KNX Products Revenue, (US$, Mn), 2020-2025
Table 23. By Region – Global KNX Products Revenue, (US$, Mn), 2026-2032
Table 24. By Region – Global KNX Products Sales, (K Units), 2020-2025
Table 25. By Region – Global KNX Products Sales, (K Units), 2026-2032
Table 26. By Country – North America KNX Products Revenue, (US$, Mn), 2020-2025
Table 27. By Country – North America KNX Products Revenue, (US$, Mn), 2026-2032
Table 28. By Country – North America KNX Products Sales, (K Units), 2020-2025
Table 29. By Country – North America KNX Products Sales, (K Units), 2026-2032
Table 30. By Country – Europe KNX Products Revenue, (US$, Mn), 2020-2025
Table 31. By Country – Europe KNX Products Revenue, (US$, Mn), 2026-2032
Table 32. By Country – Europe KNX Products Sales, (K Units), 2020-2025
Table 33. By Country – Europe KNX Products Sales, (K Units), 2026-2032
Table 34. By Region – Asia KNX Products Revenue, (US$, Mn), 2020-2025
Table 35. By Region – Asia KNX Products Revenue, (US$, Mn), 2026-2032
Table 36. By Region – Asia KNX Products Sales, (K Units), 2020-2025
Table 37. By Region – Asia KNX Products Sales, (K Units), 2026-2032
Table 38. By Country – South America KNX Products Revenue, (US$, Mn), 2020-2025
Table 39. By Country – South America KNX Products Revenue, (US$, Mn), 2026-2032
Table 40. By Country – South America KNX Products Sales, (K Units), 2020-2025
Table 41. By Country – South America KNX Products Sales, (K Units), 2026-2032
Table 42. By Country – Middle East & Africa KNX Products Revenue, (US$, Mn), 2020-2025
Table 43. By Country – Middle East & Africa KNX Products Revenue, (US$, Mn), 2026-2032
Table 44. By Country – Middle East & Africa KNX Products Sales, (K Units), 2020-2025
Table 45. By Country – Middle East & Africa KNX Products Sales, (K Units), 2026-2032
Table 46. Schneider Electric Company Summary
Table 47. Schneider Electric KNX Products Product Offerings
Table 48. Schneider Electric KNX Products Sales (K Units), Revenue (US$, Mn) and Average Price (USD/Unit) & (2020-2025)
Table 49. Schneider Electric Key News & Latest Developments
Table 50. ABB Company Summary
Table 51. ABB KNX Products Product Offerings
Table 52. ABB KNX Products Sales (K Units), Revenue (US$, Mn) and Average Price (USD/Unit) & (2020-2025)
Table 53. ABB Key News & Latest Developments
Table 54. SIEMENS Company Summary
Table 55. SIEMENS KNX Products Product Offerings
Table 56. SIEMENS KNX Products Sales (K Units), Revenue (US$, Mn) and Average Price (USD/Unit) & (2020-2025)
Table 57. SIEMENS Key News & Latest Developments
Table 58. Hager (Berker) Company Summary
Table 59. Hager (Berker) KNX Products Product Offerings
Table 60. Hager (Berker) KNX Products Sales (K Units), Revenue (US$, Mn) and Average Price (USD/Unit) & (2020-2025)
Table 61. Hager (Berker) Key News & Latest Developments
Table 62. Legrand Company Summary
Table 63. Legrand KNX Products Product Offerings
Table 64. Legrand KNX Products Sales (K Units), Revenue (US$, Mn) and Average Price (USD/Unit) & (2020-2025)
Table 65. Legrand Key News & Latest Developments
Table 66. Somfy Company Summary
Table 67. Somfy KNX Products Product Offerings
Table 68. Somfy KNX Products Sales (K Units), Revenue (US$, Mn) and Average Price (USD/Unit) & (2020-2025)
Table 69. Somfy Key News & Latest Developments
Table 70. JUNG Company Summary
Table 71. JUNG KNX Products Product Offerings
Table 72. JUNG KNX Products Sales (K Units), Revenue (US$, Mn) and Average Price (USD/Unit) & (2020-2025)
Table 73. JUNG Key News & Latest Developments
Table 74. GIRA Company Summary
Table 75. GIRA KNX Products Product Offerings
Table 76. GIRA KNX Products Sales (K Units), Revenue (US$, Mn) and Average Price (USD/Unit) & (2020-2025)
Table 77. GIRA Key News & Latest Developments
Table 78. HDL Company Summary
Table 79. HDL KNX Products Product Offerings
Table 80. HDL KNX Products Sales (K Units), Revenue (US$, Mn) and Average Price (USD/Unit) & (2020-2025)
Table 81. HDL Key News & Latest Developments
Table 82. STEINEL Company Summary
Table 83. STEINEL KNX Products Product Offerings
Table 84. STEINEL KNX Products Sales (K Units), Revenue (US$, Mn) and Average Price (USD/Unit) & (2020-2025)
Table 85. STEINEL Key News & Latest Developments
Table 86. Urmet Company Summary
Table 87. Urmet KNX Products Product Offerings
Table 88. Urmet KNX Products Sales (K Units), Revenue (US$, Mn) and Average Price (USD/Unit) & (2020-2025)
Table 89. Urmet Key News & Latest Developments
Table 90. GVS Company Summary
Table 91. GVS KNX Products Product Offerings
Table 92. GVS KNX Products Sales (K Units), Revenue (US$, Mn) and Average Price (USD/Unit) & (2020-2025)
Table 93. GVS Key News & Latest Developments
Table 94. B.E.G. Company Summary
Table 95. B.E.G. KNX Products Product Offerings
Table 96. B.E.G. KNX Products Sales (K Units), Revenue (US$, Mn) and Average Price (USD/Unit) & (2020-2025)
Table 97. B.E.G. Key News & Latest Developments
Table 98. DALITEK Company Summary
Table 99. DALITEK KNX Products Product Offerings
Table 100. DALITEK KNX Products Sales (K Units), Revenue (US$, Mn) and Average Price (USD/Unit) & (2020-2025)
Table 101. DALITEK Key News & Latest Developments
Table 102. JOBO Smartech Company Summary
Table 103. JOBO Smartech KNX Products Product Offerings
Table 104. JOBO Smartech KNX Products Sales (K Units), Revenue (US$, Mn) and Average Price (USD/Unit) & (2020-2025)
Table 105. JOBO Smartech Key News & Latest Developments
Table 106. Tiansu Company Summary
Table 107. Tiansu KNX Products Product Offerings
Table 108. Tiansu KNX Products Sales (K Units), Revenue (US$, Mn) and Average Price (USD/Unit) & (2020-2025)
Table 109. Tiansu Key News & Latest Developments
Table 110. Theben AG Company Summary
Table 111. Theben AG KNX Products Product Offerings
Table 112. Theben AG KNX Products Sales (K Units), Revenue (US$, Mn) and Average Price (USD/Unit) & (2020-2025)
Table 113. Theben AG Key News & Latest Developments
Table 114. Rishun Technology Company Summary
Table 115. Rishun Technology KNX Products Product Offerings
Table 116. Rishun Technology KNX Products Sales (K Units), Revenue (US$, Mn) and Average Price (USD/Unit) & (2020-2025)
Table 117. Rishun Technology Key News & Latest Developments
Table 118. KNX Products Capacity of Key Manufacturers in Global Market, 2023-2025 (K Units)
Table 119. Global KNX Products Capacity Market Share of Key Manufacturers, 2023-2025
Table 120. Global KNX Products Production by Region, 2020-2025 (K Units)
Table 121. Global KNX Products Production by Region, 2026-2032 (K Units)
Table 122. KNX Products Market Opportunities & Trends in Global Market
Table 123. KNX Products Market Drivers in Global Market
Table 124. KNX Products Market Restraints in Global Market
Table 125. KNX Products Raw Materials
Table 126. KNX Products Raw Materials Suppliers in Global Market
Table 127. Typical KNX Products Downstream
Table 128. KNX Products Downstream Clients in Global Market
Table 129. KNX Products Distributors and Sales Agents in Global Market

List of Figures
Figure 1. KNX Products Product Picture
Figure 2. KNX Products Segment by Type in 2024
Figure 3. KNX Products Segment by Application in 2024
Figure 4. Global KNX Products Market Overview: 2024
Figure 5. Key Caveats
Figure 6. Global KNX Products Market Size: 2024 VS 2032 (US$, Mn)
Figure 7. Global KNX Products Revenue: 2020-2032 (US$, Mn)
Figure 8. KNX Products Sales in Global Market: 2020-2032 (K Units)
Figure 9. The Top 3 and 5 Players Market Share by KNX Products Revenue in 2024
Figure 10. Segment by Type – Global KNX Products Revenue, (US$, Mn), 2024 & 2032
Figure 11. Segment by Type – Global KNX Products Revenue Market Share, 2020-2032
Figure 12. Segment by Type – Global KNX Products Sales Market Share, 2020-2032
Figure 13. Segment by Type – Global KNX Products Price (USD/Unit), 2020-2032
Figure 14. Segment by Application – Global KNX Products Revenue, (US$, Mn), 2024 & 2032
Figure 15. Segment by Application – Global KNX Products Revenue Market Share, 2020-2032
Figure 16. Segment by Application – Global KNX Products Sales Market Share, 2020-2032
Figure 17. Segment by Application -Global KNX Products Price (USD/Unit), 2020-2032
Figure 18. By Region – Global KNX Products Revenue, (US$, Mn), 2025 & 2032
Figure 19. By Region – Global KNX Products Revenue Market Share, 2020 VS 2024 VS 2032
Figure 20. By Region – Global KNX Products Revenue Market Share, 2020-2032
Figure 21. By Region – Global KNX Products Sales Market Share, 2020-2032
Figure 22. By Country – North America KNX Products Revenue Market Share, 2020-2032
Figure 23. By Country – North America KNX Products Sales Market Share, 2020-2032
Figure 24. United States KNX Products Revenue, (US$, Mn), 2020-2032
Figure 25. Canada KNX Products Revenue, (US$, Mn), 2020-2032
Figure 26. Mexico KNX Products Revenue, (US$, Mn), 2020-2032
Figure 27. By Country – Europe KNX Products Revenue Market Share, 2020-2032
Figure 28. By Country – Europe KNX Products Sales Market Share, 2020-2032
Figure 29. Germany KNX Products Revenue, (US$, Mn), 2020-2032
Figure 30. France KNX Products Revenue, (US$, Mn), 2020-2032
Figure 31. U.K. KNX Products Revenue, (US$, Mn), 2020-2032
Figure 32. Italy KNX Products Revenue, (US$, Mn), 2020-2032
Figure 33. Russia KNX Products Revenue, (US$, Mn), 2020-2032
Figure 34. Nordic Countries KNX Products Revenue, (US$, Mn), 2020-2032
Figure 35. Benelux KNX Products Revenue, (US$, Mn), 2020-2032
Figure 36. By Region – Asia KNX Products Revenue Market Share, 2020-2032
Figure 37. By Region – Asia KNX Products Sales Market Share, 2020-2032
Figure 38. China KNX Products Revenue, (US$, Mn), 2020-2032
Figure 39. Japan KNX Products Revenue, (US$, Mn), 2020-2032
Figure 40. South Korea KNX Products Revenue, (US$, Mn), 2020-2032
Figure 41. Southeast Asia KNX Products Revenue, (US$, Mn), 2020-2032
Figure 42. India KNX Products Revenue, (US$, Mn), 2020-2032
Figure 43. By Country – South America KNX Products Revenue Market Share, 2020-2032
Figure 44. By Country – South America KNX Products Sales, Market Share, 2020-2032
Figure 45. Brazil KNX Products Revenue, (US$, Mn), 2020-2032
Figure 46. Argentina KNX Products Revenue, (US$, Mn), 2020-2032
Figure 47. By Country – Middle East & Africa KNX Products Revenue, Market Share, 2020-2032
Figure 48. By Country – Middle East & Africa KNX Products Sales, Market Share, 2020-2032
Figure 49. Turkey KNX Products Revenue, (US$, Mn), 2020-2032
Figure 50. Israel KNX Products Revenue, (US$, Mn), 2020-2032
Figure 51. Saudi Arabia KNX Products Revenue, (US$, Mn), 2020-2032
Figure 52. UAE KNX Products Revenue, (US$, Mn), 2020-2032
Figure 53. Global KNX Products Production Capacity (K Units), 2020-2032
Figure 54. The Percentage of Production KNX Products by Region, 2024 VS 2032
Figure 55. KNX Products Industry Value Chain
Figure 56. Marketing Channels