SEMICONDUCTOR INSIGHT
MARKET RESEARCH REPORT

High Voltage Switch for Car Charger Market

2026 to 2034
MARKET INTELLIGENCE
ACROSS KEY REGIONS
2026 EDITION
POWER ELECTRONICS Semiconductor Market Research

High Voltage Switch for Car Charger Market

Size, Share & Industry Analysis, By Type (One-phase, Three-phase), By Application (HEV, EV), By Device Technology (Silicon IGBT, SiC MOSFET, GaN Power Device), By Charger Location (On-board Charger, Off-board DC Fast Charger), and Regional Forecast, 2026-2034

◷
UPDATED 13 October 2026
▤
REPORT LENGTH Detailed Report
▣
REPORT CODE f617576abea4
▯
FORMATS PDF

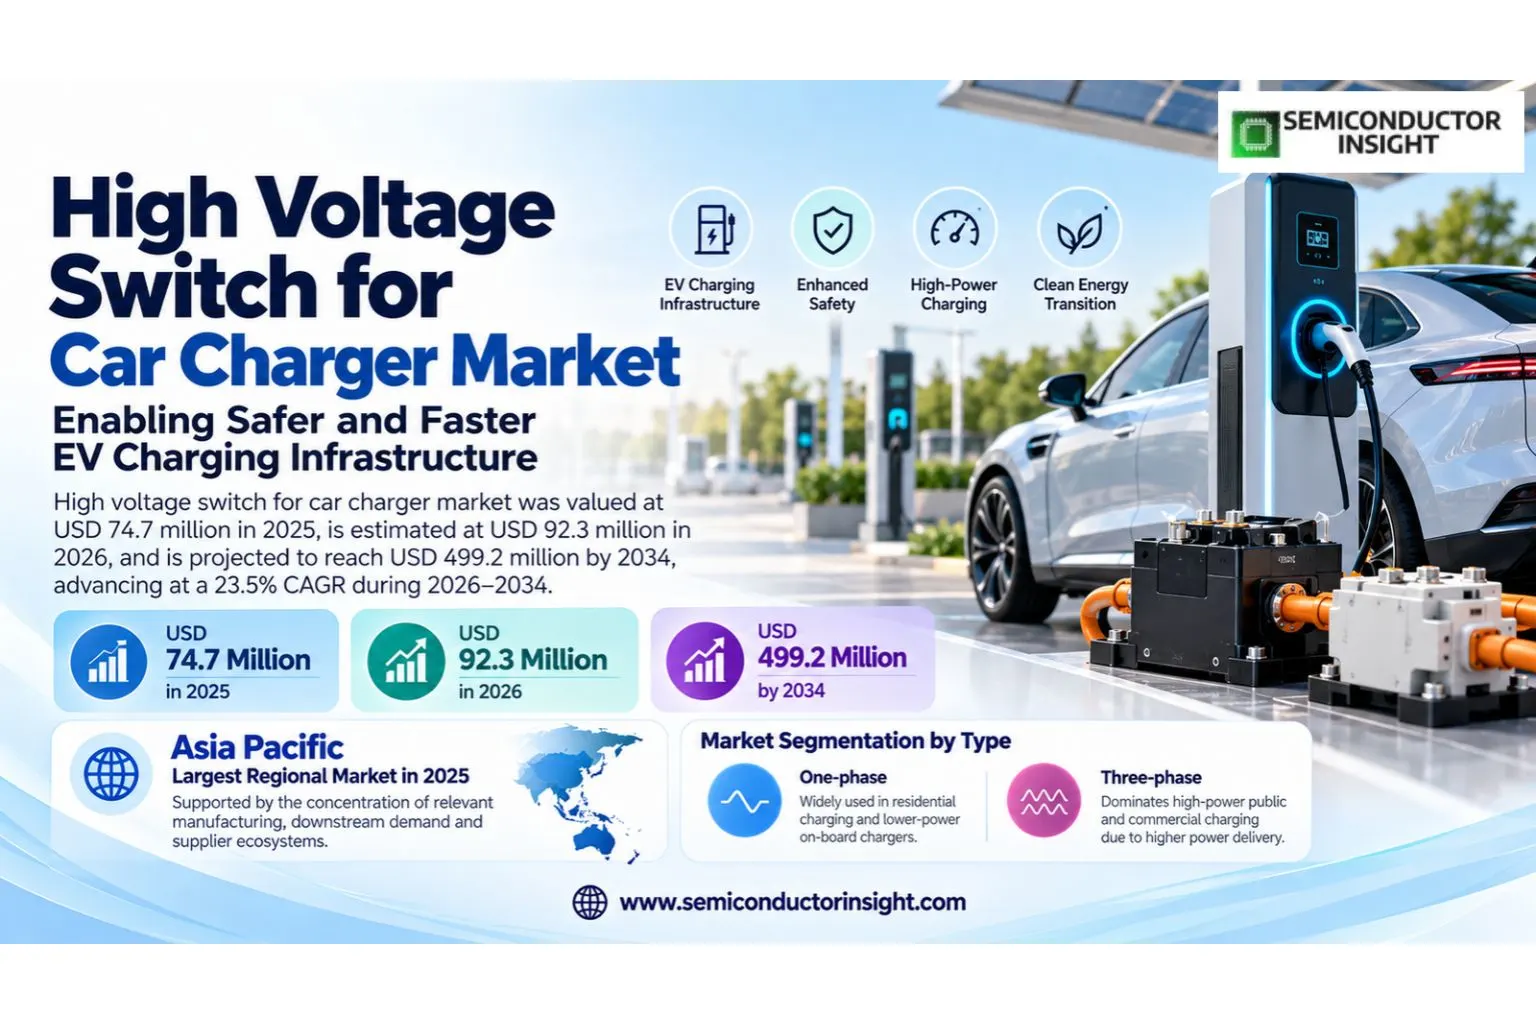
High voltage switch for car charger market was valued at USD 74.7 million in 2025, is estimated at USD 92.3 million in 2026, and is projected to reach USD 499.2 million by 2034, advancing at a 23.5% CAGR during 2026–2034. Asia Pacific represents the largest regional market in 2025, supported by the concentration of relevant manufacturing, downstream demand and supplier ecosystems.

Get the sample PDF with study scope, segmentation and methodology details.

Key Statistics

2025 Market Size
USD 74.7 million
2034 Projected Market Size
USD 499.2 million
CAGR (2026–2034)
23.5%
Largest Market in 2025
Asia Pacific

Key Takeaways

  • High voltage switch for car charger market was valued at USD 74.7 million in 2025 and is projected to reach USD 499.2 million by 2034, representing a 23.5% CAGR over 2026–2034.
  • The market is valued at USD 74.7 million in 2025 and is projected to reach USD 499.2 million by 2034, representing a 23.5% CAGR over 2026–2034.
  • Three-phase high-voltage switching captures the strongest commercial value in higher-power chargers, while single-phase architectures remain important in residential and lower-power charging.
  • SiC MOSFETs are the fastest-growing device technology because 800V EV platforms and fast DC chargers benefit from lower switching loss, higher frequency and smaller cooling systems.
  • Asia Pacific leads through China’s EV and charging scale, Japan and South Korea’s power-electronics supply chains, and rapid deployment of high-power charging infrastructure.

High Voltage Switch for Car Charger Market Overview

High voltage switch for car charger market was valued at USD 74.7 million in 2025, is estimated at USD 92.3 million in 2026, and is projected to reach USD 499.2 million by 2034, advancing at a 23.5% CAGR during 2026–2034. Asia Pacific represents the largest regional market in 2025, supported by the concentration of relevant manufacturing, downstream demand and supplier ecosystems.

Base year: 2025 · Estimated year: 2026 · Forecast period: 2026–2034 · Values in USD million unless otherwise stated

High-voltage switches for car chargers control and convert power in on-board chargers, DC fast chargers and DC/DC charging stages. The category includes silicon IGBTs, silicon carbide MOSFETs and emerging gallium-nitride devices selected according to voltage, current, switching frequency and thermal requirements.

The transition toward 800V vehicle architectures is accelerating adoption of 1200V-class SiC devices. Faster switching reduces magnetic-component size and power loss, enabling more compact chargers with higher power density. The market is therefore shifting from simple switch volume toward higher-value device technology, top-side cooling and integrated power-module architectures.

The commercial structure of the high voltage switch for car charger market is shaped by design qualification, production economics and the interaction between component performance and downstream system requirements. Suppliers that can combine consistent manufacturing, application engineering and supply assurance are better positioned to convert technical eligibility into repeat business. Customer decisions increasingly account for lifecycle continuity, geographic resilience and integration cost, which makes proven process control and ecosystem compatibility as important as nominal product capability.

Segment Analysis: By Type

By type, the High Voltage Switch for Car Charger market is segmented into One-phase, Three-phase. Three-phase systems dominate high-power public and commercial charging because they deliver much greater power than single-phase connections. Single-phase architectures remain important for residential charging and lower-power on-board charger designs. Purchasing decisions vary by performance requirement, qualification burden, integration complexity and lifecycle economics, so suppliers compete on application fit rather than on a single technical specification.

Type Role in the market Demand characteristics
One-phase One-phase addresses a distinct part of the product and process mix. Its commercial position depends on technical fit, manufacturing maturity, integration requirements and customer qualification rather than on headline specifications alone. Demand is strongest where the segment aligns with established customer designs, predictable supply, and measurable system-level performance. Suppliers that can document repeatability, compatibility and lifecycle support are better placed to defend design wins.
Three-phase Three-phase addresses a distinct part of the product and process mix. Its commercial position depends on technical fit, manufacturing maturity, integration requirements and customer qualification rather than on headline specifications alone. Demand is strongest where the segment aligns with established customer designs, predictable supply, and measurable system-level performance. Suppliers that can document repeatability, compatibility and lifecycle support are better placed to defend design wins.

Segment Analysis: By Device Technology

By device technology, the High Voltage Switch for Car Charger market is segmented into Silicon IGBT, SiC MOSFET, GaN Power Device. SiC MOSFETs are gaining share rapidly at 800V and high-frequency conversion, silicon IGBTs remain cost-effective in established lower-frequency systems, and GaN is strongest in lower-voltage high-frequency stages. Purchasing decisions vary by performance requirement, qualification burden, integration complexity and lifecycle economics, so suppliers compete on application fit rather than on a single technical specification.

Device Technology Role in the market Demand characteristics
Silicon IGBT Silicon IGBT represents a relevant purchasing and deployment pathway within this market. Commercial attractiveness depends on how well it aligns with customer architecture, supply-chain constraints and required performance. Growth is linked to design-in activity, installed-base transitions and the ability of suppliers to meet qualification, cost and availability requirements over the full product lifecycle.
SiC MOSFET SiC MOSFET represents a relevant purchasing and deployment pathway within this market. Commercial attractiveness depends on how well it aligns with customer architecture, supply-chain constraints and required performance. Growth is linked to design-in activity, installed-base transitions and the ability of suppliers to meet qualification, cost and availability requirements over the full product lifecycle.
GaN Power Device GaN Power Device represents a relevant purchasing and deployment pathway within this market. Commercial attractiveness depends on how well it aligns with customer architecture, supply-chain constraints and required performance. Growth is linked to design-in activity, installed-base transitions and the ability of suppliers to meet qualification, cost and availability requirements over the full product lifecycle.

Segment Analysis: By Application

By application, the High Voltage Switch for Car Charger market is segmented into HEV, EV. Battery-electric vehicles are the strongest growth application because they depend fully on external and onboard charging, while HEVs use smaller battery systems and lower average charger power. Purchasing decisions vary by performance requirement, qualification burden, integration complexity and lifecycle economics, so suppliers compete on application fit rather than on a single technical specification.

Application Role in the market Demand characteristics
HEV HEV creates demand when the underlying system requires the market’s core function at production scale. Procurement is normally tied to platform launches, equipment upgrades, capacity expansion or replacement cycles. Buyers evaluate reliability, qualification time, integration cost and vendor support alongside unit economics. Adoption accelerates when the solution removes a system bottleneck or supports a new performance tier without creating disproportionate redesign risk.
EV EV creates demand when the underlying system requires the market’s core function at production scale. Procurement is normally tied to platform launches, equipment upgrades, capacity expansion or replacement cycles. Buyers evaluate reliability, qualification time, integration cost and vendor support alongside unit economics. Adoption accelerates when the solution removes a system bottleneck or supports a new performance tier without creating disproportionate redesign risk.

Segment Analysis: By Charger Location

By charger location, the High Voltage Switch for Car Charger market is segmented into On-board Charger, Off-board DC Fast Charger. On-board chargers prioritize automotive qualification, compactness and thermal integration, while off-board DC fast chargers optimize efficiency, serviceability and very high power throughput. Purchasing decisions vary by performance requirement, qualification burden, integration complexity and lifecycle economics, so suppliers compete on application fit rather than on a single technical specification.

Charger Location Role in the market Demand characteristics
On-board Charger On-board Charger represents a relevant purchasing and deployment pathway within this market. Commercial attractiveness depends on how well it aligns with customer architecture, supply-chain constraints and required performance. Growth is linked to design-in activity, installed-base transitions and the ability of suppliers to meet qualification, cost and availability requirements over the full product lifecycle.
Off-board DC Fast Charger Off-board DC Fast Charger represents a relevant purchasing and deployment pathway within this market. Commercial attractiveness depends on how well it aligns with customer architecture, supply-chain constraints and required performance. Growth is linked to design-in activity, installed-base transitions and the ability of suppliers to meet qualification, cost and availability requirements over the full product lifecycle.

Regional Analysis

Asia Pacific leads the high voltage switch for car charger market in 2025, while regional growth patterns differ according to manufacturing concentration, customer investment cycles, regulation, product mix and supply-chain access. The most important regional distinction is not simply market size; it is the mechanism that converts local investment and end-market demand into qualified purchases.

How does regional demand differ across the high voltage switch for car charger market?

Regional demand for high voltage switch for car charger is structurally uneven because manufacturing assets, design centers, downstream customers and qualification ecosystems are not distributed evenly. Asia Pacific typically has the deepest electronics manufacturing base, North America combines technology development with capital investment, Europe emphasizes reliability and industrial requirements, and emerging regions are more dependent on imported systems. These differences influence vendor selection, inventory policy, service expectations and the pace at which new technologies are adopted.

Region Market position Growth outlook Demand profile Supplier-selection gate
Asia Pacific Largest Very strong EV production and charging infrastructure led Efficiency, cost and local supply
North America Large fast-growing market Very strong Fast charging and automotive led Infrastructure investment and reliability
Europe High-value market Strong 800V vehicle and public-charging led Efficiency and automotive qualification
South America Emerging Strong Urban charging and fleet led EV penetration and infrastructure economics
Middle East & Africa Developing Strong from smaller base Premium EV and infrastructure led Utilization and heat management

Detailed Regional Blocks

Asia Pacific LARGEST MARKET

What defines the Asia Pacific high voltage switch for car charger market?

Asia Pacific leads because China operates the world’s largest EV market and charging network, while Japan and South Korea have strong power-semiconductor and automotive supply chains. High charger volumes create the strongest scale opportunity for SiC and integrated power modules. Supplier strategies therefore need to reflect local qualification practices, channel structure, end-market priorities and the availability of technically comparable alternatives rather than treating the region as a uniform extension of global demand.

Market positionLargest
Growth outlookVery strong
Demand profileEV production and charging infrastructure led
Market access gateEfficiency, cost and local supply
Country / subregion Role Demand logic
China Largest growth engine EV and fast-charging deployment drive high-voltage switch volume.
Japan Power electronics hub Automotive and semiconductor expertise supports high-reliability devices.
South Korea EV and semiconductor demand Vehicle platforms and power-device supply support adoption.

Market instances

Infineon states that a single 1200V SiC MOSFET can support an 800V DC link and that SiC can reduce switching and conduction losses in DC EV chargers while increasing power density. For suppliers in Asia Pacific, the commercial implication is a stronger need to align product qualification, account coverage and inventory planning with the local demand mechanism rather than relying on broad global growth assumptions.

Asian charger manufacturers are scaling 800V and ultra-fast platforms, raising demand for low-loss 1200V devices and modules. For suppliers in Asia Pacific, the commercial implication is a stronger need to align product qualification, account coverage and inventory planning with the local demand mechanism rather than relying on broad global growth assumptions.

Regional vertical integration across EVs, batteries, chargers and power semiconductors accelerates qualification of new switch generations. For suppliers in Asia Pacific, the commercial implication is a stronger need to align product qualification, account coverage and inventory planning with the local demand mechanism rather than relying on broad global growth assumptions.

Full-report coverage for Asia Pacific examines country-level demand, customer concentration, supplier positioning and the technical or commercial requirements that influence qualification. The regional view is designed to distinguish structural demand drivers from short-lived purchasing cycles and to show where market access depends on local manufacturing, distribution, standards, service capability or long-term customer relationships.

North America LARGE FAST-GROWING MARKET

What defines the North America high voltage switch for car charger market?

North America is growing rapidly through highway fast-charging networks, fleet electrification and domestic EV investment. Charger uptime and power density are central selection criteria because public infrastructure must deliver high energy throughput with manageable cooling and maintenance. Supplier strategies therefore need to reflect local qualification practices, channel structure, end-market priorities and the availability of technically comparable alternatives rather than treating the region as a uniform extension of global demand.

Market positionLarge fast-growing market
Growth outlookVery strong
Demand profileFast charging and automotive led
Market access gateInfrastructure investment and reliability
Country / subregion Role Demand logic
United States Largest regional market Fast charging, fleets and domestic EV production drive demand.
Canada Corridor and urban charging EV adoption supports public charger expansion.
Mexico Automotive manufacturing Vehicle production creates downstream charger electronics demand.

Market instances

1200V SiC modules are widely positioned by semiconductor vendors for DC EV charging, reflecting the voltage requirements of fast charger PFC and DC/DC stages. For suppliers in North America, the commercial implication is a stronger need to align product qualification, account coverage and inventory planning with the local demand mechanism rather than relying on broad global growth assumptions.

Higher power density can reduce cabinet footprint and cooling requirements at constrained charging sites. For suppliers in North America, the commercial implication is a stronger need to align product qualification, account coverage and inventory planning with the local demand mechanism rather than relying on broad global growth assumptions.

Fleet depots create demand for multi-port high-power systems where semiconductor efficiency has a direct effect on operating cost. For suppliers in North America, the commercial implication is a stronger need to align product qualification, account coverage and inventory planning with the local demand mechanism rather than relying on broad global growth assumptions.

Full-report coverage for North America examines country-level demand, customer concentration, supplier positioning and the technical or commercial requirements that influence qualification. The regional view is designed to distinguish structural demand drivers from short-lived purchasing cycles and to show where market access depends on local manufacturing, distribution, standards, service capability or long-term customer relationships.

Europe HIGH-VALUE MARKET

What defines the Europe high voltage switch for car charger market?

Europe is a high-value market because automotive OEMs are adopting 800V architectures and public charging density is increasing. German and broader European Tier 1 suppliers are actively qualifying SiC for on-board chargers and DC/DC systems. Supplier strategies therefore need to reflect local qualification practices, channel structure, end-market priorities and the availability of technically comparable alternatives rather than treating the region as a uniform extension of global demand.

Market positionHigh-value market
Growth outlookStrong
Demand profile800V vehicle and public-charging led
Market access gateEfficiency and automotive qualification
Country / subregion Role Demand logic
Germany Automotive power-electronics hub 800V EV and Tier 1 programs create high-value switch demand.
France Charging infrastructure Public charging and EV programs support power semiconductor demand.
Nordic countries High EV penetration Fast-charging utilization creates strong efficiency economics.

Market instances

In January 2025 FORVIA HELLA selected Infineon 1200V CoolSiC automotive MOSFETs for a next-generation 800V DC/DC charging solution. For suppliers in Europe, the commercial implication is a stronger need to align product qualification, account coverage and inventory planning with the local demand mechanism rather than relying on broad global growth assumptions.

ST offers AEC-Q101 1200V SiC MOSFETs specifically for EV/HEV DC/DC converters and on-board chargers. For suppliers in Europe, the commercial implication is a stronger need to align product qualification, account coverage and inventory planning with the local demand mechanism rather than relying on broad global growth assumptions.

European efficiency and vehicle-emission policy supports continued EV and charging investment. For suppliers in Europe, the commercial implication is a stronger need to align product qualification, account coverage and inventory planning with the local demand mechanism rather than relying on broad global growth assumptions.

Full-report coverage for Europe examines country-level demand, customer concentration, supplier positioning and the technical or commercial requirements that influence qualification. The regional view is designed to distinguish structural demand drivers from short-lived purchasing cycles and to show where market access depends on local manufacturing, distribution, standards, service capability or long-term customer relationships.

South America EMERGING

What defines the South America high voltage switch for car charger market?

South America is an emerging market led by Brazil, where EV adoption and public charging are expanding from a smaller base. Charger economics remain sensitive to utilization and imported equipment cost. Supplier strategies therefore need to reflect local qualification practices, channel structure, end-market priorities and the availability of technically comparable alternatives rather than treating the region as a uniform extension of global demand.

Market positionEmerging
Growth outlookStrong
Demand profileUrban charging and fleet led
Market access gateEV penetration and infrastructure economics
Country / subregion Role Demand logic
Brazil Largest regional opportunity EV adoption and urban charging support demand.
Chile Fast-growing EV niche Public charging corridors create high-voltage switch demand.
Colombia Urban fleet opportunity Commercial electrification supports charger installations.

Market instances

Public DC charging creates the clearest near-term market for advanced high-voltage devices. For suppliers in South America, the commercial implication is a stronger need to align product qualification, account coverage and inventory planning with the local demand mechanism rather than relying on broad global growth assumptions.

Imported charger systems dominate, so regional switch demand is mostly indirect. For suppliers in South America, the commercial implication is a stronger need to align product qualification, account coverage and inventory planning with the local demand mechanism rather than relying on broad global growth assumptions.

Lower utilization than mature EV markets can slow replacement of silicon IGBTs with higher-cost SiC in some projects. For suppliers in South America, the commercial implication is a stronger need to align product qualification, account coverage and inventory planning with the local demand mechanism rather than relying on broad global growth assumptions.

Full-report coverage for South America examines country-level demand, customer concentration, supplier positioning and the technical or commercial requirements that influence qualification. The regional view is designed to distinguish structural demand drivers from short-lived purchasing cycles and to show where market access depends on local manufacturing, distribution, standards, service capability or long-term customer relationships.

Middle East & Africa DEVELOPING

What defines the Middle East & Africa high voltage switch for car charger market?

Middle East and Africa demand is developing through Gulf EV programs, public fast charging and commercial fleets. High ambient temperature increases the value of efficient power devices that reduce cooling load. Supplier strategies therefore need to reflect local qualification practices, channel structure, end-market priorities and the availability of technically comparable alternatives rather than treating the region as a uniform extension of global demand.

Market positionDeveloping
Growth outlookStrong from smaller base
Demand profilePremium EV and infrastructure led
Market access gateUtilization and heat management
Country / subregion Role Demand logic
United Arab Emirates Premium EV market Fast-charging networks support advanced devices.
Saudi Arabia Infrastructure investment New EV and charging initiatives create future volume.
South Africa Regional EV hub Urban charging creates selected demand.

Market instances

High ambient temperature makes low semiconductor loss especially valuable because charger cooling is already heavily loaded. For suppliers in Middle East & Africa, the commercial implication is a stronger need to align product qualification, account coverage and inventory planning with the local demand mechanism rather than relying on broad global growth assumptions.

Gulf infrastructure projects can adopt high-power charging early without a large legacy installed base. For suppliers in Middle East & Africa, the commercial implication is a stronger need to align product qualification, account coverage and inventory planning with the local demand mechanism rather than relying on broad global growth assumptions.

Broader African adoption remains constrained by EV penetration and grid capacity. For suppliers in Middle East & Africa, the commercial implication is a stronger need to align product qualification, account coverage and inventory planning with the local demand mechanism rather than relying on broad global growth assumptions.

Full-report coverage for Middle East & Africa examines country-level demand, customer concentration, supplier positioning and the technical or commercial requirements that influence qualification. The regional view is designed to distinguish structural demand drivers from short-lived purchasing cycles and to show where market access depends on local manufacturing, distribution, standards, service capability or long-term customer relationships.

Competitive Landscape

Competition in the high voltage switch for car charger market is determined by technical qualification, manufacturing consistency, customer relationships and the ability to support product lifecycles. Price matters, but it rarely overrides reliability, integration effort or switching cost once a supplier has been designed into a production platform.

The competitive field includes STMicroelectronics, Infineon Technologies, Diodes Incorporated, ROHM, Renesas Electronics, Fuji Electric, alongside other specialized suppliers. Market share can shift when a vendor gains access to a new platform, expands qualified capacity or introduces a technology that materially improves system performance. Because customer validation can be lengthy, incumbent suppliers often benefit from continuity, while challengers need a clear technical or supply-chain advantage to displace an approved source.

Competitive strategy is increasingly multi-dimensional. Leading suppliers invest in process or product development, application engineering and regional support at the same time, while customers seek second-source options where technically feasible. This creates a market in which differentiation is sustained through documented performance, manufacturing yield, quality systems, responsiveness and the ability to support future roadmap transitions without forcing unnecessary redesigns.

Company Competitive position Primary basis of competition
STMicroelectronics Established global / strategic supplier Competes through product capability, qualification, account access and supply execution.
Infineon Technologies Established global / strategic supplier Competes through product capability, qualification, account access and supply execution.
Diodes Incorporated Established global / strategic supplier Competes through product capability, qualification, account access and supply execution.
ROHM Specialist / regional competitor Competes through product capability, qualification, account access and supply execution.
Renesas Electronics Specialist / regional competitor Competes through product capability, qualification, account access and supply execution.
Fuji Electric Specialist / regional competitor Competes through product capability, qualification, account access and supply execution.
Texas Instruments Focused challenger / niche participant Competes through product capability, qualification, account access and supply execution.
Microchip Technology Focused challenger / niche participant Competes through product capability, qualification, account access and supply execution.
onsemi Focused challenger / niche participant Competes through product capability, qualification, account access and supply execution.
Toshiba Focused challenger / niche participant Competes through product capability, qualification, account access and supply execution.

Production Capacity Analysis

Supply capacity depends on SiC substrate and epitaxy, device fabs, module packaging and automotive or industrial qualification. Demand can rise faster than qualified upstream materials because high-voltage SiC needs low-defect wafers and specialized packaging.

Asia, Europe and North America all host important power-device suppliers. Effective supply is moving toward 200mm SiC and higher-integration modules, which can lower cost per switch as yield and packaging scale improve.

Capacity should therefore be evaluated on a qualified-output basis rather than as nominal installed capability. A supplier may possess equipment or production lines that appear suitable but still require customer-specific validation, process tuning, test correlation or upstream material qualification. This distinction becomes especially important during demand spikes, when headline capacity can overstate the volume that is immediately available for a particular application, technology generation or reliability class.

Market Dynamics

The high voltage switch for car charger market is being shaped by rising performance requirements and technology transitions on the demand side, while qualification complexity, supply concentration and cost discipline constrain the pace of adoption. The balance of these forces favors suppliers that can solve a measurable system problem without increasing integration risk.

Demand expansion is not uniform across all product variants or customer groups. New technology creates attractive design opportunities, but buyers typically require a clear economic or performance case before changing a qualified architecture. At the same time, supply-chain localization, capacity investment and tighter quality requirements are changing procurement behavior. As a result, growth is likely to concentrate around applications where performance upgrades, manufacturing scale and lifecycle value reinforce one another.

Market Drivers

Four forces provide the strongest support for demand in the high voltage switch for car charger market: performance-driven technology upgrades, expansion of relevant downstream applications, investment in manufacturing or infrastructure, and the need for more resilient supply. Their importance varies by segment, but each creates a direct reason for customers to qualify or purchase additional solutions.

Driver Impact Commercial mechanism
800V EV platforms favor 1200V switches High Higher battery voltage reduces current but requires high-voltage devices with strong switching efficiency.
DC fast charging is moving to higher power High Ultra-fast chargers increase current, thermal stress and the economic value of SiC efficiency.
SiC reduces system size and cooling Medium-High Lower switching loss permits smaller magnetics and heat sinks.
Bidirectional charging adds switching content Medium-High V2G and V2H architectures require power conversion in both directions and more sophisticated control.

800V EV platforms favor 1200V switches

Higher battery voltage reduces current but requires high-voltage devices with strong switching efficiency. The commercial effect is strongest where customers can link the technology change to higher throughput, lower power, improved reliability, reduced lifecycle cost or access to a new end-market requirement.

DC fast charging is moving to higher power

Ultra-fast chargers increase current, thermal stress and the economic value of SiC efficiency. The commercial effect is strongest where customers can link the technology change to higher throughput, lower power, improved reliability, reduced lifecycle cost or access to a new end-market requirement.

SiC reduces system size and cooling

Lower switching loss permits smaller magnetics and heat sinks. The commercial effect is strongest where customers can link the technology change to higher throughput, lower power, improved reliability, reduced lifecycle cost or access to a new end-market requirement.

Bidirectional charging adds switching content

V2G and V2H architectures require power conversion in both directions and more sophisticated control. The commercial effect is strongest where customers can link the technology change to higher throughput, lower power, improved reliability, reduced lifecycle cost or access to a new end-market requirement.

Market Restraints

Growth is moderated by qualification burden, cyclical purchasing, technology substitution and supply-chain risk. These restraints do not eliminate demand, but they can extend sales cycles, limit supplier switching and reduce the speed at which technically superior solutions convert into production revenue.

Restraint Impact Commercial consequence
SiC devices remain more expensive than silicon High Higher device cost can delay adoption in lower-power or price-sensitive chargers.
High-voltage design requires careful insulation High Creepage, clearance, EMC and thermal layout become harder as voltage and switching speed rise.
Charging infrastructure growth depends on utilization Medium Low station utilization can slow investment in premium high-power hardware.
Wide-bandgap supply is still concentrated Medium Substrate, epitaxy and qualified module capacity remain less diversified than mature silicon.

SiC devices remain more expensive than silicon

Higher device cost can delay adoption in lower-power or price-sensitive chargers. Suppliers can mitigate part of this pressure through stronger qualification support, transparent lifecycle planning, dual-source strategies and better alignment between product roadmaps and customer production schedules.

High-voltage design requires careful insulation

Creepage, clearance, EMC and thermal layout become harder as voltage and switching speed rise. Suppliers can mitigate part of this pressure through stronger qualification support, transparent lifecycle planning, dual-source strategies and better alignment between product roadmaps and customer production schedules.

Charging infrastructure growth depends on utilization

Low station utilization can slow investment in premium high-power hardware. Suppliers can mitigate part of this pressure through stronger qualification support, transparent lifecycle planning, dual-source strategies and better alignment between product roadmaps and customer production schedules.

Wide-bandgap supply is still concentrated

Substrate, epitaxy and qualified module capacity remain less diversified than mature silicon. Suppliers can mitigate part of this pressure through stronger qualification support, transparent lifecycle planning, dual-source strategies and better alignment between product roadmaps and customer production schedules.

Market Opportunities

The most attractive opportunities in the high voltage switch for car charger market occur where a technology transition creates measurable value and where suppliers can enter before the customer architecture is locked. Early engagement, application-specific engineering and credible supply planning can convert these windows into durable design positions.

Megawatt charging

Heavy-duty vehicles will require very high-power conversion with low loss and robust thermal design. The opportunity is strongest for suppliers that can demonstrate performance with production-relevant data, provide engineering support during qualification and maintain a roadmap that gives customers confidence in long-term availability.

Top-side-cooled SiC packages

Improved thermal paths can simplify compact charger assembly. The opportunity is strongest for suppliers that can demonstrate performance with production-relevant data, provide engineering support during qualification and maintain a roadmap that gives customers confidence in long-term availability.

Integrated SiC modules

Half-bridge and multi-switch modules reduce parasitic inductance and accelerate system design. The opportunity is strongest for suppliers that can demonstrate performance with production-relevant data, provide engineering support during qualification and maintain a roadmap that gives customers confidence in long-term availability.

Bidirectional home chargers

V2H and V2G expand the number and complexity of power-conversion stages. The opportunity is strongest for suppliers that can demonstrate performance with production-relevant data, provide engineering support during qualification and maintain a roadmap that gives customers confidence in long-term availability.

Supply Chain Analysis

Stage 1
SiC, silicon and GaN wafers
Stage 2
Power-device fabrication
Stage 3
Discrete and module packaging
Stage 4
Charger integration

SiC, silicon and GaN wafers

Wide-bandgap and silicon substrates provide the semiconductor starting materials. Value capture at this stage depends on quality consistency, technical differentiation and the difficulty of substitution. Bottlenecks can propagate downstream when qualification or material compatibility prevents customers from shifting quickly to an alternative supplier.

Power-device fabrication

MOSFETs, IGBTs and related high-voltage switches are manufactured and electrically screened. Value capture at this stage depends on quality consistency, technical differentiation and the difficulty of substitution. Bottlenecks can propagate downstream when qualification or material compatibility prevents customers from shifting quickly to an alternative supplier.

Discrete and module packaging

Devices are packaged for low inductance, thermal performance and high-voltage isolation. Value capture at this stage depends on quality consistency, technical differentiation and the difficulty of substitution. Bottlenecks can propagate downstream when qualification or material compatibility prevents customers from shifting quickly to an alternative supplier.

Charger integration

Power stages are assembled into onboard chargers, DC/DC converters and off-board fast chargers. Value capture at this stage depends on quality consistency, technical differentiation and the difficulty of substitution. Bottlenecks can propagate downstream when qualification or material compatibility prevents customers from shifting quickly to an alternative supplier.

Recent Developments

Recent developments show how technology roadmaps, manufacturing investment and standards are changing the competitive requirements of the high voltage switch for car charger market. The entries below are selected for their direct relevance to product capability, capacity, qualification or downstream adoption rather than for general corporate activity.

January 2025 · Infineon Technologies

FORVIA HELLA selected Infineon 1200V CoolSiC automotive MOSFETs for its next-generation 800V DC/DC charging solution, citing top-side cooling and lower parasitic effects. Source

July 2025 · Infineon Technologies

Infineon launched 1200V CoolSiC G2 MOSFETs in Q-DPAK for EV chargers and other high-power systems, with up to 25% lower switching losses at equivalent on-resistance versus the prior generation. Source

2025 · STMicroelectronics

ST’s automotive-grade 1200V Gen3 SiC MOSFET portfolio includes devices explicitly targeted at on-board chargers and DC/DC converters, reinforcing the industry shift toward SiC at high vehicle voltage. Source

Report Scope & Segmentation

Report attribute Coverage
Market High Voltage Switch for Car Charger
Base Year 2025
Estimated Year 2026
Forecast Period 2026–2034
2025 Market Size USD 74.7 million
2026 Estimated Size USD 92.3 million
2034 Forecast Size USD 499.2 million
CAGR (2026–2034) 23.5%
Largest Market in 2025 Asia Pacific
By Type One-phase, Three-phase
By Application HEV, EV
By Device Technology Silicon IGBT, SiC MOSFET, GaN Power Device
By Charger Location On-board Charger, Off-board DC Fast Charger
Companies Profiled STMicroelectronics, Infineon Technologies, Diodes Incorporated, ROHM, Renesas Electronics, Fuji Electric, Texas Instruments, Microchip Technology, onsemi, Toshiba

Frequently Asked Questions

What was the high voltage switch for car charger market size in 2025?

The global high voltage switch for car charger market was valued at USD 74.7 million in 2025. The 2025 value is the base-year reference used throughout this overview and provides the starting point for comparing the 2026 estimate and the 2034 forecast.

What is the projected high voltage switch for car charger market size in 2034?

The global market is projected to reach USD 499.2 million by 2034. The forecast reflects the interaction of downstream adoption, technology transitions, production investment and the qualification requirements that shape commercial conversion across the market.

What is the CAGR of the high voltage switch for car charger market from 2026 to 2034?

The high voltage switch for car charger market is expected to expand at a 23.5% CAGR during 2026–2034. Growth will not be uniform across every product or region because customer qualification, capital cycles, supply constraints and application-specific performance requirements differ materially.

Which region is the largest high voltage switch for car charger market?

Asia Pacific is the largest regional market in 2025. Its position is supported by the concentration of relevant manufacturing, customers, technology ecosystems and downstream demand, although the precise commercial mechanism differs by country and application.

How is the high voltage switch for car charger market segmented by type?

By type, the market is segmented into One-phase, Three-phase. These categories address different performance, cost and integration requirements, so supplier selection depends on application fit, qualification history and lifecycle economics rather than a single specification.

What are the main applications for high voltage switch for car charger?

By application, the market covers HEV, EV. Demand in each application is linked to platform launches, capacity expansion, equipment replacement and the degree to which the technology improves system performance or manufacturing economics.

What are the principal growth drivers for the high voltage switch for car charger market?

Key drivers include 800v ev platforms favor 1200v switches and dc fast charging is moving to higher power. These forces increase demand when customers can translate technical improvements into higher performance, lower cost, greater reliability or access to new applications.

What are the main restraints in the high voltage switch for car charger market?

Important restraints include sic devices remain more expensive than silicon and high-voltage design requires careful insulation. The resulting qualification burden, purchasing cyclicality and technology risk can extend sales cycles and limit rapid supplier substitution even when new solutions offer clear technical advantages.

Which companies participate in the high voltage switch for car charger market?

Companies profiled in this market include STMicroelectronics, Infineon Technologies, Diodes Incorporated, ROHM, Renesas Electronics, Fuji Electric, Texas Instruments, Microchip Technology. Competition centers on qualification, product or process performance, manufacturing consistency, customer support and the ability to maintain supply across the required product lifecycle.

What should buyers evaluate when selecting a high voltage switch for car charger supplier?

Buyers should evaluate demonstrated performance, qualification history, manufacturing consistency, lifecycle support, supply resilience and integration cost. A technically strong product can still face adoption barriers if it increases redesign risk, lacks regional support or cannot meet the customer’s production and quality requirements.

Research Sources & Evidence Base

View research sources used for this overview.
  1. Infineon Technologies. DC EV Charging with CoolSiC — 1200V SiC use at 800V DC link and charger efficiency advantages.
  2. Infineon Technologies. FORVIA HELLA 800V charging design — 2025 automotive 1200V SiC design win.
  3. Infineon Technologies. 1200V CoolSiC G2 Q-DPAK — 2025 switching-loss and thermal-performance improvements for EV charging.
  4. STMicroelectronics. 1200V automotive SiC MOSFET — AEC-Q101 device targeted at OBC and EV/HEV DC/DC conversion.
High Voltage Switch for Car Charger Market Size, Share & Industry Analysis, By Type (One-phase, Three-phase), By Application (HEV, EV), By Device Technology (Silicon IGBT, SiC MOSFET, GaN Power Device), By Charger Location (On-board Charger, Off-board DC Fast Charger), and Regional Forecast, 2026-2034

Get Sample Report PDF for Exclusive Insights

Report Sample Includes

  • Table of Contents
  • List of Tables & Figures
  • Charts, Research Methodology, and more...

PDF Icon Download Sample Report PDF

Download Sample Report

Table of Content

Table of Contents
1 Research Methodology and Statistical Scope
1.1 Market Definition and Statistical Scope of High Voltage Switch for Car Charger
1.2 Key Market Segments
1.2.1 High Voltage Switch for Car Charger Segment by Type
1.2.2 High Voltage Switch for Car Charger Segment by Application
1.3 Methodology & Sources of Information
1.3.1 Research Methodology
1.3.2 Research Process
1.3.3 Market Breakdown and Data Triangulation
1.3.4 Base Year
1.3.5 Report Assumptions & Caveats
2 High Voltage Switch for Car Charger Market Overview
2.1 Global Market Overview
2.1.1 Global High Voltage Switch for Car Charger Market Size (M USD) Estimates and Forecasts (2019-2032)
2.1.2 Global High Voltage Switch for Car Charger Sales Estimates and Forecasts (2019-2032)
2.2 Market Segment Executive Summary
2.3 Global Market Size by Region
3 High Voltage Switch for Car Charger Market Competitive Landscape
3.1 Global High Voltage Switch for Car Charger Sales by Manufacturers (2019-2025)
3.2 Global High Voltage Switch for Car Charger Revenue Market Share by Manufacturers (2019-2025)
3.3 High Voltage Switch for Car Charger Market Share by Company Type (Tier 1, Tier 2, and Tier 3)
3.4 Global High Voltage Switch for Car Charger Average Price by Manufacturers (2019-2025)
3.5 Manufacturers High Voltage Switch for Car Charger Sales Sites, Area Served, Product Type
3.6 High Voltage Switch for Car Charger Market Competitive Situation and Trends
3.6.1 High Voltage Switch for Car Charger Market Concentration Rate
3.6.2 Global 5 and 10 Largest High Voltage Switch for Car Charger Players Market Share by Revenue
3.6.3 Mergers & Acquisitions, Expansion
4 High Voltage Switch for Car Charger Industry Chain Analysis
4.1 High Voltage Switch for Car Charger Industry Chain Analysis
4.2 Market Overview of Key Raw Materials
4.3 Midstream Market Analysis
4.4 Downstream Customer Analysis
5 The Development and Dynamics of High Voltage Switch for Car Charger Market
5.1 Key Development Trends
5.2 Driving Factors
5.3 Market Challenges
5.4 Market Restraints
5.5 Industry News
5.5.1 New Product Developments
5.5.2 Mergers & Acquisitions
5.5.3 Expansions
5.5.4 Collaboration/Supply Contracts
5.6 Industry Policies
6 High Voltage Switch for Car Charger Market Segmentation by Type
6.1 Evaluation Matrix of Segment Market Development Potential (Type)
6.2 Global High Voltage Switch for Car Charger Sales Market Share by Type (2019-2025)
6.3 Global High Voltage Switch for Car Charger Market Size Market Share by Type (2019-2025)
6.4 Global High Voltage Switch for Car Charger Price by Type (2019-2025)
7 High Voltage Switch for Car Charger Market Segmentation by Application
7.1 Evaluation Matrix of Segment Market Development Potential (Application)
7.2 Global High Voltage Switch for Car Charger Market Sales by Application (2019-2025)
7.3 Global High Voltage Switch for Car Charger Market Size (M USD) by Application (2019-2025)
7.4 Global High Voltage Switch for Car Charger Sales Growth Rate by Application (2019-2025)
8 High Voltage Switch for Car Charger Market Consumption by Region
8.1 Global High Voltage Switch for Car Charger Sales by Region
8.1.1 Global High Voltage Switch for Car Charger Sales by Region
8.1.2 Global High Voltage Switch for Car Charger Sales Market Share by Region
8.2 North America
8.2.1 North America High Voltage Switch for Car Charger Sales by Country
8.2.2 U.S.
8.2.3 Canada
8.2.4 Mexico
8.3 Europe
8.3.1 Europe High Voltage Switch for Car Charger Sales by Country
8.3.2 Germany
8.3.3 France
8.3.4 U.K.
8.3.5 Italy
8.3.6 Russia
8.4 Asia Pacific
8.4.1 Asia Pacific High Voltage Switch for Car Charger Sales by Region
8.4.2 China
8.4.3 Japan
8.4.4 South Korea
8.4.5 India
8.4.6 Southeast Asia
8.5 South America
8.5.1 South America High Voltage Switch for Car Charger Sales by Country
8.5.2 Brazil
8.5.3 Argentina
8.5.4 Columbia
8.6 Middle East and Africa
8.6.1 Middle East and Africa High Voltage Switch for Car Charger Sales by Region
8.6.2 Saudi Arabia
8.6.3 UAE
8.6.4 Egypt
8.6.5 Nigeria
8.6.6 South Africa
9 High Voltage Switch for Car Charger Market Production by Region
9.1 Global Production of High Voltage Switch for Car Charger by Region (2019-2025)
9.2 Global High Voltage Switch for Car Charger Revenue Market Share by Region (2019-2025)
9.3 Global High Voltage Switch for Car Charger Production, Revenue, Price and Gross Margin (2019-2025)
9.4 North America High Voltage Switch for Car Charger Production
9.4.1 North America High Voltage Switch for Car Charger Production Growth Rate (2019-2025)
9.4.2 North America High Voltage Switch for Car Charger Production, Revenue, Price and Gross Margin (2019-2025)
9.5 Europe High Voltage Switch for Car Charger Production
9.5.1 Europe High Voltage Switch for Car Charger Production Growth Rate (2019-2025)
9.5.2 Europe High Voltage Switch for Car Charger Production, Revenue, Price and Gross Margin (2019-2025)
9.6 Japan High Voltage Switch for Car Charger Production (2019-2025)
9.6.1 Japan High Voltage Switch for Car Charger Production Growth Rate (2019-2025)
9.6.2 Japan High Voltage Switch for Car Charger Production, Revenue, Price and Gross Margin (2019-2025)
9.7 China High Voltage Switch for Car Charger Production (2019-2025)
9.7.1 China High Voltage Switch for Car Charger Production Growth Rate (2019-2025)
9.7.2 China High Voltage Switch for Car Charger Production, Revenue, Price and Gross Margin (2019-2025)
10 Key Companies Profile
10.1 STMicroelectronics
10.1.1 STMicroelectronics High Voltage Switch for Car Charger Basic Information
10.1.2 STMicroelectronics High Voltage Switch for Car Charger Product Overview
10.1.3 STMicroelectronics High Voltage Switch for Car Charger Product Market Performance
10.1.4 STMicroelectronics Business Overview
10.1.5 STMicroelectronics High Voltage Switch for Car Charger SWOT Analysis
10.1.6 STMicroelectronics Recent Developments
10.2 Infineon
10.2.1 Infineon High Voltage Switch for Car Charger Basic Information
10.2.2 Infineon High Voltage Switch for Car Charger Product Overview
10.2.3 Infineon High Voltage Switch for Car Charger Product Market Performance
10.2.4 Infineon Business Overview
10.2.5 Infineon High Voltage Switch for Car Charger SWOT Analysis
10.2.6 Infineon Recent Developments
10.3 Diodes lncorporated
10.3.1 Diodes lncorporated High Voltage Switch for Car Charger Basic Information
10.3.2 Diodes lncorporated High Voltage Switch for Car Charger Product Overview
10.3.3 Diodes lncorporated High Voltage Switch for Car Charger Product Market Performance
10.3.4 Diodes lncorporated High Voltage Switch for Car Charger SWOT Analysis
10.3.5 Diodes lncorporated Business Overview
10.3.6 Diodes lncorporated Recent Developments
10.4 ROHM
10.4.1 ROHM High Voltage Switch for Car Charger Basic Information
10.4.2 ROHM High Voltage Switch for Car Charger Product Overview
10.4.3 ROHM High Voltage Switch for Car Charger Product Market Performance
10.4.4 ROHM Business Overview
10.4.5 ROHM Recent Developments
10.5 Renesas
10.5.1 Renesas High Voltage Switch for Car Charger Basic Information
10.5.2 Renesas High Voltage Switch for Car Charger Product Overview
10.5.3 Renesas High Voltage Switch for Car Charger Product Market Performance
10.5.4 Renesas Business Overview
10.5.5 Renesas Recent Developments
10.6 Fuji Electric
10.6.1 Fuji Electric High Voltage Switch for Car Charger Basic Information
10.6.2 Fuji Electric High Voltage Switch for Car Charger Product Overview
10.6.3 Fuji Electric High Voltage Switch for Car Charger Product Market Performance
10.6.4 Fuji Electric Business Overview
10.6.5 Fuji Electric Recent Developments
10.7 Texas Instruments
10.7.1 Texas Instruments High Voltage Switch for Car Charger Basic Information
10.7.2 Texas Instruments High Voltage Switch for Car Charger Product Overview
10.7.3 Texas Instruments High Voltage Switch for Car Charger Product Market Performance
10.7.4 Texas Instruments Business Overview
10.7.5 Texas Instruments Recent Developments
10.8 Microchip
10.8.1 Microchip High Voltage Switch for Car Charger Basic Information
10.8.2 Microchip High Voltage Switch for Car Charger Product Overview
10.8.3 Microchip High Voltage Switch for Car Charger Product Market Performance
10.8.4 Microchip Business Overview
10.8.5 Microchip Recent Developments
10.9 onsemi
10.9.1 onsemi High Voltage Switch for Car Charger Basic Information
10.9.2 onsemi High Voltage Switch for Car Charger Product Overview
10.9.3 onsemi High Voltage Switch for Car Charger Product Market Performance
10.9.4 onsemi Business Overview
10.9.5 onsemi Recent Developments
10.10 Toshiba
10.10.1 Toshiba High Voltage Switch for Car Charger Basic Information
10.10.2 Toshiba High Voltage Switch for Car Charger Product Overview
10.10.3 Toshiba High Voltage Switch for Car Charger Product Market Performance
10.10.4 Toshiba Business Overview
10.10.5 Toshiba Recent Developments
11 High Voltage Switch for Car Charger Market Forecast by Region
11.1 Global High Voltage Switch for Car Charger Market Size Forecast
11.2 Global High Voltage Switch for Car Charger Market Forecast by Region
11.2.1 North America Market Size Forecast by Country
11.2.2 Europe High Voltage Switch for Car Charger Market Size Forecast by Country
11.2.3 Asia Pacific High Voltage Switch for Car Charger Market Size Forecast by Region
11.2.4 South America High Voltage Switch for Car Charger Market Size Forecast by Country
11.2.5 Middle East and Africa Forecasted Consumption of High Voltage Switch for Car Charger by Country
12 Forecast Market by Type and by Application (2025-2032)
12.1 Global High Voltage Switch for Car Charger Market Forecast by Type (2025-2032)
12.1.1 Global Forecasted Sales of High Voltage Switch for Car Charger by Type (2025-2032)
12.1.2 Global High Voltage Switch for Car Charger Market Size Forecast by Type (2025-2032)
12.1.3 Global Forecasted Price of High Voltage Switch for Car Charger by Type (2025-2032)
12.2 Global High Voltage Switch for Car Charger Market Forecast by Application (2025-2032)
12.2.1 Global High Voltage Switch for Car Charger Sales (K Units) Forecast by Application
12.2.2 Global High Voltage Switch for Car Charger Market Size (M USD) Forecast by Application (2025-2032)
13 Conclusion and Key FindingsList of Tables
Table 1. Introduction of the Type
Table 2. Introduction of the Application
Table 3. Market Size (M USD) Segment Executive Summary
Table 4. High Voltage Switch for Car Charger Market Size Comparison by Region (M USD)
Table 5. Global High Voltage Switch for Car Charger Sales (K Units) by Manufacturers (2019-2025)
Table 6. Global High Voltage Switch for Car Charger Sales Market Share by Manufacturers (2019-2025)
Table 7. Global High Voltage Switch for Car Charger Revenue (M USD) by Manufacturers (2019-2025)
Table 8. Global High Voltage Switch for Car Charger Revenue Share by Manufacturers (2019-2025)
Table 9. Company Type (Tier 1, Tier 2, and Tier 3) & (based on the Revenue in High Voltage Switch for Car Charger as of 2022)
Table 10. Global Market High Voltage Switch for Car Charger Average Price (USD/Unit) of Key Manufacturers (2019-2025)
Table 11. Manufacturers High Voltage Switch for Car Charger Sales Sites and Area Served
Table 12. Manufacturers High Voltage Switch for Car Charger Product Type
Table 13. Global High Voltage Switch for Car Charger Manufacturers Market Concentration Ratio (CR5 and HHI)
Table 14. Mergers & Acquisitions, Expansion Plans
Table 15. Industry Chain Map of High Voltage Switch for Car Charger
Table 16. Market Overview of Key Raw Materials
Table 17. Midstream Market Analysis
Table 18. Downstream Customer Analysis
Table 19. Key Development Trends
Table 20. Driving Factors
Table 21. High Voltage Switch for Car Charger Market Challenges
Table 22. Global High Voltage Switch for Car Charger Sales by Type (K Units)
Table 23. Global High Voltage Switch for Car Charger Market Size by Type (M USD)
Table 24. Global High Voltage Switch for Car Charger Sales (K Units) by Type (2019-2025)
Table 25. Global High Voltage Switch for Car Charger Sales Market Share by Type (2019-2025)
Table 26. Global High Voltage Switch for Car Charger Market Size (M USD) by Type (2019-2025)
Table 27. Global High Voltage Switch for Car Charger Market Size Share by Type (2019-2025)
Table 28. Global High Voltage Switch for Car Charger Price (USD/Unit) by Type (2019-2025)
Table 29. Global High Voltage Switch for Car Charger Sales (K Units) by Application
Table 30. Global High Voltage Switch for Car Charger Market Size by Application
Table 31. Global High Voltage Switch for Car Charger Sales by Application (2019-2025) & (K Units)
Table 32. Global High Voltage Switch for Car Charger Sales Market Share by Application (2019-2025)
Table 33. Global High Voltage Switch for Car Charger Sales by Application (2019-2025) & (M USD)
Table 34. Global High Voltage Switch for Car Charger Market Share by Application (2019-2025)
Table 35. Global High Voltage Switch for Car Charger Sales Growth Rate by Application (2019-2025)
Table 36. Global High Voltage Switch for Car Charger Sales by Region (2019-2025) & (K Units)
Table 37. Global High Voltage Switch for Car Charger Sales Market Share by Region (2019-2025)
Table 38. North America High Voltage Switch for Car Charger Sales by Country (2019-2025) & (K Units)
Table 39. Europe High Voltage Switch for Car Charger Sales by Country (2019-2025) & (K Units)
Table 40. Asia Pacific High Voltage Switch for Car Charger Sales by Region (2019-2025) & (K Units)
Table 41. South America High Voltage Switch for Car Charger Sales by Country (2019-2025) & (K Units)
Table 42. Middle East and Africa High Voltage Switch for Car Charger Sales by Region (2019-2025) & (K Units)
Table 43. Global High Voltage Switch for Car Charger Production (K Units) by Region (2019-2025)
Table 44. Global High Voltage Switch for Car Charger Revenue (US$ Million) by Region (2019-2025)
Table 45. Global High Voltage Switch for Car Charger Revenue Market Share by Region (2019-2025)
Table 46. Global High Voltage Switch for Car Charger Production (K Units), Revenue (US$ Million), Price (USD/Unit) and Gross Margin (2019-2025)
Table 47. North America High Voltage Switch for Car Charger Production (K Units), Revenue (US$ Million), Price (USD/Unit) and Gross Margin (2019-2025)
Table 48. Europe High Voltage Switch for Car Charger Production (K Units), Revenue (US$ Million), Price (USD/Unit) and Gross Margin (2019-2025)
Table 49. Japan High Voltage Switch for Car Charger Production (K Units), Revenue (US$ Million), Price (USD/Unit) and Gross Margin (2019-2025)
Table 50. China High Voltage Switch for Car Charger Production (K Units), Revenue (US$ Million), Price (USD/Unit) and Gross Margin (2019-2025)
Table 51. STMicroelectronics High Voltage Switch for Car Charger Basic Information
Table 52. STMicroelectronics High Voltage Switch for Car Charger Product Overview
Table 53. STMicroelectronics High Voltage Switch for Car Charger Sales (K Units), Revenue (M USD), Price (USD/Unit) and Gross Margin (2019-2025)
Table 54. STMicroelectronics Business Overview
Table 55. STMicroelectronics High Voltage Switch for Car Charger SWOT Analysis
Table 56. STMicroelectronics Recent Developments
Table 57. Infineon High Voltage Switch for Car Charger Basic Information
Table 58. Infineon High Voltage Switch for Car Charger Product Overview
Table 59. Infineon High Voltage Switch for Car Charger Sales (K Units), Revenue (M USD), Price (USD/Unit) and Gross Margin (2019-2025)
Table 60. Infineon Business Overview
Table 61. Infineon High Voltage Switch for Car Charger SWOT Analysis
Table 62. Infineon Recent Developments
Table 63. Diodes lncorporated High Voltage Switch for Car Charger Basic Information
Table 64. Diodes lncorporated High Voltage Switch for Car Charger Product Overview
Table 65. Diodes lncorporated High Voltage Switch for Car Charger Sales (K Units), Revenue (M USD), Price (USD/Unit) and Gross Margin (2019-2025)
Table 66. Diodes lncorporated High Voltage Switch for Car Charger SWOT Analysis
Table 67. Diodes lncorporated Business Overview
Table 68. Diodes lncorporated Recent Developments
Table 69. ROHM High Voltage Switch for Car Charger Basic Information
Table 70. ROHM High Voltage Switch for Car Charger Product Overview
Table 71. ROHM High Voltage Switch for Car Charger Sales (K Units), Revenue (M USD), Price (USD/Unit) and Gross Margin (2019-2025)
Table 72. ROHM Business Overview
Table 73. ROHM Recent Developments
Table 74. Renesas High Voltage Switch for Car Charger Basic Information
Table 75. Renesas High Voltage Switch for Car Charger Product Overview
Table 76. Renesas High Voltage Switch for Car Charger Sales (K Units), Revenue (M USD), Price (USD/Unit) and Gross Margin (2019-2025)
Table 77. Renesas Business Overview
Table 78. Renesas Recent Developments
Table 79. Fuji Electric High Voltage Switch for Car Charger Basic Information
Table 80. Fuji Electric High Voltage Switch for Car Charger Product Overview
Table 81. Fuji Electric High Voltage Switch for Car Charger Sales (K Units), Revenue (M USD), Price (USD/Unit) and Gross Margin (2019-2025)
Table 82. Fuji Electric Business Overview
Table 83. Fuji Electric Recent Developments
Table 84. Texas Instruments High Voltage Switch for Car Charger Basic Information
Table 85. Texas Instruments High Voltage Switch for Car Charger Product Overview
Table 86. Texas Instruments High Voltage Switch for Car Charger Sales (K Units), Revenue (M USD), Price (USD/Unit) and Gross Margin (2019-2025)
Table 87. Texas Instruments Business Overview
Table 88. Texas Instruments Recent Developments
Table 89. Microchip High Voltage Switch for Car Charger Basic Information
Table 90. Microchip High Voltage Switch for Car Charger Product Overview
Table 91. Microchip High Voltage Switch for Car Charger Sales (K Units), Revenue (M USD), Price (USD/Unit) and Gross Margin (2019-2025)
Table 92. Microchip Business Overview
Table 93. Microchip Recent Developments
Table 94. onsemi High Voltage Switch for Car Charger Basic Information
Table 95. onsemi High Voltage Switch for Car Charger Product Overview
Table 96. onsemi High Voltage Switch for Car Charger Sales (K Units), Revenue (M USD), Price (USD/Unit) and Gross Margin (2019-2025)
Table 97. onsemi Business Overview
Table 98. onsemi Recent Developments
Table 99. Toshiba High Voltage Switch for Car Charger Basic Information
Table 100. Toshiba High Voltage Switch for Car Charger Product Overview
Table 101. Toshiba High Voltage Switch for Car Charger Sales (K Units), Revenue (M USD), Price (USD/Unit) and Gross Margin (2019-2025)
Table 102. Toshiba Business Overview
Table 103. Toshiba Recent Developments
Table 104. Global High Voltage Switch for Car Charger Sales Forecast by Region (2025-2032) & (K Units)
Table 105. Global High Voltage Switch for Car Charger Market Size Forecast by Region (2025-2032) & (M USD)
Table 106. North America High Voltage Switch for Car Charger Sales Forecast by Country (2025-2032) & (K Units)
Table 107. North America High Voltage Switch for Car Charger Market Size Forecast by Country (2025-2032) & (M USD)
Table 108. Europe High Voltage Switch for Car Charger Sales Forecast by Country (2025-2032) & (K Units)
Table 109. Europe High Voltage Switch for Car Charger Market Size Forecast by Country (2025-2032) & (M USD)
Table 110. Asia Pacific High Voltage Switch for Car Charger Sales Forecast by Region (2025-2032) & (K Units)
Table 111. Asia Pacific High Voltage Switch for Car Charger Market Size Forecast by Region (2025-2032) & (M USD)
Table 112. South America High Voltage Switch for Car Charger Sales Forecast by Country (2025-2032) & (K Units)
Table 113. South America High Voltage Switch for Car Charger Market Size Forecast by Country (2025-2032) & (M USD)
Table 114. Middle East and Africa High Voltage Switch for Car Charger Consumption Forecast by Country (2025-2032) & (Units)
Table 115. Middle East and Africa High Voltage Switch for Car Charger Market Size Forecast by Country (2025-2032) & (M USD)
Table 116. Global High Voltage Switch for Car Charger Sales Forecast by Type (2025-2032) & (K Units)
Table 117. Global High Voltage Switch for Car Charger Market Size Forecast by Type (2025-2032) & (M USD)
Table 118. Global High Voltage Switch for Car Charger Price Forecast by Type (2025-2032) & (USD/Unit)
Table 119. Global High Voltage Switch for Car Charger Sales (K Units) Forecast by Application (2025-2032)
Table 120. Global High Voltage Switch for Car Charger Market Size Forecast by Application (2025-2032) & (M USD)
List of Figures
Figure 1. Product Picture of High Voltage Switch for Car Charger
Figure 2. Data Triangulation
Figure 3. Key Caveats
Figure 4. Global High Voltage Switch for Car Charger Market Size (M USD), 2019-2032
Figure 5. Global High Voltage Switch for Car Charger Market Size (M USD) (2019-2032)
Figure 6. Global High Voltage Switch for Car Charger Sales (K Units) & (2019-2032)
Figure 7. Evaluation Matrix of Segment Market Development Potential (Type)
Figure 8. Evaluation Matrix of Segment Market Development Potential (Application)
Figure 9. Evaluation Matrix of Regional Market Development Potential
Figure 10. High Voltage Switch for Car Charger Market Size by Country (M USD)
Figure 11. High Voltage Switch for Car Charger Sales Share by Manufacturers in 2023
Figure 12. Global High Voltage Switch for Car Charger Revenue Share by Manufacturers in 2023
Figure 13. High Voltage Switch for Car Charger Market Share by Company Type (Tier 1, Tier 2 and Tier 3): 2023
Figure 14. Global Market High Voltage Switch for Car Charger Average Price (USD/Unit) of Key Manufacturers in 2023
Figure 15. The Global 5 and 10 Largest Players: Market Share by High Voltage Switch for Car Charger Revenue in 2023
Figure 16. Evaluation Matrix of Segment Market Development Potential (Type)
Figure 17. Global High Voltage Switch for Car Charger Market Share by Type
Figure 18. Sales Market Share of High Voltage Switch for Car Charger by Type (2019-2025)
Figure 19. Sales Market Share of High Voltage Switch for Car Charger by Type in 2023
Figure 20. Market Size Share of High Voltage Switch for Car Charger by Type (2019-2025)
Figure 21. Market Size Market Share of High Voltage Switch for Car Charger by Type in 2023
Figure 22. Evaluation Matrix of Segment Market Development Potential (Application)
Figure 23. Global High Voltage Switch for Car Charger Market Share by Application
Figure 24. Global High Voltage Switch for Car Charger Sales Market Share by Application (2019-2025)
Figure 25. Global High Voltage Switch for Car Charger Sales Market Share by Application in 2023
Figure 26. Global High Voltage Switch for Car Charger Market Share by Application (2019-2025)
Figure 27. Global High Voltage Switch for Car Charger Market Share by Application in 2023
Figure 28. Global High Voltage Switch for Car Charger Sales Growth Rate by Application (2019-2025)
Figure 29. Global High Voltage Switch for Car Charger Sales Market Share by Region (2019-2025)
Figure 30. North America High Voltage Switch for Car Charger Sales and Growth Rate (2019-2025) & (K Units)
Figure 31. North America High Voltage Switch for Car Charger Sales Market Share by Country in 2023
Figure 32. U.S. High Voltage Switch for Car Charger Sales and Growth Rate (2019-2025) & (K Units)
Figure 33. Canada High Voltage Switch for Car Charger Sales (K Units) and Growth Rate (2019-2025)
Figure 34. Mexico High Voltage Switch for Car Charger Sales (Units) and Growth Rate (2019-2025)
Figure 35. Europe High Voltage Switch for Car Charger Sales and Growth Rate (2019-2025) & (K Units)
Figure 36. Europe High Voltage Switch for Car Charger Sales Market Share by Country in 2023
Figure 37. Germany High Voltage Switch for Car Charger Sales and Growth Rate (2019-2025) & (K Units)
Figure 38. France High Voltage Switch for Car Charger Sales and Growth Rate (2019-2025) & (K Units)
Figure 39. U.K. High Voltage Switch for Car Charger Sales and Growth Rate (2019-2025) & (K Units)
Figure 40. Italy High Voltage Switch for Car Charger Sales and Growth Rate (2019-2025) & (K Units)
Figure 41. Russia High Voltage Switch for Car Charger Sales and Growth Rate (2019-2025) & (K Units)
Figure 42. Asia Pacific High Voltage Switch for Car Charger Sales and Growth Rate (K Units)
Figure 43. Asia Pacific High Voltage Switch for Car Charger Sales Market Share by Region in 2023
Figure 44. China High Voltage Switch for Car Charger Sales and Growth Rate (2019-2025) & (K Units)
Figure 45. Japan High Voltage Switch for Car Charger Sales and Growth Rate (2019-2025) & (K Units)
Figure 46. South Korea High Voltage Switch for Car Charger Sales and Growth Rate (2019-2025) & (K Units)
Figure 47. India High Voltage Switch for Car Charger Sales and Growth Rate (2019-2025) & (K Units)
Figure 48. Southeast Asia High Voltage Switch for Car Charger Sales and Growth Rate (2019-2025) & (K Units)
Figure 49. South America High Voltage Switch for Car Charger Sales and Growth Rate (K Units)
Figure 50. South America High Voltage Switch for Car Charger Sales Market Share by Country in 2023
Figure 51. Brazil High Voltage Switch for Car Charger Sales and Growth Rate (2019-2025) & (K Units)
Figure 52. Argentina High Voltage Switch for Car Charger Sales and Growth Rate (2019-2025) & (K Units)
Figure 53. Columbia High Voltage Switch for Car Charger Sales and Growth Rate (2019-2025) & (K Units)
Figure 54. Middle East and Africa High Voltage Switch for Car Charger Sales and Growth Rate (K Units)
Figure 55. Middle East and Africa High Voltage Switch for Car Charger Sales Market Share by Region in 2023
Figure 56. Saudi Arabia High Voltage Switch for Car Charger Sales and Growth Rate (2019-2025) & (K Units)
Figure 57. UAE High Voltage Switch for Car Charger Sales and Growth Rate (2019-2025) & (K Units)
Figure 58. Egypt High Voltage Switch for Car Charger Sales and Growth Rate (2019-2025) & (K Units)
Figure 59. Nigeria High Voltage Switch for Car Charger Sales and Growth Rate (2019-2025) & (K Units)
Figure 60. South Africa High Voltage Switch for Car Charger Sales and Growth Rate (2019-2025) & (K Units)
Figure 61. Global High Voltage Switch for Car Charger Production Market Share by Region (2019-2025)
Figure 62. North America High Voltage Switch for Car Charger Production (K Units) Growth Rate (2019-2025)
Figure 63. Europe High Voltage Switch for Car Charger Production (K Units) Growth Rate (2019-2025)
Figure 64. Japan High Voltage Switch for Car Charger Production (K Units) Growth Rate (2019-2025)
Figure 65. China High Voltage Switch for Car Charger Production (K Units) Growth Rate (2019-2025)
Figure 66. Global High Voltage Switch for Car Charger Sales Forecast by Volume (2019-2032) & (K Units)
Figure 67. Global High Voltage Switch for Car Charger Market Size Forecast by Value (2019-2032) & (M USD)
Figure 68. Global High Voltage Switch for Car Charger Sales Market Share Forecast by Type (2025-2032)
Figure 69. Global High Voltage Switch for Car Charger Market Share Forecast by Type (2025-2032)
Figure 70. Global High Voltage Switch for Car Charger Sales Forecast by Application (2025-2032)
Figure 71. Global High Voltage Switch for Car Charger Market Share Forecast by Application (2025-2032)