SEMICONDUCTOR INSIGHT
MARKET RESEARCH REPORT

Wide Bandgap Power Semiconductor Devices and Modules Market

2026 to 2034
MARKET INTELLIGENCE
ACROSS KEY REGIONS
2026 EDITION
POWER ELECTRONICS Semiconductor Market Research

Wide Bandgap Power Semiconductor Devices and Modules Market

◷
UPDATED 26 October 2026
▤
REPORT LENGTH Detailed Report
▣
REPORT CODE 44e03507c3cd
▯
FORMATS PDF

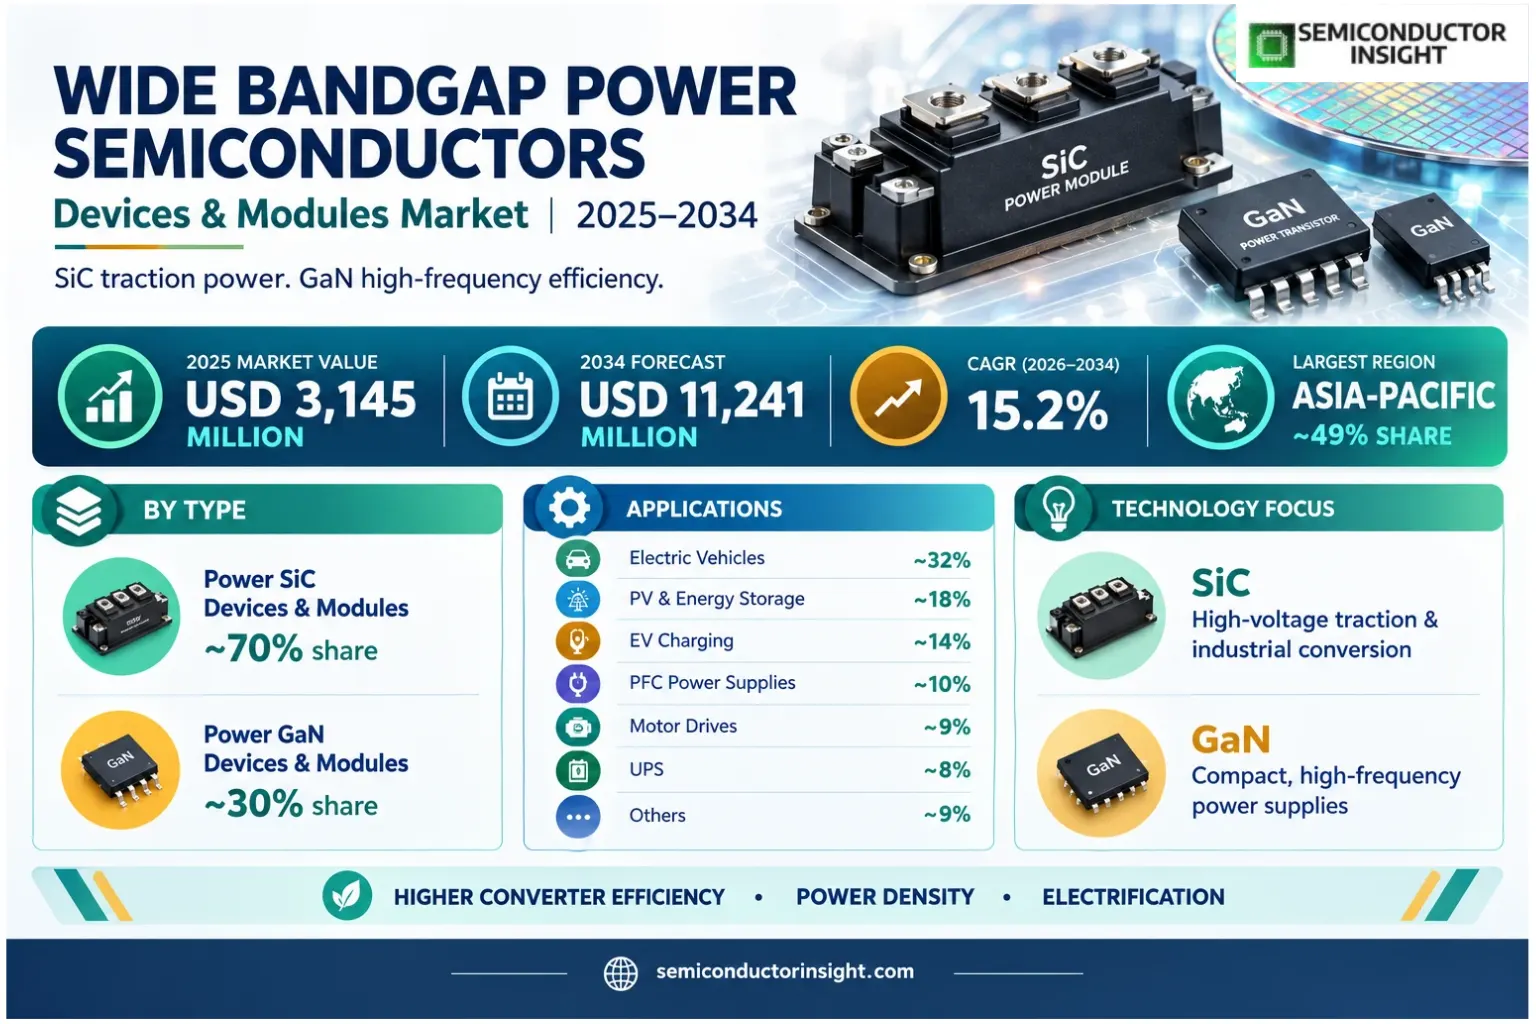
Wide bandgap power semiconductor devices and modules market was valued at USD 3,145 million in 2025 and is expected to reach USD 11,241 million by 2034, advancing at a CAGR of 15.2% over 2026–2034. Asia-Pacific is the largest demand center, with an estimated ~49% share in 2025, reflecting its unusually dense network of automotive, industrial inverter and compound-semiconductor manufacturing customers.

Get the sample PDF with study scope, segmentation and methodology details.

Key Statistics

2025 Market Size
USD 3,145 million
2034 Projected Size
USD 11,241 million
CAGR (2026–2034)
15.2%
Largest Market in 2025
Asia-Pacific (~49%)

Key Takeaways

  • Market outlook: the market reached USD 3,145 million in 2025 and is forecast at USD 11,241 million in 2034, equivalent to 15.2% growth across the 2026–2034 period. Commercial expansion depends on power-conversion efficiency and equipment qualification, not merely on total semiconductor shipments.
  • Power SiC devices and modules form the dominant type with an estimated ~70% of base-year revenue, supported by traction inverters and utility-scale converters; GaN devices and modules hold ~30% and show faster modeled growth of ~16.7% as compact supplies move toward higher switching frequencies.
  • Electric vehicles are the largest application at an estimated ~32% of 2025 sales, ahead of photovoltaic and storage systems at ~18%; vehicle makers weigh thermal cycling, inverter efficiency, available wafer capacity and package-level reliability when approving high-voltage devices.
  • Asia-Pacific accounts for an estimated ~49% of 2025 spending, with ~15.7% modeled annual growth; it combines Chinese EV production, Japanese SiC engineering and substantial electronics manufacturing in Korea, Taiwan and Southeast Asia.
  • Adoption constraints include SiC wafer costs, gate-drive redesign, automotive qualification cycles, the cost of cooling hardware and pressure from improving silicon IGBTs. Suppliers with validated packages and predictable multi-year capacity are better placed than entrants offering attractive device specifications alone.

Wide Bandgap Power Semiconductor Devices and Modules Market Overview

Wide bandgap power semiconductor devices and modules market was valued at USD 3,145 million in 2025 and is expected to reach USD 11,241 million by 2034, advancing at a CAGR of 15.2% over 2026–2034. Asia-Pacific is the largest demand center, with an estimated ~49% share in 2025, reflecting its unusually dense network of automotive, industrial inverter and compound-semiconductor manufacturing customers.

Base year: 2025 · Estimated year: 2026 · Forecast period: 2026–2034 · Historical period: 2020–2024 · Values in USD million

Wide bandgap power semiconductors use materials whose electrical properties support high breakdown fields and rapid switching, allowing power converters to operate with lower conduction or switching losses than comparable conventional silicon solutions. Silicon carbide is particularly important in traction inverters and high-voltage industrial equipment, while gallium nitride enables compact, high-frequency supplies for charging and digital infrastructure. Device performance is determined by the die, gate-drive behavior, thermal path, parasitic inductance and qualification of the finished package rather than by material selection alone.

The revenue boundary includes merchant SiC and GaN power devices and power modules serving the publisher-defined application, material and voltage categories. Discrete MOSFETs, power transistors and assembled modules are within scope when sold as power-conversion components; raw SiC crystal sales, unprocessed substrates, full electric vehicles, complete solar installations and unrelated controller software are excluded. Diamond-based semiconductor products appear in the material segmentation as a small experimental commercial category, but they are not assumed to have the manufacturing maturity or volume of established SiC and GaN families.

Purchasing decisions are driven by converter architecture. A 400V or 800V vehicle platform requires coordinated choices across the DC bus, switching device, insulation, heat extraction and electromagnetic compatibility. Industrial designers may instead optimize for equipment lifetime and field serviceability, and photovoltaic manufacturers often prioritize efficiency at several load points rather than peak output alone. A switch with an impressive laboratory figure of merit can still lose a production design if its package demands costly board changes or its supply assurance fails a customer audit.

End-market signals support sustained demand but do not translate mechanically into component revenue. The International Energy Agency recorded more than 20 million electric-car sales in 2025 and noted divergent growth patterns among China, Europe and North America. Solar PV installations also surpassed 600 GW in the same year, creating a large downstream market for inverter electronics. Both statistics describe systems deployed, not sales of SiC or GaN devices; the semiconductor opportunity depends on how frequently those systems adopt wide bandgap switches and the number of components fitted per unit.

A further shift is occurring in supplier ownership and technology access. Infineon integrated GaN Systems in 2023, while Renesas acquired Transphorm in 2024, bringing device design and established qualification programs inside broader semiconductor portfolios. Customers gain access to larger application-engineering teams and longer supply commitments, but smaller independent specialists face higher expectations for reliability evidence, package roadmaps and system-level reference designs. The resulting competition extends beyond device price to engineering support, capacity location and the cost of changing an existing design.

Segment Analysis: By Type

By type, Power SiC Devices and Modules represent an estimated ~70% of the 2025 market, compared with ~30% for Power GaN Devices and Modules. SiC is preferred where traction, industrial and grid converters operate at substantial bus voltages, whereas GaN captures designs that value very fast switching and compact magnetics. The two technologies overlap in some charging and storage systems, but device reliability and converter topology normally determine the selection.

Type Technical and customer requirements Commercial position
Power SiC Devices and Modules This family includes SiC MOSFETs, related power diodes and integrated packages used for high-voltage DC-to-AC and DC-to-DC conversion. Automotive customers commonly consider 650V, 750V, 950V and 1200V product classes, then test switching losses, short-circuit behavior, bond integrity and thermal cycling before platform release. Packaging changes can be as important as improvements in the underlying semiconductor die. Largest type: ~70% share in 2025; modeled ~14.5% CAGR. Demand is concentrated in vehicle traction, solar storage conversion, high-power charging and industrial motor control. Suppliers with a proven record in 1200V modules have a substantial qualification advantage, although the cost premium over silicon solutions remains material for price-sensitive, lower-power applications.
Power GaN Devices and Modules GaN transistors exploit high-frequency switching to shrink transformers, inductors and filter networks in power supplies. The market covers enhancement-mode and other commercial architectures as well as integrated or discrete implementations, with 100V and 650V classes serving distinct use cases. Designers must manage fast voltage edges, gate protection, electromagnetic emissions and board layout carefully to capture theoretical efficiency benefits. Estimated ~30% of 2025 sales; modeled ~16.7% CAGR. GaN is gaining sockets in server power, photovoltaic microinverters, UPS converters and high-density charging electronics. Its expansion is not uniform: cost, gate-drive familiarity and production qualification still favor established silicon or SiC alternatives in some high-current industrial and automotive systems.

Additional segmentation: material and operating voltage

The material lens separates Silicon Carbide (SiC), Gallium Nitride (GaN) and Diamond-based Semiconductors. SiC represents an estimated ~70% of the 2025 revenue base, GaN about ~29%, and diamond-related products about ~1%. The type and material axes describe different views of the same total and are not additive. Diamond devices remain limited by fabrication, contact formation and thermal packaging constraints, even though their material properties attract research investment for exceptionally demanding environments.

By Voltage Range, 600-1200V products lead with an estimated ~59% of 2025 revenue, followed by Below 600V at ~23% and Above 1200V at ~18%. The center band aligns with common vehicle traction, industrial drive and charging architectures; lower-voltage parts benefit from power-supply miniaturization, while the upper band addresses specialized industrial and grid equipment. Modeled growth is ~15.0%, ~17.0% and ~13.5%, respectively, reflecting different adoption rates rather than uniform market expansion.

Segment Analysis: By Application

Applications are distinguished by the converter duty cycle, output power, thermal environment and required service life. Electric Vehicle is the largest category at an estimated ~32% of 2025 revenue, followed by Photovoltaic and Energy Storage Systems (~18%), Electric Vehicle Charging Infrastructure (~14%), PFC Power Supply (~10%), Motor Drive (~9%), UPS (~8%) and Others (~9%). These estimated allocations sum to the whole market, with the fastest modeled growth occurring in charging infrastructure at ~16.0% annually.

Application Demand characteristics
Electric Vehicle Estimated ~32% share; ~15.8% modeled CAGR. Vehicle makers specify power switches for traction inverters, on-board charging and auxiliary conversion, but approval is tied to the complete inverter rather than to a catalog MOSFET. SiC can reduce losses and cooling demand in high-performance platforms, while procurement teams assess failure-rate evidence, die sourcing and the stability of the 800V ecosystem over an automotive production cycle.
Photovoltaic and Energy Storage Systems Estimated ~18% share; ~14.5% modeled CAGR. Solar and battery converters operate through varied loading and ambient conditions, making part-load efficiency, surge handling and maintenance cost decisive. Utility projects can adopt SiC at elevated bus voltages, whereas distributed solar creates selective opportunities for GaN. System suppliers compare the cost of passive components and heatsinks with the higher price of wide bandgap switches.
Electric Vehicle Charging Infrastructure Estimated ~14% share; ~16.0% modeled CAGR. Fast-charging cabinets combine AC front ends, isolated DC stages and thermal controls; higher switching frequency can reduce the physical volume of each power module. Reliability at sustained high output is critical because equipment downtime directly affects operator revenue. Installers also consider grid-connection costs, power sharing and modular field replacement when selecting converter hardware.
PFC Power Supply Estimated ~10% share; ~15.1% modeled CAGR. Power-factor correction stages for data centers, industrial supplies and compact electronic equipment increasingly consider 650V GaN devices. The design benefit comes from higher switching frequency and lower magnetic volume, but the business case depends on switching losses at actual loads, controller availability and compliance with conducted and radiated emission limits.
Motor Drive Estimated ~9% share; ~15.3% modeled CAGR. Industrial drive customers seek efficiency improvements in pumps, compressors, machine tools and automation equipment without compromising service intervals. Wide bandgap adoption is strongest when operating hours and electricity prices justify higher initial component cost. Engineers must also protect motor insulation from fast voltage transitions and preserve compatibility with existing cables and filters.
UPS Estimated ~8% share; ~14.0% modeled CAGR. Uninterruptible power systems for digital infrastructure need efficient conversion across mains, battery and bypass modes, including extended periods of partial loading. Higher-frequency switches can reduce rack footprint, yet facility operators demand extensive fault testing and long replacement-part availability. Adoption often follows validated converter platforms rather than rapid substitution of devices in existing installations.
Others Estimated ~9% share; ~14.5% modeled CAGR. The residual group covers selected rail, aerospace, specialized industrial and other power-conversion uses not assigned to the named applications. Some designs demand unusually high temperature or radiation tolerance, whereas others use wide bandgap devices simply to reduce cooling hardware. Fragmented qualification standards and small production runs limit economies of scale despite favorable technical characteristics.

The application split also explains why unit shipment trends and value growth differ. Automotive programs negotiate multi-year pricing but can sustain high annual volume once a design is approved, while energy and industrial projects buy in irregular capital-spending cycles. Data-center power customers may prioritize a new GaN platform because rack power density is constrained, yet the same architecture can be unsuitable for a harsh-environment motor controller. Manufacturers therefore maintain distinct reliability documentation, reference designs and distribution strategies across the seven demand categories.
Wide Bandgap Power Semiconductor Devices and Modules Market Trends & Future Outlook

Regional Analysis

Asia-Pacific leads with an estimated ~49% of 2025 market revenue, followed by North America (~20%), Europe (~19%), South America (~7%) and the Middle East & Africa (~5%). Modeled annual growth ranges from ~13.9% in North America to ~17.2% in South America, where the smaller starting base makes percentage expansion more sensitive to new electrification projects. These shares are analytical estimates of the global device-and-module market, not percentages of regional electric-car or solar-system sales.

Where are wide bandgap power device and module purchases concentrated?

The geographic structure reflects the location of converter engineering teams, power-electronics factories and system assembly, not just the final country in which an electric car or solar panel is installed. Japan and China have substantial device development and vehicle manufacturing ecosystems, Europe retains major automotive qualification centers, and North America is influential in data-center power architecture and device design. Cross-border wafer fabrication, module assembly and customer procurement mean that a regional share should not be interpreted as a self-contained local supply chain.

Regional demand also differs in maturity. Markets with established 800V electric-vehicle platforms often purchase qualified SiC modules in long production schedules, while younger markets initially import completed converters and later add domestic integration. Public charging, photovoltaic storage and industrial electrification introduce separate procurement channels with different purchasing criteria. Fast growth in a smaller market does not automatically imply that it can match the absolute semiconductor consumption of established Asian manufacturing clusters.

Region Position Growth outlook Demand profile What decides supplier selection
Asia-Pacific Largest (~49%) Strong (~15.7% CAGR) Vehicle and converter production clusters Automotive qualification, local application engineering and stable wafer supply
North America Second (~20%) Steady (~13.9% CAGR) Data-center supplies and EV power systems Reference designs, traceability and approved sourcing
Europe Third (~19%) Solid (~14.4% CAGR) Automotive engineering and industrial energy efficiency Reliability evidence, product longevity and thermal design
South America Fourth (~7%) Fastest (~17.2% CAGR) Imported converters and emerging EV assembly Delivered cost, service network and distributor support
Middle East & Africa Fifth (~5%) Developing (~15.5% CAGR) Solar, storage and infrastructure electrification High-temperature operation and project-level warranty

Asia-Pacific LARGEST · ~49% SHARE

Why does Asia-Pacific command the largest wide bandgap power semiconductor market?

Asia-Pacific represents an estimated ~49% of global 2025 device and module revenue, and its modeled growth of ~15.7% reflects an extensive network of EV production, inverter engineering and semiconductor assembly. China supplies a large share of the global vehicle and renewable-energy build-out, Japan contributes established SiC suppliers, and other Asian economies assemble electronics that incorporate GaN and SiC switches. Customers can source complete converter solutions locally, reducing development and qualification friction.

Market positionLargest (~49%)
Growth outlookStrong (~15.7% CAGR)
Demand profileAutomotive and inverter manufacturing
Market access gatePackage reliability and supply assurance
Country Position in region What drives demand
China Largest end-market cluster China combines large domestic electric-vehicle demand with extensive manufacturing of inverters, charging stations and power-electronics assemblies. The IEA reports that more than 13 million electric cars were sold there during 2025 and that electrified models approached 55% of new-car sales. Those system volumes provide a substantial addressable base for SiC traction switches, although domestic silicon alternatives and aggressive vehicle pricing constrain the premium that converter suppliers can charge.
Japan Technology and supplier center Japanese manufacturers including ROHM, Mitsubishi Electric and Toshiba have developed power devices and modules for automotive and industrial duty cycles, and domestic engineering teams influence qualification standards far beyond local vehicle sales. Designers emphasize short-circuit tolerance, heat cycling and predictable production quality. A weak domestic battery-electric-car sales year does not erase Japan’s importance because Japanese suppliers also ship components to global automakers and equipment makers.
India and Southeast Asia Emerging assembly corridor India and Southeast Asian economies are expanding vehicle assembly, charging networks and renewable-energy equipment, creating opportunities for qualified imported power devices and regional distribution. Local integrators frequently begin with established 650V or 1200V reference platforms to limit engineering risk. As assembly volume rises, technical service, customs predictability and stocked replacement components become more important than the absolute lowest die price quoted by an overseas manufacturer.
Market instances

  • China remains the anchor for vehicle-related converter procurement. The IEA recorded a large electric-car fleet and strong domestic model availability in 2025, giving Chinese inverter makers a broad range of platforms on which to evaluate SiC switches. The significance for suppliers is not a guaranteed device content per car: price pressure and vehicle segmentation create substantial variation. Firms that can deliver efficient modules at stable cost are positioned for repeat orders as more platforms adopt higher-voltage electrical architectures.
  • Japanese module innovation broadens the available package set. ROHM introduced molded SiC power modules targeting high-power-density automotive applications in April 2025, extending options for designers who want to shorten the thermal path and reduce inverter volume. The development matters because automotive engineers qualify package mechanics and electrical behavior together. Competitive differentiation increasingly depends on reproducible thermal resistance, mounting methods and stable production yields rather than only on wafer-level switching performance.
In the full report: manufacturer shipments and revenue by country, adoption by device type and voltage class, EV powertrain platform qualification, regional converter assembly locations and supplier positioning across China, Japan, Korea, India and Southeast Asia.

North America SECOND LARGEST · ~20% SHARE

How do North American customers choose SiC and GaN power solutions?

North America represents an estimated ~20% of the 2025 market and shows a modeled ~13.9% annual expansion through 2034. Its commercial opportunity is unusually diverse: high-density computing power supplies, industrial conversion, energy-storage electronics and selected automotive programs all require different device attributes. Procurement is strongly shaped by reference designs, qualified manufacturing sites and the cost of engineering a new gate-drive architecture. Rapid data-center deployment supports GaN experimentation, while established automotive customers retain demanding validation requirements.

Market positionSecond (~20%)
Growth outlookSteady (~13.9% CAGR)
Demand profileDigital power and industrial demand
Market access gateApplication support and product traceability
Country Position in region What drives demand
United States Engineering-led buyer base United States power-electronics customers include server equipment manufacturers, automotive platform developers, solar inverter makers and industrial OEMs. A data-center rectifier can favor 650V GaN for compact high-frequency operation, whereas an automotive inverter may select SiC for high-current operation and rugged packaging. Local application engineers and design-in support are valuable because fast-switching components require careful printed-circuit-board layout, electromagnetic-interference control and validation under realistic fault conditions.
Canada Specialist integration market Canadian demand is concentrated in industrial electrification, renewable-energy integration, transport applications and engineering programs that require robust power conversion in varied climates. Converter makers often purchase components through North American distribution and rely on long-term supplier commitments rather than building local semiconductor fabrication capacity. Qualification can be slower for safety-critical infrastructure, but customers may accept higher device costs when reduced cooling or maintenance delivers measurable lifetime savings.
Mexico Manufacturing and logistics interface Mexico plays a growing role in automotive and electronics assembly linked to United States customers. Wide bandgap devices may enter as individual components, populated power boards or complete modules depending on where the final converter is built. Local sourcing decisions therefore depend on customs arrangements, tier-one automotive requirements and the ability to replace defective power stages quickly. Device demand should not be confused with the entire value of vehicles assembled in the country.
Market instances

  • Packaging advances target thermal bottlenecks in high-power equipment. On 4 December 2025, onsemi introduced 650V and 950V EliteSiC MOSFETs in a top-cooled T2PAK format, targeting electric vehicles, solar infrastructure and storage. By moving the thermal connection toward the heatsink, the design addresses board-level constraints that often prevent adoption of faster switches. This is commercially relevant in North America because equipment makers frequently redesign cooling and electrical layout together during a converter generation change.
  • Silicon carbide collaboration links devices to industrial power design. Microchip and Delta Electronics announced a partnership in July 2025 covering silicon-carbide solutions for power management. The arrangement illustrates the importance of developing complete application platforms rather than selling an isolated transistor specification. Converter buyers need tested combinations of gate drives, isolation, thermal management and control logic; partnerships can shorten design cycles and reduce the risk of field failures in charging and industrial installations.
In the full report: country-level opportunity by customer vertical, supplier engineering support, design-win pipelines, thermal packaging adoption and the contribution of EV, industrial, data-center and storage converters in the United States, Canada and Mexico.

Europe THIRD LARGEST · ~19% SHARE

What makes European wide bandgap power device demand distinctive?

Europe holds an estimated ~19% of global 2025 revenue and a modeled ~14.4% CAGR, with demand shaped by vehicle efficiency requirements, industrial electrification and grid-connected energy systems. European OEMs tend to conduct extensive reliability and safety evaluations before accepting new device packages. A supplier must show stable switching behavior, thermal cycling performance and documentation across the converter lifetime. This creates substantial entry barriers but can support durable supplier relationships after a component is approved.

Market positionThird (~19%)
Growth outlookSolid (~14.4% CAGR)
Demand profileAutomotive and industrial engineering
Market access gateSafety evidence and long service life
Country Position in region What drives demand
Germany Automotive design center Germany hosts automotive and industrial engineering organizations that specify high-voltage inverters, drives and charging hardware for international production. Qualification programs examine device behavior during load changes, repeated heat cycling and electrical faults, with close attention to the mechanical connection between semiconductor module and cooling assembly. The business opportunity favors suppliers able to support platform development for several years and to document changes in fabrication or packaging processes.
France and Italy Energy and industrial equipment France and Italy provide a combination of renewable-energy integration, industrial automation and vehicle-related electronics demand. Wide bandgap adoption varies with equipment duty cycle: a high-utilization industrial converter can justify a more expensive device through electricity savings, while a low-duty system may remain on silicon. Buyers increasingly compare complete converter efficiency and maintenance exposure rather than treating the transistor purchase price as the only cost variable.
United Kingdom and Nordic countries Specialized power conversion The United Kingdom and Nordic countries offer opportunities in grid equipment, charging networks, rail applications and digital power systems. Design teams value supplier transparency, predictable replacement availability and the ability to operate across demanding temperature conditions. For infrastructure equipment, failure consequences can exceed the value of the semiconductor, so an established record of reliability and clear technical documentation frequently outweigh a small advantage in nominal efficiency.
Market instances

  • A European supplier extends GaN into distributed solar hardware. Infineon disclosed on 12 November 2025 that its CoolGaN bidirectional switch technology had been selected for Enphase IQ9 microinverters. The device architecture can replace multiple conventional switching elements and help simplify the conversion stage. This is significant for European design ecosystems because it demonstrates a route for GaN beyond compact chargers, with adoption based on the economics of an entire photovoltaic product rather than device performance in isolation.
  • High-voltage package development supports industrial and charging designs. Infineon announced a 1200V CoolSiC MOSFET generation in a top-cooled Q-DPAK format in July 2025, offering another mechanical approach for extracting heat from dense power boards. The change matters where enclosure size, airflow and mounting costs are major engineering constraints. European industrial customers can benefit when a qualified package enables a simpler thermal assembly without sacrificing fault tolerance or predictable service intervals.
In the full report: regional sales by voltage and material, automotive platform design activity, grid-connected converter demand, industrial customer qualification criteria and supplier competitiveness in Germany, France, Italy, the United Kingdom and Northern Europe.

South America FOURTH · ~7% SHARE · FASTEST-GROWING

Why can South America grow quickly from a smaller base?

South America accounts for an estimated ~7% of 2025 device and module sales but has the fastest modeled growth at ~17.2% CAGR. The starting base is comparatively modest, so charging networks, utility-scale solar projects and localized electric-bus assembly can change growth rates materially without making the region the largest global buyer. Much equipment arrives as finished power-conversion assemblies. Commercial success depends on distributor availability, repair capability and the landed cost of imported semiconductor products.

Market positionFourth (~7%)
Growth outlookFastest (~17.2% CAGR)
Demand profileProject-driven electrification
Market access gateDistributor coverage and field service
Country Position in region What drives demand
Brazil Largest regional buyer Brazil combines renewable-energy development, industrial motor demand and a growing market for electrified mobility, creating potential sockets for SiC-based inverters and high-efficiency chargers. Local equipment integrators may source power stages from global suppliers instead of buying semiconductor dies directly. Currency movements, import duties and financing costs affect project timing, so supplier forecasts must distinguish equipment orders from the commissioning of finished energy installations.
Chile Grid and storage opportunity Chile offers power-conversion opportunities associated with solar generation, energy storage and industrial electrification. Long-distance infrastructure and remote operating locations make converter reliability especially important, while high ambient temperatures can increase the value of efficient switches and robust thermal design. Adoption depends on whether engineering contractors specify wide bandgap architectures in new projects; many existing systems can continue operating with conventional silicon power stages.
Argentina and Colombia Selective adoption markets Argentina and Colombia are developing charging and industrial efficiency applications at different speeds, with imported converter modules often providing the initial route to market. Component suppliers need dependable local partners for technical troubleshooting and replacement stock because shipping individual power stages after a failure can delay equipment restoration. Demand remains sensitive to project finance, exchange rates and the availability of trained installers capable of servicing high-voltage systems.
Market instances

  • Electrified transport expands the potential converter installed base. The IEA observed a strong increase in electric-car sales outside the three largest global markets during 2025, including growth in emerging economies. For South American suppliers, the relevant opportunity lies in traction and charging hardware rather than in total vehicle sales value. The regional impact depends on how quickly public charging, fleet depots and local assembly incorporate qualified wide bandgap modules into their power electronics.
  • Remote energy projects reward reliable high-efficiency power stages. Solar and battery projects in the Andes and other remote sites can face high costs for service visits, equipment downtime and thermal management. SiC devices may be attractive when improved conversion efficiency reduces cooling requirements or cabinet size. Nevertheless, project owners will demand field data and warranty support before accepting a higher component price, which can delay initial adoption but favor vendors with strong technical distribution networks.
In the full report: country-level market estimates, project-based inverter adoption, electric-bus and charging applications, distributor economics, import conditions and opportunity screening for Brazil, Chile, Argentina, Colombia and neighboring markets.

Middle East & Africa FIFTH · ~5% SHARE

Which factors govern adoption in the Middle East and Africa?

The Middle East and Africa represent an estimated ~5% of 2025 global device-and-module revenue, with modeled growth of ~15.5% annually. Renewable-energy expansion, grid modernization, data-center investment and industrial power equipment provide diverse demand channels. Hot climates and challenging maintenance conditions make thermal design and proven package reliability especially important. Regional purchasing is frequently organized through large engineering contractors and international equipment vendors, so the location of final projects differs from the place where semiconductor orders are placed.

Market positionFifth (~5%)
Growth outlookDeveloping (~15.5% CAGR)
Demand profileSolar, grid and digital infrastructure
Market access gateThermal resilience and warranty coverage
Country Position in region What drives demand
Saudi Arabia Large project pipeline Saudi Arabia is investing in renewable generation, storage and energy-intensive infrastructure, creating demand for efficient power conversion. The IEA reported almost 7 GW of new solar PV additions in 2025, highlighting the speed at which grid-connected inverter requirements can expand. Device opportunities depend on the topology selected by international equipment suppliers and on compliance with heat, dust and reliability specifications for long-duration field operation.
United Arab Emirates Digital and energy systems The United Arab Emirates combines solar development with data-center construction and high-value industrial projects. High ambient temperatures can increase cooling loads, making efficient power stages attractive when their reliability is well established. Procurement decisions commonly involve global OEMs that specify components before equipment reaches the country, so supplier engagement at the engineering stage may be more valuable than local spot-market inventory alone.
South Africa and North Africa Distributed-energy adoption South Africa and parts of North Africa have substantial interest in photovoltaic generation, battery storage and industrial backup power. Installations may range from small commercial systems to utility-scale projects, with very different converter voltages and warranty expectations. A successful component offering must fit the installed equipment ecosystem, and distributors need trained technical staff because fast-switching semiconductor failures can be difficult to diagnose without appropriate instrumentation.
Market instances

  • Solar build-out changes the mix of high-voltage converter projects. The IEA reported that renewable capacity additions in the Middle East and North Africa reached around 12 GW in 2025, with the region gaining momentum in solar deployment. This expands the pool of new inverter designs where SiC can compete on thermal performance and switching efficiency. The effect on semiconductor purchases remains indirect because engineering contractors may select imported finished converters with established silicon components.
  • Thermal and service conditions shape supplier qualification. Power electronics used near desert solar fields or in high-density computing facilities must handle dust, ambient heat and variable cooling infrastructure. Buyers therefore examine junction-temperature margins, enclosure protection and fault behavior rather than selecting a device solely from headline efficiency figures. Suppliers that offer tested thermal reference designs and regional field-service partners may win opportunities even when a lower-priced device has similar laboratory characteristics.
In the full report: market development by country, solar and storage converter opportunities, digital-infrastructure demand, temperature-related design requirements and supplier channels in the Gulf, North Africa and sub-Saharan Africa.

Leading Wide Bandgap Power Semiconductor Manufacturers and Competitive Landscape

The competitive field spans vertically integrated SiC manufacturers, broad-based power semiconductor groups and specialist GaN designers. Wolfspeed, Infineon, ROHM, STMicroelectronics, onsemi, Mitsubishi Electric, Littelfuse, Microchip, Navitas and EPC address different combinations of device fabrication, packaging and converter support. Supplier positioning cannot be reduced to a single league table because a qualified automotive module, a compact GaN transistor and a custom industrial switch compete in distinct procurement channels.

SiC suppliers are evaluated on crystal and epitaxy quality, defect density, manufacturing yield, module design and long-term automotive supply assurance. Automotive programs can require several years of electrical, mechanical and environmental testing before mass production begins. Consequently, an incumbent with an established package and approved process controls may retain a platform even when a challenger offers a lower conduction loss. This favors organizations that can sustain capital spending through volatile semiconductor cycles.

GaN competition has changed through acquisitions and platform consolidation. Infineon completed the purchase of GaN Systems in October 2023, expanding its technology portfolio, and Renesas added Transphorm in June 2024. Those names should not be counted as independent competitors after the transactions. Navitas retains its own GaN and SiC activities, including the GeneSiC brand, while EPC concentrates on enhancement-mode GaN technology. Buyers compare device behavior together with gate drivers, reference designs and supplier support.

A manufacturer with the broadest catalog does not necessarily win every socket. Data-center power designers may prioritize switching speed and high-frequency operation, vehicle inverter teams focus on qualification and thermal cycling, and industrial buyers require long product availability. Packaging innovation also shifts competitive advantage: top-cooled discrete devices and low-inductance modules can simplify an entire converter, while conventional packages remain attractive when factories want to reuse validated assembly processes.

The competitive outlook contains both growth and price risk. Expanded wafer capacity can improve availability, yet oversupply of particular devices may compress margins, especially where alternative silicon solutions remain viable. Strong suppliers therefore distinguish themselves through measured system efficiency, repeatable field reliability, documentation of fabrication changes and the ability to support customer redesigns. A purchase order for a module is not equivalent to the total revenue of its parent semiconductor company.

Tier structure

Tier Companies Basis of competition
Tier 1: broad SiC and power platforms Infineon Technologies, STMicroelectronics, onsemi, ROHM, Mitsubishi Electric, Wolfspeed These organizations offer substantial device or module engineering capability, industrial and automotive qualification experience, and the ability to support demanding customer design cycles. Their relative strengths vary by wafer sourcing, package family and customer geography; Tier 1 denotes a broad commercial platform, not an audited share ranking for this exact market.
Tier 2: focused and diversified specialists Navitas Semiconductor (including GeneSiC), Microchip Technology, Littelfuse, Efficient Power Conversion Specialists can differentiate through GaN architecture, particular voltage classes, application boards and direct engineering support. Their portfolios range from discrete switching devices to specialized SiC solutions, and they compete by solving converter-level problems that broad catalog suppliers may address less quickly.
Acquired technology businesses GaN Systems (Infineon); Transphorm (Renesas) These legacy names remain relevant to product qualification history and intellectual property, but they are not independent suppliers after the announced acquisitions. Customers should evaluate current manufacturing commitments and commercial support through the acquiring companies rather than counting historical brand names as separate market participants.

Key companies profiled

  • Wolfspeed
  • Infineon Technologies
  • ROHM Semiconductor
  • STMicroelectronics
  • onsemi
  • Mitsubishi Electric
  • Littelfuse
  • Microchip Technology
  • GeneSiC (Navitas Semiconductor)
  • Transphorm (Renesas Electronics)
  • GaN Systems (Infineon Technologies)
  • Navitas Semiconductor
  • Efficient Power Conversion

Wide Bandgap Power Semiconductor Manufacturing Capacity and Packaging Analysis

Production capacity is governed by more than the number of wafers processed. SiC output depends on crystal growth, substrate quality, epitaxial layers, device fabrication, testing and the yield of finished packages; GaN supply has a different manufacturing profile that includes specialized epitaxy and compatible processing lines. Expanding the front end without sufficient packaging and qualification capability may increase unfinished inventory rather than shipments that converter makers can use.

Silicon carbide presents a manufacturing challenge because defects in substrates and epitaxy can limit the usable die yield, particularly for larger devices that carry high current. Device makers invest in process control, wafer inspection and automated testing to reduce variation. Customers do not simply buy a wafer-equivalent capacity figure: they need approved voltage classes, predictable on-resistance, stable threshold behavior and modules that survive repeated thermal cycling. Yield improvements can affect selling prices as strongly as new fabrication plants.

Gallium nitride manufacturing is moving toward larger wafers and processes that may reduce unit cost as volume increases. Infineon demonstrated 300mm power GaN manufacturing in Austria, signaling a route to greater die output per processed wafer. Scaling remains dependent on equipment compatibility, epitaxial quality and package assembly, while high-frequency operation makes parasitic capacitance and interconnect geometry critical. Commercial capacity must be measured against qualified customer designs rather than headline wafer diameters alone.

Backend assembly is becoming a more visible differentiator. A top-cooled package transfers heat differently from a conventional bottom-cooled board-mounted device, while an integrated power module can reduce assembly steps but complicate replacement after failure. Automotive customers may specify pressure contacts, solder materials or encapsulation systems to manage thermal stress. These engineering choices influence whether a device can achieve its advertised efficiency inside a complete inverter and whether the product can be manufactured consistently at volume.

Capacity investment also carries a cyclical risk. Rapid expansion can improve supply assurance for automakers and infrastructure buyers, but demand may change when vehicle platforms are delayed or silicon competitors improve. A resilient supplier balances several end markets, maintains qualified second-source arrangements where possible and invests in application engineers alongside fabrication assets. For purchasers, manufacturing location and business continuity planning are becoming formal parts of semiconductor approval rather than informal procurement preferences.

Wide Bandgap Power Semiconductor Market Dynamics: Drivers, Restraints and Opportunities

Demand is propelled by electrified mobility, high-efficiency renewable conversion, charging infrastructure, digital power density and industrial energy savings. These benefits must be weighed against material cost, device qualification, integration complexity and competition from established silicon platforms. The contribution tables express modeled percentage-point influences on the headline market growth rate; they are directional analyst allocations and should not be interpreted as separately observed revenue streams.

MARKET DRIVERS

Drivers Impact Analysis*

Market Drivers Impact Rank CAGR Contribution (%) 2026–2028 2029–2031 2032–2034
Electrified vehicle powertrain efficiency requirements High +4.80% High High Medium
Solar PV and energy storage converter deployment High +4.10% High High Medium
Public and depot fast-charging power systems Medium-High +3.00% Medium High High
Data-center power density and power-factor correction Medium +2.40% Medium High High
Industrial motor and UPS efficiency upgrades Low-Medium +1.90% Medium Medium High
Others (rail conversion, specialty power and new module packaging) Low +1.40% Low Medium Medium

Vehicle platform electrification

Automakers are redesigning traction and auxiliary conversion around efficiency, charging performance and available cooling space. SiC devices are attractive where higher DC bus voltage and sustained power output expose the limitations of conventional silicon solutions. The economic case depends on complete vehicle architecture, including battery voltage, inverter package and thermal system. Once a qualified platform enters production, its recurring device orders can persist through several model years.

Renewable-energy and storage investment

Photovoltaic inverters and battery converters operate across changing input conditions, and power loss can influence both energy output and thermal maintenance. Wide bandgap switches offer efficiency and size advantages in selected topologies, particularly at higher voltage or switching frequency. Adoption nevertheless varies by inverter power class and procurement cost targets; the growth driver is a broader pool of designs where efficiency improvements can justify semiconductor premiums.

Charging infrastructure architecture

A high-power charging station contains multiple conversion stages whose size and efficiency affect installation economics. Designers can use SiC modules to handle substantial current and GaN devices in appropriate high-frequency stages, but system-level cooling and reliability remain central. Operators favor modular cabinets that can be repaired quickly, which raises demand for qualified power stages rather than untested discrete devices. Charging growth also depends on grid connections and station utilization.

High-density computing power

Artificial intelligence servers and other digital infrastructure push power-supply designers to deliver more watts from constrained rack space. GaN transistors can reduce switching losses and the size of magnetic components, while SiC may suit higher-power distribution stages. Adoption is accelerated when new electrical architectures require redesigned conversion hardware. Conversely, existing data centers may retain silicon supplies until replacement cycles create a cost-effective transition point.

Industrial efficiency requirements

Industrial motors, pumps and uninterruptible power systems consume electricity over long service lives, so relatively small efficiency gains can matter in continuously operating facilities. Wide bandgap devices can improve selected converter designs, but switching speed also introduces insulation and electromagnetic compatibility challenges. Suppliers that provide validated filter and gate-drive guidance can shorten the qualification burden for industrial OEMs that have limited semiconductor engineering resources.

MARKET RESTRAINTS

Restraints Impact Analysis*

Market Restraints Impact Rank CAGR Contribution (%) 2026–2028 2029–2031 2032–2034
SiC substrate and advanced package cost premium High -0.90% High Medium Medium
Automotive and industrial qualification duration Medium-High -0.60% High Medium Low
Gate-drive, EMI and thermal integration complexity Medium -0.50% Medium Medium Low
Others (silicon competition, project delays and device price pressure) Low -0.40% Medium High High
*CAGR contribution shows the percentage points each factor adds to or removes from the forecast CAGR for 2026–2034; driver contributions less restraint contributions equal the market CAGR. Period columns rate the strength of each factor in that window.

Manufacturing cost limits addressable sockets

SiC substrate processing and advanced module assembly can cost more than established silicon fabrication, particularly when yield is uneven or volumes are modest. Buyers evaluate whether savings from lower losses, smaller cooling hardware or reduced energy consumption compensate for the higher component bill. In low-duty equipment, those savings may be insufficient. Price pressure therefore remains a genuine restraint even when wide bandgap devices outperform silicon in laboratory comparisons.

Qualification is slow for safety-critical systems

A power device can pass electrical characterization yet fail approval because its package changes thermal stress, insulation margins or fault response in the finished converter. Automotive and industrial customers require extensive evidence across temperature, vibration, cycling and production variability. This slows the conversion of engineering interest into shipped revenue and can leave a technically superior device outside an established platform for an entire design generation.

Faster switching complicates system engineering

The same fast voltage transitions that reduce switching loss can create electromagnetic emissions, ringing and stress on connected equipment. Converter engineers may need different gate drivers, improved layout, shielding, filters and isolation components, which increases redesign effort. In some motor-drive applications, the additional protection cost offsets the expected device benefit. Suppliers without detailed application support may struggle to convert catalog interest into repeat commercial orders.

Silicon incumbency and capital cycles

Modern silicon IGBTs and super-junction MOSFETs continue to improve, and equipment manufacturers often prefer a familiar platform with abundant replacement stock. Meanwhile, charging stations, factories and renewable projects depend on financing and permitting schedules that can change unexpectedly. If large projects are postponed, suppliers may face inventory corrections even while the longer-term technical case for SiC and GaN remains sound.

MARKET OPPORTUNITIES

Qualified modular converters for charging depots

Commercial fleet depots need serviceable power modules that can share load and recover quickly from a failed cabinet. Suppliers can gain design wins by providing tested SiC modules, isolated gate-drive references and clear thermal operating limits as a coordinated package. This reduces the integration burden for charger manufacturers and creates a route to recurring component orders as fleets expand their charging capacity.

GaN power stages for new digital infrastructure

Higher rack power densities are encouraging power-supply manufacturers to reconsider switching topology and voltage distribution. A vendor that supplies 650V GaN devices together with robust application guidance can influence the architecture early, when switching frequency and thermal design are still flexible. The opportunity is strongest in newly engineered platforms, not in retrofits where changing the complete supply can be prohibitively disruptive.

Integrated packaging for harsh operating conditions

Inverters in outdoor storage systems and industrial facilities experience vibration, temperature changes and limited maintenance access. Device makers can differentiate through low-inductance modules, direct cooling and documented cycling endurance. The opportunity extends to reliability engineering and application support: an equipment maker may accept a premium if a validated package reduces service visits and improves total system availability over its operating life.

New manufacturing processes and accessible device families

Larger GaN wafers, improved SiC yields and more standardized package formats could lower barriers for converter developers that previously avoided wide bandgap components. As devices become easier to source, manufacturers can target mid-volume industrial and renewable applications beyond flagship vehicle platforms. The commercial upside depends on real yield improvement and transparent product lifecycle commitments, not simply on announcing additional wafer capacity.

Wide Bandgap Power Semiconductor Supply Chain Analysis

The supply chain links specialty substrates and epitaxy with front-end fabrication, wafer test, advanced assembly, distribution and converter qualification. SiC and GaN differ in materials and process economics, but both rely on reliable packaging and extensive application engineering to reach system manufacturers. Supply-chain concentration can occur at a material-processing step even when finished devices are sold under several competing brands.

MaterialsSiC crystal growth and epitaxy; GaN epitaxial structures; specialty process chemicals and metallization materials
Device fabricationPower MOSFET and transistor processing, wafer probing, die selection and device characterization
Module assemblyDie attachment, interconnects, insulation, encapsulation, heat-spreader integration and qualification testing
CustomersAutomotive tier-one suppliers, charger and inverter OEMs, industrial equipment builders and power-supply integrators

Upstream material availability. Silicon carbide substrate quality affects die yield and therefore the economics of finished high-voltage devices. Manufacturers must control defects and epitaxial uniformity while meeting increasingly demanding customer specifications. GaN production has different bottlenecks, including epitaxy and wafer-process compatibility. Diversification of qualified upstream supply can protect converter manufacturers from disruptions, but changing material sources may trigger fresh device testing and approval work.

Fabrication and device testing. Front-end processing establishes the electrical characteristics of a switch, yet variation in threshold voltage, leakage and dynamic resistance can determine whether it performs consistently in a converter. Automated wafer probing and lot traceability are particularly important for safety-critical applications. Higher capacity does not automatically produce lower unit cost if yield or device size prevents the supplier from achieving sufficient usable output per wafer.

Packaging and thermal engineering. The finished device or module must transfer heat efficiently while controlling parasitic inductance and surviving repeated power cycling. Top-cooled and integrated module formats can help designers reduce enclosure volume, but they also change mechanical assembly and service procedures. Qualification teams therefore evaluate the entire electrical and thermal interface. The resulting package design can be a stronger competitive moat than the underlying transistor specification.

Customer and distribution channels. Automotive and industrial OEMs often approve specific manufacturing sites and part numbers, whereas smaller equipment builders may purchase through specialist distributors. A supplier that offers application boards, technical troubleshooting and dependable inventory can win customers without having the largest fabrication footprint. Downstream demand is ultimately determined by converter design wins and production schedules rather than the headline growth rate of any single energy or transport sector.

Recent Developments in Wide Bandgap Power Semiconductor Devices and Modules

  • 4 December 2025 Launched
    onsemi introduced EliteSiC 650V and 950V MOSFETs in a T2PAK top-cooled format, emphasizing thermal coupling between the power device and the external heatsink. The announcement illustrates a broader competitive shift toward package-level performance, where lowering thermal resistance and preserving compact board layouts can matter as much as incremental improvements in die electrical characteristics. Initial products were being shipped to lead customers. Source
  • 12 November 2025 Selected
    Infineon announced that Enphase Energy would use CoolGaN bidirectional switch technology in its IQ9 microinverter family. The architecture can consolidate switching functions in photovoltaic conversion and improve system design flexibility, demonstrating a commercial GaN application beyond compact consumer chargers. The development gives power-device suppliers a reference point for competing on whole-converter efficiency, component count and installation economics rather than transistor pricing alone. Source
  • October 2025 Introduced
    Infineon presented a 1200V SiC EasyPACK C module family intended for charging, energy-storage and uninterruptible-power equipment. The release broadens the choices available to converter engineers seeking modular high-voltage assemblies with defined thermal and mechanical interfaces. For buyers, standardized module families can shorten development work, although electrical testing and long-term reliability qualification remain essential before replacing an approved power stage. Source
  • August 2025 Released
    Toshiba introduced third-generation 650V silicon-carbide MOSFETs in a TOLL package, targeting compact high-efficiency power equipment. The launch expands the discrete-device alternatives available to engineers who cannot accommodate a larger module or who prefer surface-mount assembly. The competitive significance is the combination of switching performance with manufacturable package geometry, a recurring theme as industrial and charging designs seek smaller footprints. Source
  • July 2025 Partnered
    Microchip Technology disclosed a collaboration with Delta Electronics to advance silicon-carbide power solutions. The agreement links semiconductor capability with power-management system design and signals that converter customers increasingly want integrated technical support. Such cooperation can help resolve isolation, gate-drive and thermal problems before product release, improving the chances that a new device becomes part of a durable equipment platform rather than remaining a demonstration. Source
  • 1 July 2025 Launched
    Renesas introduced three 650V Gen IV Plus GaN transistors for high-density power supplies, including AI infrastructure, charging and energy conversion. The devices extend technology obtained through its Transphorm acquisition and were offered in several thermal package styles. Their significance lies in broadening commercial access to fast-switching power stages while retaining application choices for designers who need different heatsink and printed-circuit-board arrangements. Source
  • 24 April 2025 Developed
    ROHM announced molded silicon-carbide power modules with 750V and 1200V options for automotive conversion, including on-board charging. The package development targets higher power density and practical installation requirements in vehicles. The announcement reinforces the importance of module construction in a market where automakers qualify electrical efficiency, vibration behavior and temperature cycling together, making a device family valuable only after it performs reliably in the complete system. Source
  • 20 June 2024 Acquired
    Renesas completed the acquisition of Transphorm and stated that the addition expanded its gallium-nitride power portfolio. The transaction changed the competitive structure by bringing a specialist GaN technology platform into a larger semiconductor organization. Customers considering legacy Transphorm devices now evaluate sourcing, technical support and product-roadmap continuity through Renesas, rather than treating the former company as an independent current supplier. Source

REPORT SCOPE & SEGMENTATION

Attribute Details
Study Period 2020–2034
Base Year 2025
Estimated Year 2026
Forecast Period 2026–2034
Historical Period 2020–2024
Market Size 2025 USD 3,145 million
Market Size 2026 USD 3,623 million
Market Size 2034 USD 11,241 million
Growth Rate CAGR of 15.2% from 2026–2034
Unit Revenue (USD million); modeled market shares by device and application
Segmentation By Type, By Application, By Material, By Voltage Range and By Region
By Type Power SiC Devices and Modules · Power GaN Devices and Modules
By Application Electric Vehicle · Photovoltaic and Energy Storage Systems · Electric Vehicle Charging Infrastructure · PFC Power Supply · Motor Drive · UPS · Others
By Material Silicon Carbide (SiC) · Gallium Nitride (GaN) · Diamond-based Semiconductors
By Voltage Range Below 600V · 600-1200V · Above 1200V
By Region Five regional markets analyzed with estimates for type, application, material and voltage categories
North AmericaUnited States, Canada, Mexico
EuropeGermany, France, Italy, United Kingdom, Nordic countries, rest of Europe
Asia-PacificChina, Japan, South Korea, India, Southeast Asia, rest of Asia-Pacific
South AmericaBrazil, Chile, Argentina, Colombia, rest of South America
Middle East & AfricaSaudi Arabia, United Arab Emirates, South Africa, North Africa, other countries
Key Companies Profiled Wolfspeed, Infineon Technologies, ROHM, STMicroelectronics, onsemi, Mitsubishi Electric, Littelfuse, Microchip Technology, GeneSiC (Navitas), Transphorm (Renesas), GaN Systems (Infineon), Navitas Semiconductor, Efficient Power Conversion
Customization Scope Country and segment detail, voltage-class adoption, supplier design wins and converter application profiles may be tailored to a purchaser’s research objectives.

Frequently Asked Questions

What is the size and forecast of the wide bandgap power semiconductor devices and modules market?

The global market was valued at USD 3,145 million in 2025 and is forecast to reach USD 11,241 million by 2034, representing a CAGR of 15.2% during 2026–2034. This outlook includes power devices and assembled modules based principally on silicon carbide and gallium nitride. Growth reflects rising demand for efficient power conversion in vehicles, energy equipment, charging infrastructure and digital power systems.

Which companies supply wide bandgap power devices and modules?

The supplier landscape includes Infineon, ROHM, STMicroelectronics, onsemi, Wolfspeed, Mitsubishi Electric, Microchip, Littelfuse, Navitas and Efficient Power Conversion. Different companies specialize in distinct material systems, voltage classes and package formats. GaN Systems belongs to Infineon and Transphorm belongs to Renesas, so these acquired businesses should not be counted as separate independent suppliers when comparing current competitive positions.

How do silicon carbide and gallium nitride differ in power conversion?

Silicon carbide is widely used for higher-voltage and higher-current applications such as traction inverters and industrial power modules, where thermal robustness and switching losses are central. Gallium nitride is particularly attractive for high-frequency compact converters and power-factor correction. Their operating ranges overlap, but engineers choose between them based on total system efficiency, cost, gate-drive requirements, packaging and qualification history rather than a single material property.

What are the major product types in this market?

Two publisher-defined type groups are Power SiC Devices and Modules and Power GaN Devices and Modules. The SiC group leads with an estimated ~70% of 2025 revenue, while GaN accounts for ~30% and expands more rapidly in selected compact conversion applications. The classification covers both discrete power switches and module assemblies, but it excludes finished electric vehicles and entire renewable-energy plants.

Which end-use application purchases the most wide bandgap devices?

Electric Vehicle is the leading application, accounting for an estimated ~32% of 2025 market value. Traction inverters and vehicle charging electronics create demand for qualified switches and modules with reliable thermal behavior. Photovoltaic and Energy Storage Systems and Electric Vehicle Charging Infrastructure follow as substantial applications, while industrial motor drives, UPS equipment and power-factor correction each have distinct performance and procurement requirements.

Which region has the largest share of the market?

Asia-Pacific leads with an estimated ~49% of 2025 device-and-module revenue, reflecting a combination of EV assembly, converter production and established semiconductor manufacturing. North America holds ~20%, Europe ~19%, South America ~7% and the Middle East and Africa ~5%. These figures are market share estimates for components, not shares of global vehicle sales or renewable-energy installations, and each region has different supplier qualification priorities.

Why are 600-1200V wide bandgap devices commercially important?

The 600-1200V class accounts for an estimated ~59% of the 2025 market and aligns with common traction, industrial and charging bus architectures. It includes device choices that help engineers balance switching loss, insulation requirements and thermal design. Below 600V products suit selected compact supplies, while above 1200V devices address demanding industrial and grid conversion where higher blocking voltage can simplify some circuit configurations.

What prevents faster adoption of silicon carbide and gallium nitride?

The main obstacles are higher component and packaging cost, lengthy reliability qualification, specialized gate-drive design and strong competition from mature silicon devices. Fast switching can increase electromagnetic emissions and stress insulation unless the system is redesigned carefully. Suppliers also face manufacturing yield variability and periodic inventory corrections, so a favorable efficiency comparison does not guarantee that an equipment maker will change an approved converter architecture.

Where can gallium nitride gain additional commercial applications?

GaN has promising opportunities in high-density data-center supplies, photovoltaic microinverters, selected charging stages and compact industrial conversion. Designers can use its switching characteristics to reduce magnetic component size, but they must control thermal behavior and voltage transients. Commercial adoption is most likely when a new product architecture is being engineered and the manufacturer can validate the whole converter rather than simply substituting one transistor.

What does the market study cover geographically and technically?

The analysis uses 2025 as its base year, 2026 as the estimated year and 2034 as the forecast endpoint, with historical coverage of 2020–2024. It examines type, application, material and voltage range across five geographic regions. Company coverage includes active suppliers and identifies acquired specialist brands under their present owners, while the revenue boundary excludes raw materials and complete downstream equipment.

Research Sources & Evidence Base

View research sources used for this overview
  1. Infineon Technologies. Completion of GaN Systems acquisition, October 2023 transaction establishing the current ownership of the GaN Systems product platform.
  2. Renesas Electronics. Completion of Transphorm acquisition, June 2024 announcement of GaN technology integration and new reference designs.
  3. International Energy Agency. Global EV Outlook 2026: Trends in electric cars, 2025 electric-vehicle registrations and geographic differences in adoption.
  4. Infineon Technologies Austria. First 300mm power GaN wafer technology demonstration, Manufacturing scale-up direction and wafer-process engineering context.
  5. Infineon Technologies. Radiation-hardened GaN product introduction, Specialty GaN device development for demanding power applications.
  6. Renesas Electronics. 650V Gen IV Plus GaN FET introduction, July 2025 product specifications and converter use cases.
  7. Infineon Technologies. CoolGaN bidirectional switches for Enphase IQ9, November 2025 solar microinverter design selection.
  8. Semiconductor Industry Association. Global semiconductor sales in 2025, Adjacent semiconductor-industry context, not a measure of the wide bandgap market.
  9. International Energy Agency. Global Energy Review 2026: Solar PV and wind, 2025 solar installations and renewable capacity additions.
  10. Infineon Technologies. CoolSiC 1200V G2 Q-DPAK MOSFETs, July 2025 package and thermal design development.
  11. ROHM. New high-power-density SiC power modules, April 2025 module package development for automotive applications.
  12. onsemi. Top-cooled EliteSiC packaging announcement, December 2025 650V and 950V MOSFET launch.
  13. Microchip Technology. Partnership with Delta Electronics for SiC, July 2025 power-management collaboration.
  14. Infineon Technologies. 1200V EasyPACK C silicon-carbide modules, October 2025 package introduction for charging and energy storage.
  15. Toshiba. Third-generation 650V SiC MOSFETs in TOLL, August 2025 discrete-device package introduction.
Wide Bandgap Power Semiconductor Devices and Modules Market

Get Sample Report PDF for Exclusive Insights

Report Sample Includes

  • Table of Contents
  • List of Tables & Figures
  • Charts, Research Methodology, and more...

PDF Icon Download Sample Report PDF

Download Sample Report

Table of Content

Table of Contents
1 Research Methodology and Statistical Scope
1.1 Market Definition and Statistical Scope of Wide Bandgap Power (WBG) Semiconductor Power Devices and Modules
1.2 Key Market Segments
1.2.1 Wide Bandgap Power (WBG) Semiconductor Power Devices and Modules Segment by Type
1.2.2 Wide Bandgap Power (WBG) Semiconductor Power Devices and Modules Segment by Application
1.3 Methodology & Sources of Information
1.3.1 Research Methodology
1.3.2 Research Process
1.3.3 Market Breakdown and Data Triangulation
1.3.4 Base Year
1.3.5 Report Assumptions & Caveats
2 Wide Bandgap Power (WBG) Semiconductor Power Devices and Modules Market Overview
2.1 Global Market Overview
2.1.1 Global Wide Bandgap Power (WBG) Semiconductor Power Devices and Modules Market Size (M USD) Estimates and Forecasts (2026-2034)
2.1.2 Global Wide Bandgap Power (WBG) Semiconductor Power Devices and Modules Sales Estimates and Forecasts (2026-2034)
2.2 Market Segment Executive Summary
2.3 Global Market Size by Region
3 Wide Bandgap Power (WBG) Semiconductor Power Devices and Modules Market Competitive Landscape
3.1 Global Wide Bandgap Power (WBG) Semiconductor Power Devices and Modules Sales by Manufacturers (2019-2025)
3.2 Global Wide Bandgap Power (WBG) Semiconductor Power Devices and Modules Revenue Market Share by Manufacturers (2019-2025)
3.3 Wide Bandgap Power (WBG) Semiconductor Power Devices and Modules Market Share by Company Type (Tier 1, Tier 2, and Tier 3)
3.4 Global Wide Bandgap Power (WBG) Semiconductor Power Devices and Modules Average Price by Manufacturers (2019-2025)
3.5 Manufacturers Wide Bandgap Power (WBG) Semiconductor Power Devices and Modules Sales Sites, Area Served, Product Type
3.6 Wide Bandgap Power (WBG) Semiconductor Power Devices and Modules Market Competitive Situation and Trends
3.6.1 Wide Bandgap Power (WBG) Semiconductor Power Devices and Modules Market Concentration Rate
3.6.2 Global 5 and 10 Largest Wide Bandgap Power (WBG) Semiconductor Power Devices and Modules Players Market Share by Revenue
3.6.3 Mergers & Acquisitions, Expansion
4 Wide Bandgap Power (WBG) Semiconductor Power Devices and Modules Industry Chain Analysis
4.1 Wide Bandgap Power (WBG) Semiconductor Power Devices and Modules Industry Chain Analysis
4.2 Market Overview of Key Raw Materials
4.3 Midstream Market Analysis
4.4 Downstream Customer Analysis
5 The Development and Dynamics of Wide Bandgap Power (WBG) Semiconductor Power Devices and Modules Market
5.1 Key Development Trends
5.2 Driving Factors
5.3 Market Challenges
5.4 Market Restraints
5.5 Industry News
5.5.1 New Product Developments
5.5.2 Mergers & Acquisitions
5.5.3 Expansions
5.5.4 Collaboration/Supply Contracts
5.6 Industry Policies
6 Wide Bandgap Power (WBG) Semiconductor Power Devices and Modules Market Segmentation by Type
6.1 Evaluation Matrix of Segment Market Development Potential (Type)
6.2 Global Wide Bandgap Power (WBG) Semiconductor Power Devices and Modules Sales Market Share by Type (2019-2025)
6.3 Global Wide Bandgap Power (WBG) Semiconductor Power Devices and Modules Market Size Market Share by Type (2019-2025)
6.4 Global Wide Bandgap Power (WBG) Semiconductor Power Devices and Modules Price by Type (2019-2025)
7 Wide Bandgap Power (WBG) Semiconductor Power Devices and Modules Market Segmentation by Application
7.1 Evaluation Matrix of Segment Market Development Potential (Application)
7.2 Global Wide Bandgap Power (WBG) Semiconductor Power Devices and Modules Market Sales by Application (2019-2025)
7.3 Global Wide Bandgap Power (WBG) Semiconductor Power Devices and Modules Market Size (M USD) by Application (2019-2025)
7.4 Global Wide Bandgap Power (WBG) Semiconductor Power Devices and Modules Sales Growth Rate by Application (2019-2025)
8 Wide Bandgap Power (WBG) Semiconductor Power Devices and Modules Market Segmentation by Region
8.1 Global Wide Bandgap Power (WBG) Semiconductor Power Devices and Modules Sales by Region
8.1.1 Global Wide Bandgap Power (WBG) Semiconductor Power Devices and Modules Sales by Region
8.1.2 Global Wide Bandgap Power (WBG) Semiconductor Power Devices and Modules Sales Market Share by Region
8.2 North America
8.2.1 North America Wide Bandgap Power (WBG) Semiconductor Power Devices and Modules Sales by Country
8.2.2 U.S.
8.2.3 Canada
8.2.4 Mexico
8.3 Europe
8.3.1 Europe Wide Bandgap Power (WBG) Semiconductor Power Devices and Modules Sales by Country
8.3.2 Germany
8.3.3 France
8.3.4 U.K.
8.3.5 Italy
8.3.6 Russia
8.4 Asia Pacific
8.4.1 Asia Pacific Wide Bandgap Power (WBG) Semiconductor Power Devices and Modules Sales by Region
8.4.2 China
8.4.3 Japan
8.4.4 South Korea
8.4.5 India
8.4.6 Southeast Asia
8.5 South America
8.5.1 South America Wide Bandgap Power (WBG) Semiconductor Power Devices and Modules Sales by Country
8.5.2 Brazil
8.5.3 Argentina
8.5.4 Columbia
8.6 Middle East and Africa
8.6.1 Middle East and Africa Wide Bandgap Power (WBG) Semiconductor Power Devices and Modules Sales by Region
8.6.2 Saudi Arabia
8.6.3 UAE
8.6.4 Egypt
8.6.5 Nigeria
8.6.6 South Africa
9 Key Companies Profile
9.1 Wolfspped (Cree)
9.1.1 Wolfspped (Cree) Wide Bandgap Power (WBG) Semiconductor Power Devices and Modules Basic Information
9.1.2 Wolfspped (Cree) Wide Bandgap Power (WBG) Semiconductor Power Devices and Modules Product Overview
9.1.3 Wolfspped (Cree) Wide Bandgap Power (WBG) Semiconductor Power Devices and Modules Product Market Performance
9.1.4 Wolfspped (Cree) Business Overview
9.1.5 Wolfspped (Cree) Wide Bandgap Power (WBG) Semiconductor Power Devices and Modules SWOT Analysis
9.1.6 Wolfspped (Cree) Recent Developments
9.2 Infineon Technologies
9.2.1 Infineon Technologies Wide Bandgap Power (WBG) Semiconductor Power Devices and Modules Basic Information
9.2.2 Infineon Technologies Wide Bandgap Power (WBG) Semiconductor Power Devices and Modules Product Overview
9.2.3 Infineon Technologies Wide Bandgap Power (WBG) Semiconductor Power Devices and Modules Product Market Performance
9.2.4 Infineon Technologies Business Overview
9.2.5 Infineon Technologies Wide Bandgap Power (WBG) Semiconductor Power Devices and Modules SWOT Analysis
9.2.6 Infineon Technologies Recent Developments
9.3 ROHM Semiconductor
9.3.1 ROHM Semiconductor Wide Bandgap Power (WBG) Semiconductor Power Devices and Modules Basic Information
9.3.2 ROHM Semiconductor Wide Bandgap Power (WBG) Semiconductor Power Devices and Modules Product Overview
9.3.3 ROHM Semiconductor Wide Bandgap Power (WBG) Semiconductor Power Devices and Modules Product Market Performance
9.3.4 ROHM Semiconductor Wide Bandgap Power (WBG) Semiconductor Power Devices and Modules SWOT Analysis
9.3.5 ROHM Semiconductor Business Overview
9.3.6 ROHM Semiconductor Recent Developments
9.4 STMicroelectronics
9.4.1 STMicroelectronics Wide Bandgap Power (WBG) Semiconductor Power Devices and Modules Basic Information
9.4.2 STMicroelectronics Wide Bandgap Power (WBG) Semiconductor Power Devices and Modules Product Overview
9.4.3 STMicroelectronics Wide Bandgap Power (WBG) Semiconductor Power Devices and Modules Product Market Performance
9.4.4 STMicroelectronics Business Overview
9.4.5 STMicroelectronics Recent Developments
9.5 Onsemi
9.5.1 Onsemi Wide Bandgap Power (WBG) Semiconductor Power Devices and Modules Basic Information
9.5.2 Onsemi Wide Bandgap Power (WBG) Semiconductor Power Devices and Modules Product Overview
9.5.3 Onsemi Wide Bandgap Power (WBG) Semiconductor Power Devices and Modules Product Market Performance
9.5.4 Onsemi Business Overview
9.5.5 Onsemi Recent Developments
9.6 Mitsubishi Electric
9.6.1 Mitsubishi Electric Wide Bandgap Power (WBG) Semiconductor Power Devices and Modules Basic Information
9.6.2 Mitsubishi Electric Wide Bandgap Power (WBG) Semiconductor Power Devices and Modules Product Overview
9.6.3 Mitsubishi Electric Wide Bandgap Power (WBG) Semiconductor Power Devices and Modules Product Market Performance
9.6.4 Mitsubishi Electric Business Overview
9.6.5 Mitsubishi Electric Recent Developments
9.7 Littelfuse
9.7.1 Littelfuse Wide Bandgap Power (WBG) Semiconductor Power Devices and Modules Basic Information
9.7.2 Littelfuse Wide Bandgap Power (WBG) Semiconductor Power Devices and Modules Product Overview
9.7.3 Littelfuse Wide Bandgap Power (WBG) Semiconductor Power Devices and Modules Product Market Performance
9.7.4 Littelfuse Business Overview
9.7.5 Littelfuse Recent Developments
9.8 Microchip Technology
9.8.1 Microchip Technology Wide Bandgap Power (WBG) Semiconductor Power Devices and Modules Basic Information
9.8.2 Microchip Technology Wide Bandgap Power (WBG) Semiconductor Power Devices and Modules Product Overview
9.8.3 Microchip Technology Wide Bandgap Power (WBG) Semiconductor Power Devices and Modules Product Market Performance
9.8.4 Microchip Technology Business Overview
9.8.5 Microchip Technology Recent Developments
9.9 GeneSiC Semiconductor
9.9.1 GeneSiC Semiconductor Wide Bandgap Power (WBG) Semiconductor Power Devices and Modules Basic Information
9.9.2 GeneSiC Semiconductor Wide Bandgap Power (WBG) Semiconductor Power Devices and Modules Product Overview
9.9.3 GeneSiC Semiconductor Wide Bandgap Power (WBG) Semiconductor Power Devices and Modules Product Market Performance
9.9.4 GeneSiC Semiconductor Business Overview
9.9.5 GeneSiC Semiconductor Recent Developments
9.10 Transphorm
9.10.1 Transphorm Wide Bandgap Power (WBG) Semiconductor Power Devices and Modules Basic Information
9.10.2 Transphorm Wide Bandgap Power (WBG) Semiconductor Power Devices and Modules Product Overview
9.10.3 Transphorm Wide Bandgap Power (WBG) Semiconductor Power Devices and Modules Product Market Performance
9.10.4 Transphorm Business Overview
9.10.5 Transphorm Recent Developments
9.11 GaN Systems
9.11.1 GaN Systems Wide Bandgap Power (WBG) Semiconductor Power Devices and Modules Basic Information
9.11.2 GaN Systems Wide Bandgap Power (WBG) Semiconductor Power Devices and Modules Product Overview
9.11.3 GaN Systems Wide Bandgap Power (WBG) Semiconductor Power Devices and Modules Product Market Performance
9.11.4 GaN Systems Business Overview
9.11.5 GaN Systems Recent Developments
9.12 Navitas Semiconductor
9.12.1 Navitas Semiconductor Wide Bandgap Power (WBG) Semiconductor Power Devices and Modules Basic Information
9.12.2 Navitas Semiconductor Wide Bandgap Power (WBG) Semiconductor Power Devices and Modules Product Overview
9.12.3 Navitas Semiconductor Wide Bandgap Power (WBG) Semiconductor Power Devices and Modules Product Market Performance
9.12.4 Navitas Semiconductor Business Overview
9.12.5 Navitas Semiconductor Recent Developments
9.13 Efficient Power Conversion (EPC)
9.13.1 Efficient Power Conversion (EPC) Wide Bandgap Power (WBG) Semiconductor Power Devices and Modules Basic Information
9.13.2 Efficient Power Conversion (EPC) Wide Bandgap Power (WBG) Semiconductor Power Devices and Modules Product Overview
9.13.3 Efficient Power Conversion (EPC) Wide Bandgap Power (WBG) Semiconductor Power Devices and Modules Product Market Performance
9.13.4 Efficient Power Conversion (EPC) Business Overview
9.13.5 Efficient Power Conversion (EPC) Recent Developments
10 Wide Bandgap Power (WBG) Semiconductor Power Devices and Modules Market Forecast by Region
10.1 Global Wide Bandgap Power (WBG) Semiconductor Power Devices and Modules Market Size Forecast
10.2 Global Wide Bandgap Power (WBG) Semiconductor Power Devices and Modules Market Forecast by Region
10.2.1 North America Market Size Forecast by Country
10.2.2 Europe Wide Bandgap Power (WBG) Semiconductor Power Devices and Modules Market Size Forecast by Country
10.2.3 Asia Pacific Wide Bandgap Power (WBG) Semiconductor Power Devices and Modules Market Size Forecast by Region
10.2.4 South America Wide Bandgap Power (WBG) Semiconductor Power Devices and Modules Market Size Forecast by Country
10.2.5 Middle East and Africa Forecasted Consumption of Wide Bandgap Power (WBG) Semiconductor Power Devices and Modules by Country
11 Forecast Market by Type and by Application (2025-2032)
11.1 Global Wide Bandgap Power (WBG) Semiconductor Power Devices and Modules Market Forecast by Type (2025-2032)
11.1.1 Global Forecasted Sales of Wide Bandgap Power (WBG) Semiconductor Power Devices and Modules by Type (2025-2032)
11.1.2 Global Wide Bandgap Power (WBG) Semiconductor Power Devices and Modules Market Size Forecast by Type (2025-2032)
11.1.3 Global Forecasted Price of Wide Bandgap Power (WBG) Semiconductor Power Devices and Modules by Type (2025-2032)
11.2 Global Wide Bandgap Power (WBG) Semiconductor Power Devices and Modules Market Forecast by Application (2025-2032)
11.2.1 Global Wide Bandgap Power (WBG) Semiconductor Power Devices and Modules Sales (K Units) Forecast by Application
11.2.2 Global Wide Bandgap Power (WBG) Semiconductor Power Devices and Modules Market Size (M USD) Forecast by Application (2025-2032)
12 Conclusion and Key FindingsList of Tables
Table 1. Introduction of the Type
Table 2. Introduction of the Application
Table 3. Market Size (M USD) Segment Executive Summary
Table 4. Wide Bandgap Power (WBG) Semiconductor Power Devices and Modules Market Size Comparison by Region (M USD)
Table 5. Global Wide Bandgap Power (WBG) Semiconductor Power Devices and Modules Sales (K Units) by Manufacturers (2019-2025)
Table 6. Global Wide Bandgap Power (WBG) Semiconductor Power Devices and Modules Sales Market Share by Manufacturers (2019-2025)
Table 7. Global Wide Bandgap Power (WBG) Semiconductor Power Devices and Modules Revenue (M USD) by Manufacturers (2019-2025)
Table 8. Global Wide Bandgap Power (WBG) Semiconductor Power Devices and Modules Revenue Share by Manufacturers (2019-2025)
Table 9. Company Type (Tier 1, Tier 2, and Tier 3) & (based on the Revenue in Wide Bandgap Power (WBG) Semiconductor Power Devices and Modules as of 2022)
Table 10. Global Market Wide Bandgap Power (WBG) Semiconductor Power Devices and Modules Average Price (USD/Unit) of Key Manufacturers (2019-2025)
Table 11. Manufacturers Wide Bandgap Power (WBG) Semiconductor Power Devices and Modules Sales Sites and Area Served
Table 12. Manufacturers Wide Bandgap Power (WBG) Semiconductor Power Devices and Modules Product Type
Table 13. Global Wide Bandgap Power (WBG) Semiconductor Power Devices and Modules Manufacturers Market Concentration Ratio (CR5 and HHI)
Table 14. Mergers & Acquisitions, Expansion Plans
Table 15. Industry Chain Map of Wide Bandgap Power (WBG) Semiconductor Power Devices and Modules
Table 16. Market Overview of Key Raw Materials
Table 17. Midstream Market Analysis
Table 18. Downstream Customer Analysis
Table 19. Key Development Trends
Table 20. Driving Factors
Table 21. Wide Bandgap Power (WBG) Semiconductor Power Devices and Modules Market Challenges
Table 22. Global Wide Bandgap Power (WBG) Semiconductor Power Devices and Modules Sales by Type (K Units)
Table 23. Global Wide Bandgap Power (WBG) Semiconductor Power Devices and Modules Market Size by Type (M USD)
Table 24. Global Wide Bandgap Power (WBG) Semiconductor Power Devices and Modules Sales (K Units) by Type (2019-2025)
Table 25. Global Wide Bandgap Power (WBG) Semiconductor Power Devices and Modules Sales Market Share by Type (2019-2025)
Table 26. Global Wide Bandgap Power (WBG) Semiconductor Power Devices and Modules Market Size (M USD) by Type (2019-2025)
Table 27. Global Wide Bandgap Power (WBG) Semiconductor Power Devices and Modules Market Size Share by Type (2019-2025)
Table 28. Global Wide Bandgap Power (WBG) Semiconductor Power Devices and Modules Price (USD/Unit) by Type (2019-2025)
Table 29. Global Wide Bandgap Power (WBG) Semiconductor Power Devices and Modules Sales (K Units) by Application
Table 30. Global Wide Bandgap Power (WBG) Semiconductor Power Devices and Modules Market Size by Application
Table 31. Global Wide Bandgap Power (WBG) Semiconductor Power Devices and Modules Sales by Application (2019-2025) & (K Units)
Table 32. Global Wide Bandgap Power (WBG) Semiconductor Power Devices and Modules Sales Market Share by Application (2019-2025)
Table 33. Global Wide Bandgap Power (WBG) Semiconductor Power Devices and Modules Sales by Application (2019-2025) & (M USD)
Table 34. Global Wide Bandgap Power (WBG) Semiconductor Power Devices and Modules Market Share by Application (2019-2025)
Table 35. Global Wide Bandgap Power (WBG) Semiconductor Power Devices and Modules Sales Growth Rate by Application (2019-2025)
Table 36. Global Wide Bandgap Power (WBG) Semiconductor Power Devices and Modules Sales by Region (2019-2025) & (K Units)
Table 37. Global Wide Bandgap Power (WBG) Semiconductor Power Devices and Modules Sales Market Share by Region (2019-2025)
Table 38. North America Wide Bandgap Power (WBG) Semiconductor Power Devices and Modules Sales by Country (2019-2025) & (K Units)
Table 39. Europe Wide Bandgap Power (WBG) Semiconductor Power Devices and Modules Sales by Country (2019-2025) & (K Units)
Table 40. Asia Pacific Wide Bandgap Power (WBG) Semiconductor Power Devices and Modules Sales by Region (2019-2025) & (K Units)
Table 41. South America Wide Bandgap Power (WBG) Semiconductor Power Devices and Modules Sales by Country (2019-2025) & (K Units)
Table 42. Middle East and Africa Wide Bandgap Power (WBG) Semiconductor Power Devices and Modules Sales by Region (2019-2025) & (K Units)
Table 43. Wolfspped (Cree) Wide Bandgap Power (WBG) Semiconductor Power Devices and Modules Basic Information
Table 44. Wolfspped (Cree) Wide Bandgap Power (WBG) Semiconductor Power Devices and Modules Product Overview
Table 45. Wolfspped (Cree) Wide Bandgap Power (WBG) Semiconductor Power Devices and Modules Sales (K Units), Revenue (M USD), Price (USD/Unit) and Gross Margin (2019-2025)
Table 46. Wolfspped (Cree) Business Overview
Table 47. Wolfspped (Cree) Wide Bandgap Power (WBG) Semiconductor Power Devices and Modules SWOT Analysis
Table 48. Wolfspped (Cree) Recent Developments
Table 49. Infineon Technologies Wide Bandgap Power (WBG) Semiconductor Power Devices and Modules Basic Information
Table 50. Infineon Technologies Wide Bandgap Power (WBG) Semiconductor Power Devices and Modules Product Overview
Table 51. Infineon Technologies Wide Bandgap Power (WBG) Semiconductor Power Devices and Modules Sales (K Units), Revenue (M USD), Price (USD/Unit) and Gross Margin (2019-2025)
Table 52. Infineon Technologies Business Overview
Table 53. Infineon Technologies Wide Bandgap Power (WBG) Semiconductor Power Devices and Modules SWOT Analysis
Table 54. Infineon Technologies Recent Developments
Table 55. ROHM Semiconductor Wide Bandgap Power (WBG) Semiconductor Power Devices and Modules Basic Information
Table 56. ROHM Semiconductor Wide Bandgap Power (WBG) Semiconductor Power Devices and Modules Product Overview
Table 57. ROHM Semiconductor Wide Bandgap Power (WBG) Semiconductor Power Devices and Modules Sales (K Units), Revenue (M USD), Price (USD/Unit) and Gross Margin (2019-2025)
Table 58. ROHM Semiconductor Wide Bandgap Power (WBG) Semiconductor Power Devices and Modules SWOT Analysis
Table 59. ROHM Semiconductor Business Overview
Table 60. ROHM Semiconductor Recent Developments
Table 61. STMicroelectronics Wide Bandgap Power (WBG) Semiconductor Power Devices and Modules Basic Information
Table 62. STMicroelectronics Wide Bandgap Power (WBG) Semiconductor Power Devices and Modules Product Overview
Table 63. STMicroelectronics Wide Bandgap Power (WBG) Semiconductor Power Devices and Modules Sales (K Units), Revenue (M USD), Price (USD/Unit) and Gross Margin (2019-2025)
Table 64. STMicroelectronics Business Overview
Table 65. STMicroelectronics Recent Developments
Table 66. Onsemi Wide Bandgap Power (WBG) Semiconductor Power Devices and Modules Basic Information
Table 67. Onsemi Wide Bandgap Power (WBG) Semiconductor Power Devices and Modules Product Overview
Table 68. Onsemi Wide Bandgap Power (WBG) Semiconductor Power Devices and Modules Sales (K Units), Revenue (M USD), Price (USD/Unit) and Gross Margin (2019-2025)
Table 69. Onsemi Business Overview
Table 70. Onsemi Recent Developments
Table 71. Mitsubishi Electric Wide Bandgap Power (WBG) Semiconductor Power Devices and Modules Basic Information
Table 72. Mitsubishi Electric Wide Bandgap Power (WBG) Semiconductor Power Devices and Modules Product Overview
Table 73. Mitsubishi Electric Wide Bandgap Power (WBG) Semiconductor Power Devices and Modules Sales (K Units), Revenue (M USD), Price (USD/Unit) and Gross Margin (2019-2025)
Table 74. Mitsubishi Electric Business Overview
Table 75. Mitsubishi Electric Recent Developments
Table 76. Littelfuse Wide Bandgap Power (WBG) Semiconductor Power Devices and Modules Basic Information
Table 77. Littelfuse Wide Bandgap Power (WBG) Semiconductor Power Devices and Modules Product Overview
Table 78. Littelfuse Wide Bandgap Power (WBG) Semiconductor Power Devices and Modules Sales (K Units), Revenue (M USD), Price (USD/Unit) and Gross Margin (2019-2025)
Table 79. Littelfuse Business Overview
Table 80. Littelfuse Recent Developments
Table 81. Microchip Technology Wide Bandgap Power (WBG) Semiconductor Power Devices and Modules Basic Information
Table 82. Microchip Technology Wide Bandgap Power (WBG) Semiconductor Power Devices and Modules Product Overview
Table 83. Microchip Technology Wide Bandgap Power (WBG) Semiconductor Power Devices and Modules Sales (K Units), Revenue (M USD), Price (USD/Unit) and Gross Margin (2019-2025)
Table 84. Microchip Technology Business Overview
Table 85. Microchip Technology Recent Developments
Table 86. GeneSiC Semiconductor Wide Bandgap Power (WBG) Semiconductor Power Devices and Modules Basic Information
Table 87. GeneSiC Semiconductor Wide Bandgap Power (WBG) Semiconductor Power Devices and Modules Product Overview
Table 88. GeneSiC Semiconductor Wide Bandgap Power (WBG) Semiconductor Power Devices and Modules Sales (K Units), Revenue (M USD), Price (USD/Unit) and Gross Margin (2019-2025)
Table 89. GeneSiC Semiconductor Business Overview
Table 90. GeneSiC Semiconductor Recent Developments
Table 91. Transphorm Wide Bandgap Power (WBG) Semiconductor Power Devices and Modules Basic Information
Table 92. Transphorm Wide Bandgap Power (WBG) Semiconductor Power Devices and Modules Product Overview
Table 93. Transphorm Wide Bandgap Power (WBG) Semiconductor Power Devices and Modules Sales (K Units), Revenue (M USD), Price (USD/Unit) and Gross Margin (2019-2025)
Table 94. Transphorm Business Overview
Table 95. Transphorm Recent Developments
Table 96. GaN Systems Wide Bandgap Power (WBG) Semiconductor Power Devices and Modules Basic Information
Table 97. GaN Systems Wide Bandgap Power (WBG) Semiconductor Power Devices and Modules Product Overview
Table 98. GaN Systems Wide Bandgap Power (WBG) Semiconductor Power Devices and Modules Sales (K Units), Revenue (M USD), Price (USD/Unit) and Gross Margin (2019-2025)
Table 99. GaN Systems Business Overview
Table 100. GaN Systems Recent Developments
Table 101. Navitas Semiconductor Wide Bandgap Power (WBG) Semiconductor Power Devices and Modules Basic Information
Table 102. Navitas Semiconductor Wide Bandgap Power (WBG) Semiconductor Power Devices and Modules Product Overview
Table 103. Navitas Semiconductor Wide Bandgap Power (WBG) Semiconductor Power Devices and Modules Sales (K Units), Revenue (M USD), Price (USD/Unit) and Gross Margin (2019-2025)
Table 104. Navitas Semiconductor Business Overview
Table 105. Navitas Semiconductor Recent Developments
Table 106. Efficient Power Conversion (EPC) Wide Bandgap Power (WBG) Semiconductor Power Devices and Modules Basic Information
Table 107. Efficient Power Conversion (EPC) Wide Bandgap Power (WBG) Semiconductor Power Devices and Modules Product Overview
Table 108. Efficient Power Conversion (EPC) Wide Bandgap Power (WBG) Semiconductor Power Devices and Modules Sales (K Units), Revenue (M USD), Price (USD/Unit) and Gross Margin (2019-2025)
Table 109. Efficient Power Conversion (EPC) Business Overview
Table 110. Efficient Power Conversion (EPC) Recent Developments
Table 111. Global Wide Bandgap Power (WBG) Semiconductor Power Devices and Modules Sales Forecast by Region (2025-2030) & (K Units)
Table 112. Global Wide Bandgap Power (WBG) Semiconductor Power Devices and Modules Market Size Forecast by Region (2025-2030) & (M USD)
Table 113. North America Wide Bandgap Power (WBG) Semiconductor Power Devices and Modules Sales Forecast by Country (2025-2030) & (K Units)
Table 114. North America Wide Bandgap Power (WBG) Semiconductor Power Devices and Modules Market Size Forecast by Country (2025-2030) & (M USD)
Table 115. Europe Wide Bandgap Power (WBG) Semiconductor Power Devices and Modules Sales Forecast by Country (2025-2030) & (K Units)
Table 116. Europe Wide Bandgap Power (WBG) Semiconductor Power Devices and Modules Market Size Forecast by Country (2025-2030) & (M USD)
Table 117. Asia Pacific Wide Bandgap Power (WBG) Semiconductor Power Devices and Modules Sales Forecast by Region (2025-2030) & (K Units)
Table 118. Asia Pacific Wide Bandgap Power (WBG) Semiconductor Power Devices and Modules Market Size Forecast by Region (2025-2030) & (M USD)
Table 119. South America Wide Bandgap Power (WBG) Semiconductor Power Devices and Modules Sales Forecast by Country (2025-2030) & (K Units)
Table 120. South America Wide Bandgap Power (WBG) Semiconductor Power Devices and Modules Market Size Forecast by Country (2025-2030) & (M USD)
Table 121. Middle East and Africa Wide Bandgap Power (WBG) Semiconductor Power Devices and Modules Consumption Forecast by Country (2025-2030) & (Units)
Table 122. Middle East and Africa Wide Bandgap Power (WBG) Semiconductor Power Devices and Modules Market Size Forecast by Country (2025-2030) & (M USD)
Table 123. Global Wide Bandgap Power (WBG) Semiconductor Power Devices and Modules Sales Forecast by Type (2025-2030) & (K Units)
Table 124. Global Wide Bandgap Power (WBG) Semiconductor Power Devices and Modules Market Size Forecast by Type (2025-2030) & (M USD)
Table 125. Global Wide Bandgap Power (WBG) Semiconductor Power Devices and Modules Price Forecast by Type (2025-2030) & (USD/Unit)
Table 126. Global Wide Bandgap Power (WBG) Semiconductor Power Devices and Modules Sales (K Units) Forecast by Application (2025-2030)
Table 127. Global Wide Bandgap Power (WBG) Semiconductor Power Devices and Modules Market Size Forecast by Application (2025-2030) & (M USD)
List of Figures
Figure 1. Product Picture of Wide Bandgap Power (WBG) Semiconductor Power Devices and Modules
Figure 2. Data Triangulation
Figure 3. Key Caveats
Figure 4. Global Wide Bandgap Power (WBG) Semiconductor Power Devices and Modules Market Size (M USD), 2019-2030
Figure 5. Global Wide Bandgap Power (WBG) Semiconductor Power Devices and Modules Market Size (M USD) (2019-2030)
Figure 6. Global Wide Bandgap Power (WBG) Semiconductor Power Devices and Modules Sales (K Units) & (2019-2030)
Figure 7. Evaluation Matrix of Segment Market Development Potential (Type)
Figure 8. Evaluation Matrix of Segment Market Development Potential (Application)
Figure 9. Evaluation Matrix of Regional Market Development Potential
Figure 10. Wide Bandgap Power (WBG) Semiconductor Power Devices and Modules Market Size by Country (M USD)
Figure 11. Wide Bandgap Power (WBG) Semiconductor Power Devices and Modules Sales Share by Manufacturers in 2023
Figure 12. Global Wide Bandgap Power (WBG) Semiconductor Power Devices and Modules Revenue Share by Manufacturers in 2023
Figure 13. Wide Bandgap Power (WBG) Semiconductor Power Devices and Modules Market Share by Company Type (Tier 1, Tier 2 and Tier 3): 2023
Figure 14. Global Market Wide Bandgap Power (WBG) Semiconductor Power Devices and Modules Average Price (USD/Unit) of Key Manufacturers in 2023
Figure 15. The Global 5 and 10 Largest Players: Market Share by Wide Bandgap Power (WBG) Semiconductor Power Devices and Modules Revenue in 2023
Figure 16. Evaluation Matrix of Segment Market Development Potential (Type)
Figure 17. Global Wide Bandgap Power (WBG) Semiconductor Power Devices and Modules Market Share by Type
Figure 18. Sales Market Share of Wide Bandgap Power (WBG) Semiconductor Power Devices and Modules by Type (2019-2025)
Figure 19. Sales Market Share of Wide Bandgap Power (WBG) Semiconductor Power Devices and Modules by Type in 2023
Figure 20. Market Size Share of Wide Bandgap Power (WBG) Semiconductor Power Devices and Modules by Type (2019-2025)
Figure 21. Market Size Market Share of Wide Bandgap Power (WBG) Semiconductor Power Devices and Modules by Type in 2023
Figure 22. Evaluation Matrix of Segment Market Development Potential (Application)
Figure 23. Global Wide Bandgap Power (WBG) Semiconductor Power Devices and Modules Market Share by Application
Figure 24. Global Wide Bandgap Power (WBG) Semiconductor Power Devices and Modules Sales Market Share by Application (2019-2025)
Figure 25. Global Wide Bandgap Power (WBG) Semiconductor Power Devices and Modules Sales Market Share by Application in 2023
Figure 26. Global Wide Bandgap Power (WBG) Semiconductor Power Devices and Modules Market Share by Application (2019-2025)
Figure 27. Global Wide Bandgap Power (WBG) Semiconductor Power Devices and Modules Market Share by Application in 2023
Figure 28. Global Wide Bandgap Power (WBG) Semiconductor Power Devices and Modules Sales Growth Rate by Application (2019-2025)
Figure 29. Global Wide Bandgap Power (WBG) Semiconductor Power Devices and Modules Sales Market Share by Region (2019-2025)
Figure 30. North America Wide Bandgap Power (WBG) Semiconductor Power Devices and Modules Sales and Growth Rate (2019-2025) & (K Units)
Figure 31. North America Wide Bandgap Power (WBG) Semiconductor Power Devices and Modules Sales Market Share by Country in 2023
Figure 32. U.S. Wide Bandgap Power (WBG) Semiconductor Power Devices and Modules Sales and Growth Rate (2019-2025) & (K Units)
Figure 33. Canada Wide Bandgap Power (WBG) Semiconductor Power Devices and Modules Sales (K Units) and Growth Rate (2019-2025)
Figure 34. Mexico Wide Bandgap Power (WBG) Semiconductor Power Devices and Modules Sales (Units) and Growth Rate (2019-2025)
Figure 35. Europe Wide Bandgap Power (WBG) Semiconductor Power Devices and Modules Sales and Growth Rate (2019-2025) & (K Units)
Figure 36. Europe Wide Bandgap Power (WBG) Semiconductor Power Devices and Modules Sales Market Share by Country in 2023
Figure 37. Germany Wide Bandgap Power (WBG) Semiconductor Power Devices and Modules Sales and Growth Rate (2019-2025) & (K Units)
Figure 38. France Wide Bandgap Power (WBG) Semiconductor Power Devices and Modules Sales and Growth Rate (2019-2025) & (K Units)
Figure 39. U.K. Wide Bandgap Power (WBG) Semiconductor Power Devices and Modules Sales and Growth Rate (2019-2025) & (K Units)
Figure 40. Italy Wide Bandgap Power (WBG) Semiconductor Power Devices and Modules Sales and Growth Rate (2019-2025) & (K Units)
Figure 41. Russia Wide Bandgap Power (WBG) Semiconductor Power Devices and Modules Sales and Growth Rate (2019-2025) & (K Units)
Figure 42. Asia Pacific Wide Bandgap Power (WBG) Semiconductor Power Devices and Modules Sales and Growth Rate (K Units)
Figure 43. Asia Pacific Wide Bandgap Power (WBG) Semiconductor Power Devices and Modules Sales Market Share by Region in 2023
Figure 44. China Wide Bandgap Power (WBG) Semiconductor Power Devices and Modules Sales and Growth Rate (2019-2025) & (K Units)
Figure 45. Japan Wide Bandgap Power (WBG) Semiconductor Power Devices and Modules Sales and Growth Rate (2019-2025) & (K Units)
Figure 46. South Korea Wide Bandgap Power (WBG) Semiconductor Power Devices and Modules Sales and Growth Rate (2019-2025) & (K Units)
Figure 47. India Wide Bandgap Power (WBG) Semiconductor Power Devices and Modules Sales and Growth Rate (2019-2025) & (K Units)
Figure 48. Southeast Asia Wide Bandgap Power (WBG) Semiconductor Power Devices and Modules Sales and Growth Rate (2019-2025) & (K Units)
Figure 49. South America Wide Bandgap Power (WBG) Semiconductor Power Devices and Modules Sales and Growth Rate (K Units)
Figure 50. South America Wide Bandgap Power (WBG) Semiconductor Power Devices and Modules Sales Market Share by Country in 2023
Figure 51. Brazil Wide Bandgap Power (WBG) Semiconductor Power Devices and Modules Sales and Growth Rate (2019-2025) & (K Units)
Figure 52. Argentina Wide Bandgap Power (WBG) Semiconductor Power Devices and Modules Sales and Growth Rate (2019-2025) & (K Units)
Figure 53. Columbia Wide Bandgap Power (WBG) Semiconductor Power Devices and Modules Sales and Growth Rate (2019-2025) & (K Units)
Figure 54. Middle East and Africa Wide Bandgap Power (WBG) Semiconductor Power Devices and Modules Sales and Growth Rate (K Units)
Figure 55. Middle East and Africa Wide Bandgap Power (WBG) Semiconductor Power Devices and Modules Sales Market Share by Region in 2023
Figure 56. Saudi Arabia Wide Bandgap Power (WBG) Semiconductor Power Devices and Modules Sales and Growth Rate (2019-2025) & (K Units)
Figure 57. UAE Wide Bandgap Power (WBG) Semiconductor Power Devices and Modules Sales and Growth Rate (2019-2025) & (K Units)
Figure 58. Egypt Wide Bandgap Power (WBG) Semiconductor Power Devices and Modules Sales and Growth Rate (2019-2025) & (K Units)
Figure 59. Nigeria Wide Bandgap Power (WBG) Semiconductor Power Devices and Modules Sales and Growth Rate (2019-2025) & (K Units)
Figure 60. South Africa Wide Bandgap Power (WBG) Semiconductor Power Devices and Modules Sales and Growth Rate (2019-2025) & (K Units)
Figure 61. Global Wide Bandgap Power (WBG) Semiconductor Power Devices and Modules Sales Forecast by Volume (2019-2030) & (K Units)
Figure 62. Global Wide Bandgap Power (WBG) Semiconductor Power Devices and Modules Market Size Forecast by Value (2019-2030) & (M USD)
Figure 63. Global Wide Bandgap Power (WBG) Semiconductor Power Devices and Modules Sales Market Share Forecast by Type (2025-2030)
Figure 64. Global Wide Bandgap Power (WBG) Semiconductor Power Devices and Modules Market Share Forecast by Type (2025-2030)
Figure 65. Global Wide Bandgap Power (WBG) Semiconductor Power Devices and Modules Sales Forecast by Application (2025-2030)
Figure 66. Global Wide Bandgap Power (WBG) Semiconductor Power Devices and Modules Market Share Forecast by Application (2025-2030)