Computer Peripheral Device Market Size, Emerging Trends, Technological Advancements, and Business Strategies 2026-2034

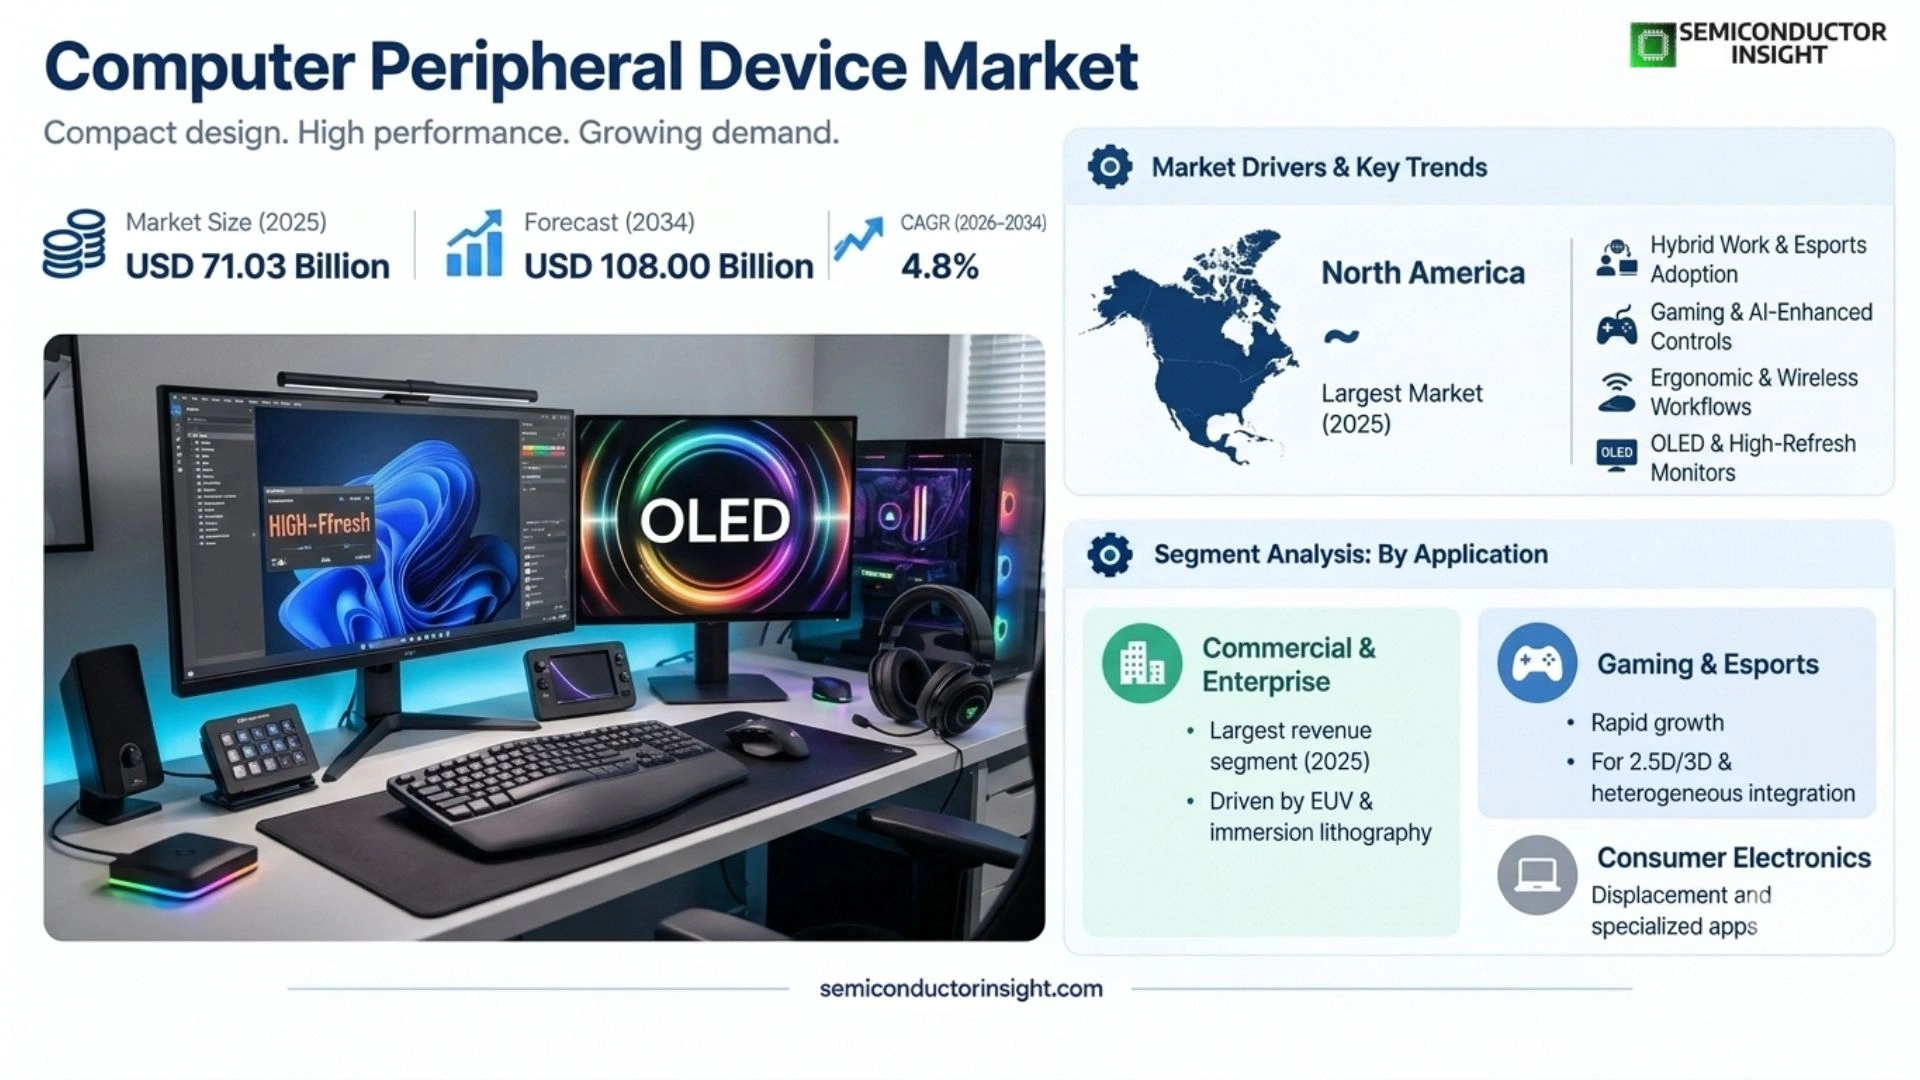
Computer Peripheral Device Market is estimated at USD 74,416.8 million in 2026, and is projected to reach USD 108,003.2 million by 2034, representing a CAGR of 4.8% during 2026–2034. North America is the largest regional market in 2025, while the commercial growth mechanism is increasingly shaped by hybrid work, gaming and esports, AI-enhanced controls, ergonomic design, wireless multi-device workflows, OLED and high-refresh monitors, and e-commerce distribution.

PDF Icon Download Sample Report PDF
  • Quick Dispatch

    All Orders

  • Secure Payment

    100% Secure Payment

Price range: $1,500.00 through $4,250.00

Clear

Key Statistics

2025 Market Size
USD 71,031.4 million
2026 Estimated Size
USD 74,416.8 million
2034 Projected Size
USD 108,003.2 million
CAGR (2026–2034)
4.8%
Largest Market in 2025
North America

Key Takeaways

  • Mouse is the leading product category in the report segmentation, supported by broad PC usage, gaming demand and continued innovation in wireless, ergonomic and haptic designs.
  • Online Retail is the fastest-growing channel as consumers compare specifications, reviews and pricing across a wide range of peripherals and gaming accessories.
  • Commercial users form the largest end-user group because enterprises routinely refresh monitors, keyboards, mice, headsets, printers and collaboration devices alongside PC fleets.
  • North America is the largest quantified regional market, while Asia Pacific is the fastest-growing region and a major manufacturing center for displays, keyboards, mice and other peripherals.
  • AI integration is becoming practical. Logitech’s 2026 MX Keypad provides direct access to coding agents, while HP is adding AI-enabled workflows to printers and workplace devices.
  • Gaming peripherals remain a premium innovation engine, with Hall-effect keyboards, ultra-light mice, high-refresh OLED monitors and software-defined controls supporting higher average selling prices.

Computer Peripheral Device Market Overview

Computer Peripheral Device Market was valued at USD 71,031.4 million in 2025, is estimated at USD 74,416.8 million in 2026, and is projected to reach USD 108,003.2 million by 2034, representing a CAGR of 4.8% during 2026–2034. North America is the largest regional market in 2025, while the commercial growth mechanism is increasingly shaped by hybrid work, gaming and esports, AI-enhanced controls, ergonomic design, wireless multi-device workflows, OLED and high-refresh monitors, and e-commerce distribution.

Base year: 2025 · Estimated year: 2026 · Forecast period: 2026–2034 · Values in USD million unless otherwise stated

Computer peripheral devices are external or companion hardware that extends how users interact with personal computers, workstations and enterprise systems. The category includes mice, keyboards, monitors, printers, scanners, headsets, webcams, docks, storage accessories and specialized gaming or professional control devices. These products span low-cost commodity hardware through premium ergonomic, creator, gaming and medical-grade systems.

The market is increasingly shaped by user experience and software integration rather than basic input/output functionality. Wireless multi-device switching, haptic feedback, Hall-effect key sensing, high-refresh OLED displays, AI shortcuts and programmable control surfaces allow manufacturers to differentiate beyond simple specifications. Enterprise buyers also value manageability, security, sustainability and device standardization across distributed workforces.

Distribution has shifted strongly toward e-commerce, especially for gaming and enthusiast products where buyers compare sensor performance, switch type, polling rate and display characteristics. Commercial and government procurement remains more channel-driven and values lifecycle consistency, support and manageability. This creates distinct go-to-market models across consumer, gaming, professional and enterprise segments.

Segment Analysis: By Type

By type, the market is segmented into Mouse, Keyboard, Monitor, Printer, Scanner, and Others. Mouse is the leading product segment within the report scope, while monitors and gaming peripherals contribute substantial premium value through faster refresh rates, OLED panels and larger screen formats.

Type Technical role Market position
Mouse Includes wired, wireless, gaming, ergonomic and productivity mice using optical sensors, multi-device connectivity, programmable controls and increasingly haptic features. The leading product category in the report scope. Innovation focuses on lower weight, longer battery life, lower latency, ergonomic comfort and software-defined controls.
Keyboard Includes membrane, mechanical, Hall-effect, ergonomic and compact keyboards for home, enterprise and gaming use. A large market supported by PC installed base and gaming. Premium growth comes from low-profile mechanical switches, Hall-effect sensing, programmable controls and multi-device workflows.
Monitor Includes LCD, LED, OLED, curved and high-refresh displays serving office, gaming, creator and professional applications. A high-value segment. OLED, 4K/5K resolution, USB-C docking and very high refresh rates create premium replacement cycles.
Printer Includes inkjet, laser and all-in-one devices for home, enterprise and specialized document workflows. A mature category transitioning toward managed services, secure workflows and AI-assisted document processing.
Scanner Covers document, flatbed, production and specialized scanning devices used in offices, logistics and digitization. A smaller but stable segment linked to document digitization, records management and sector-specific workflows.
Others Includes webcams, headsets, docks, controllers, capture devices, speakers and specialized input hardware. A diversified growth pool benefiting from hybrid work, streaming, gaming and content creation.

Why does peripheral value increasingly come from software and ecosystem integration?

A modern mouse, keyboard or monitor can be physically similar to competing products, but software can add multi-device switching, macro control, application profiles, AI shortcuts, firmware updates and enterprise manageability. Logitech’s MX ecosystem links several devices through one software layer, while Corsair integrates Stream Deck controls into gaming peripherals. These ecosystems increase switching costs and create recurring engagement beyond the initial hardware purchase.

Segment Analysis: By Application

By application, the market is segmented into Offline Retail and Online Retail. Online Retail is the stronger growth channel because consumers can compare a large number of SKUs and purchase directly from brands or e-commerce platforms, while offline channels remain important for hands-on display evaluation and enterprise fulfillment.

Application Demand characteristics
Offline Retail Electronics stores, office-supply chains, gaming shops and reseller channels provide physical product trials, bundled PC sales and local service. A mature but important channel for monitors, keyboards, gaming hardware and customers who value hands-on evaluation or immediate availability.
Online Retail Brand websites, marketplaces and specialist e-commerce sites offer broad assortment, reviews, rapid price comparison and direct-to-consumer launches. The stronger growth channel. Gaming and premium productivity peripherals benefit from detailed online specification comparison and global product launches.

Why are online channels particularly effective for gaming peripherals?

Gaming buyers often evaluate detailed specifications such as sensor DPI, polling rate, keyboard switch type, latency, mouse weight and monitor refresh rate before purchase. E-commerce pages and creator reviews make these comparisons easier than traditional store shelves. Brands can also launch limited editions, esports collaborations and software-linked products directly to enthusiast communities, supporting faster global rollouts and higher-margin direct sales.
Computer Peripheral Device Market Prizing

Regional Analysis

North America is the largest quantified Computer Peripheral Device market, supported by strong enterprise IT spending, premium gaming demand and leading brands. Asia Pacific is the fastest-growing region and a major manufacturing center, while Europe emphasizes ergonomic, sustainable and business-focused products.

How do regional peripheral markets differ?

North America has a high mix of premium professional, gaming and enterprise devices. Asia Pacific combines very large production scale with fast consumer and gaming growth. Europe places greater emphasis on workplace ergonomics, sustainability and energy efficiency. South America is more price sensitive, while the Middle East and Africa show a split between premium Gulf markets and affordability-focused mass markets.

Region Position Growth outlook Demand profile What decides supplier selection
North America Largest quantified market Moderate to strong Enterprise, premium gaming and productivity Brand ecosystem, ergonomics, performance and support
Asia Pacific Fastest-growing & manufacturing hub Strong Consumer, gaming and electronics production Price, local brands, e-commerce and scale
Europe Professional & sustainable market Moderate Commercial, education and ergonomic products Energy efficiency, repairability and lifecycle
South America Price-sensitive growth market Selective Consumer, gaming and SMB demand Affordability, import cost and channel reach
Middle East & Africa Mixed premium/value market Selective Gaming, enterprise and public-sector IT Distribution, imported supply and local service
North America LARGEST QUANTIFIED MARKET

Why does North America support high peripheral spending?

The United States has a large installed base of enterprise PCs, home offices, gaming systems and creator workstations. Buyers frequently refresh premium monitors, keyboards, mice and collaboration devices alongside PC upgrades. Strong brand presence from HP, Dell, Logitech, Corsair, Apple and Microsoft also supports direct product launches and business-channel standardization.

Market positionLargest quantified region
Growth outlookModerate to strong
Demand profileEnterprise and premium consumer
Market access gateEcosystem, performance and support
Country / market Position in region Evidence-led demand logic
United States Primary regional market Enterprise refresh cycles, gaming, creators and hybrid work create broad demand across monitors, input devices, printers and collaboration hardware.
Canada Professional and gaming market High PC penetration and hybrid work support premium ergonomic and gaming peripherals.
Mexico Manufacturing and value-market bridge Electronics assembly and a growing consumer market create demand across both imported premium devices and cost-sensitive peripherals.

8 Sep 2026 – Logitech launches MX Keypad

Logitech introduced a customizable AI control center for developers with direct access to coding tools, agents and application macros.

Market relevance: AI functionality is becoming a tangible peripheral feature rather than a software concept detached from hardware.

12 Aug 2026 – Corsair expands everyday gaming lineup

Corsair introduced SKIFF keyboards and HARPOON v2 Wireless for users balancing gaming and work.

Market relevance: Gaming brands are broadening premium design language into more accessible everyday price tiers.

20 May 2026 – Logitech adds native haptics to MX Master 4

The MX Master 4 gained native Windows 11 haptic feedback for actions such as snapping windows and aligning objects.

Market relevance: Operating-system integration can differentiate productivity peripherals and extend hardware value through firmware updates.

Full-report coverage: Country-level revenue, sales, supplier positioning and forecast detail are retained in the full study; this overview highlights the countries with the clearest, independently supportable demand mechanisms.
Asia Pacific FASTEST-GROWING MANUFACTURING HUB

Why is Asia Pacific central to peripheral growth?

China, Taiwan, South Korea, Japan and Southeast Asia combine display-panel production, electronics assembly, gaming hardware, printer manufacturing and fast-growing consumer markets. The region supports both global brands and local value competitors, making price-performance and rapid product cycles especially important.

Market positionFastest-growing region
Growth outlookStrong
Demand profileConsumer and manufacturing scale
Market access gatePrice, local e-commerce and supply chain
Country / market Position in region Evidence-led demand logic
China Largest regional production and demand base PC accessories, displays, gaming hardware and domestic e-commerce create a large, competitive market spanning entry-level to premium devices.
Japan Printer and premium electronics market Epson and other Japanese suppliers support imaging, office and professional peripheral segments with strong reliability expectations.
South Korea Display and gaming technology hub High-refresh monitors, OLED displays and esports demand support premium peripheral categories.
Taiwan PC and gaming hardware ecosystem ASUS, component suppliers and ODM manufacturing support global peripheral development and production.

2 Jun 2026 – Corsair unveils new peripherals at Computex

Corsair introduced Hall-effect keyboards, gaming mice and headsets in Taiwan.

Market relevance: Computex remains a key launch venue linking Asian manufacturing with global gaming-peripheral demand.

2026 – OLED and high-refresh displays expand

Gaming and creator monitor lineups continue moving toward faster OLED panels and higher resolution.

Market relevance: Display technology is sustaining premium replacement demand despite mature PC penetration.

2025–2026 – e-commerce broadens value-segment access

Regional marketplaces provide wide SKU availability and rapid price comparison.

Market relevance: Online distribution increases competition while allowing local brands to scale faster.

Full-report coverage: Country-level revenue, sales, supplier positioning and forecast detail are retained in the full study; this overview highlights the countries with the clearest, independently supportable demand mechanisms.
Europe ERGONOMIC & SUSTAINABLE PROFESSIONAL MARKET

What differentiates European peripheral demand?

European enterprises and consumers place strong emphasis on ergonomic design, energy use, repairability and product longevity. Germany and the United Kingdom are major commercial markets, while EU sustainability rules and corporate procurement standards encourage lower-power displays, recycled materials and more maintainable workplace equipment.

Market positionEstablished market
Growth outlookModerate
Demand profileProfessional, education and ergonomic
Market access gateSustainability, efficiency and lifecycle
Country / market Position in region Evidence-led demand logic
Germany Largest professional hardware market Enterprise, engineering and gaming users support premium monitors, keyboards, mice and printer fleets.
United Kingdom Hybrid-work and gaming market Professional services, creators and gaming communities sustain high-value peripheral demand.
France Enterprise and public-sector market Commercial, education and government procurement support standardized workplace peripherals and document systems.

2026 – HP expands intelligent workplace devices

HP Imagine 2026 connected AI PCs, printers and workplace devices through the HP IQ software layer.

Market relevance: Enterprise peripheral ecosystems are moving toward centrally managed, software-connected experiences.

2026 – repairability and materials remain product-design priorities

Major brands continue increasing recycled materials, replaceable parts and lower-power operation.

Market relevance: European procurement increasingly evaluates environmental attributes alongside price and performance.

2025–2026 – hybrid work keeps ergonomic demand resilient

Organizations continue standardizing better mice, keyboards, monitors and docks for office and home use.

Market relevance: Comfort and multi-device workflow features remain important even after the initial remote-work surge.

Full-report coverage: Country-level revenue, sales, supplier positioning and forecast detail are retained in the full study; this overview highlights the countries with the clearest, independently supportable demand mechanisms.
South America PRICE-SENSITIVE GROWTH MARKET

Where does peripheral demand develop in South America?

Brazil drives the largest regional demand through consumer PCs, gaming and enterprise IT. Economic volatility and import costs make the market highly price sensitive, but enthusiast users still purchase premium gaming products. Local assembly and distributor inventory can reduce landed cost and improve product availability.

Market positionDeveloping market
Growth outlookSelective
Demand profileConsumer and gaming
Market access gatePrice, import cost and channel reach
Country / market Position in region Evidence-led demand logic
Brazil Largest regional market Gaming, enterprise IT, education and consumer PC usage create broad demand for keyboards, mice, monitors and printers.
Argentina Smaller consumer and professional market Currency and import conditions strongly influence replacement timing and product mix.
Chile Enterprise and gaming niche High urban connectivity supports premium gaming and professional peripherals in a smaller market.

2025–2026 – gaming remains a resilient premium niche

Enthusiast users continue upgrading mice, keyboards and monitors despite broader price sensitivity.

Market relevance: Premium gaming can outperform general consumer peripherals because performance benefits are easy to communicate.

2025–2026 – online retail expands product choice

E-commerce increases access to imported brands and price comparison.

Market relevance: Digital channels reduce dependence on limited local retail assortments.

2026 – enterprise refresh demand remains selective

Commercial buyers replace peripherals with PC fleets and workplace upgrades.

Market relevance: Bundled procurement favors vendors with broad portfolios and local support.

Full-report coverage: Country-level revenue, sales, supplier positioning and forecast detail are retained in the full study; this overview highlights the countries with the clearest, independently supportable demand mechanisms.
Middle East & Africa MIXED PREMIUM & VALUE MARKET

What drives peripheral demand in the Middle East and Africa?

The UAE and Saudi Arabia support premium gaming, enterprise and smart-workplace demand, while broader African markets remain more affordability focused. Dubai acts as a major distribution hub, and South Africa has a large enterprise and gaming market relative to the rest of Africa.

Market positionMixed market
Growth outlookSelective
Demand profileGaming, enterprise and public-sector IT
Market access gateDistribution, affordability and local service
Country / market Position in region Evidence-led demand logic
United Arab Emirates Premium regional hub Gaming, finance, enterprise IT and retail distribution support high-end monitors, mice, keyboards and accessories.
Saudi Arabia Fast-growing gaming and enterprise market Esports investment, government digitization and corporate IT create demand for both premium and mainstream peripherals.
South Africa Largest African demand base Enterprise IT, gaming and education support a broad peripheral market, though price sensitivity remains important.

2025–2026 – esports investment expands in the Gulf

Gaming venues and competitive events raise visibility for performance mice, keyboards, monitors and headsets.

Market relevance: Brand partnerships and premium products benefit from a growing enthusiast ecosystem.

2025–2026 – smart-workplace investment grows

Corporate and government facilities continue upgrading collaboration and desk technology.

Market relevance: Wireless multi-device and centrally managed peripherals gain relevance.

2026 – distribution hubs remain critical

Most products are imported and depend on regional stocking and after-sales support.

Market relevance: Brands with strong UAE and South Africa channels can reduce lead times across neighboring markets.

Full-report coverage: Country-level revenue, sales, supplier positioning and forecast detail are retained in the full study; this overview highlights the countries with the clearest, independently supportable demand mechanisms.

Competitive Landscape

The market includes HP, Dell, Logitech, Apple, Lenovo, Razer, Samsung, ASUS, Corsair, Epson and other specialist peripheral vendors. Competition spans broad PC ecosystems, gaming specialists, display manufacturers and imaging companies.

HP and Dell use broad commercial PC relationships to bundle monitors, docks, keyboards, mice and printers into enterprise deals. Apple follows a tightly integrated ecosystem strategy around Mac, iPad and premium accessories. Lenovo similarly expands peripherals around PC and workplace solutions.

Logitech has a strong position in mice, keyboards, webcams and collaboration hardware and increasingly differentiates through the MX software ecosystem, haptics and AI controls. Corsair and Razer compete aggressively in gaming through sensor performance, Hall-effect switches, ultra-light designs and software-defined controls.

Samsung and ASUS are strong in monitors and gaming displays, while Epson remains important in printers and scanners. Competitive advantage depends on brand, industrial design, firmware/software, retail reach and the ability to launch coordinated products across several peripheral categories.

Competitive tier Representative companies Commercial basis
Broad PC & enterprise ecosystem leaders HP; Dell Technologies; Apple; Lenovo Bundled workplace portfolios, commercial channels, monitors, printers and accessories.
Input & gaming specialists Logitech; Razer; Corsair Mice, keyboards, gaming controls, software ecosystems and enthusiast brand strength.
Display & imaging leaders Samsung Electronics; ASUS; Epson High-refresh displays, monitors, printers, scanners and specialized visual-output hardware.

Key Market Participants

HP Inc., Dell Technologies, Logitech International, Apple Inc., Lenovo Group, Razer Inc., Samsung Electronics, ASUSTeK Computer, Corsair, Epson.

Production Capacity Analysis

Peripheral manufacturing combines plastics, metals, switches, sensors, display panels, motors, batteries, PCBs and firmware. The production model varies widely by category: mice and keyboards rely on high-volume electronics assembly, monitors depend on display-panel supply, and printers add precision mechanical and ink/toner systems.

Input devices use optical sensors, switches, microcontrollers, wireless radios and rechargeable or replaceable batteries. Gaming products add high-polling-rate controllers, custom switches and lighter materials, while enterprise products emphasize durability and secure wireless connectivity.

Monitor production is tied to LCD and OLED panel supply, timing controllers, display interfaces and power electronics. Premium gaming and creator monitors require tighter panel binning, high refresh rates and color calibration.

Printer and scanner manufacturing combines imaging engines, sensors, motors and consumables ecosystems. Increasing software integration adds secure firmware, cloud management and AI-assisted document workflows to the hardware platform.

Capacity layer Where it concentrates Commercial constraint
Sensors, switches & semiconductors Asia Pacific and global component hubs Sensor availability, switch quality, MCU/radio supply and battery performance.
Display panels South Korea, China, Taiwan and Japan OLED/LCD yields, size mix, refresh rate and panel pricing.
Peripheral assembly China, Southeast Asia, Mexico and global EMS sites Automation, labor, tooling, quality and product-change speed.
Software / firmware validation Global brand development centers Cross-platform drivers, security, AI integration and update support.

Market Dynamics

Market growth is supported by hybrid work, gaming and premium device replacement, while commodity categories face price pressure and short product cycles. Software-defined controls, ergonomics and AI are creating new differentiation layers beyond basic hardware specifications.

Market Drivers

Factor Directional impact Why it matters
Hybrid work & enterprise refresh High Organizations standardize monitors, input devices and collaboration hardware across distributed workforces.
Gaming and esports High Performance peripherals command premium pricing and frequent enthusiast upgrades.
AI-enhanced workflows Medium-High Dedicated controls and software shortcuts can simplify access to AI tools.
Wireless multi-device use Medium-High Users increasingly move between PCs, tablets and phones from one desk setup.

Hybrid work keeps desk hardware strategically relevant

Employees split time across office and home environments and often need duplicate or portable setups. Enterprises therefore continue investing in monitors, docks, mice and keyboards that improve comfort and consistency.

Gaming sustains premium product cycles

Competitive players can perceive latency, weight, switch feel and display refresh differences directly. That supports frequent product launches and higher margins than basic office peripherals.

AI creates new control surfaces

AI assistants and coding tools are creating demand for shortcuts, programmable keypads and software profiles. Hardware can become a faster interface to AI workflows rather than simply a generic input device.

Multi-device work increases connectivity value

Bluetooth, proprietary low-latency wireless and USB receivers allow one keyboard or mouse to control several devices. Seamless switching reduces desk clutter and supports mobile work.

Market Restraints

Factor Directional impact Why it matters
Price competition High Commodity mice, keyboards and monitors face intense low-cost competition.
Short product cycles Medium-High Gaming and display technologies can make models obsolete quickly.
Component and panel volatility Medium Display panels, sensors and memory can affect availability and margin.
Compatibility & certification Medium Wireless, drivers and operating-system changes create ongoing support costs.

Commodity categories have limited pricing power

Basic wired keyboards and mice are widely available from many brands. Premium suppliers must justify higher pricing through ergonomics, wireless performance, software or design.

Fast innovation creates inventory risk

Gaming mice, keyboards and monitors are refreshed frequently. Old inventory can require discounting when a new sensor, switch or display generation launches.

Component cycles affect profitability

OLED panels, microcontrollers, sensors and batteries can tighten or decline in price at different times. Brands need flexible sourcing to avoid supply gaps or excess cost.

Compatibility must be maintained continuously

Peripheral software must work across Windows, macOS, consoles and enterprise environments. Firmware and driver updates add lifecycle cost long after the initial hardware sale.

Market Opportunities

AI control peripherals

Keypads, mice and keyboards can offer direct access to coding agents, assistants and repeatable prompt/workflow macros.

Ergonomic commercial hardware

Enterprises can standardize healthier desk setups and reduce user discomfort through premium mice, keyboards and monitor arms.

OLED and high-refresh monitors

Gaming and creator demand supports premium display replacement and larger-screen formats.

Repairable and sustainable peripherals

Replaceable parts, recycled materials and longer software support can differentiate products in enterprise and European procurement.

Supply Chain Analysis

ComponentsSensors, switches, panels, batteries, MCUs and plastics form the hardware bill of materials.
Product Design & AssemblyBrands and ODMs integrate mechanical design, electronics, wireless and displays.
Firmware & SoftwareDrivers, AI shortcuts, profiles and update tools add differentiated functionality.
Retail / Enterprise DistributionProducts reach buyers through e-commerce, stores, resellers and commercial procurement.

Components. Peripheral supply chains depend on display panels, optical sensors, switches, controllers and batteries. Gaming and premium productivity products often use custom components that require closer supplier coordination.

Product Design & Assembly. ODM and contract-manufacturing networks turn brand specifications into high-volume hardware. Ergonomics, weight, acoustic feel and mechanical durability are key design variables.

Firmware & Software. Software increasingly controls device profiles, multi-device switching, haptics, macros and AI access. Stable update systems can extend product life and deepen customer loyalty.

Retail / Enterprise Distribution. Consumer products rely heavily on online retail, while enterprise devices move through resellers and direct commercial agreements. Inventory planning differs sharply between fast-cycle gaming products and long-lifecycle business devices.

Recent Developments in the Computer Peripheral Device Market

Developments tracked to September 2026. Entries are dated to the official publication date where available.

  • 8 September 2026 AI control
    Logitech introduced MX Keypad, a customizable multi-app AI control center for developers. The device can trigger prompt macros and commands across coding tools and IDEs, demonstrating a new AI-native peripheral category. Source
  • 12 August 2026 Gaming peripherals
    Corsair launched SKIFF 100 series keyboards and the HARPOON v2 Wireless mouse. The lineup targets users balancing work and gaming with programmable controls and wireless ergonomics. Source
  • 10 August 2026 Software integration
    Corsair released the NIGHTSWORD v2 Wireless SD gaming mouse with a dedicated Stream Deck launch button. The design integrates virtual control panels directly into the mouse workflow. Source
  • 20 May 2026 Productivity
    Logitech enabled native Windows 11 haptic feedback on the MX Master 4 mouse. Firmware and operating-system integration extend hardware functionality without a physical product redesign. Source
  • 5 January 2026 Display & gaming
    HP unified OMEN and HyperX under the HyperX gaming brand and introduced a 34-inch QD-OLED gaming monitor. The move strengthens end-to-end gaming ecosystem competition across PCs and peripherals. Source

Report Scope & Segmentation

Attribute Coverage
Report title Computer Peripheral Device Market Size, Emerging Trends, Technological Advancements, and Business Strategies 2026-2034
Base / estimate / forecast 2025 base year; 2026 estimated year; 2034 forecast end year; CAGR measured for 2026–2034.
By Type Mouse; Keyboard; Monitor; Printer; Scanner; Others
By Application Offline Retail; Online Retail
By End User Residential; Commercial; Industrial; Government
By Mouse Subtype Wired; Wireless; Gaming
By Keyboard Subtype Mechanical; Membrane; Ergonomic
By Monitor Subtype LCD; LED; OLED; Curved
By Printer Subtype Inkjet; Laser; All-in-One
Regions North America, Europe, Asia-Pacific, South America, and Middle East & Africa, with country-level analysis across the principal national markets.
Companies HP Inc., Dell Technologies, Logitech International, Apple Inc., Lenovo Group, Razer Inc., Samsung Electronics, ASUSTeK Computer, Corsair, Epson
Customization Scope Free report customization (equivalent to up to 4 analyst working days) with purchase. Addition or alteration to country, regional and segment scope.

Frequently Asked Questions

What is the size of the Computer Peripheral Device market?

The global Computer Peripheral Device market is valued at USD 71,031.4 million in 2025, is estimated at USD 74,416.8 million in 2026, and is projected to reach USD 108,003.2 million by 2034, representing a 4.8% CAGR during 2026–2034.

Which region leads the Computer Peripheral Device market?

North America is the largest quantified market, while Asia Pacific is the fastest-growing region and a major manufacturing center.

Which product type leads the market?

Mouse leads within the report segmentation, supported by gaming, productivity and continued wireless/ergonomic innovation.

Which sales channel is growing fastest?

Online Retail is the stronger growth channel because buyers can compare detailed specifications, reviews and pricing across many peripheral SKUs.

Which end-user group is largest?

Commercial users account for a major share because enterprises routinely refresh monitors, keyboards, mice, printers and collaboration devices with PC fleets.

How is AI changing computer peripherals?

AI is creating dedicated control surfaces, programmable shortcuts, document workflows and context-aware software features that make peripherals more integrated with user applications.

What are the main restraints?

Commodity price competition, short product cycles, component and display-panel volatility, and software compatibility costs are the main restraints.

Who are the major peripheral companies?

Major companies include HP, Dell, Logitech, Apple, Lenovo, Razer, Samsung, ASUS, Corsair and Epson.

Why are gaming peripherals important?

Gaming products support premium sensors, Hall-effect switches, ultra-light materials and high-refresh displays, creating faster innovation and higher average selling prices.

Where are the strongest opportunities?

The strongest opportunities are in AI control peripherals, ergonomic commercial hardware, OLED/high-refresh monitors and more repairable, sustainable product designs.

Research Sources & Evidence Base
View research sources used for this overview
  1. Logitech. MX Keypad for Developers, 2026 AI control surface for coding and multi-app workflows..
  2. Logitech. MX Master 4 Native Windows 11 Haptics, Haptic productivity mouse and operating-system integration..
  3. Logitech. MX Ecosystem Updates, Multi-device switching, software profiles and ecosystem features..
  4. Corsair. Everyday Gaming Peripherals, 2026 keyboard and wireless-mouse product expansion..
  5. Corsair. Computex 2026 Gaming Peripherals, Hall-effect keyboard, gaming mouse and headset innovation..
  6. HP. HyperX and OMEN Gaming Portfolio, QD-OLED monitor and gaming ecosystem strategy..
  7. HP. Future of Work 2026, AI-enabled printers and connected workplace-device strategy..
Computer Peripheral Device Market Size, Emerging Trends, Technological Advancements, and Business Strategies 2026-2034

Get Sample Report PDF for Exclusive Insights

Report Sample Includes

  • Table of Contents
  • List of Tables & Figures
  • Charts, Research Methodology, and more...

PDF Icon Download Sample Report PDF

Download Sample Report

Table of Content

1 Introduction to Research & Analysis Reports
1.1 Computer Peripheral Device Market Definition
1.2 Market Segments
1.2.1 Segment by Type
1.2.2 Segment by Application
1.3 Global Computer Peripheral Device Market Overview
1.4 Features & Benefits of This Report
1.5 Methodology & Sources of Information
1.5.1 Research Methodology
1.5.2 Research Process
1.5.3 Base Year
1.5.4 Report Assumptions & Caveats
2 Global Computer Peripheral Device Overall Market Size
2.1 Global Computer Peripheral Device Market Size: 2024 VS 2032
2.2 Global Computer Peripheral Device Market Size, Prospects & Forecasts: 2020-2032
2.3 Global Computer Peripheral Device Sales: 2020-2032
3 Company Landscape
3.1 Top Computer Peripheral Device Players in Global Market
3.2 Top Global Computer Peripheral Device Companies Ranked by Revenue
3.3 Global Computer Peripheral Device Revenue by Companies
3.4 Global Computer Peripheral Device Sales by Companies
3.5 Global Computer Peripheral Device Price by Manufacturer (2020-2025)
3.6 Top 3 and Top 5 Computer Peripheral Device Companies in Global Market, by Revenue in 2024
3.7 Global Manufacturers Computer Peripheral Device Product Type
3.8 Tier 1, Tier 2, and Tier 3 Computer Peripheral Device Players in Global Market
3.8.1 List of Global Tier 1 Computer Peripheral Device Companies
3.8.2 List of Global Tier 2 and Tier 3 Computer Peripheral Device Companies
4 Sights by Product
4.1 Overview
4.1.1 Segment by Type – Global Computer Peripheral Device Market Size Markets, 2024 & 2032
4.1.2 Mouse
4.1.3 Keyboard
4.1.4 Monitor
4.1.5 Printer
4.1.6 Scanner
4.1.7 Others
4.2 Segment by Type – Global Computer Peripheral Device Revenue & Forecasts
4.2.1 Segment by Type – Global Computer Peripheral Device Revenue, 2020-2025
4.2.2 Segment by Type – Global Computer Peripheral Device Revenue, 2026-2032
4.2.3 Segment by Type – Global Computer Peripheral Device Revenue Market Share, 2020-2032
4.3 Segment by Type – Global Computer Peripheral Device Sales & Forecasts
4.3.1 Segment by Type – Global Computer Peripheral Device Sales, 2020-2025
4.3.2 Segment by Type – Global Computer Peripheral Device Sales, 2026-2032
4.3.3 Segment by Type – Global Computer Peripheral Device Sales Market Share, 2020-2032
4.4 Segment by Type – Global Computer Peripheral Device Price (Manufacturers Selling Prices), 2020-2032
5 Sights by Application
5.1 Overview
5.1.1 Segment by Application – Global Computer Peripheral Device Market Size, 2024 & 2032
5.1.2 Offline Retail
5.1.3 Online Retail
5.2 Segment by Application – Global Computer Peripheral Device Revenue & Forecasts
5.2.1 Segment by Application – Global Computer Peripheral Device Revenue, 2020-2025
5.2.2 Segment by Application – Global Computer Peripheral Device Revenue, 2026-2032
5.2.3 Segment by Application – Global Computer Peripheral Device Revenue Market Share, 2020-2032
5.3 Segment by Application – Global Computer Peripheral Device Sales & Forecasts
5.3.1 Segment by Application – Global Computer Peripheral Device Sales, 2020-2025
5.3.2 Segment by Application – Global Computer Peripheral Device Sales, 2026-2032
5.3.3 Segment by Application – Global Computer Peripheral Device Sales Market Share, 2020-2032
5.4 Segment by Application – Global Computer Peripheral Device Price (Manufacturers Selling Prices), 2020-2032
6 Sights by Region
6.1 By Region – Global Computer Peripheral Device Market Size, 2024 & 2032
6.2 By Region – Global Computer Peripheral Device Revenue & Forecasts
6.2.1 By Region – Global Computer Peripheral Device Revenue, 2020-2025
6.2.2 By Region – Global Computer Peripheral Device Revenue, 2026-2032
6.2.3 By Region – Global Computer Peripheral Device Revenue Market Share, 2020-2032
6.3 By Region – Global Computer Peripheral Device Sales & Forecasts
6.3.1 By Region – Global Computer Peripheral Device Sales, 2020-2025
6.3.2 By Region – Global Computer Peripheral Device Sales, 2026-2032
6.3.3 By Region – Global Computer Peripheral Device Sales Market Share, 2020-2032
6.4 North America
6.4.1 By Country – North America Computer Peripheral Device Revenue, 2020-2032
6.4.2 By Country – North America Computer Peripheral Device Sales, 2020-2032
6.4.3 United States Computer Peripheral Device Market Size, 2020-2032
6.4.4 Canada Computer Peripheral Device Market Size, 2020-2032
6.4.5 Mexico Computer Peripheral Device Market Size, 2020-2032
6.5 Europe
6.5.1 By Country – Europe Computer Peripheral Device Revenue, 2020-2032
6.5.2 By Country – Europe Computer Peripheral Device Sales, 2020-2032
6.5.3 Germany Computer Peripheral Device Market Size, 2020-2032
6.5.4 France Computer Peripheral Device Market Size, 2020-2032
6.5.5 U.K. Computer Peripheral Device Market Size, 2020-2032
6.5.6 Italy Computer Peripheral Device Market Size, 2020-2032
6.5.7 Russia Computer Peripheral Device Market Size, 2020-2032
6.5.8 Nordic Countries Computer Peripheral Device Market Size, 2020-2032
6.5.9 Benelux Computer Peripheral Device Market Size, 2020-2032
6.6 Asia
6.6.1 By Region – Asia Computer Peripheral Device Revenue, 2020-2032
6.6.2 By Region – Asia Computer Peripheral Device Sales, 2020-2032
6.6.3 China Computer Peripheral Device Market Size, 2020-2032
6.6.4 Japan Computer Peripheral Device Market Size, 2020-2032
6.6.5 South Korea Computer Peripheral Device Market Size, 2020-2032
6.6.6 Southeast Asia Computer Peripheral Device Market Size, 2020-2032
6.6.7 India Computer Peripheral Device Market Size, 2020-2032
6.7 South America
6.7.1 By Country – South America Computer Peripheral Device Revenue, 2020-2032
6.7.2 By Country – South America Computer Peripheral Device Sales, 2020-2032
6.7.3 Brazil Computer Peripheral Device Market Size, 2020-2032
6.7.4 Argentina Computer Peripheral Device Market Size, 2020-2032
6.8 Middle East & Africa
6.8.1 By Country – Middle East & Africa Computer Peripheral Device Revenue, 2020-2032
6.8.2 By Country – Middle East & Africa Computer Peripheral Device Sales, 2020-2032
6.8.3 Turkey Computer Peripheral Device Market Size, 2020-2032
6.8.4 Israel Computer Peripheral Device Market Size, 2020-2032
6.8.5 Saudi Arabia Computer Peripheral Device Market Size, 2020-2032
6.8.6 UAE Computer Peripheral Device Market Size, 2020-2032
7 Manufacturers & Brands Profiles
7.1 HP
7.1.1 HP Company Summary
7.1.2 HP Business Overview
7.1.3 HP Computer Peripheral Device Major Product Offerings
7.1.4 HP Computer Peripheral Device Sales and Revenue in Global (2020-2025)
7.1.5 HP Key News & Latest Developments
7.2 IBM
7.2.1 IBM Company Summary
7.2.2 IBM Business Overview
7.2.3 IBM Computer Peripheral Device Major Product Offerings
7.2.4 IBM Computer Peripheral Device Sales and Revenue in Global (2020-2025)
7.2.5 IBM Key News & Latest Developments
7.3 Apple
7.3.1 Apple Company Summary
7.3.2 Apple Business Overview
7.3.3 Apple Computer Peripheral Device Major Product Offerings
7.3.4 Apple Computer Peripheral Device Sales and Revenue in Global (2020-2025)
7.3.5 Apple Key News & Latest Developments
7.4 Logitech
7.4.1 Logitech Company Summary
7.4.2 Logitech Business Overview
7.4.3 Logitech Computer Peripheral Device Major Product Offerings
7.4.4 Logitech Computer Peripheral Device Sales and Revenue in Global (2020-2025)
7.4.5 Logitech Key News & Latest Developments
7.5 Epson
7.5.1 Epson Company Summary
7.5.2 Epson Business Overview
7.5.3 Epson Computer Peripheral Device Major Product Offerings
7.5.4 Epson Computer Peripheral Device Sales and Revenue in Global (2020-2025)
7.5.5 Epson Key News & Latest Developments
7.6 Corsair
7.6.1 Corsair Company Summary
7.6.2 Corsair Business Overview
7.6.3 Corsair Computer Peripheral Device Major Product Offerings
7.6.4 Corsair Computer Peripheral Device Sales and Revenue in Global (2020-2025)
7.6.5 Corsair Key News & Latest Developments
7.7 Microsoft
7.7.1 Microsoft Company Summary
7.7.2 Microsoft Business Overview
7.7.3 Microsoft Computer Peripheral Device Major Product Offerings
7.7.4 Microsoft Computer Peripheral Device Sales and Revenue in Global (2020-2025)
7.7.5 Microsoft Key News & Latest Developments
7.8 Razer
7.8.1 Razer Company Summary
7.8.2 Razer Business Overview
7.8.3 Razer Computer Peripheral Device Major Product Offerings
7.8.4 Razer Computer Peripheral Device Sales and Revenue in Global (2020-2025)
7.8.5 Razer Key News & Latest Developments
7.9 Asus
7.9.1 Asus Company Summary
7.9.2 Asus Business Overview
7.9.3 Asus Computer Peripheral Device Major Product Offerings
7.9.4 Asus Computer Peripheral Device Sales and Revenue in Global (2020-2025)
7.9.5 Asus Key News & Latest Developments
7.10 Alienware
7.10.1 Alienware Company Summary
7.10.2 Alienware Business Overview
7.10.3 Alienware Computer Peripheral Device Major Product Offerings
7.10.4 Alienware Computer Peripheral Device Sales and Revenue in Global (2020-2025)
7.10.5 Alienware Key News & Latest Developments
8 Global Computer Peripheral Device Production Capacity, Analysis
8.1 Global Computer Peripheral Device Production Capacity, 2020-2032
8.2 Computer Peripheral Device Production Capacity of Key Manufacturers in Global Market
8.3 Global Computer Peripheral Device Production by Region
9 Key Market Trends, Opportunity, Drivers and Restraints
9.1 Market Opportunities & Trends
9.2 Market Drivers
9.3 Market Restraints
10 Computer Peripheral Device Supply Chain Analysis
10.1 Computer Peripheral Device Industry Value Chain
10.2 Computer Peripheral Device Upstream Market
10.3 Computer Peripheral Device Downstream and Clients
10.4 Marketing Channels Analysis
10.4.1 Marketing Channels
10.4.2 Computer Peripheral Device Distributors and Sales Agents in Global
11 Conclusion
12 Appendix
12.1 Note
12.2 Examples of Clients
12.3 DisclaimerList of Tables
Table 1. Key Players of Computer Peripheral Device in Global Market
Table 2. Top Computer Peripheral Device Players in Global Market, Ranking by Revenue (2024)
Table 3. Global Computer Peripheral Device Revenue by Companies, (US$, Mn), 2020-2025
Table 4. Global Computer Peripheral Device Revenue Share by Companies, 2020-2025
Table 5. Global Computer Peripheral Device Sales by Companies, (K Units), 2020-2025
Table 6. Global Computer Peripheral Device Sales Share by Companies, 2020-2025
Table 7. Key Manufacturers Computer Peripheral Device Price (2020-2025) & (US$/Unit)
Table 8. Global Manufacturers Computer Peripheral Device Product Type
Table 9. List of Global Tier 1 Computer Peripheral Device Companies, Revenue (US$, Mn) in 2024 and Market Share
Table 10. List of Global Tier 2 and Tier 3 Computer Peripheral Device Companies, Revenue (US$, Mn) in 2024 and Market Share
Table 11. Segment by Type – Global Computer Peripheral Device Revenue, (US$, Mn), 2024 & 2032
Table 12. Segment by Type – Global Computer Peripheral Device Revenue (US$, Mn), 2020-2025
Table 13. Segment by Type – Global Computer Peripheral Device Revenue (US$, Mn), 2026-2032
Table 14. Segment by Type – Global Computer Peripheral Device Sales (K Units), 2020-2025
Table 15. Segment by Type – Global Computer Peripheral Device Sales (K Units), 2026-2032
Table 16. Segment by Application – Global Computer Peripheral Device Revenue, (US$, Mn), 2024 & 2032
Table 17. Segment by Application – Global Computer Peripheral Device Revenue, (US$, Mn), 2020-2025
Table 18. Segment by Application – Global Computer Peripheral Device Revenue, (US$, Mn), 2026-2032
Table 19. Segment by Application – Global Computer Peripheral Device Sales, (K Units), 2020-2025
Table 20. Segment by Application – Global Computer Peripheral Device Sales, (K Units), 2026-2032
Table 21. By Region – Global Computer Peripheral Device Revenue, (US$, Mn), 2025-2032
Table 22. By Region – Global Computer Peripheral Device Revenue, (US$, Mn), 2020-2025
Table 23. By Region – Global Computer Peripheral Device Revenue, (US$, Mn), 2026-2032
Table 24. By Region – Global Computer Peripheral Device Sales, (K Units), 2020-2025
Table 25. By Region – Global Computer Peripheral Device Sales, (K Units), 2026-2032
Table 26. By Country – North America Computer Peripheral Device Revenue, (US$, Mn), 2020-2025
Table 27. By Country – North America Computer Peripheral Device Revenue, (US$, Mn), 2026-2032
Table 28. By Country – North America Computer Peripheral Device Sales, (K Units), 2020-2025
Table 29. By Country – North America Computer Peripheral Device Sales, (K Units), 2026-2032
Table 30. By Country – Europe Computer Peripheral Device Revenue, (US$, Mn), 2020-2025
Table 31. By Country – Europe Computer Peripheral Device Revenue, (US$, Mn), 2026-2032
Table 32. By Country – Europe Computer Peripheral Device Sales, (K Units), 2020-2025
Table 33. By Country – Europe Computer Peripheral Device Sales, (K Units), 2026-2032
Table 34. By Region – Asia Computer Peripheral Device Revenue, (US$, Mn), 2020-2025
Table 35. By Region – Asia Computer Peripheral Device Revenue, (US$, Mn), 2026-2032
Table 36. By Region – Asia Computer Peripheral Device Sales, (K Units), 2020-2025
Table 37. By Region – Asia Computer Peripheral Device Sales, (K Units), 2026-2032
Table 38. By Country – South America Computer Peripheral Device Revenue, (US$, Mn), 2020-2025
Table 39. By Country – South America Computer Peripheral Device Revenue, (US$, Mn), 2026-2032
Table 40. By Country – South America Computer Peripheral Device Sales, (K Units), 2020-2025
Table 41. By Country – South America Computer Peripheral Device Sales, (K Units), 2026-2032
Table 42. By Country – Middle East & Africa Computer Peripheral Device Revenue, (US$, Mn), 2020-2025
Table 43. By Country – Middle East & Africa Computer Peripheral Device Revenue, (US$, Mn), 2026-2032
Table 44. By Country – Middle East & Africa Computer Peripheral Device Sales, (K Units), 2020-2025
Table 45. By Country – Middle East & Africa Computer Peripheral Device Sales, (K Units), 2026-2032
Table 46. HP Company Summary
Table 47. HP Computer Peripheral Device Product Offerings
Table 48. HP Computer Peripheral Device Sales (K Units), Revenue (US$, Mn) and Average Price (US$/Unit) & (2020-2025)
Table 49. HP Key News & Latest Developments
Table 50. IBM Company Summary
Table 51. IBM Computer Peripheral Device Product Offerings
Table 52. IBM Computer Peripheral Device Sales (K Units), Revenue (US$, Mn) and Average Price (US$/Unit) & (2020-2025)
Table 53. IBM Key News & Latest Developments
Table 54. Apple Company Summary
Table 55. Apple Computer Peripheral Device Product Offerings
Table 56. Apple Computer Peripheral Device Sales (K Units), Revenue (US$, Mn) and Average Price (US$/Unit) & (2020-2025)
Table 57. Apple Key News & Latest Developments
Table 58. Logitech Company Summary
Table 59. Logitech Computer Peripheral Device Product Offerings
Table 60. Logitech Computer Peripheral Device Sales (K Units), Revenue (US$, Mn) and Average Price (US$/Unit) & (2020-2025)
Table 61. Logitech Key News & Latest Developments
Table 62. Epson Company Summary
Table 63. Epson Computer Peripheral Device Product Offerings
Table 64. Epson Computer Peripheral Device Sales (K Units), Revenue (US$, Mn) and Average Price (US$/Unit) & (2020-2025)
Table 65. Epson Key News & Latest Developments
Table 66. Corsair Company Summary
Table 67. Corsair Computer Peripheral Device Product Offerings
Table 68. Corsair Computer Peripheral Device Sales (K Units), Revenue (US$, Mn) and Average Price (US$/Unit) & (2020-2025)
Table 69. Corsair Key News & Latest Developments
Table 70. Microsoft Company Summary
Table 71. Microsoft Computer Peripheral Device Product Offerings
Table 72. Microsoft Computer Peripheral Device Sales (K Units), Revenue (US$, Mn) and Average Price (US$/Unit) & (2020-2025)
Table 73. Microsoft Key News & Latest Developments
Table 74. Razer Company Summary
Table 75. Razer Computer Peripheral Device Product Offerings
Table 76. Razer Computer Peripheral Device Sales (K Units), Revenue (US$, Mn) and Average Price (US$/Unit) & (2020-2025)
Table 77. Razer Key News & Latest Developments
Table 78. Asus Company Summary
Table 79. Asus Computer Peripheral Device Product Offerings
Table 80. Asus Computer Peripheral Device Sales (K Units), Revenue (US$, Mn) and Average Price (US$/Unit) & (2020-2025)
Table 81. Asus Key News & Latest Developments
Table 82. Alienware Company Summary
Table 83. Alienware Computer Peripheral Device Product Offerings
Table 84. Alienware Computer Peripheral Device Sales (K Units), Revenue (US$, Mn) and Average Price (US$/Unit) & (2020-2025)
Table 85. Alienware Key News & Latest Developments
Table 86. Computer Peripheral Device Capacity of Key Manufacturers in Global Market, 2023-2025 (K Units)
Table 87. Global Computer Peripheral Device Capacity Market Share of Key Manufacturers, 2023-2025
Table 88. Global Computer Peripheral Device Production by Region, 2020-2025 (K Units)
Table 89. Global Computer Peripheral Device Production by Region, 2026-2032 (K Units)
Table 90. Computer Peripheral Device Market Opportunities & Trends in Global Market
Table 91. Computer Peripheral Device Market Drivers in Global Market
Table 92. Computer Peripheral Device Market Restraints in Global Market
Table 93. Computer Peripheral Device Raw Materials
Table 94. Computer Peripheral Device Raw Materials Suppliers in Global Market
Table 95. Typical Computer Peripheral Device Downstream
Table 96. Computer Peripheral Device Downstream Clients in Global Market
Table 97. Computer Peripheral Device Distributors and Sales Agents in Global Market

List of Figures
Figure 1. Computer Peripheral Device Product Picture
Figure 2. Computer Peripheral Device Segment by Type in 2024
Figure 3. Computer Peripheral Device Segment by Application in 2024
Figure 4. Global Computer Peripheral Device Market Overview: 2024
Figure 5. Key Caveats
Figure 6. Global Computer Peripheral Device Market Size: 2024 VS 2032 (US$, Mn)
Figure 7. Global Computer Peripheral Device Revenue: 2020-2032 (US$, Mn)
Figure 8. Computer Peripheral Device Sales in Global Market: 2020-2032 (K Units)
Figure 9. The Top 3 and 5 Players Market Share by Computer Peripheral Device Revenue in 2024
Figure 10. Segment by Type – Global Computer Peripheral Device Revenue, (US$, Mn), 2024 & 2032
Figure 11. Segment by Type – Global Computer Peripheral Device Revenue Market Share, 2020-2032
Figure 12. Segment by Type – Global Computer Peripheral Device Sales Market Share, 2020-2032
Figure 13. Segment by Type – Global Computer Peripheral Device Price (US$/Unit), 2020-2032
Figure 14. Segment by Application – Global Computer Peripheral Device Revenue, (US$, Mn), 2024 & 2032
Figure 15. Segment by Application – Global Computer Peripheral Device Revenue Market Share, 2020-2032
Figure 16. Segment by Application – Global Computer Peripheral Device Sales Market Share, 2020-2032
Figure 17. Segment by Application -Global Computer Peripheral Device Price (US$/Unit), 2020-2032
Figure 18. By Region – Global Computer Peripheral Device Revenue, (US$, Mn), 2025 & 2032
Figure 19. By Region – Global Computer Peripheral Device Revenue Market Share, 2020 VS 2024 VS 2032
Figure 20. By Region – Global Computer Peripheral Device Revenue Market Share, 2020-2032
Figure 21. By Region – Global Computer Peripheral Device Sales Market Share, 2020-2032
Figure 22. By Country – North America Computer Peripheral Device Revenue Market Share, 2020-2032
Figure 23. By Country – North America Computer Peripheral Device Sales Market Share, 2020-2032
Figure 24. United States Computer Peripheral Device Revenue, (US$, Mn), 2020-2032
Figure 25. Canada Computer Peripheral Device Revenue, (US$, Mn), 2020-2032
Figure 26. Mexico Computer Peripheral Device Revenue, (US$, Mn), 2020-2032
Figure 27. By Country – Europe Computer Peripheral Device Revenue Market Share, 2020-2032
Figure 28. By Country – Europe Computer Peripheral Device Sales Market Share, 2020-2032
Figure 29. Germany Computer Peripheral Device Revenue, (US$, Mn), 2020-2032
Figure 30. France Computer Peripheral Device Revenue, (US$, Mn), 2020-2032
Figure 31. U.K. Computer Peripheral Device Revenue, (US$, Mn), 2020-2032
Figure 32. Italy Computer Peripheral Device Revenue, (US$, Mn), 2020-2032
Figure 33. Russia Computer Peripheral Device Revenue, (US$, Mn), 2020-2032
Figure 34. Nordic Countries Computer Peripheral Device Revenue, (US$, Mn), 2020-2032
Figure 35. Benelux Computer Peripheral Device Revenue, (US$, Mn), 2020-2032
Figure 36. By Region – Asia Computer Peripheral Device Revenue Market Share, 2020-2032
Figure 37. By Region – Asia Computer Peripheral Device Sales Market Share, 2020-2032
Figure 38. China Computer Peripheral Device Revenue, (US$, Mn), 2020-2032
Figure 39. Japan Computer Peripheral Device Revenue, (US$, Mn), 2020-2032
Figure 40. South Korea Computer Peripheral Device Revenue, (US$, Mn), 2020-2032
Figure 41. Southeast Asia Computer Peripheral Device Revenue, (US$, Mn), 2020-2032
Figure 42. India Computer Peripheral Device Revenue, (US$, Mn), 2020-2032
Figure 43. By Country – South America Computer Peripheral Device Revenue Market Share, 2020-2032
Figure 44. By Country – South America Computer Peripheral Device Sales, Market Share, 2020-2032
Figure 45. Brazil Computer Peripheral Device Revenue, (US$, Mn), 2020-2032
Figure 46. Argentina Computer Peripheral Device Revenue, (US$, Mn), 2020-2032
Figure 47. By Country – Middle East & Africa Computer Peripheral Device Revenue, Market Share, 2020-2032
Figure 48. By Country – Middle East & Africa Computer Peripheral Device Sales, Market Share, 2020-2032
Figure 49. Turkey Computer Peripheral Device Revenue, (US$, Mn), 2020-2032
Figure 50. Israel Computer Peripheral Device Revenue, (US$, Mn), 2020-2032
Figure 51. Saudi Arabia Computer Peripheral Device Revenue, (US$, Mn), 2020-2032
Figure 52. UAE Computer Peripheral Device Revenue, (US$, Mn), 2020-2032
Figure 53. Global Computer Peripheral Device Production Capacity (K Units), 2020-2032
Figure 54. The Percentage of Production Computer Peripheral Device by Region, 2024 VS 2032
Figure 55. Computer Peripheral Device Industry Value Chain
Figure 56. Marketing Channels