Key Statistics
Key Takeaways
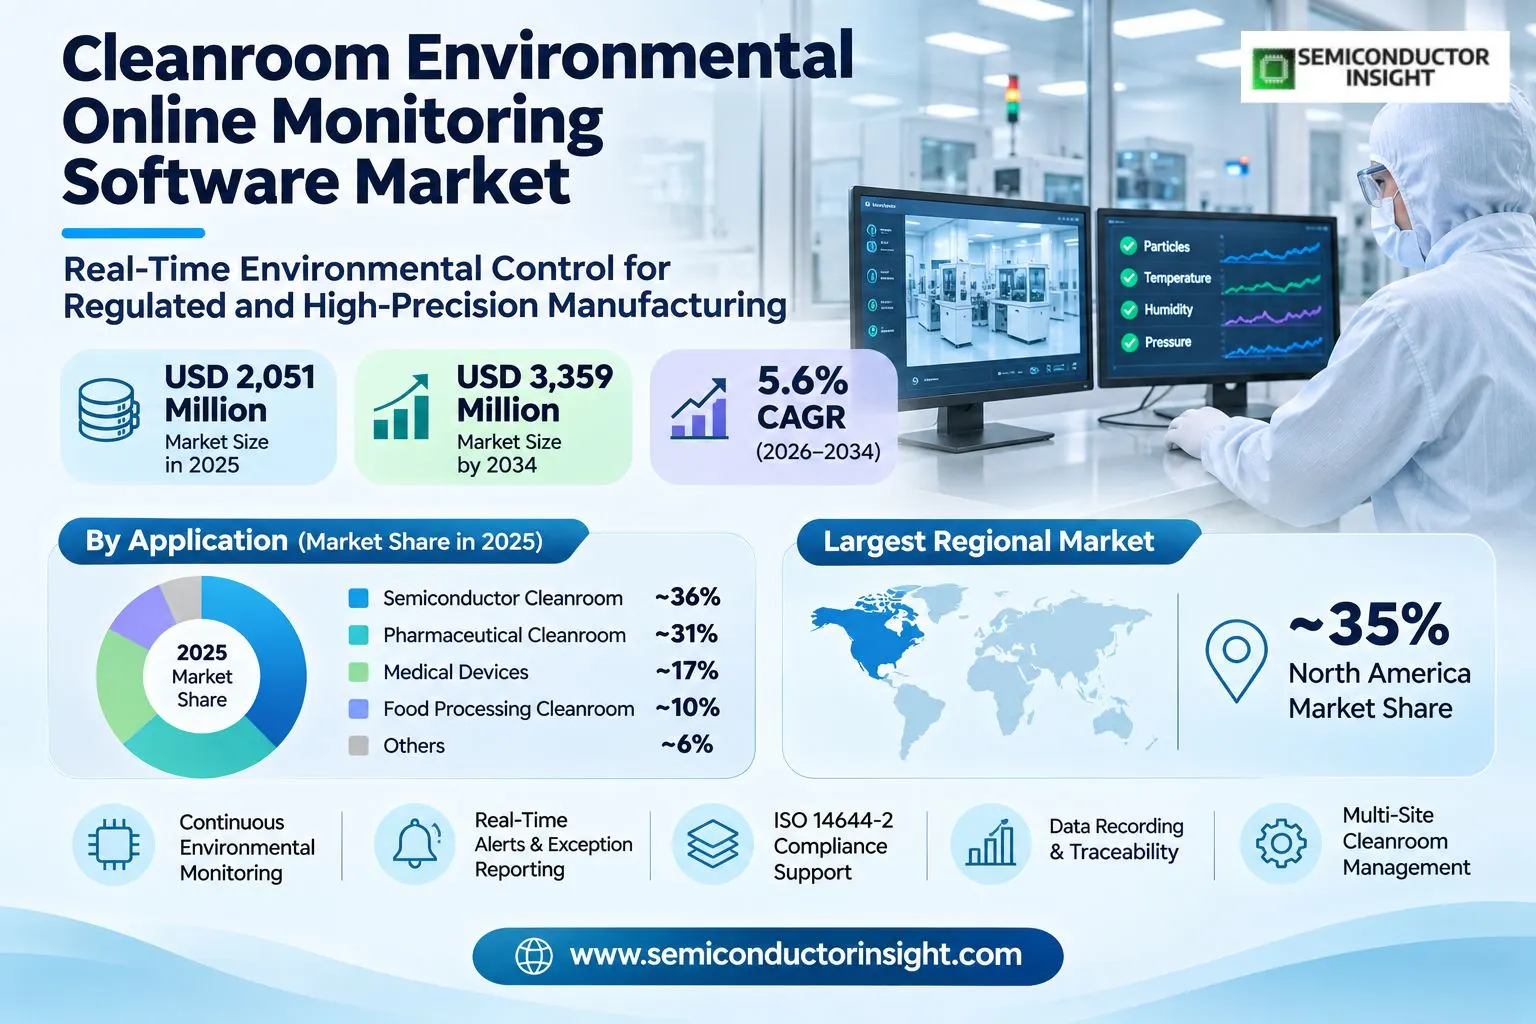
- 2025 revenue: The global cleanroom environmental online monitoring software market generated USD 2,051 million in 2025 and is expected to reach USD 3,359 million by 2034, or 5.6% yearly growth, as highly controlled production sites invest in continuous particle, pressure and humidity surveillance with secure digital records.
- Software platforms: Software Solutions lead Type with an estimated ~41% share, while integrated hardware-sensor platforms hold ~29% and intelligent monitoring technology ~19%; applications are led by semiconductor cleanrooms at ~36%, narrowly ahead of pharmaceuticals at ~31% where audit trails protect batch release.
- Technology transition: IoT-enabled platforms contribute an estimated ~44% of technology spending, followed by cloud-based ecosystems at ~32% and AI-driven analytics at ~24%, because industrial facilities prioritize repeatable communication and secure historian records before adopting algorithms that identify unusual particle and pressure patterns.
- Regional position: North America leads 2025 value with an estimated ~35%, Asia-Pacific follows near ~33% and Europe accounts for ~22%, reflecting mature GMP environments in the United States, expanding cleanroom buildouts in China and Taiwan, and established validation practices across European life-science manufacturing.
- Customer barriers: High validation costs, fragmented sensor protocols, cybersecurity scrutiny and the need to preserve continuous operating records slow replacement projects. Sites increasingly purchase redundant servers and independent alarm paths instead of relying on consumer-style cloud dashboards, even when remote subscription services appear less costly initially.
Cleanroom Environmental Online Monitoring Software Market Overview
Cleanroom environmental online monitoring software market was valued at USD 2,051 million in 2025 and is projected to reach USD 3,359 million by 2034, expanding at a CAGR of 5.6% over 2026–2034. North America represented the largest regional market with an estimated ~35% share, supported by US pharmaceutical facilities and regulated quality-control software deployments.
Cleanroom online monitoring brings measurements from optical particle counters, differential pressure transmitters, relative humidity sensors, temperature probes and selected viable-monitoring interfaces into a validated facility record. Operators see current conditions, route excursions to an approved responder, acknowledge alarms and compare recovery with approved operating limits. The software becomes a quality record, not just a control-room screen, when a drug batch or semiconductor lot is reviewed.
The market boundary covers software subscriptions, installed monitoring suites, integration of dedicated sensor networks and the combined monitoring platforms represented in the product categories. It excludes the entire turnover of heating, ventilation and air conditioning plants, cleanroom construction, laboratory instruments used only for periodic tests and enterprise manufacturing software without environmental monitoring functionality. Regulated facilities often purchase the platform with equipment, so integrated hardware-sensor revenue remains in scope.
A semiconductor fabrication site needs early warning when particles rise near photolithography or when pressure cascades reverse across the entrance to a high-cleanliness bay. Sterile pharmaceutical manufacturers place greater emphasis on traceable batch records, intervention history and deviation investigation. These needs make the same software platform serve different buyers: process engineers in fabs and quality-assurance staff in drug plants.
Interoperability changes the economics of deployments. TSI FMS 6 supports OPC UA exchange with connected counters and other sensors, while Vaisala viewLinc provides alarms, audit trails and monitoring from wired or wireless endpoints. New installations use more connected measurement points than older logging stations, but audit expectations mean migration plans must preserve years of records and operator permissions.
Demand for real-time context is rising with facility complexity. Continuous monitoring captures the relationship between pressure, door traffic, particle spikes and environmental recovery, allowing supervisors to decide whether a deviation was a brief disturbance or a manufacturing risk. The most valuable systems combine authenticated actions, alarm escalation and back-up data capture; pure visualization remains easier to replace on price.
Segment Analysis: By Type
By type, the market comprises Software Solutions, Integrated Hardware-Sensor Platforms, Intelligent Monitoring Technology and Traditional Monitoring Technology. Software Solutions hold an estimated ~41% of 2025 revenue because plants place long-term value on records, configuration and alarms; integrated platforms account for ~29%, followed by intelligent monitoring at ~19% and legacy systems at ~11%.
| Type | Function | Market position |
|---|---|---|
| Software Solutions | Facility monitoring programs ingest particle, temperature, pressure and humidity data, apply thresholds and user permissions, distribute alarms, store batch histories and produce electronic records that can support validated manufacturing. Licensing, maintenance and site expansion account for a large part of lifetime cost because software must remain available through upgrades, qualification cycles, database migrations and changes in cleanroom classifications. | Largest type (~41% share). Vendors win by maintaining 24-hour alarm histories, searchable event audit trails and secure integration into laboratory or manufacturing systems. Buyers compare configurable reports, redundancy and the total validation burden, rather than purchasing by sensor count alone. A long support history is an advantage when every change must be assessed through a regulated change-control process. |
| Integrated Hardware-Sensor Platforms | Turnkey deployments join sampling manifolds, airborne particle counters, pressure transmitters, room displays and facility software under one engineering and service contract. Installation includes point mapping, cable and network qualification, alarm commissioning and training of operators who must respond to excursions at all hours. Such packages reduce interface risk but can tie later expansions to the original equipment supplier. | Second largest (~29% share). In a new cleanroom, integrators can install dozens of distributed points with a unified acceptance test rather than validating separate hardware and software purchases. Their advantage is lower project coordination risk; the commercial restraint is that third-party integrations or replacement sensors may need additional engineering validation and procurement approval. |
| Intelligent Monitoring Technology | Advanced systems compare simultaneous environmental signals and highlight shifts in normal particle profiles, repeated pressure reversals or components nearing failure. Alerts can be ranked by production area, material sensitivity and historical response. Analysts still need to validate every automatic action before it becomes part of a manufacturing disposition decision; anomaly scoring does not replace proven sampling plans. | Emerging segment (~19% share). Faster adoption occurs where facilities already collect synchronized records and have experienced staff to review outliers. Intelligent functions differentiate premium contracts, although early users often run them in advisory mode alongside established alarm thresholds to prevent statistical false positives from disrupting qualified batch or wafer production. |
| Traditional Monitoring Technology | Older applications store periodic readings on local supervisory computers or dedicated chart-recording terminals, with basic threshold warnings and limited cross-site analytics. They remain useful in simple controlled environments where monitoring points rarely change and staff can perform documented manual verification. Modern replacement projects concentrate first on database integrity, security patches and recovery procedures rather than dashboards. | Smaller installed-base segment (~11% share). Routine replacement supports a slow recurring business, but these installations struggle with remote access, electronic signatures and flexible integration. Some owners retain a legacy logger behind an audited gateway for several years instead of risking a single cutover of safety-critical or batch-critical monitoring systems. An upgrade can preserve an older 2025 validation baseline while adding supervised export and improved recovery controls before a wider replacement project. |
Secondary segmentation: users, technologies and functional categories
Three additional perspectives describe how subscriptions and integrated systems are purchased. Pharmaceutical manufacturers represent an estimated ~43% of End User revenue, IoT-enabled technology leads with ~44% and intelligent management contributes ~35% of functionality. Across these axes, the priority is the facility duty and the record required, not a hardware label.
| Axis | Members | Commercial role |
|---|---|---|
| By End User | Pharmaceutical manufacturers; Semiconductor fabs; Medical device producers | Pharmaceutical manufacturers lead with an estimated ~43% as sterile lines require approved release records. Semiconductor fabs account for ~38% because particle excursions can damage high-value lots, while medical device producers represent ~19% through controlled assembly and packaging environments. |
| By Technology | IoT-enabled platforms; AI-driven analytics; Cloud-based ecosystems | IoT-enabled connectivity leads with an estimated ~44% because plant networks already use industrial interfaces. Cloud-based ecosystems hold ~32% for multi-site visualization and remote configuration, and AI-driven analytics take ~24% where data history and validation teams can support decision assistance. |
| By Functional Category | Basic Monitoring; Intelligent Management; Compliance Reporting; Predictive Maintenance | Intelligent Management contributes an estimated ~35% and Compliance Reporting ~31%, ahead of Basic Monitoring at ~18% and Predictive Maintenance at ~16%. Quality record retention and controlled alarm response command spending, while early equipment-health functions require additional verification. |
Segment Analysis: By Application
Applications extend from Semiconductor Cleanroom and Pharmaceutical Cleanroom to medical devices, food processing and other controlled manufacturing. Semiconductor facilities account for an estimated ~36% of 2025 value, pharmaceuticals ~31%, medical devices ~17%, food-processing cleanrooms ~10% and other sites ~6%, with different thresholds for particle events and traceability. Buyers compare live particle counts against the relevant ISO 14644-2 monitoring plan and direct exception reports to responsible quality or engineering staff, with system cost driven by the chosen recording functions, site access procedures and number of controlled rooms.
| Application | Demand characteristics |
|---|---|
| Semiconductor Cleanroom | Largest application (~36% share). Fabricators track airborne particle concentrations, humidity and pressure at multiple manufacturing steps, linking excursions to maintenance events and operator intervention. Sensor locations are chosen around lithography, deposition, chemical handling and load-lock transfer, where brief contamination incidents can waste expensive wafer lots. High uptime and alarm routing are particularly important when operations continue through 24-hour shifts without production pauses. |
| Pharmaceutical Cleanroom | Compliance-intensive category (~31% share). Sterile filling and biological manufacturing require documented environmental limits, continuous oversight of critical parameters and traceable action when an alert reaches a defined threshold. Monitoring software helps quality personnel connect time-stamped conditions with facility areas, shifts and batch records. Electronic audit trails and controlled change histories often weigh more heavily than advanced visualization or short-term license discounts. |
| Medical Device Cleanroom | An estimated ~17% share. Implant, diagnostic consumable and sterile instrument producers use graded environments to control particulate and microbial exposure while assembling precision parts. A validated record can support investigations after packaging failures or supplier quality findings. Manufacturers with several assembly rooms favor networked sensors that reuse existing reporting templates without letting users silently alter monitored limits. |
| Food-Processing Cleanroom | An estimated ~10% share. High-care food packaging, culture processing and specialty ingredients need air quality and pressure monitoring where spoilage or cross-contamination has a high business cost. Projects generally emphasize manageable alarms and environmental evidence rather than complex semiconductor particle classification. Operators often purchase integrated systems through refrigeration, filtration and plant-engineering partners rather than specialist cleanroom software channels. |
| Others | Remaining ~6% share. Aerospace assemblies, battery material preparation, precision optics and research laboratories use continuous monitoring to establish stable processing conditions. These buyers may need portable sensor integration, flexible maps and exportable histories but seldom share one common regulatory regime. Suppliers that offer modular licenses and simple approval workflows can serve such sites economically without a full enterprise-level pharmaceutical validation package. |
Application purchasing patterns follow the owner of the risk. In a semiconductor fab, facilities engineers care about response time and equipment protection; in pharmaceutical suites, quality teams prioritize controlled records and evidence for investigations; medical device producers frequently integrate monitoring into a wider device-history system. Installation decisions therefore depend on uptime, the location of critical points, and whether a change can be approved without requalifying the entire controlled environment.
Regional Analysis
North America holds the largest 2025 market share at an estimated ~35%, followed by Asia-Pacific at ~33% and Europe at ~22%. Pharmaceutical validation, semiconductor contamination controls and service-network depth drive different procurement patterns. South America contributes ~6% while the Middle East and Africa account for ~4%; each smaller region requires flexible support and qualified local systems integration.
Where are continuous cleanroom monitoring platforms most widely deployed?
A cleanroom operator buys information assurance rather than a geographic equipment label. The United States concentrates regulated drug production and quality-management teams; East Asian chipmaking clusters emphasize low-particle manufacturing; Europe combines advanced pharmaceuticals with stringent documentation. Latin American medical-device and medicine plants frequently purchase complete retrofit packages, whereas Gulf research and healthcare facilities depend on suppliers able to maintain distributed sensors and documentation with local partners.
| Region | Position | Growth outlook | Demand profile | What decides supplier selection |
|---|---|---|---|---|
| North America | Largest (~35%) | Established (~5.3% CAGR) | Regulated pharmaceuticals and biotechnology | Validation documentation and redundant servers |
| Asia-Pacific | Second (~33%) | Fastest (~6.9% CAGR) | Foundries, memory plants and biologics | Sensor interoperability and fast commissioning |
| Europe | Third (~22%) | Steady (~5.0% CAGR) | GMP sterile manufacture and precision devices | Annex 1 evidence and audit-trail integrity |
| South & Central America | Fourth (~6%) | Expanding (~5.8% CAGR) | Medical devices, medicines and high-care food | Service skills and import arrangements |
| Middle East & Africa | Fifth (~4%) | Emerging (~6.4% CAGR) | Healthcare, pharmaceutical and laboratory projects | Qualified regional integrators and support |
Key Cleanroom Environmental Online Monitoring Software Manufacturers and Competitive Landscape
Competition in cleanroom monitoring software is divided between specialist particle-monitoring firms, environmental instrument companies and local cleanroom contractors. TSI, Beckman Coulter, Particle Measuring Systems, Setra and Vaisala have documented monitoring solutions, while other names on the competitive list may chiefly supply filtration, room equipment or integration services. Buyer confidence depends on qualification evidence, sensor interoperability and sustained field service.
TSI competes through FMS applications and particle-counter integration. Its FMS Web Client 2.0 announcement in August 2026 highlights distributed architecture, browser access and real-time views; the system also accepts temperature, pressure and airflow data. Beckman Coulter offers MET ONE facility monitoring with electronic audit records and routines for particle-counting compliance. These two companies sell against demanding pharmaceutical and semiconductor operating requirements rather than purely on screen design.
Vaisala and Setra emphasize broad environmental infrastructure. Vaisala viewLinc joins wireless or wired data streams with alarms, reporting and controlled access; the October 2026 Viewlinc Cloud Suite introduced separate Professional and GxP options. Setra promotes cleanroom environmental monitoring with alarms and combined deployment methods. Their positioning creates competition around how much of the monitoring record can be centrally managed without adding costly site-specific interfaces.
A specialist integrator can still win against a major vendor by handling installation constraints such as pressure transducer placement, sampling-line length and cleanroom work permits. Kanomax and Terra Universal have relevant instrument or cleanroom positions, but a company named in a broad industry list should not automatically be credited with a finished enterprise monitoring software platform. Verified software functionality and support obligations are the appropriate basis for comparison.
Tier structure
| Tier | Companies | Basis of competition |
|---|---|---|
| Integrated FMS leaders | TSI, Beckman Coulter, Particle Measuring Systems | These vendors offer documented monitoring suites linked to instruments and regulated workflows. Their competitive edge is a long technical support life, sampling instrument integration and comprehensive alarm records rather than revenue from generic cleanroom construction. Customers typically review the ability to support qualification and keep a facility operational during database service or instrument maintenance. |
| Environmental data specialists | Vaisala, Setra Systems | Environmental measurement companies compete through networked temperature, humidity and differential pressure monitoring, configurable alarming and validated records where required. Vaisala offers hosted and installed approaches, while Setra serves room-pressure and cleanroom monitoring applications. Their products can sit beside specialist airborne-particle counters, making open interfaces and field service agreements especially important in multi-vendor facilities. |
| Instrument and integration ecosystem | Kanomax, Terra Universal, regional cleanroom contractors | Particle measurement suppliers, cleanroom designers and regional controls contractors participate in the buying journey without necessarily controlling core software intellectual property. They influence sensor selection, installation drawings, measurement-point mapping and commissioning. The distinction matters because a contractor supplying a turnkey monitoring room may receive a project invoice even though the underlying software belongs to another company. |
Key companies profiled
- TSI Incorporated
- Beckman Coulter
- Particle Measuring Systems
- Vaisala
- Setra Systems
- Kanomax Corporation
- Terra Universal
- Siemens
- Suzhou Sothis Purification Equipment Factory
- Other qualified systems integrators
Cleanroom Environmental Online Monitoring Software Production Capacity Analysis
Production capacity in cleanroom monitoring software is measured by engineering, product validation, commissioning and after-sales resources rather than by the output of a semiconductor fabrication line. Sensor hardware is assembled by specialized measurement firms, while software development and database services can be deployed centrally. Qualification, site access and trained support engineers govern the practical pace of installations.
A facility monitoring project starts with an approved sampling plan, a map of particle and pressure measurement locations and a network design that preserves data when communications are interrupted. Instrument vendors source optical particle counters, pressure transducers and temperature or humidity probes from established production lines. Software developers then configure databases, permissions and alarm logic before the combined installation is formally challenged during acceptance and operational qualification.
An installed monitoring estate is expensive to change because each room identifier, notification path and electronic signature rule may be referenced by site procedures. Systems with redundant servers and buffer memory can preserve records through localized failures, but those features require site-specific testing. TSI describes high-availability SQL databases and failover in FMS 6, showing why the commercial bottleneck is reliable integration and documented service rather than merely adding another license.
Cloud deployments shift infrastructure work but do not eliminate quality responsibilities. A regulated facility must decide how users are authenticated, when software changes occur, how electronic records are retrieved and how critical alarms behave if the network fails. Hosting resources can scale quickly; commissioning of sensors, approval of a monitoring plan and training of responsible operators remain physical, locally performed constraints on delivered capacity.
Cleanroom Environmental Online Monitoring Software Market Dynamics: Drivers, Restraints and Opportunities
Market growth reflects the widening role of cleanroom environmental records in regulated production, continuous investment in semiconductor process control and the spread of connected monitoring to smaller sites. New cloud and analytical functions can raise average contract value, but the sector remains constrained by installation complexity, qualification costs, cybersecurity review and the risk of false alarms that disrupt approved production.
MARKET DRIVERS
Drivers Impact Analysis*
| Market Drivers | Impact Rank | CAGR Contribution (%) | 2026–2028 | 2029–2031 | 2032–2034 |
|---|---|---|---|---|---|
| Pharmaceutical GMP evidence and inspection readiness | High | +2.40% | High | High | Medium |
| Semiconductor cleanroom process protection | Medium-High | +1.80% | High | High | High |
| Sensor networking and integrated alarms | Medium | +1.30% | High | Medium | Medium |
| Cloud options for multi-site facilities | Low-Medium | +1.00% | Medium | High | High |
| Others (medical devices, analytics and research facilities) | Low | +0.90% | Medium | Medium | High |
Sterile production needs defensible monitoring evidence
Pharmaceutical environments use contamination control strategies to reduce the chance that particulates or microorganisms compromise a batch. Revised EU GMP Annex 1 has been operational since August 2023, so plants need reliable records showing actual conditions and the response to alarms. Continuous software reports reduce the burden of assembling a manual history before inspections and increase the value of secure permissions and retrievable event data.
Fabs link environmental events to process yield
Semiconductor cleanrooms are managed for unusually low airborne particle levels, particularly around sensitive wafer handling and photolithography. Monitoring enables an operator to separate a short-lived pressure fluctuation from a sustained filtration or access problem. Connecting these events with the timing of tool alarms can help prioritize investigation, which supports investment in redundant data collection and higher sampling-point density rather than isolated local displays.
Open industrial interfaces widen sensor coverage
Modern facility platforms can collect signals from different types of counters and transmitters rather than demanding a complete replacement of every sensor on site. TSI promotes OPC UA client and server connectivity and distributed record handling; these functions allow information to reach plant dashboards or other applications while local monitoring continues. Integration unlocks upgrades in older facilities where the initial instrument investment is already substantial.
Cloud-based services reach smaller regulated operators
Hosted offerings can remove the need for a dedicated application server at each small laboratory or development facility. Vaisala announced a Professional and a GxP-oriented Viewlinc Cloud Suite in October 2026 for staged adoption as an organization expands. The opportunity is not to remove all local alarms, but to make validated reporting, support and controlled user management available to buyers that cannot maintain a large internal software team.
MARKET RESTRAINTS
Restraints Impact Analysis*
| Market Restraints | Impact Rank | CAGR Contribution (%) | 2026–2028 | 2029–2031 | 2032–2034 |
|---|---|---|---|---|---|
| Validation, integration and commissioning costs | High | -0.80% | High | Medium | Medium |
| Cybersecurity and data-sovereignty review | Medium | -0.60% | Medium | High | High |
| Others (false alarms, training and legacy migration) | Low | -0.40% | High | Medium | Low |
Site qualification raises upfront and switching expense
A monitoring system cannot safely be deployed by connecting sensors to a laptop and accepting the first values displayed. Engineers must test sampling locations, alarm thresholds, user privileges, data buffering and recovery from power or network faults. The documented evidence consumes specialist time, especially at a running sterile filling line, and limits how rapidly a vendor can replace an established platform even when the new license appears cheaper.
Secure data handling complicates remote deployment
Electronic environmental records may be reviewed years after capture, which creates stringent retention, identity and auditability expectations. Some site owners require locally hosted databases or explicitly approved hosting regions. Remote services therefore face extensive security and change-control review, and a temporary internet failure cannot be allowed to disable essential on-site alarms for active pharmaceutical or semiconductor production.
Too many nuisance alarms undermine operator trust
Excessive particle and pressure alerts can lead technicians to ignore messages or create recurring administrative work. A door opening, a maintenance task and a genuine ventilation fault can produce similar short-term patterns, so alarm limits need to reflect the qualified process. Vendors who promise predictive analytics without strong baseline data risk adding complexity to an environment that already requires careful deviation investigation.
MARKET OPPORTUNITIES
Connect multi-building cleanroom estates
Manufacturers often run sterile suites, R&D laboratories and packaging rooms with separate recorders installed at different dates. A platform that consolidates approved environmental records without disrupting local controls can reduce the time spent locating the correct history during investigations. Contract expansion may come from incremental monitored rooms, secure user seats and recurring support rather than large one-time replacements of every sensor.
Improve maintenance response through correlated data
The relationship between particle excursions, differential pressure and HVAC operating changes can help engineering teams diagnose failures faster. When room pressure degrades before particle levels rise, facilities can investigate door seals or filters before the next high-value batch begins. The practical opportunity is decision support and documented response, not unsupervised automatic adjustment of a validated cleanroom classification.
Offer flexible operating models to emerging labs
New medical-device startups and biologic development laboratories may begin with a handful of controlled rooms but later need multiple manufacturing sites. Professional and regulated software configurations allow an initial monitoring investment to remain useful as documentation expectations grow. Vendors that can demonstrate safe migration from a small system to an enterprise historian have a route to long-duration customers without offering an oversized first contract.
Cleanroom Environmental Online Monitoring Software Supply Chain Analysis
The cleanroom monitoring value chain begins with particle counters and environmental transducers, then extends through networked gateways, alarm logic, record databases and qualification services. Software firms and system integrators connect these inputs to site procedures and trained operators. Revenue is distributed across application licenses, integrated instrumentation, commissioning, support and expansion contracts, with documentation and uptime central to purchasing.
Sensors and components. Cleanroom records are only as trustworthy as the instruments supplying them. Optical airborne-particle counters need calibration and appropriate sample transport, while room pressure measurements require correct sensor ranges and placement across barriers. Environmental probes, local controllers and network interfaces are sourced through specialist instrumentation channels. The operator must keep calibration status connected to each software point identifier when instruments are changed or repaired.
Platform engineering. Software developers translate sensor streams into persistent records with time stamps, user permissions and predefined alarm levels. Handling a data interruption is an engineering requirement, not a cosmetic option; the system should distinguish a true acceptable measurement from the absence of data. Testing also covers recovery of archived records and the separation of ordinary operator activity from changes that require supervisory authorization.
Systems integration. Installers map the physical cleanroom into logical monitoring zones and configure which workers receive messages for a pressure deviation or particle excursion. Qualification specialists document testing of expected events, missed data, server failover and report retrieval. That labor is often delivered by an authorized regional partner, which gives local expertise a continuing role even when software code and cloud infrastructure are produced abroad.
End-market operations. A semiconductor site values immediate detection before a sensitive production step, while a pharmaceutical quality unit needs defensible records for batch review and contamination-control decisions. Medical-device operations may emphasize practical traceability across multiple assembly rooms. The strongest suppliers sell recurring confidence that the system will remain available and understandable throughout equipment upgrades, personnel changes and regulatory inspections.
Recent Developments in the Cleanroom Environmental Online Monitoring Software Market
- 22 October 2026 Product
Vaisala introduced Viewlinc Cloud Suite with Professional and GxP editions, describing real-time readings, alarms, audit trails and growth from small research settings toward regulated manufacturing. The company also introduced a lifecycle-support offering and indicated fourth-quarter 2026 availability in markets outside China. This demonstrates rising software-as-a-service competition; an individual customer must still qualify the application and verify critical alarm continuity before routine manufacturing use. Source - 24 August 2026 Product
TSI announced a second-generation facility management system with FMS Web Client 2.0, emphasizing distributed operation, browser access, configurable dashboards and interactive floor plans. Airborne particle instruments can be viewed alongside pressure, temperature, humidity and airflow signals. The release adds a concrete commercial option for modern cleanroom monitoring, especially where supervisors need secure access from more than one room or workstation. Source - 20 August 2026 Guidance
TSI announced a four-phase BioTrak BFPC implementation roadmap aimed at pharmaceutical Grade A environmental monitoring. The stages cover initiation, design, validation and routine operation of alternative microbiological methods. Although an implementation guide is not software revenue, its focus on validated sampling workflows illustrates how advanced instrumentation increases the record-keeping and configuration requirements for facility monitoring platforms. Source - 25 August 2024 Regulation
The deferred provision 8.123 of the revised EU GMP Annex 1 became operative on 25 August 2024, following the wider Annex entering into operation one year earlier. These dates have continued to shape sterile manufacturing reviews and contamination control planning. The resulting need is for facilities to demonstrate reliable environmental records and investigation procedures, not merely to present live values on an equipment display. Source - 13 February 2018 Technology
TSI announced that its facility monitoring OPC UA client and server functionality had gained OPC Foundation certification after testing of interoperability and related performance criteria. The communication feature lets monitoring data be exchanged with other industrial systems, which remains relevant to modern cleanroom retrofits. The historic milestone is included as an interoperability reference rather than portrayed as a newly launched 2026 product. Source
REPORT SCOPE & SEGMENTATION
| Attribute | Details |
|---|---|
| Study Period | 2020–2034 |
| Base Year | 2025 |
| Estimated Year | 2026 |
| Forecast Period | 2026–2034 |
| Historical Period | 2020–2024 |
| Market Size 2025 | USD 2,051 million |
| Market Size 2026 | USD 2,166.6 million |
| Market Size 2034 | USD 3,359 million |
| Growth Rate | CAGR of 5.6% from 2026–2034 |
| Unit | Value (USD Million) |
| Segmentation | Type, Application, End User, Technology, Functional Category and Region |
| By Type | Software Solutions · Integrated Hardware-Sensor Platforms · Intelligent Monitoring Technology · Traditional Monitoring Technology |
| By Application | Semiconductor Cleanroom · Medical Device Cleanroom · Pharmaceutical Cleanroom · Food-Processing Cleanroom · Others |
| By End User | Pharmaceutical manufacturers · Semiconductor fabs · Medical device producers |
| By Technology | IoT-enabled platforms · AI-driven analytics · Cloud-based ecosystems |
| By Functional Category | Basic Monitoring · Intelligent Management · Compliance Reporting · Predictive Maintenance |
| By Region | Five global regions reviewed by facility type, purchased functionality and country North AmericaUnited States, Canada, Mexico Asia-PacificChina, Taiwan, South Korea, India, Japan EuropeGermany, France, United Kingdom, Rest of Europe South & Central AmericaBrazil, Mexico, Argentina, Chile Middle East & AfricaSaudi Arabia, United Arab Emirates, South Africa |
| Key Companies Profiled | TSI, Beckman Coulter, Particle Measuring Systems, Vaisala, Setra Systems, Kanomax Corporation, Terra Universal, Siemens, Suzhou Sothis Purification Equipment Factory |
| Customization Scope | Free report customization equivalent to up to 4 analyst working days with purchase. Available changes include country, application and functionality coverage. |
Frequently Asked Questions
How large is the cleanroom online monitoring software market?
Cleanroom environmental online monitoring software accounted for USD 2,051 million in 2025 and is forecast to reach USD 3,359 million in 2034, equivalent to a CAGR of 5.6% over the reporting window. Continued deployment in controlled pharmaceutical and semiconductor production is the primary demand base, with software configuration, integrated sensor networking and qualification services contributing to commercial value.
What equipment does a cleanroom monitoring program connect?
A plant-level monitoring application receives measurements from optical particle counters, pressure differential transmitters, temperature and humidity probes, airflow devices and selected viable-sampling instruments. It records events alongside sensor identity and alarm status so technicians can distinguish an actual excursion from a communications failure. The final choice of sampling position and instrument range belongs to the site-specific monitoring and contamination control plan.
Which product type has the largest share?
Software Solutions lead Type with an estimated ~41% share of 2025 value because compliant records, alarms, reporting and licensing continue to carry value after installation. Integrated Hardware-Sensor Platforms follow at about ~29%, while Intelligent Monitoring Technology accounts for roughly ~19% and Traditional Monitoring Technology ~11%. The smaller segments have different purposes, from older local loggers to decision-support functions built on validated histories.
What makes pharmaceutical monitoring different from fab monitoring?
Sterile drug manufacturers place special emphasis on traceable batch investigations, controlled permissions and documentation of contamination-control action, while semiconductor fabs focus on timely identification of particle and pressure events around sensitive wafer-handling processes. Pharmaceutical manufacturers represent an estimated ~43% of end-user revenue and semiconductor fabs ~38%. Both require reliable instruments, but their approval workflows and operational decisions are not interchangeable.
Which region is the largest market?
North America holds an estimated ~35% of 2025 value, supported by mature pharmaceutical and biopharmaceutical facilities and sophisticated monitoring-service networks. Asia-Pacific accounts for about ~33% and expands faster as fab and pharmaceutical capacity grows; Europe contributes an estimated ~22% through established cleanroom operators. The smaller South American and Middle Eastern markets depend heavily on qualified service integration for new facilities and upgrades.
How does ISO 14644-2 relate to monitoring software?
For cleanrooms, the important question is whether the documented program detects departures from qualified particle conditions and supports a prompt investigation. ISO 14644-2 provides a framework for monitoring-plan design, but each facility chooses its locations and assessment procedures in relation to manufacturing risks. Software supplies time-stamped evidence, approval controls and a usable historical record; it cannot determine whether the planned sampling network is scientifically appropriate.
Why do operators invest in electronic audit trails?
An electronic record should identify who viewed or changed controlled monitoring settings and preserve the time and context of an environmental event. Drug manufacturers often examine these details during deviations or inspections, while medical-device producers use them to support traceability. A product that facilitates 21 CFR Part 11 compliance still requires the facility to control user roles, system qualification and the procedures governing its records.
What prevents rapid adoption of cloud hosting?
Cloud monitoring can reduce the need for site-owned servers and make several laboratories easier to oversee, but quality teams must assess data location, service changes, network resilience and continued availability of local alarms. Critical manufacturing areas cannot treat a short internet interruption as acceptable loss of environmental oversight. Hybrid designs and documented recovery procedures therefore remain important even when subscriptions reduce infrastructure spending.
Who supplies the principal monitoring platforms?
TSI supplies FMS software linked to particle instruments and environmental signals; Beckman Coulter provides MET ONE facility monitoring functionality; Particle Measuring Systems offers specialist cleanroom monitoring; Vaisala provides viewLinc environmental applications; and Setra supports cleanroom pressure and facility monitoring. Kanomax, Terra Universal and local contractors participate in adjacent equipment or integration roles, which should not be confused with proof of core software ownership.
How should manufacturers assess an upgrade?
Procurement should begin with the critical rooms, sensor calibration status, approved limits and exact records that supervisors must retrieve. The team can then compare user access, database failover, interface support, service availability and migration of historical data. A documented test of alarms and record recovery before cutover is more useful than evaluating a dashboard in isolation, particularly where a sterile batch or high-value wafer lot is active.
Research Sources & Evidence Base
Get Sample Report PDF for Exclusive Insights
Report Sample Includes
- Table of Contents
- List of Tables & Figures
- Charts, Research Methodology, and more...
 Download Sample Report PDF