SEMICONDUCTOR INSIGHT
MARKET RESEARCH REPORT

Chemical Sensors Market

2026 to 2034
MARKET INTELLIGENCE
ACROSS KEY REGIONS
2026 EDITION
SENSORS Semiconductor Market Research

Chemical Sensors Market

Global Business Strategies 2026-2034

◷
UPDATED 09 September 2026
▤
REPORT LENGTH Detailed Report
▣
REPORT CODE 4ad8ee53ae88
▯
FORMATS PDF

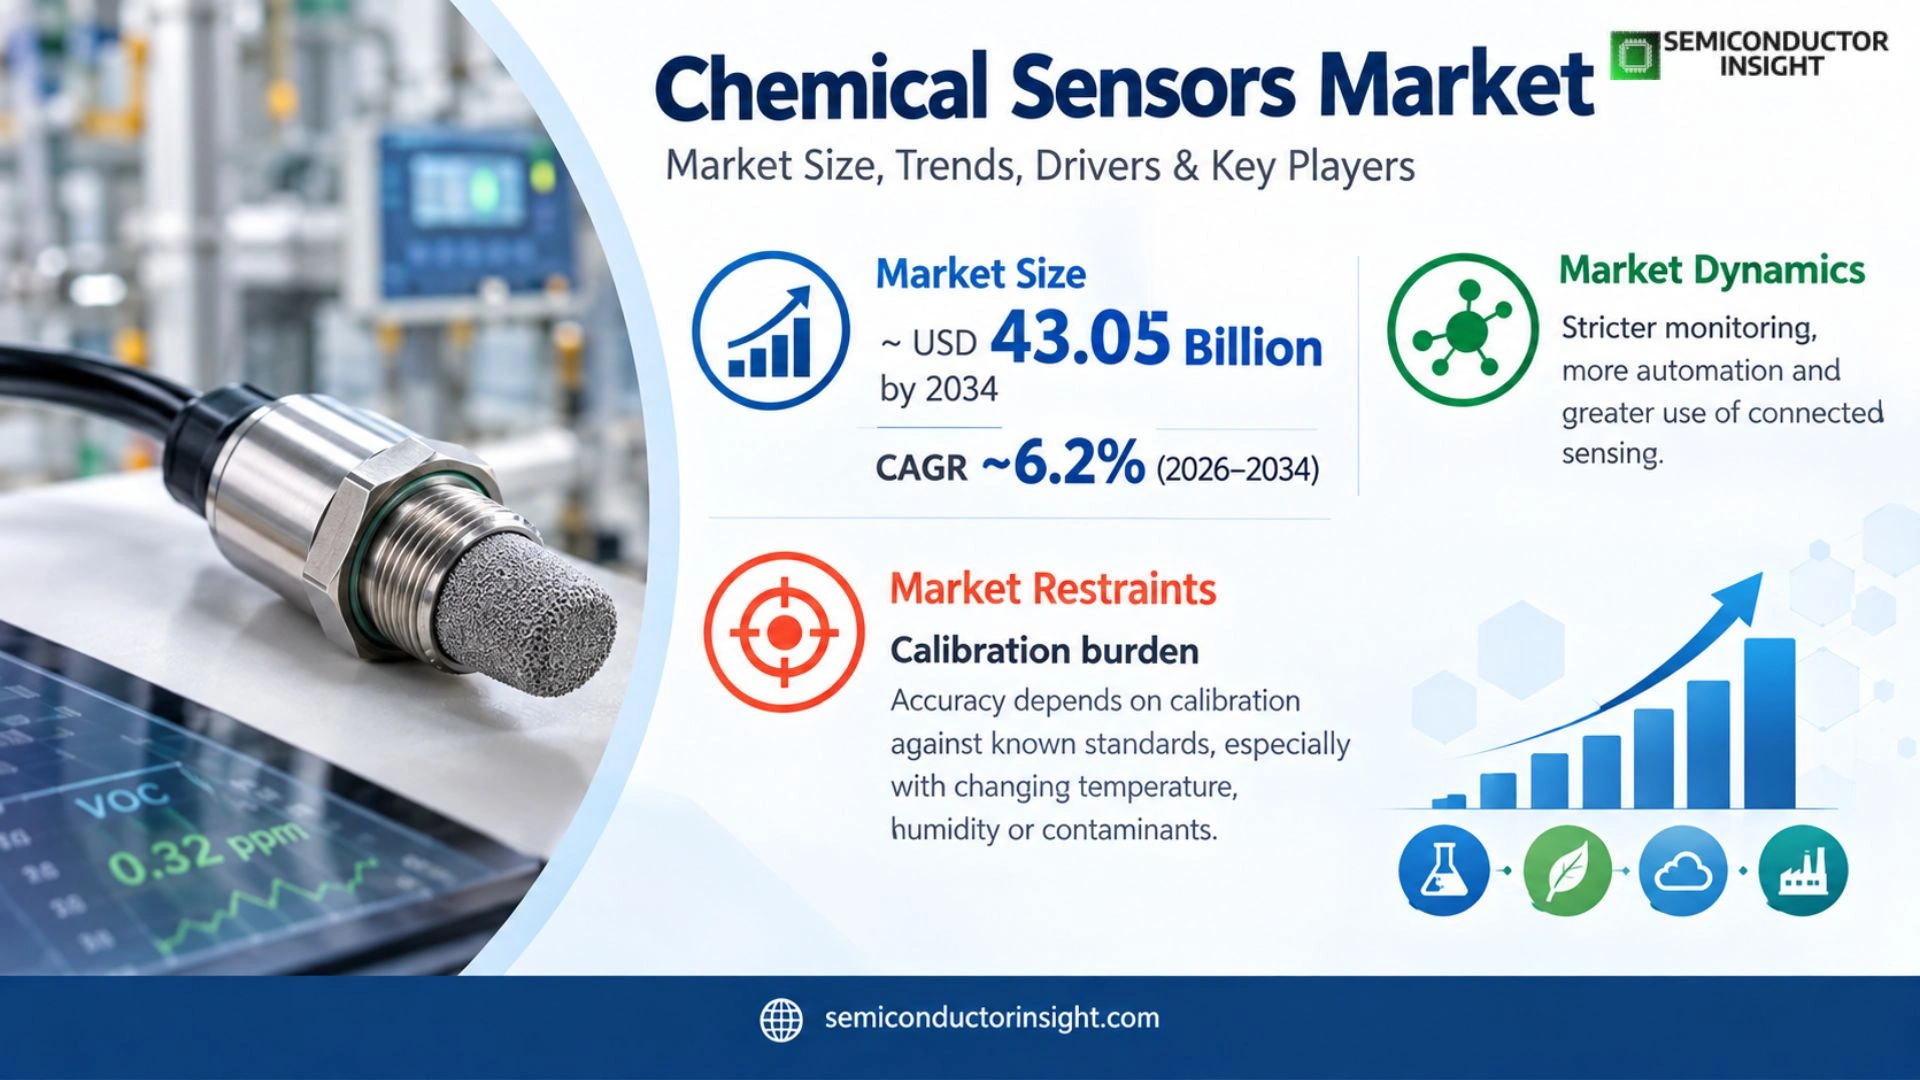
Chemical sensors market was valued at USD 24.98 billion in 2025 and is projected to reach approximately USD 43.05 billion by 2034, implying a 6.2% CAGR during 2026–2034. North America holds the largest regional position in the report’s current framing, while Asia Pacific provides the strongest growth trajectory as industrialization, environmental monitoring and smart infrastructure expand sensor demand.

Get the sample PDF with study scope, segmentation and methodology details.

Key Statistics

2025 Market Size
USD 24.98 billion
2034 Projected Size
USD 43.05 billion
CAGR (2026–2034)
6.2%
Largest Market in 2025
North America

Key Takeaways

  • Electrochemical sensors remain the largest product type, with the report attributing about 35% of 2025 market share to their sensitivity, rapid response and broad use in gas and water monitoring.
  • Industrial applications form the largest demand pool at approximately 40% of the market, reflecting process control, workplace safety and environmental compliance requirements across chemicals, oil & gas and pharmaceuticals.
  • Asia Pacific is the fastest-growing region, while North America remains the largest regional market in the report’s 2025 framing because of regulation, industrial automation, healthcare R&D and established sensor suppliers.
  • Gas sensing is the leading detection-medium opportunity because toxic and flammable gas monitoring creates recurring industrial demand and increasingly connects sensors to remote monitoring systems.
  • Calibration, cross-sensitivity and sensing-element life remain key restraints because chemical detection performance can degrade in real environments and maintenance directly affects total cost of ownership.
  • Wireless networks, nanomaterials and portable detection are shifting competition from standalone sensing elements toward connected measurement systems that can support remote monitoring and predictive analytics.

Chemical Sensors Market Overview

Chemical sensors market was valued at USD 24.98 billion in 2025 and is projected to reach approximately USD 43.05 billion by 2034, implying a 6.2% CAGR during 2026–2034. North America holds the largest regional position in the report’s current framing, while Asia Pacific provides the strongest growth trajectory as industrialization, environmental monitoring and smart infrastructure expand sensor demand.

Base year: 2025 · Forecast period: 2026–2034 · Historical data: 2020–2025 · Values in USD, unless otherwise stated

Chemical sensors convert chemical information such as concentration, composition or the presence of a target substance into an interpretable signal. Depending on the technology, the sensing mechanism may be electrochemical, optical, semiconductor-based or catalytic, with the sensor often connected to signal conditioning, communications and software. The commercial market therefore includes not just the sensing element but the hardware and integration needed to turn chemical exposure into an actionable measurement.

The most important demand mechanism is risk reduction. Industrial plants need to identify toxic or flammable gases, environmental agencies need to measure emissions and water quality, and healthcare systems need analytes detected with repeatable accuracy. In each case the purchase decision depends on detection limits, response time, calibration burden, selectivity, lifetime and system integration. Suppliers compete by improving sensing chemistry while also simplifying maintenance, connectivity and data interpretation.

The market is changing because sensing is moving from periodic measurement toward continuous and distributed monitoring. Wireless networks can place sensors across large facilities, portable instruments can support field inspection and nanoscale materials can improve sensitivity. The result is a commercial shift from selling a sensor as a discrete component toward selling a monitoring capability that combines the sensing element, electronics, communications and software. That broadens the revenue opportunity but also raises integration and qualification requirements.

Segment Analysis: By Type

The report defines five product types: Electrochemical Sensors, Optical Sensors, Semiconductor Sensors, Pellistor/Catalytic Bead Sensors, and Others. Electrochemical sensors are the largest segment, while semiconductor and optical technologies benefit from innovation in miniaturization, connectivity and specialized detection applications.

Type Operating principle / role Market position
Electrochemical Sensors Use electrochemical reactions to produce electrical signals proportional to target concentration. Common in gas detection, water quality and industrial monitoring. Largest. Strong installed base because the technology balances sensitivity, response speed, cost and established calibration practices across many industrial applications.
Optical Sensors Use absorption, fluorescence, spectroscopy or related optical effects to identify or quantify chemical species. Premium and specialized. Attractive where selectivity, remote measurement or non-contact sensing provides an advantage over conventional electrochemical approaches.
Semiconductor Sensors Use changes in conductivity or surface chemistry within semiconductor or solid-state materials to detect target gases and vapors. High innovation potential. Miniaturization and integration make the technology attractive for compact devices, automotive systems and connected sensors.
Pellistor/Catalytic Bead Sensors Measure heat generated by catalytic oxidation of combustible gases. Established safety segment. Particularly relevant to combustible-gas detection where ruggedness and established certification pathways support demand.
Others Includes specialized sensing methods and hybrid architectures designed around application-specific chemical detection requirements. Smaller but diverse. Demand depends on niche performance advantages and can be resilient where conventional sensor technologies cannot meet selectivity or environmental requirements.

Technology economics and selection

Technology selection depends on the analyte, concentration range, operating environment and required maintenance interval. Electrochemical sensors can be attractive where cost and sensitivity must be balanced across large installed fleets, whereas optical and semiconductor approaches can command value where selectivity, miniaturization or remote operation is more important. The commercial implication is that there is no single technology winner across all applications; suppliers instead compete by matching sensing chemistry and architecture to a specific measurement problem.

Segment Analysis: By Application

The report segments applications into Industrial, Environmental Monitoring, Medical, Homeland Security, Automotive, and Others. Industrial applications are the largest, while environmental monitoring, portable detection and connected systems are creating additional growth channels as regulations and monitoring expectations become more continuous.

Application Demand characteristics
Industrial The largest application because chemical, petrochemical, pharmaceutical and manufacturing facilities require process control, leak detection, worker safety and compliance monitoring. Purchasing emphasizes reliability, calibration stability, serviceability and integration with plant control systems.
Environmental Monitoring Demand is driven by air and water quality requirements, emissions measurement and distributed monitoring. Buyers increasingly value remote networking, low power consumption and the ability to place sensors near potential pollution sources.
Medical Sensors are used for diagnostics, point-of-care testing and specialized monitoring. The purchase trigger is analytical accuracy together with size, biocompatibility or repeatability, depending on the device architecture.
Homeland Security Chemical threat detection requires fast response, discrimination and rugged field operation. Suppliers compete on false-alarm performance, portability, training burden and system reliability.
Automotive Demand includes emissions, cabin-air and system-monitoring functions. Miniaturization, cost, durability and long-term stability are important because the sensor must fit within high-volume vehicle electronics platforms.
Others Food safety, agriculture, research and specialty monitoring applications create additional demand where portable, selective or low-concentration detection is valuable.

Chemical Sensors Market Outlook

Regional Analysis

North America is the largest region in the report, while Asia Pacific is the fastest-growing. North American demand is supported by industrial automation, environmental regulation, healthcare innovation and defense applications; Asia Pacific is expanding faster because industrialization, manufacturing growth and pollution-control requirements are increasing the number of locations that need continuous chemical monitoring.

How does regional chemical sensor demand differ?

North America buys around established industrial safety and regulatory frameworks, Europe emphasizes compliance and sophisticated industrial applications, Asia Pacific adds rapid new installations as manufacturing expands, South America is tied to mining, agriculture and energy, and the Middle East & Africa is closely connected to oil and gas, mining and smart-infrastructure projects. The practical implication is that sensor suppliers should tailor commercialization around the end-market trigger, not simply reproduce one global product strategy.

Region Position Growth outlook Demand profile What decides supplier selection
North America Largest Strong Industrial, environmental, medical and defense Compliance performance, calibration support, installed base and integration with automation
Europe Second Moderate to strong Industrial and environmental Regulatory fit, reliability, data traceability and energy efficiency
Asia Pacific Fastest growth Highest Industrialization and smart infrastructure Cost, scale, localization and ability to integrate connected monitoring
South America Fourth Moderate Mining, agriculture and energy Ruggedness, distribution reach and field service
Middle East & Africa Smallest Selective / project led Oil & gas, mining, infrastructure and security Hazardous-area suitability, project qualification and supply reliability
North America LARGEST MARKET

Why does North America lead chemical sensor demand?

North America leads because chemical sensing is embedded in mature industrial safety, environmental compliance, healthcare and defense systems. Regulatory requirements create recurring monitoring demand, while advanced industrial automation makes it easier to connect sensors to control and analytics platforms. The region also has a deep ecosystem of sensor manufacturers and system integrators, which reduces the friction between sensor innovation and commercial deployment.

Market positionLargest region
Growth outlookStrong
Demand profileRegulation and automation led
Market access gateQualification, calibration and compliance
Country Position in region What drives demand
United States Largest Industrial safety, emissions measurement, healthcare diagnostics and homeland security support broad sensor demand.
Canada Resource and environmental Oil & gas, mining and environmental monitoring create demand for rugged chemical and gas sensing.
Mexico Manufacturing linked Automotive and industrial production create demand for emissions, safety and process sensors.

The regional market is characterized by recurring replacement and calibration demand, not only new installations. Industrial fleets require sensors to remain accurate over time, which creates a service opportunity around calibration, replacement elements and connected monitoring platforms. Suppliers that design for easy maintenance can therefore capture a larger lifecycle share than vendors competing only on the initial instrument sale.

Connected monitoring is an additional growth mechanism. Wireless or networked sensors allow operators to monitor larger areas without wiring every measurement point back to a central system. That lowers installation friction and can make previously uneconomic monitoring programs viable, especially where the cost of missed leaks or non-compliance is high.

Market instances

  • 2025: EPA continued advancing Next Generation Emission Measurement research, including portable and stationary sensor technologies for fugitive emissions and fenceline monitoring. Why it matters: lower-cost, near-source monitoring expands the number of economically observable emissions points. Impact: chemical sensor suppliers can move from periodic sampling toward distributed monitoring networks.
  • 2025: EPA highlighted Sensor Pod development and field use for volatile-organic-compound fenceline monitoring, with commercially available versions and emerging partnerships. Why it matters: sensor networks are becoming a practical environmental-monitoring architecture. Impact: connected chemical sensing can expand beyond traditional industrial instruments.

Access requires performance evidence, calibration practices and compliance compatibility. In safety-critical applications, customers typically care about documented response behavior and maintenance support as much as the sensing principle itself. Vendors that can provide the sensing hardware, calibration ecosystem and data-management interfaces are best positioned to capture recurring value.

Europe REGULATION-LED

Why does Europe remain a strong chemical sensor market?

Europe combines a large chemical and industrial base with stringent environmental and workplace expectations. Sensors are therefore purchased not only to improve operations but also to document compliance and manage emissions, occupational exposure and water quality. The market favors technologies that can deliver reliable measurements over long periods and integrate into digital industrial systems, creating opportunities for connected sensing and higher-value analytics.

Market positionSecond
Growth outlookModerate to strong
Demand profileCompliance and industrial
Market access gateRegulatory documentation and interoperability
Country Position in region What drives demand
Germany Largest industrial demand Chemicals, automotive, process industries and environmental monitoring support wide sensor deployment.
France Industrial and public monitoring Environmental, industrial safety and research applications create diversified chemical sensing demand.
U.K. Research and smart monitoring Universities, industrial sites and environmental programs support advanced sensor development and deployment.
Nordics Smart environmental monitoring Air-quality, industrial and smart-city applications emphasize low-power connected sensing.

European procurement can place a premium on traceability and data quality because measurements may feed environmental reporting, workplace safety systems or process control. That increases the commercial importance of calibration records, stable firmware and interoperable communications. Suppliers able to sell a complete measurement workflow can therefore defend pricing better than those offering a sensor element without integration capability.

Industrial digitalization is also raising the value of remote monitoring. When chemical sensors are connected into a plant network, operators can move from manual rounds toward continuous alerts and predictive maintenance. The supplier opportunity expands from a component to a system, but it also requires cybersecurity, communications reliability and software support that traditional sensor manufacturers may not have historically emphasized.

Market instances

  • 2025: European industrial operators continued investing in continuous emissions and environmental measurement capabilities as compliance expectations increased. Why it matters: sensor demand becomes recurring and data-driven. Impact: connected chemical sensing gains importance relative to standalone periodic instruments.
  • 2025: Automotive and industrial electronics programs continued adding more embedded sensing and control functions. Why it matters: sensor count rises while packaging and calibration constraints tighten. Impact: suppliers with compact, stable and automotive-ready chemical sensing gain design-in opportunities.

Access is shaped by regulatory and customer-specific requirements. Suppliers need clear performance documentation, stable calibration methods and communications interfaces that fit established industrial control systems. In specialized applications, qualification evidence can be as important as raw sensitivity because replacing a validated sensor later creates operational and regulatory risk.

Asia Pacific FASTEST-GROWING

Why is Asia Pacific the fastest-growing chemical sensor region?

Asia Pacific is expanding fastest because sensor demand is being added at the same time as industrial capacity, urban infrastructure and environmental monitoring requirements. China, Japan, South Korea and India combine large manufacturing bases with increasing deployment of connected sensing. The result is a wider addressable installation base, particularly in factories, utilities, air-quality monitoring and automotive systems, where sensors can be deployed at scale.

Market positionThird largest current base
Growth outlookFastest
Demand profileIndustrialization led
Market access gateScale, local support and certification
Country Position in region What drives demand
China Largest Large manufacturing base and environmental monitoring programs create extensive demand for industrial and gas sensors.
Japan Technology intensive Advanced sensor, automotive and industrial electronics support premium sensing architectures.
South Korea Electronics and manufacturing Industrial automation and advanced electronics create demand for compact connected sensors.
India High growth Pharmaceutical, chemicals, manufacturing and environmental monitoring are expanding the installed base.
Southeast Asia Capacity diversification Industrial relocation and smart-factory projects support new sensor installations.

The region’s strongest growth mechanism is greenfield deployment. New factories can design monitoring infrastructure around connected sensors from the beginning, avoiding the retrofit costs faced by older plants. This makes wireless networking, low-power operation and digital interfaces particularly valuable because they reduce installation complexity and allow sensors to be scaled across large facilities.

Local manufacturing also changes the cost structure. As sensor production and industrial integration capabilities grow within Asia, suppliers can shorten delivery times and adapt products to local requirements. Global brands therefore face increasing competition from regional providers that can combine adequate performance with faster support and lower total installation cost.

Market instances

  • 2025: Asian industrial expansion and semiconductor, automotive and pharmaceutical manufacturing programs continued increasing the number of monitored production points. Why it matters: more process steps need chemical and environmental sensing. Impact: sensor volumes can grow through distributed factory deployment.
  • 2025: Smart-city and air-quality monitoring initiatives across major Asian markets continued expanding connected measurement networks. Why it matters: environmental sensing becomes a network architecture rather than a single instrument. Impact: wireless chemical sensors gain relevance in urban and infrastructure projects.

Market access depends on scale, local engineering and product compliance. High-growth customers need sensors that can be qualified quickly and supplied consistently across multiple sites. Suppliers that localize application engineering and service while retaining global manufacturing quality can capture more of this greenfield demand.

South America MINING & ENERGY FOCUS

Where does chemical sensing grow in South America?

South America’s chemical sensor market is shaped by resource-intensive industries and environmental monitoring. Brazil provides the broadest industrial base, while mining economies create strong demand for gas detection and process measurement. Sensor suppliers benefit from rugged designs and strong field service because operating conditions can be remote and harsh. Commercial growth is often project-led, making distributor capability and service responsiveness as important as product performance.

Market positionFourth
Growth outlookModerate
Demand profileMining and energy
Market access gateField service and distributor support
Country Position in region What drives demand
Brazil Largest Oil & gas, industrial processing, agriculture and environmental applications provide the broadest demand.
Argentina Selective Industrial, energy and environmental monitoring create targeted opportunities.
Chile Mining leader Copper mining and process industries require gas, chemical and environmental sensing in demanding sites.

Mining creates a strong use case for rugged chemical sensing because worker safety and process control depend on detecting gases or chemical exposure quickly. The commercial response favors durable sensors, portable instruments and field calibration support. Suppliers that can reduce downtime caused by sensor failure or maintenance can justify a premium even in cost-sensitive markets.

Environmental monitoring adds a second demand stream. Industrial operators increasingly need measurements that can be reported or trended over time, which encourages deployment of networked sensors around plants, mines and water-treatment facilities. This creates opportunities for low-power systems that can operate remotely with limited maintenance.

Market instances

  • 2025: Mining and industrial operations in Brazil and Chile continued deploying automation and safety systems to support productivity and worker protection. Why it matters: sensing becomes embedded in control and safety infrastructure. Impact: rugged chemical sensors gain recurring replacement and expansion demand.
  • 2025: Environmental monitoring initiatives across major urban and industrial zones continued emphasizing measurement and compliance. Why it matters: low-cost distributed sensing can complement laboratory analysis. Impact: portable and connected chemical sensors can address broader monitoring footprints.

The most important market-access gate is dependable field support. Remote operating environments increase the value of calibration, replacement elements and rapid troubleshooting. Distributors that hold service capability can therefore create a stronger local position than sellers offering only catalog availability.

Middle East & Africa ENERGY & PROJECT LED

What drives chemical sensor demand in Middle East & Africa?

The Middle East & Africa market is driven by oil and gas, industrial safety, mining, infrastructure and selected security applications. Chemical sensing is often embedded in complete systems, so demand follows capital projects and plant upgrades. Suppliers that can meet hazardous-area requirements and provide dependable service through regional integrators have an advantage because project schedules place high value on equipment availability and qualification certainty.

Market positionSmallest
Growth outlookSelective
Demand profileEnergy and security
Market access gateHazardous-area qualification and project execution
Country Position in region What drives demand
Saudi Arabia Largest GCC market Oilfield monitoring, industrial safety and large infrastructure projects create demand for gas and chemical sensors.
UAE Project hub Industrial automation, smart cities and energy applications support connected sensing.
Israel Advanced security and electronics Defense, homeland security and high-tech sensing create premium specialized opportunities.
South Africa Mining focused Worker safety and environmental monitoring support rugged gas and chemical sensors.

Energy projects can require dense monitoring across process units, storage areas and utilities, creating demand for sensors that integrate with plant control and safety systems. The purchase decision often values hazardous-area suitability, maintenance access and service continuity. Vendors that package sensing with monitoring software and integration support can capture a larger share of project value.

Smart infrastructure creates an additional connected-sensing opportunity. Municipal and industrial operators can use networked sensors for environmental monitoring, asset management and public-safety applications, provided the systems can operate reliably in high temperatures and distributed environments. This encourages suppliers to emphasize low maintenance and remote diagnostics rather than standalone sensor performance alone.

Market instances

  • 2025: Gulf energy and infrastructure programs continued investing in digital monitoring and industrial automation. Why it matters: more process points require continuous measurement. Impact: connected chemical sensor deployments can grow with plant modernization.
  • 2025: Mining safety and environmental programs in southern Africa continued emphasizing hazard detection and worker protection. Why it matters: harsh environments increase the value of rugged chemical sensing. Impact: suppliers with field-service networks can gain share in replacement and expansion programs.

Market entry is project based and typically requires a qualified local integrator, documented environmental and hazardous-area performance, and reliable after-sales service. Suppliers that can satisfy these requirements are better positioned to participate in large projects where the sensor is one element of a broader safety or monitoring system.

Competitive Landscape

Competition in chemical sensors spans global industrial automation companies, gas-detection specialists, analytical-instrument suppliers and automotive sensor manufacturers. Differentiation is built around sensing chemistry, calibration stability, selectivity, ruggedness, connectivity and application-specific certification. The competitive landscape is therefore broader than a component market because many suppliers compete through complete instruments and monitoring systems rather than sensing elements alone.

Key Industry Players

  • ABB
  • 3M
  • Emerson Electric
  • BorgWarner
  • NGK SPARK PLUG (Niterra)
  • Honeywell
  • Siemens
  • Xylem Inc
  • Thermo Fisher Scientific
  • Teledyne Technologies Incorporated
  • Industrial Scientific
  • Amphenol
  • Nemoto
  • DENSO Auto Parts
  • Intelligent Optical Systems

Large industrial suppliers compete by integrating chemical sensing into automation, control and safety platforms. ABB, Emerson, Honeywell and Siemens can leverage installed industrial relationships and control-system compatibility, reducing the commercial friction of introducing new sensing hardware. Their advantage is strongest where the buyer wants one vendor accountable for sensing, communications and plant integration rather than a discrete sensor purchased independently.

Specialized suppliers defend applications through chemistry and detection expertise. Companies focused on gas detection, analytical instruments or optical sensing can win where performance requirements are narrow and the buyer values application knowledge. In these segments, response time, cross-sensitivity, calibration burden and field ruggedness matter more than broad corporate scale, creating defensible niches for specialists.

Automotive suppliers add another competitive dimension because chemical sensing can be embedded directly into vehicles and mobility systems. Automotive qualification and volume discipline can be powerful barriers to entry, but suppliers that establish design wins can access long production runs. This pushes competition toward miniaturization, temperature stability, repeatability and low total cost per vehicle rather than laboratory-style analytical performance alone.

The market is also moving toward system competition. A supplier that combines a sensor with wireless connectivity, software, calibration and maintenance can solve a larger customer problem and generate recurring revenue. This model raises switching costs, especially in industrial sites where sensor data feeds safety or compliance processes, and it creates more value than a standalone transducer sold as a replaceable part.

Production Capacity Analysis

Chemical sensor capacity is constrained by sensing-material consistency, microfabrication or electrode processing, calibration infrastructure and the ability to maintain repeatable performance across large production runs. For specialized sensors, the real bottleneck may be calibration and validation rather than assembly. Suppliers expanding capacity therefore need to scale quality-control systems and reference-gas or reference-solution infrastructure alongside physical manufacturing equipment.

Capacity stage Primary constraint Commercial implication
Sensing materials Electrode, catalyst, semiconductor or optical-material consistency Material variability can shift sensitivity and calibration behavior, so qualified inputs are a major capacity-quality gate.
Sensor fabrication Microfabrication, coating and assembly yield Higher volumes require stable process windows because small changes can affect sensitivity and cross-sensitivity.
Calibration and validation Reference standards, test equipment and repeatability This can become the limiting capacity for safety-critical products, especially when every batch or unit requires extensive testing.
Systems integration Electronics, firmware, communications and field qualification Connected products may have ample physical sensor capacity but remain commercially constrained by software and integration resources.

The commercial implication is that capacity should be measured as qualified, shippable sensor output rather than raw assembly throughput. A manufacturer may be able to assemble more units physically while lacking enough calibration bandwidth, reference standards or application-engineering resources to release them. For industrial and safety products, disciplined validation is part of the product itself, making scalable quality systems a prerequisite for meaningful capacity expansion.

Market Dynamics

The market benefits from stricter monitoring requirements, more distributed industrial automation and greater use of portable and connected sensing. At the same time, sensor replacement cycles, calibration needs and cross-sensitivity constrain adoption by increasing total ownership cost. The resulting competitive environment favors suppliers that can improve sensitivity while reducing maintenance and making data easier to collect, transmit and interpret.

Market Drivers

Environmental monitoring expansion

Environmental programs are expanding the number of measurement points and increasing the frequency of monitoring. EPA research, for example, is evaluating lower-cost portable and stationary technologies for fugitive emissions and fenceline monitoring. The mechanism is straightforward: when monitoring becomes cheaper and more continuous, more sites can be measured, which increases sensor demand. Suppliers respond by developing lower-power, networked devices that can operate for longer periods with less field maintenance.

Industrial safety and process control

Chemical, oil and gas, pharmaceutical and manufacturing facilities use sensors to detect hazardous conditions and maintain process stability. These requirements create demand even when broader capital spending is volatile because safety and compliance functions cannot simply be removed. Suppliers that improve calibration intervals, resistance to poisoning and integration with control systems can create measurable operational value, encouraging customers to upgrade installed fleets rather than simply replace failed devices.

IoT and wireless connectivity

Wireless connectivity changes the economics of chemical sensing by reducing wiring and allowing sensors to be installed across large or difficult-to-reach areas. The requirement for remote monitoring drives technology responses such as low-power electronics, battery management and network protocols. Suppliers that combine these functions with reliable sensing can sell distributed monitoring solutions rather than individual points, increasing system revenue and creating recurring service opportunities around data and maintenance.

Portable and wearable detection

Field workers, emergency responders and healthcare users increasingly need chemical detection outside fixed laboratory or plant environments. Portable sensing creates demand for smaller packages, faster startup and simpler calibration. Semiconductor and optical technologies can benefit where miniaturization and selectivity are important, while established electrochemical designs remain attractive where the priority is dependable operation at manageable cost. This is broadening the market from industrial fixed equipment to mobile measurement platforms.

Market Restraints

Calibration burden

Chemical sensor accuracy often depends on calibration against known standards, particularly when sensors are exposed to changing temperature, humidity or contaminant mixtures. Frequent calibration increases service costs and can limit the economic case for dense deployments. Suppliers can mitigate the restraint through more stable sensing elements, compensation algorithms and remote diagnostics, but the need for trustworthy calibration remains fundamental because safety and compliance users cannot accept uncertain readings.

Cross-sensitivity

Many sensing technologies respond to more than one chemical species, creating false positives or distorted measurements when real-world mixtures differ from laboratory conditions. Customers therefore value selective chemistry, compensation methods and sensor arrays, but these add cost and engineering complexity. The restraint is particularly important in industrial and security applications where an incorrect alarm can create operational disruption just as serious as a missed event.

Limited sensing-element lifetime

Sensing performance can degrade as electrodes, catalysts or optical components age, especially in corrosive or high-exposure environments. Replacement requirements create recurring demand, but they also increase lifecycle cost and can discourage sensor installation in remote locations. Suppliers that extend operating life or enable condition monitoring can reduce this friction, making lifetime performance an important source of differentiation alongside initial detection sensitivity.

Regulatory qualification

Safety-critical sensing can face lengthy approval and qualification cycles because the consequences of failure are high. This favors established technologies and suppliers with documented test procedures, but it can slow introduction of innovative materials and algorithms. New entrants therefore need to support customers through certification, field trials and validation, which increases development cost before commercial scale is reached.

Market Opportunities

Distributed fugitive-emission monitoring

Lower-cost sensor pods and networked monitoring create an opportunity to expand emissions measurement beyond fixed regulatory stations. Industrial operators benefit from better localization of leaks and earlier intervention, while sensor suppliers gain a larger installed base. The commercial implication is strongest for vendors that can provide both the sensor node and the analytics workflow needed to identify abnormal readings and prioritize maintenance actions.

Smart factories

Factory digitalization creates new chemical-sensing opportunities around process monitoring, solvent exposure, leak detection and predictive maintenance. Sensors can feed analytics platforms that detect changes before an alarm threshold is crossed, shifting value from response to prevention. Suppliers that provide standardized interfaces, wireless connectivity and reliable calibration support can integrate into broader industrial IoT architectures and become part of the plant’s continuous monitoring infrastructure.

Food safety and quality control

Food processing creates a growing niche for chemical sensing because contamination, spoilage and process deviations can have direct economic and regulatory consequences. Portable and inline sensors can reduce reliance on slower laboratory workflows where rapid decisions are valuable. The opportunity favors suppliers able to deliver high selectivity at practical cost, with compact designs and calibration procedures that production operators can use without advanced analytical training.

Defense and CBRN detection

Chemical threat detection requires fast, selective and rugged sensing under field conditions. The commercial opportunity is concentrated but high value because the cost of false negatives is extreme. Suppliers that can combine sensor chemistry with portable power, communications and algorithmic discrimination can capture system-level value. Long procurement cycles are a barrier, but once qualified, products may benefit from sustained replacement and upgrade programs.

Supply Chain Analysis

1. Sensing MaterialsElectrodes, catalysts, semiconductor films, membranes and optical elements
2. Sensor FabricationCoating, deposition, microfabrication and assembly
3. Calibration & ElectronicsReference standards, signal conditioning, firmware and networking
4. System IntegrationEnclosures, software, field deployment and maintenance

Upstream sensing materials determine much of the final device’s behavior. Electrode chemistry, catalyst activity, membrane properties and semiconductor surface treatments influence sensitivity and cross-sensitivity, so qualified materials can be difficult to replace quickly. Suppliers often invest in proprietary formulations or long-term vendor relationships because an apparently small material change can trigger substantial recalibration and customer requalification work.

Sensor fabrication converts those materials into a repeatable transducer. Coating thickness, deposition uniformity, microstructure and packaging can affect response time and lifetime, making process control a central value driver. Manufacturers that scale this step successfully can lower unit cost while preserving performance, but only when inspection and calibration capacity grow alongside production. That makes manufacturing engineering a direct contributor to commercial competitiveness.

Calibration and electronics are the bridge between sensing chemistry and a usable measurement. Reference standards establish response curves, while signal processing compensates for temperature, humidity and other variables. Connected products also require firmware and communications hardware. Suppliers that integrate these functions can deliver a more reliable field product and reduce customer engineering work, which increases switching costs and supports higher system-level margins.

System integration captures the final layer of value through enclosures, hazardous-area protection, software dashboards, wireless networking and maintenance services. As chemical sensing becomes more distributed, integration increasingly determines the economics of deployment. A sensor with excellent laboratory performance can still lose a commercial program if installation is difficult, battery life is poor or data cannot be integrated into the customer’s control or analytics environment.

Recent Developments

November 6, 2025

Development: The U.S. EPA described ongoing work to advance lower-cost air measurement and monitoring capabilities for emissions, air quality and exposure characterization. Why it matters: The development supports the long-term shift toward more frequent and distributed environmental measurements, expanding the potential addressable market for portable and connected chemical sensors.

November 12, 2025

Development: EPA highlighted sensor-pod development for volatile-organic-compound fenceline monitoring, including field applications and emerging partnerships to broaden availability. Why it matters: This demonstrates how networked chemical sensing can move from specialized pilots toward broader industrial monitoring architectures, increasing demand for low-cost, scalable sensor nodes.

2025

Development: EPA’s Next Generation Emission Measurement work continued evaluating mobile and stationary sensor technologies for industrial fugitive emissions and fenceline monitoring. Why it matters: The program reinforces the commercial importance of lower-cost, near-source monitoring and the opportunity for sensors that combine chemical detection with networking and field analytics.

Report Scope & Segmentation

Attribute Report scope
Market Chemical Sensors
Base year 2025
Forecast period 2026–2034
Source-page endpoint 2033
2025 market size USD 24.98 billion
2034 projected size USD 43.05 billion
CAGR 6.2% (2026–2034)
By Type Electrochemical Sensors; Optical Sensors; Semiconductor Sensors; Pellistor/Catalytic Bead Sensors; Others
By Application Industrial; Environmental Monitoring; Medical; Homeland Security; Automotive; Others
By End User Manufacturing Facilities; Government Agencies; Healthcare Institutions; Research Organizations
By Technology Contact Sensors; Non-Contact Sensors; Wireless Sensor Networks
By Detection Medium Gas Sensors; Liquid Sensors; Solid State Sensors
Regions North America; Europe; Asia Pacific; South America; Middle East & Africa
Profiled companies ABB; 3M; Emerson Electric; BorgWarner; NGK SPARK PLUG (Niterra); Honeywell; Siemens; Xylem Inc; Thermo Fisher Scientific; Teledyne Technologies Incorporated; Industrial Scientific; Amphenol; Nemoto; DENSO Auto Parts; Intelligent Optical Systems

Frequently Asked Questions

What is the 2025 chemical sensors market size?

The global chemical sensors market was valued at USD 24.98 billion in 2025 according to the report page. The market covers sensing technologies used to detect chemical concentration, composition or presence across industrial, environmental, medical, homeland-security and automotive applications.

What is the projected chemical sensors market size by 2034?

Using the report-page 2025 and 2033 anchors and extending the implied constant growth path, the market reaches approximately USD 43.05 billion by 2034. The strongest structural demand comes from industrial monitoring, environmental measurement and connected sensing deployments.

What is the expected CAGR from 2026 to 2034?

The anchor-implied growth rate is approximately 6.2% during 2026–2034. The rate is used consistently with the published market-size anchors rather than relying on a separate CAGR label when constructing the extended forecast series.

Which chemical sensor type is the largest?

Electrochemical sensors are the largest product type in the report, with a stated share of about 35% of the market. Their combination of sensitivity, rapid response and established industrial applications supports broad use in gas detection and water-quality monitoring.

Which application is the largest?

Industrial applications are the largest, representing about 40% of market demand in the report. Chemical plants, petrochemical facilities, pharmaceutical operations and other factories use chemical sensors for process control, safety monitoring and compliance-related measurement.

Which region is largest?

North America is presented as the largest regional market, with a stated share of about 30%. Its position reflects mature industrial automation, environmental regulation, healthcare innovation, defense applications and a strong ecosystem of sensor and instrumentation suppliers.

Which region is growing fastest?

Asia Pacific is the fastest-growing region because industrialization, environmental monitoring and smart-infrastructure deployment are expanding the number of locations that require chemical sensing. China, Japan, South Korea and India provide important demand centers across industry, electronics and healthcare.

What are the main restraints?

Calibration requirements, cross-sensitivity, limited sensing-element lifetime and regulatory qualification can increase total cost of ownership and slow deployment. These challenges are particularly important in safety-critical applications where inaccurate or unstable readings can create operational or compliance risk.

What are the main opportunities?

Distributed emissions monitoring, smart factories, food safety, portable detection and chemical threat detection provide important opportunities. Connected sensors can expand the addressable market by lowering installation barriers and allowing measurements to be distributed across facilities, infrastructure and field operations.

Who are the key chemical sensor companies?

The profiled company universe includes ABB, 3M, Emerson Electric, BorgWarner, NGK SPARK PLUG (Niterra), Honeywell, Siemens, Xylem, Thermo Fisher Scientific, Teledyne Technologies, Industrial Scientific, Amphenol, Nemoto, DENSO and Intelligent Optical Systems.

Chemical Sensors Market, Global Business Strategies 2026-2034

Get Sample Report PDF for Exclusive Insights

Report Sample Includes

  • Table of Contents
  • List of Tables & Figures
  • Charts, Research Methodology, and more...

PDF Icon Download Sample Report PDF
SKU: 4ad8ee53ae88
Category:
Tag:
License Type

Corporate License, Excel License, PDF and Excel Databook License

Download Sample Report

Table of Content

1 Introduction to Research & Analysis Reports
1.1 Chemical Sensors Market Definition
1.2 Market Segments
1.2.1 Segment by Type
1.2.2 Segment by Application
1.3 Global Chemical Sensors Market Overview
1.4 Features & Benefits of This Report
1.5 Methodology & Sources of Information
1.5.1 Research Methodology
1.5.2 Research Process
1.5.3 Base Year
1.5.4 Report Assumptions & Caveats
2 Global Chemical Sensors Overall Market Size
2.1 Global Chemical Sensors Market Size: 2024 VS 2032
2.2 Global Chemical Sensors Market Size, Prospects & Forecasts: 2020-2032
2.3 Global Chemical Sensors Sales: 2020-2032
3 Company Landscape
3.1 Top Chemical Sensors Players in Global Market
3.2 Top Global Chemical Sensors Companies Ranked by Revenue
3.3 Global Chemical Sensors Revenue by Companies
3.4 Global Chemical Sensors Sales by Companies
3.5 Global Chemical Sensors Price by Manufacturer (2020-2025)
3.6 Top 3 and Top 5 Chemical Sensors Companies in Global Market, by Revenue in 2024
3.7 Global Manufacturers Chemical Sensors Product Type
3.8 Tier 1, Tier 2, and Tier 3 Chemical Sensors Players in Global Market
3.8.1 List of Global Tier 1 Chemical Sensors Companies
3.8.2 List of Global Tier 2 and Tier 3 Chemical Sensors Companies
4 Sights by Product
4.1 Overview
4.1.1 Segment by Type – Global Chemical Sensors Market Size Markets, 2024 & 2032
4.1.2 Electrochemical Sensors
4.1.3 Optical Sensors
4.1.4 Semiconductor Sensors
4.1.5 Pellistor/Catalytic Bead Sensors
4.1.6 Others
4.2 Segment by Type – Global Chemical Sensors Revenue & Forecasts
4.2.1 Segment by Type – Global Chemical Sensors Revenue, 2020-2025
4.2.2 Segment by Type – Global Chemical Sensors Revenue, 2026-2032
4.2.3 Segment by Type – Global Chemical Sensors Revenue Market Share, 2020-2032
4.3 Segment by Type – Global Chemical Sensors Sales & Forecasts
4.3.1 Segment by Type – Global Chemical Sensors Sales, 2020-2025
4.3.2 Segment by Type – Global Chemical Sensors Sales, 2026-2032
4.3.3 Segment by Type – Global Chemical Sensors Sales Market Share, 2020-2032
4.4 Segment by Type – Global Chemical Sensors Price (Manufacturers Selling Prices), 2020-2032
5 Sights by Application
5.1 Overview
5.1.1 Segment by Application – Global Chemical Sensors Market Size, 2024 & 2032
5.1.2 Industrial
5.1.3 Environmental Monitoring
5.1.4 Medical
5.1.5 Homeland Security
5.1.6 Automotive
5.1.7 Others
5.2 Segment by Application – Global Chemical Sensors Revenue & Forecasts
5.2.1 Segment by Application – Global Chemical Sensors Revenue, 2020-2025
5.2.2 Segment by Application – Global Chemical Sensors Revenue, 2026-2032
5.2.3 Segment by Application – Global Chemical Sensors Revenue Market Share, 2020-2032
5.3 Segment by Application – Global Chemical Sensors Sales & Forecasts
5.3.1 Segment by Application – Global Chemical Sensors Sales, 2020-2025
5.3.2 Segment by Application – Global Chemical Sensors Sales, 2026-2032
5.3.3 Segment by Application – Global Chemical Sensors Sales Market Share, 2020-2032
5.4 Segment by Application – Global Chemical Sensors Price (Manufacturers Selling Prices), 2020-2032
6 Sights by Region
6.1 By Region – Global Chemical Sensors Market Size, 2024 & 2032
6.2 By Region – Global Chemical Sensors Revenue & Forecasts
6.2.1 By Region – Global Chemical Sensors Revenue, 2020-2025
6.2.2 By Region – Global Chemical Sensors Revenue, 2026-2032
6.2.3 By Region – Global Chemical Sensors Revenue Market Share, 2020-2032
6.3 By Region – Global Chemical Sensors Sales & Forecasts
6.3.1 By Region – Global Chemical Sensors Sales, 2020-2025
6.3.2 By Region – Global Chemical Sensors Sales, 2026-2032
6.3.3 By Region – Global Chemical Sensors Sales Market Share, 2020-2032
6.4 North America
6.4.1 By Country – North America Chemical Sensors Revenue, 2020-2032
6.4.2 By Country – North America Chemical Sensors Sales, 2020-2032
6.4.3 United States Chemical Sensors Market Size, 2020-2032
6.4.4 Canada Chemical Sensors Market Size, 2020-2032
6.4.5 Mexico Chemical Sensors Market Size, 2020-2032
6.5 Europe
6.5.1 By Country – Europe Chemical Sensors Revenue, 2020-2032
6.5.2 By Country – Europe Chemical Sensors Sales, 2020-2032
6.5.3 Germany Chemical Sensors Market Size, 2020-2032
6.5.4 France Chemical Sensors Market Size, 2020-2032
6.5.5 U.K. Chemical Sensors Market Size, 2020-2032
6.5.6 Italy Chemical Sensors Market Size, 2020-2032
6.5.7 Russia Chemical Sensors Market Size, 2020-2032
6.5.8 Nordic Countries Chemical Sensors Market Size, 2020-2032
6.5.9 Benelux Chemical Sensors Market Size, 2020-2032
6.6 Asia
6.6.1 By Region – Asia Chemical Sensors Revenue, 2020-2032
6.6.2 By Region – Asia Chemical Sensors Sales, 2020-2032
6.6.3 China Chemical Sensors Market Size, 2020-2032
6.6.4 Japan Chemical Sensors Market Size, 2020-2032
6.6.5 South Korea Chemical Sensors Market Size, 2020-2032
6.6.6 Southeast Asia Chemical Sensors Market Size, 2020-2032
6.6.7 India Chemical Sensors Market Size, 2020-2032
6.7 South America
6.7.1 By Country – South America Chemical Sensors Revenue, 2020-2032
6.7.2 By Country – South America Chemical Sensors Sales, 2020-2032
6.7.3 Brazil Chemical Sensors Market Size, 2020-2032
6.7.4 Argentina Chemical Sensors Market Size, 2020-2032
6.8 Middle East & Africa
6.8.1 By Country – Middle East & Africa Chemical Sensors Revenue, 2020-2032
6.8.2 By Country – Middle East & Africa Chemical Sensors Sales, 2020-2032
6.8.3 Turkey Chemical Sensors Market Size, 2020-2032
6.8.4 Israel Chemical Sensors Market Size, 2020-2032
6.8.5 Saudi Arabia Chemical Sensors Market Size, 2020-2032
6.8.6 UAE Chemical Sensors Market Size, 2020-2032
7 Manufacturers & Brands Profiles
7.1 ABB
7.1.1 ABB Company Summary
7.1.2 ABB Business Overview
7.1.3 ABB Chemical Sensors Major Product Offerings
7.1.4 ABB Chemical Sensors Sales and Revenue in Global (2020-2025)
7.1.5 ABB Key News & Latest Developments
7.2 3M
7.2.1 3M Company Summary
7.2.2 3M Business Overview
7.2.3 3M Chemical Sensors Major Product Offerings
7.2.4 3M Chemical Sensors Sales and Revenue in Global (2020-2025)
7.2.5 3M Key News & Latest Developments
7.3 Emerson Electric
7.3.1 Emerson Electric Company Summary
7.3.2 Emerson Electric Business Overview
7.3.3 Emerson Electric Chemical Sensors Major Product Offerings
7.3.4 Emerson Electric Chemical Sensors Sales and Revenue in Global (2020-2025)
7.3.5 Emerson Electric Key News & Latest Developments
7.4 BorgWarner
7.4.1 BorgWarner Company Summary
7.4.2 BorgWarner Business Overview
7.4.3 BorgWarner Chemical Sensors Major Product Offerings
7.4.4 BorgWarner Chemical Sensors Sales and Revenue in Global (2020-2025)
7.4.5 BorgWarner Key News & Latest Developments
7.5 NGK SPARK PLUG (Niterra)
7.5.1 NGK SPARK PLUG (Niterra) Company Summary
7.5.2 NGK SPARK PLUG (Niterra) Business Overview
7.5.3 NGK SPARK PLUG (Niterra) Chemical Sensors Major Product Offerings
7.5.4 NGK SPARK PLUG (Niterra) Chemical Sensors Sales and Revenue in Global (2020-2025)
7.5.5 NGK SPARK PLUG (Niterra) Key News & Latest Developments
7.6 Honeywell
7.6.1 Honeywell Company Summary
7.6.2 Honeywell Business Overview
7.6.3 Honeywell Chemical Sensors Major Product Offerings
7.6.4 Honeywell Chemical Sensors Sales and Revenue in Global (2020-2025)
7.6.5 Honeywell Key News & Latest Developments
7.7 Siemens
7.7.1 Siemens Company Summary
7.7.2 Siemens Business Overview
7.7.3 Siemens Chemical Sensors Major Product Offerings
7.7.4 Siemens Chemical Sensors Sales and Revenue in Global (2020-2025)
7.7.5 Siemens Key News & Latest Developments
7.8 Xylem Inc
7.8.1 Xylem Inc Company Summary
7.8.2 Xylem Inc Business Overview
7.8.3 Xylem Inc Chemical Sensors Major Product Offerings
7.8.4 Xylem Inc Chemical Sensors Sales and Revenue in Global (2020-2025)
7.8.5 Xylem Inc Key News & Latest Developments
7.9 Thermo Fisher Scientific
7.9.1 Thermo Fisher Scientific Company Summary
7.9.2 Thermo Fisher Scientific Business Overview
7.9.3 Thermo Fisher Scientific Chemical Sensors Major Product Offerings
7.9.4 Thermo Fisher Scientific Chemical Sensors Sales and Revenue in Global (2020-2025)
7.9.5 Thermo Fisher Scientific Key News & Latest Developments
7.10 Teledyne Technologies Incorporated
7.10.1 Teledyne Technologies Incorporated Company Summary
7.10.2 Teledyne Technologies Incorporated Business Overview
7.10.3 Teledyne Technologies Incorporated Chemical Sensors Major Product Offerings
7.10.4 Teledyne Technologies Incorporated Chemical Sensors Sales and Revenue in Global (2020-2025)
7.10.5 Teledyne Technologies Incorporated Key News & Latest Developments
7.11 Industrial Scientific
7.11.1 Industrial Scientific Company Summary
7.11.2 Industrial Scientific Business Overview
7.11.3 Industrial Scientific Chemical Sensors Major Product Offerings
7.11.4 Industrial Scientific Chemical Sensors Sales and Revenue in Global (2020-2025)
7.11.5 Industrial Scientific Key News & Latest Developments
7.12 Amphenol
7.12.1 Amphenol Company Summary
7.12.2 Amphenol Business Overview
7.12.3 Amphenol Chemical Sensors Major Product Offerings
7.12.4 Amphenol Chemical Sensors Sales and Revenue in Global (2020-2025)
7.12.5 Amphenol Key News & Latest Developments
7.13 Nemoto
7.13.1 Nemoto Company Summary
7.13.2 Nemoto Business Overview
7.13.3 Nemoto Chemical Sensors Major Product Offerings
7.13.4 Nemoto Chemical Sensors Sales and Revenue in Global (2020-2025)
7.13.5 Nemoto Key News & Latest Developments
7.14 DENSO Auto Parts
7.14.1 DENSO Auto Parts Company Summary
7.14.2 DENSO Auto Parts Business Overview
7.14.3 DENSO Auto Parts Chemical Sensors Major Product Offerings
7.14.4 DENSO Auto Parts Chemical Sensors Sales and Revenue in Global (2020-2025)
7.14.5 DENSO Auto Parts Key News & Latest Developments
7.15 Intelligent Optical Systems
7.15.1 Intelligent Optical Systems Company Summary
7.15.2 Intelligent Optical Systems Business Overview
7.15.3 Intelligent Optical Systems Chemical Sensors Major Product Offerings
7.15.4 Intelligent Optical Systems Chemical Sensors Sales and Revenue in Global (2020-2025)
7.15.5 Intelligent Optical Systems Key News & Latest Developments
7.16 MSA Safety
7.16.1 MSA Safety Company Summary
7.16.2 MSA Safety Business Overview
7.16.3 MSA Safety Chemical Sensors Major Product Offerings
7.16.4 MSA Safety Chemical Sensors Sales and Revenue in Global (2020-2025)
7.16.5 MSA Safety Key News & Latest Developments
7.17 AirTest Technologies
7.17.1 AirTest Technologies Company Summary
7.17.2 AirTest Technologies Business Overview
7.17.3 AirTest Technologies Chemical Sensors Major Product Offerings
7.17.4 AirTest Technologies Chemical Sensors Sales and Revenue in Global (2020-2025)
7.17.5 AirTest Technologies Key News & Latest Developments
8 Global Chemical Sensors Production Capacity, Analysis
8.1 Global Chemical Sensors Production Capacity, 2020-2032
8.2 Chemical Sensors Production Capacity of Key Manufacturers in Global Market
8.3 Global Chemical Sensors Production by Region
9 Key Market Trends, Opportunity, Drivers and Restraints
9.1 Market Opportunities & Trends
9.2 Market Drivers
9.3 Market Restraints
10 Chemical Sensors Supply Chain Analysis
10.1 Chemical Sensors Industry Value Chain
10.2 Chemical Sensors Upstream Market
10.3 Chemical Sensors Downstream and Clients
10.4 Marketing Channels Analysis
10.4.1 Marketing Channels
10.4.2 Chemical Sensors Distributors and Sales Agents in Global
11 Conclusion
12 Appendix
12.1 Note
12.2 Examples of Clients
12.3 DisclaimerList of Tables
Table 1. Key Players of Chemical Sensors in Global Market
Table 2. Top Chemical Sensors Players in Global Market, Ranking by Revenue (2024)
Table 3. Global Chemical Sensors Revenue by Companies, (US$, Mn), 2020-2025
Table 4. Global Chemical Sensors Revenue Share by Companies, 2020-2025
Table 5. Global Chemical Sensors Sales by Companies, (Million Units), 2020-2025
Table 6. Global Chemical Sensors Sales Share by Companies, 2020-2025
Table 7. Key Manufacturers Chemical Sensors Price (2020-2025) & (US$/Unit)
Table 8. Global Manufacturers Chemical Sensors Product Type
Table 9. List of Global Tier 1 Chemical Sensors Companies, Revenue (US$, Mn) in 2024 and Market Share
Table 10. List of Global Tier 2 and Tier 3 Chemical Sensors Companies, Revenue (US$, Mn) in 2024 and Market Share
Table 11. Segment by Type – Global Chemical Sensors Revenue, (US$, Mn), 2024 & 2032
Table 12. Segment by Type – Global Chemical Sensors Revenue (US$, Mn), 2020-2025
Table 13. Segment by Type – Global Chemical Sensors Revenue (US$, Mn), 2026-2032
Table 14. Segment by Type – Global Chemical Sensors Sales (Million Units), 2020-2025
Table 15. Segment by Type – Global Chemical Sensors Sales (Million Units), 2026-2032
Table 16. Segment by Application – Global Chemical Sensors Revenue, (US$, Mn), 2024 & 2032
Table 17. Segment by Application – Global Chemical Sensors Revenue, (US$, Mn), 2020-2025
Table 18. Segment by Application – Global Chemical Sensors Revenue, (US$, Mn), 2026-2032
Table 19. Segment by Application – Global Chemical Sensors Sales, (Million Units), 2020-2025
Table 20. Segment by Application – Global Chemical Sensors Sales, (Million Units), 2026-2032
Table 21. By Region – Global Chemical Sensors Revenue, (US$, Mn), 2025-2032
Table 22. By Region – Global Chemical Sensors Revenue, (US$, Mn), 2020-2025
Table 23. By Region – Global Chemical Sensors Revenue, (US$, Mn), 2026-2032
Table 24. By Region – Global Chemical Sensors Sales, (Million Units), 2020-2025
Table 25. By Region – Global Chemical Sensors Sales, (Million Units), 2026-2032
Table 26. By Country – North America Chemical Sensors Revenue, (US$, Mn), 2020-2025
Table 27. By Country – North America Chemical Sensors Revenue, (US$, Mn), 2026-2032
Table 28. By Country – North America Chemical Sensors Sales, (Million Units), 2020-2025
Table 29. By Country – North America Chemical Sensors Sales, (Million Units), 2026-2032
Table 30. By Country – Europe Chemical Sensors Revenue, (US$, Mn), 2020-2025
Table 31. By Country – Europe Chemical Sensors Revenue, (US$, Mn), 2026-2032
Table 32. By Country – Europe Chemical Sensors Sales, (Million Units), 2020-2025
Table 33. By Country – Europe Chemical Sensors Sales, (Million Units), 2026-2032
Table 34. By Region – Asia Chemical Sensors Revenue, (US$, Mn), 2020-2025
Table 35. By Region – Asia Chemical Sensors Revenue, (US$, Mn), 2026-2032
Table 36. By Region – Asia Chemical Sensors Sales, (Million Units), 2020-2025
Table 37. By Region – Asia Chemical Sensors Sales, (Million Units), 2026-2032
Table 38. By Country – South America Chemical Sensors Revenue, (US$, Mn), 2020-2025
Table 39. By Country – South America Chemical Sensors Revenue, (US$, Mn), 2026-2032
Table 40. By Country – South America Chemical Sensors Sales, (Million Units), 2020-2025
Table 41. By Country – South America Chemical Sensors Sales, (Million Units), 2026-2032
Table 42. By Country – Middle East & Africa Chemical Sensors Revenue, (US$, Mn), 2020-2025
Table 43. By Country – Middle East & Africa Chemical Sensors Revenue, (US$, Mn), 2026-2032
Table 44. By Country – Middle East & Africa Chemical Sensors Sales, (Million Units), 2020-2025
Table 45. By Country – Middle East & Africa Chemical Sensors Sales, (Million Units), 2026-2032
Table 46. ABB Company Summary
Table 47. ABB Chemical Sensors Product Offerings
Table 48. ABB Chemical Sensors Sales (Million Units), Revenue (US$, Mn) and Average Price (US$/Unit) & (2020-2025)
Table 49. ABB Key News & Latest Developments
Table 50. 3M Company Summary
Table 51. 3M Chemical Sensors Product Offerings
Table 52. 3M Chemical Sensors Sales (Million Units), Revenue (US$, Mn) and Average Price (US$/Unit) & (2020-2025)
Table 53. 3M Key News & Latest Developments
Table 54. Emerson Electric Company Summary
Table 55. Emerson Electric Chemical Sensors Product Offerings
Table 56. Emerson Electric Chemical Sensors Sales (Million Units), Revenue (US$, Mn) and Average Price (US$/Unit) & (2020-2025)
Table 57. Emerson Electric Key News & Latest Developments
Table 58. BorgWarner Company Summary
Table 59. BorgWarner Chemical Sensors Product Offerings
Table 60. BorgWarner Chemical Sensors Sales (Million Units), Revenue (US$, Mn) and Average Price (US$/Unit) & (2020-2025)
Table 61. BorgWarner Key News & Latest Developments
Table 62. NGK SPARK PLUG (Niterra) Company Summary
Table 63. NGK SPARK PLUG (Niterra) Chemical Sensors Product Offerings
Table 64. NGK SPARK PLUG (Niterra) Chemical Sensors Sales (Million Units), Revenue (US$, Mn) and Average Price (US$/Unit) & (2020-2025)
Table 65. NGK SPARK PLUG (Niterra) Key News & Latest Developments
Table 66. Honeywell Company Summary
Table 67. Honeywell Chemical Sensors Product Offerings
Table 68. Honeywell Chemical Sensors Sales (Million Units), Revenue (US$, Mn) and Average Price (US$/Unit) & (2020-2025)
Table 69. Honeywell Key News & Latest Developments
Table 70. Siemens Company Summary
Table 71. Siemens Chemical Sensors Product Offerings
Table 72. Siemens Chemical Sensors Sales (Million Units), Revenue (US$, Mn) and Average Price (US$/Unit) & (2020-2025)
Table 73. Siemens Key News & Latest Developments
Table 74. Xylem Inc Company Summary
Table 75. Xylem Inc Chemical Sensors Product Offerings
Table 76. Xylem Inc Chemical Sensors Sales (Million Units), Revenue (US$, Mn) and Average Price (US$/Unit) & (2020-2025)
Table 77. Xylem Inc Key News & Latest Developments
Table 78. Thermo Fisher Scientific Company Summary
Table 79. Thermo Fisher Scientific Chemical Sensors Product Offerings
Table 80. Thermo Fisher Scientific Chemical Sensors Sales (Million Units), Revenue (US$, Mn) and Average Price (US$/Unit) & (2020-2025)
Table 81. Thermo Fisher Scientific Key News & Latest Developments
Table 82. Teledyne Technologies Incorporated Company Summary
Table 83. Teledyne Technologies Incorporated Chemical Sensors Product Offerings
Table 84. Teledyne Technologies Incorporated Chemical Sensors Sales (Million Units), Revenue (US$, Mn) and Average Price (US$/Unit) & (2020-2025)
Table 85. Teledyne Technologies Incorporated Key News & Latest Developments
Table 86. Industrial Scientific Company Summary
Table 87. Industrial Scientific Chemical Sensors Product Offerings
Table 88. Industrial Scientific Chemical Sensors Sales (Million Units), Revenue (US$, Mn) and Average Price (US$/Unit) & (2020-2025)
Table 89. Industrial Scientific Key News & Latest Developments
Table 90. Amphenol Company Summary
Table 91. Amphenol Chemical Sensors Product Offerings
Table 92. Amphenol Chemical Sensors Sales (Million Units), Revenue (US$, Mn) and Average Price (US$/Unit) & (2020-2025)
Table 93. Amphenol Key News & Latest Developments
Table 94. Nemoto Company Summary
Table 95. Nemoto Chemical Sensors Product Offerings
Table 96. Nemoto Chemical Sensors Sales (Million Units), Revenue (US$, Mn) and Average Price (US$/Unit) & (2020-2025)
Table 97. Nemoto Key News & Latest Developments
Table 98. DENSO Auto Parts Company Summary
Table 99. DENSO Auto Parts Chemical Sensors Product Offerings
Table 100. DENSO Auto Parts Chemical Sensors Sales (Million Units), Revenue (US$, Mn) and Average Price (US$/Unit) & (2020-2025)
Table 101. DENSO Auto Parts Key News & Latest Developments
Table 102. Intelligent Optical Systems Company Summary
Table 103. Intelligent Optical Systems Chemical Sensors Product Offerings
Table 104. Intelligent Optical Systems Chemical Sensors Sales (Million Units), Revenue (US$, Mn) and Average Price (US$/Unit) & (2020-2025)
Table 105. Intelligent Optical Systems Key News & Latest Developments
Table 106. MSA Safety Company Summary
Table 107. MSA Safety Chemical Sensors Product Offerings
Table 108. MSA Safety Chemical Sensors Sales (Million Units), Revenue (US$, Mn) and Average Price (US$/Unit) & (2020-2025)
Table 109. MSA Safety Key News & Latest Developments
Table 110. AirTest Technologies Company Summary
Table 111. AirTest Technologies Chemical Sensors Product Offerings
Table 112. AirTest Technologies Chemical Sensors Sales (Million Units), Revenue (US$, Mn) and Average Price (US$/Unit) & (2020-2025)
Table 113. AirTest Technologies Key News & Latest Developments
Table 114. Chemical Sensors Capacity of Key Manufacturers in Global Market, 2023-2025 (Million Units)
Table 115. Global Chemical Sensors Capacity Market Share of Key Manufacturers, 2023-2025
Table 116. Global Chemical Sensors Production by Region, 2020-2025 (Million Units)
Table 117. Global Chemical Sensors Production by Region, 2026-2032 (Million Units)
Table 118. Chemical Sensors Market Opportunities & Trends in Global Market
Table 119. Chemical Sensors Market Drivers in Global Market
Table 120. Chemical Sensors Market Restraints in Global Market
Table 121. Chemical Sensors Raw Materials
Table 122. Chemical Sensors Raw Materials Suppliers in Global Market
Table 123. Typical Chemical Sensors Downstream
Table 124. Chemical Sensors Downstream Clients in Global Market
Table 125. Chemical Sensors Distributors and Sales Agents in Global Market

List of Figures
Figure 1. Chemical Sensors Product Picture
Figure 2. Chemical Sensors Segment by Type in 2024
Figure 3. Chemical Sensors Segment by Application in 2024
Figure 4. Global Chemical Sensors Market Overview: 2024
Figure 5. Key Caveats
Figure 6. Global Chemical Sensors Market Size: 2024 VS 2032 (US$, Mn)
Figure 7. Global Chemical Sensors Revenue: 2020-2032 (US$, Mn)
Figure 8. Chemical Sensors Sales in Global Market: 2020-2032 (Million Units)
Figure 9. The Top 3 and 5 Players Market Share by Chemical Sensors Revenue in 2024
Figure 10. Segment by Type – Global Chemical Sensors Revenue, (US$, Mn), 2024 & 2032
Figure 11. Segment by Type – Global Chemical Sensors Revenue Market Share, 2020-2032
Figure 12. Segment by Type – Global Chemical Sensors Sales Market Share, 2020-2032
Figure 13. Segment by Type – Global Chemical Sensors Price (US$/Unit), 2020-2032
Figure 14. Segment by Application – Global Chemical Sensors Revenue, (US$, Mn), 2024 & 2032
Figure 15. Segment by Application – Global Chemical Sensors Revenue Market Share, 2020-2032
Figure 16. Segment by Application – Global Chemical Sensors Sales Market Share, 2020-2032
Figure 17. Segment by Application -Global Chemical Sensors Price (US$/Unit), 2020-2032
Figure 18. By Region – Global Chemical Sensors Revenue, (US$, Mn), 2025 & 2032
Figure 19. By Region – Global Chemical Sensors Revenue Market Share, 2020 VS 2024 VS 2032
Figure 20. By Region – Global Chemical Sensors Revenue Market Share, 2020-2032
Figure 21. By Region – Global Chemical Sensors Sales Market Share, 2020-2032
Figure 22. By Country – North America Chemical Sensors Revenue Market Share, 2020-2032
Figure 23. By Country – North America Chemical Sensors Sales Market Share, 2020-2032
Figure 24. United States Chemical Sensors Revenue, (US$, Mn), 2020-2032
Figure 25. Canada Chemical Sensors Revenue, (US$, Mn), 2020-2032
Figure 26. Mexico Chemical Sensors Revenue, (US$, Mn), 2020-2032
Figure 27. By Country – Europe Chemical Sensors Revenue Market Share, 2020-2032
Figure 28. By Country – Europe Chemical Sensors Sales Market Share, 2020-2032
Figure 29. Germany Chemical Sensors Revenue, (US$, Mn), 2020-2032
Figure 30. France Chemical Sensors Revenue, (US$, Mn), 2020-2032
Figure 31. U.K. Chemical Sensors Revenue, (US$, Mn), 2020-2032
Figure 32. Italy Chemical Sensors Revenue, (US$, Mn), 2020-2032
Figure 33. Russia Chemical Sensors Revenue, (US$, Mn), 2020-2032
Figure 34. Nordic Countries Chemical Sensors Revenue, (US$, Mn), 2020-2032
Figure 35. Benelux Chemical Sensors Revenue, (US$, Mn), 2020-2032
Figure 36. By Region – Asia Chemical Sensors Revenue Market Share, 2020-2032
Figure 37. By Region – Asia Chemical Sensors Sales Market Share, 2020-2032
Figure 38. China Chemical Sensors Revenue, (US$, Mn), 2020-2032
Figure 39. Japan Chemical Sensors Revenue, (US$, Mn), 2020-2032
Figure 40. South Korea Chemical Sensors Revenue, (US$, Mn), 2020-2032
Figure 41. Southeast Asia Chemical Sensors Revenue, (US$, Mn), 2020-2032
Figure 42. India Chemical Sensors Revenue, (US$, Mn), 2020-2032
Figure 43. By Country – South America Chemical Sensors Revenue Market Share, 2020-2032
Figure 44. By Country – South America Chemical Sensors Sales, Market Share, 2020-2032
Figure 45. Brazil Chemical Sensors Revenue, (US$, Mn), 2020-2032
Figure 46. Argentina Chemical Sensors Revenue, (US$, Mn), 2020-2032
Figure 47. By Country – Middle East & Africa Chemical Sensors Revenue, Market Share, 2020-2032
Figure 48. By Country – Middle East & Africa Chemical Sensors Sales, Market Share, 2020-2032
Figure 49. Turkey Chemical Sensors Revenue, (US$, Mn), 2020-2032
Figure 50. Israel Chemical Sensors Revenue, (US$, Mn), 2020-2032
Figure 51. Saudi Arabia Chemical Sensors Revenue, (US$, Mn), 2020-2032
Figure 52. UAE Chemical Sensors Revenue, (US$, Mn), 2020-2032
Figure 53. Global Chemical Sensors Production Capacity (Million Units), 2020-2032
Figure 54. The Percentage of Production Chemical Sensors by Region, 2024 VS 2032
Figure 55. Chemical Sensors Industry Value Chain
Figure 56. Marketing Channels