SEMICONDUCTOR INSIGHT
MARKET RESEARCH REPORT

Wide Bandgap (WBG) Semiconductor Material Market

2026 to 2034
MARKET INTELLIGENCE
ACROSS KEY REGIONS
2026 EDITION
POWER ELECTRONICS Semiconductor Market Research

Wide Bandgap (WBG) Semiconductor Material Market

◷
UPDATED 26 October 2026
▤
REPORT LENGTH Detailed Report
▣
REPORT CODE a77fc19c8415
▯
FORMATS PDF

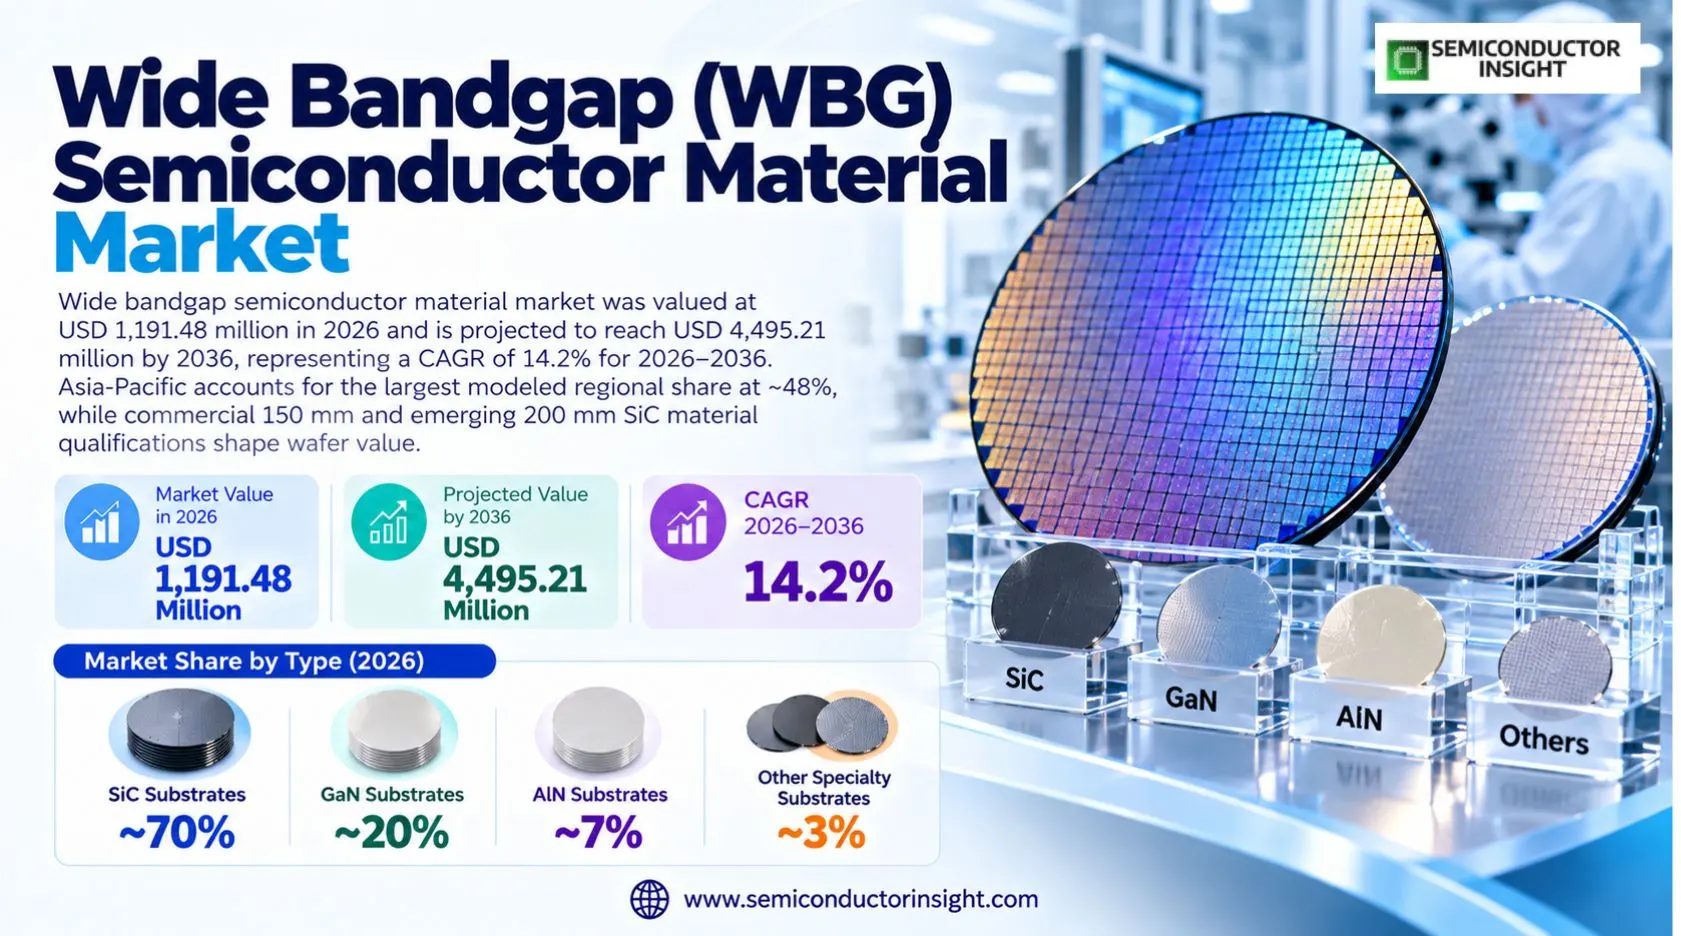
Wide bandgap semiconductor material market was valued at USD 1,191.48 million in 2026 and is projected to reach USD 4,495.21 million by 2036, representing a CAGR of 14.2% for 2026–2036. Asia-Pacific accounts for the largest modeled regional share at ~48%, while commercial 150 mm and emerging 200 mm SiC material qualifications shape wafer value.

Get the sample PDF with study scope, segmentation and methodology details.

Key Statistics

2026 Market Size
USD 1,191.48 million
2036 Projected Size
USD 4,495.21 million
CAGR (2026–2036)
14.2%
Largest Market in 2026
Asia-Pacific (~48%)

Key Takeaways

  • Market value: The defined merchant substrate and sold epitaxial-wafer market reaches USD 1,191.48 million in 2026 and a modeled USD 4,495.21 million in 2036, equivalent to 14.2% annual growth; the projection extends six years beyond the 2030 endpoint underlying the monetary series.
  • Silicon carbide: SiC substrates account for an estimated ~70% of 2026 value because conductive 4H-SiC wafers support high-voltage switches; GaN substrates hold ~20%, AlN substrates ~7%, and other specialty WBG substrates ~3%.
  • Application mix: Power discrete device fabrication represents an estimated ~60% of wafer demand by value, compared with ~25% for RF device substrates and ~15% for optoelectronic device substrates; these are downstream uses, not sales of finished components.
  • Regional leadership: Asia-Pacific is the largest region at an estimated ~48% of 2026 substrate sales, reflecting Chinese, Japanese and South Korean material capacity; North America represents ~25%, Europe ~19%, South America ~4%, and Middle East & Africa ~4%.
  • Diameter transition: Commercial 150 mm substrates remain the largest modeled diameter class at ~48% of 2026 value, while 200 mm products represent ~34% and grow fastest as wafer-quality and device-line qualification improve; 300 mm research milestones are not counted as merchant power-grade wafer shipments.
  • Sales channels: Integrated device manufacturers absorb an estimated ~56% of the material value, merchant foundries and epitaxy specialists ~31%, and research or other qualified buyers ~13%; purchase qualification depends on defect density, electrical properties and repeatability.
  • Supplier competition: Wolfspeed, Coherent, SiCrystal, SK Siltron CSS, SICC, TanKeBlue, Sumitomo Chemical SCIOCS, Kyma, Resonac and Soitec have relevant materials or wafer platforms, although engineering maturity and commercial product scope differ.
  • Scope and comparability: This is an upstream wafer-material boundary rather than a finished-device market; its publisher anchors duplicate row 162, and revenue must not be added to row 162 or to finished-device scenarios in rows 161, 163 and 164.

Wide Bandgap (WBG) Semiconductor Material Market Overview

Wide bandgap semiconductor material market was valued at USD 1,191.48 million in 2026 and is projected to reach USD 4,495.21 million by 2036, representing a CAGR of 14.2% for 2026–2036. Asia-Pacific accounts for the largest modeled regional share at ~48%, while commercial 150 mm and emerging 200 mm SiC material qualifications shape wafer value.

Base year: 2026 · Estimate: 2027 · Forecast: 2036 · Historical context: 2021–2025 · Values: USD million at factory gate

The economic unit in this market is a semiconductor substrate or separately sold epitaxial wafer, rather than a finished silicon-carbide transistor or gallium-nitride radio-frequency amplifier. Substrates provide the crystal and electrical foundation on which the device manufacturer forms junctions, gates and contacts. Revenue therefore stops when the qualified bare or epitaxial wafer is sold to its device-making customer. It excludes downstream chip packaging, inverter integration and the retail value of vehicles, data-center systems or photovoltaic equipment.

Silicon carbide is the dominant merchant material because its wide bandgap, high critical electric field and thermal characteristics allow efficient high-voltage power switching. Manufacturers distinguish conductive n-type 4H-SiC wafers for power devices from semi-insulating grades used in RF epitaxy. The commercial value of a wafer depends not simply on its diameter but also on micropipes, threading defects, surface flatness, bow, resistivity and reproducible epitaxial layer thickness across successive production lots.

Wolfspeed introduced commercial 200 mm SiC materials in September 2025 and expanded the offering with premium n-type 200 mm wafers in September 2026. The later product disclosure specified fewer than 0.01 micropipes per square centimeter, or fewer than three per wafer, and highlighted lot-to-lot shape consistency. These are product-specific supplier claims rather than global industry averages, but they illustrate why a wafer carrying a higher price can reduce device cost through yield improvements.

GaN and AlN serve different demand pools from bulk SiC. Sumitomo Chemical SCIOCS lists GaN substrates and GaN-on-GaN epitaxy for power and optical devices, while Kyma supplies GaN, AlN and oxide materials for specialized device development. SCIOCS also lists 2-inch AlN templates for ultraviolet LED work with sample availability, which is not evidence of high-volume merchant AlN revenue. The material categories are therefore modeled separately rather than merged into one generic compound-semiconductor device count.

The forecast uses the 2023 USD 800 million and 2030 USD 2,026.53 million monetary endpoints, whose seven-year ratio implies 14.200012% annual growth. Applying that ratio produces the 2026 and 2027 figures and extends the same growth rate to 2036. The extension is a publisher-anchored numerical scenario, not a statement that manufacturers have committed to the resulting capacity, wafer shipments or prices. Supplier announcements support the technology transition but do not audit these market totals.

Cross-report boundaries matter especially for wide-bandgap markets. This material series repeats the same publisher monetary anchors as the upstream substrate study in row 162; both represent alternative editorial views of the same revenue object and must not be added. Finished SiC and GaN switches or modules in other studies contain upstream material cost, so adding material and device revenue would double count the value chain. A separate 300 mm SiC thermal-management platform for AI packaging also should not be conflated with commercially qualified power-semiconductor substrates.

Segment Analysis: By Type

By type, merchant WBG semiconductor materials comprise SiC substrates, GaN substrates, AlN substrates and other specialty substrates. SiC leads with an estimated ~70% of 2026 sales; GaN follows at ~20%, AlN ~7%, and other materials ~3%. These allocations describe wafer and sold-epitaxy value rather than finished semiconductor-device sales. Qualified wafer purchases remain product-specific.

Material type Substrate technology and manufacturing characteristics 2026 position and commercial interpretation
SiC Substrates Conductive and semi-insulating SiC crystal products is shaped by 4H-SiC boule growth, precision slicing, chemical-mechanical polishing and epi readiness. For conductive and semi-insulating sic crystal products, The material is sold in 150 mm and 200 mm grades, with power and RF electrical requirements separated. During 2026–2036, the 200 mm premium grade increases usable device area but does not eliminate defect-related scrap; orders remain specification-led for conductive and semi-insulating sic crystal products. A modeled ~70% share in 2026 represents conductive and semi-insulating sic crystal products as an allocation, not verified wafer shipment revenue. Buyers assess 4H-SiC boule growth, precision slicing, chemical-mechanical polishing and epi readiness alongside lot traceability and usable wafer area in conductive and semi-insulating sic crystal products. SiC wafer value is shaped by qualification of n-type 4H material for high-voltage power device fabrication. For sic wafer value, The market combines volume-oriented 150 mm demand with increasingly qualified 200 mm supply. During 2026–2036, suppliers with reliable crystal growth and low defect densities can defend price premiums even during capacity additions; orders remain specification-led for sic wafer value. A modeled ~70% share in 2026 represents sic wafer value as an allocation, not verified wafer shipment revenue. Buyers assess qualification of n-type 4H material for high-voltage power device fabrication alongside lot traceability and usable wafer area in sic wafer value.
GaN Substrates Native GaN wafers and GaN epitaxial structures is shaped by high-quality nitride growth and controlled doping across smaller substrate diameters. For native gan wafers and gan epitaxial structures, RF and power programs have different substrate and epitaxy requirements, and GaN-on-SiC is not equivalent to bulk GaN. During 2026–2036, the commercial product catalog of SCIOCS provides a direct reference for these distinctions; orders remain specification-led for native gan wafers and gan epitaxial structures. A modeled ~20% share in 2026 represents native gan wafers and gan epitaxial structures as an allocation, not verified wafer shipment revenue. Buyers assess high-quality nitride growth and controlled doping across smaller substrate diameters alongside lot traceability and usable wafer area in native gan wafers and gan epitaxial structures. GaN substrate purchasing is shaped by limited large-diameter native crystal availability and stringent defect targets. For gan substrate purchasing, Power and optoelectronic uses require different layer stacks and thermal design tradeoffs. During 2026–2036, some GaN-on-silicon epitaxy is valued as processing rather than as merchant native-GaN substrate sales; orders remain specification-led for gan substrate purchasing. A modeled ~20% share in 2026 represents gan substrate purchasing as an allocation, not verified wafer shipment revenue. Buyers assess limited large-diameter native crystal availability and stringent defect targets alongside lot traceability and usable wafer area in gan substrate purchasing.
AlN Substrates Aluminum-nitride templates is shaped by deep-ultraviolet optoelectronic material requirements and difficult bulk-crystal scaling. For aluminum-nitride templates, Specialist suppliers provide template and epitaxy products for research and early production qualification. During 2026–2036, 2-inch sample availability should not be interpreted as a mature high-volume power wafer market; orders remain specification-led for aluminum-nitride templates. A modeled ~7% share in 2026 represents aluminum-nitride templates as an allocation, not verified wafer shipment revenue. Buyers assess deep-ultraviolet optoelectronic material requirements and difficult bulk-crystal scaling alongside lot traceability and usable wafer area in aluminum-nitride templates. AlN commercialization is shaped by high crystalline quality, transparency and thermal performance demands. For aln commercialization, Substrate sizes and production economics remain more constrained than for mainstream SiC. During 2026–2036, its modeled share is deliberately smaller than GaN and SiC pending broader merchant product qualification; orders remain specification-led for aln commercialization. A modeled ~7% share in 2026 represents aln commercialization as an allocation, not verified wafer shipment revenue. Buyers assess high crystalline quality, transparency and thermal performance demands alongside lot traceability and usable wafer area in aln commercialization.
Other WBG Substrates Specialty oxide and engineered wide-bandgap wafers is shaped by development of gallium-oxide and bonded composite material platforms. For specialty oxide and engineered wide-bandgap wafers, The category captures qualified specialty substrate value without including generic packaging ceramics. During 2026–2036, technology demonstrations and wafer research are separated from routine customer sales; orders remain specification-led for specialty oxide and engineered wide-bandgap wafers. A modeled ~3% share in 2026 represents specialty oxide and engineered wide-bandgap wafers as an allocation, not verified wafer shipment revenue. Buyers assess development of gallium-oxide and bonded composite material platforms alongside lot traceability and usable wafer area in specialty oxide and engineered wide-bandgap wafers. Other material sales is shaped by research-focused customers and smaller-volume niche devices. For other material sales, Demand can accelerate from a low base without becoming a dominant revenue class. During 2026–2036, product identity and factory-gate sale must be established before assigning material revenue; orders remain specification-led for other material sales. A modeled ~3% share in 2026 represents other material sales as an allocation, not verified wafer shipment revenue. Buyers assess research-focused customers and smaller-volume niche devices alongside lot traceability and usable wafer area in other material sales.

SiC Substrates: diameter economics and merchant qualification

The SiC substrate business is shaped by 150 mm installed device lines, 200 mm capacity additions and crystal quality premiums. For the sic substrate business, Commercial 200 mm availability improves die-per-wafer economics but only after customer process transfer. During 2026–2036, a 200 mm substrate with unacceptable bow or dislocation density can yield fewer good chips than a mature smaller wafer; orders remain specification-led for the sic substrate business. A modeled ~70% share in 2026 represents the sic substrate business as an allocation, not verified wafer shipment revenue. Buyers assess 150 mm installed device lines, 200 mm capacity additions and crystal quality premiums alongside lot traceability and usable wafer area in the sic substrate business.

Modeled annual factory-gate material revenue by segment, 2026–2036 (USD million)

Region — annual scenario allocations

Year Asia-Pacific North America Europe South America Middle East & Africa
2026 571.91 297.87 226.38 47.66 47.66
2027 659.41 337.19 256.04 54.76 52.48
2028 760.30 381.70 289.58 62.92 57.78
2029 876.63 432.08 327.51 72.29 63.62
2030 1,010.75 489.12 370.42 83.07 70.05
2031 1,165.40 553.68 418.94 95.44 77.13
2032 1,343.70 626.77 473.82 109.66 84.93
2033 1,549.29 709.50 535.89 126.00 93.51
2034 1,786.33 803.15 606.10 144.78 102.96
2035 2,059.64 909.17 685.49 166.35 113.37
2036 2,374.77 1,029.18 775.29 191.14 124.83

Type — annual scenario allocations

Year SiC Substrates GaN Substrates AlN Substrates Other WBG Substrates
2026 834.04 238.30 83.40 35.74
2027 949.97 276.66 93.50 39.95
2028 1,082.01 321.20 104.81 44.64
2029 1,232.41 372.92 117.49 49.89
2030 1,403.72 432.96 131.71 55.75
2031 1,598.83 502.66 147.64 62.30
2032 1,821.07 583.59 165.51 69.62
2033 2,074.20 677.55 185.53 77.80
2034 2,362.52 786.64 207.98 86.95
2035 2,690.90 913.29 233.15 97.16
2036 3,064.94 1,060.32 261.36 108.58

Application — annual scenario allocations

Year Power Discrete Devices RF Devices Optoelectronic Devices
2026 714.89 297.87 178.72
2027 821.41 337.19 201.70
2028 943.80 381.70 227.63
2029 1,084.42 432.08 256.89
2030 1,246.00 489.12 289.91
2031 1,431.65 553.68 327.18
2032 1,644.97 626.77 369.24
2033 1,890.07 709.50 416.71
2034 2,171.69 803.15 470.28
2035 2,495.27 909.17 530.73
2036 2,867.07 1,029.18 598.96

Wafer Diameter — annual scenario allocations

Year 100 mm and Below 150 mm 200 mm
2026 214.47 571.91 405.10
2027 233.12 640.54 480.33
2028 253.41 717.40 569.53
2029 275.45 803.49 675.30
2030 299.42 899.91 800.71
2031 325.47 1,007.90 949.40
2032 353.78 1,128.85 1,125.71
2033 384.56 1,264.31 1,334.76
2034 418.02 1,416.03 1,582.64
2035 454.39 1,585.95 1,876.54
2036 493.92 1,776.27 2,225.03

Buyer Channel — annual scenario allocations

Year Integrated Device Manufacturers Merchant Foundries and Epitaxy Specialists Research and Other Qualified Buyers
2026 667.23 369.36 154.89
2027 757.30 425.13 177.96
2028 859.54 489.33 204.46
2029 975.58 563.22 234.90
2030 1,107.28 648.26 269.88
2031 1,256.77 746.15 310.07
2032 1,426.43 858.82 356.24
2033 1,619.00 988.50 409.29
2034 1,837.56 1,137.76 470.24
2035 2,085.63 1,309.56 540.26
2036 2,367.19 1,507.31 620.71

Product Format — annual scenario allocations

Year Bare Polished Wafers Epitaxial Wafers Bonded and Engineered Substrates
2026 738.72 333.61 119.15
2027 832.53 386.99 139.62
2028 938.27 448.91 163.61
2029 1,057.43 520.74 191.72
2030 1,191.72 604.06 224.66
2031 1,343.07 700.70 263.25
2032 1,513.64 812.82 308.48
2033 1,705.87 942.87 361.48
2034 1,922.52 1,093.73 423.59
2035 2,166.67 1,268.72 496.37
2036 2,441.84 1,471.72 581.65

GaN Substrates: native crystal versus heteroepitaxy

GaN supplier differentiation is shaped by native bulk crystal growth and GaN-on-SiC epitaxy for distinct electrical end uses. For gan supplier differentiation, A supplier catalog may include GaN substrates and epitaxy without those being interchangeable products. During 2026–2036, buyers specify threading dislocation, carrier concentration and substrate thermal behavior by device family; orders remain specification-led for gan supplier differentiation. A modeled ~20% share in 2026 represents gan supplier differentiation as an allocation, not verified wafer shipment revenue. Buyers assess native bulk crystal growth and GaN-on-SiC epitaxy for distinct electrical end uses alongside lot traceability and usable wafer area in gan supplier differentiation.

AlN Substrates: specialist optoelectronic qualification

AlN template commercialization is shaped by ultraviolet LED and photonics development requiring high-quality nitride layers. For aln template commercialization, Samples and R&D shipments precede broad production purchasing and must be valued conservatively. During 2026–2036, the published 2-inch template availability is an example of a narrow technical market rather than mature mass output; orders remain specification-led for aln template commercialization. A modeled ~7% share in 2026 represents aln template commercialization as an allocation, not verified wafer shipment revenue. Buyers assess ultraviolet LED and photonics development requiring high-quality nitride layers alongside lot traceability and usable wafer area in aln template commercialization.

Other WBG Materials: engineered platforms

Engineered and oxide substrates is shaped by bonding, transfer and specialty crystal growth for applications outside mainstream power switching. For engineered and oxide substrates, These materials can reduce defect cost or enable new optical functions, but commercial adoption is design-specific. During 2026–2036, the modeled ~3% type allocation captures current niche sales without extrapolating laboratory claims into established mass-market supply; orders remain specification-led for engineered and oxide substrates. A modeled ~3% share in 2026 represents engineered and oxide substrates as an allocation, not verified wafer shipment revenue. Buyers assess bonding, transfer and specialty crystal growth for applications outside mainstream power switching alongside lot traceability and usable wafer area in engineered and oxide substrates.

Segment Analysis: By Application

The application classification assigns upstream wafer revenue to Power Discrete Devices, RF Devices and Optoelectronic Devices. Power discrete fabrication leads at an estimated ~60% of 2026 material demand, followed by RF ~25% and optoelectronics ~15%. A wafer purchased by a device producer is allocated to its intended end-use family only once.

Application Demand characteristics
Power Discrete Devices Power-discrete substrate purchasing is shaped by SiC MOSFET and diode manufacturing for vehicle traction, chargers, industrial drives and grid conversion. For power-discrete substrate purchasing, 200 mm n-type SiC and high-voltage thick epitaxy become increasingly relevant to device yield and switching performance. During 2026–2036, factory-gate wafer value excludes packaged power modules and finished converter assemblies; orders remain specification-led for power-discrete substrate purchasing. A modeled ~60% share in 2026 represents power-discrete substrate purchasing as an allocation, not verified wafer shipment revenue. Buyers assess SiC MOSFET and diode manufacturing for vehicle traction, chargers, industrial drives and grid conversion alongside lot traceability and usable wafer area in power-discrete substrate purchasing.
RF Devices RF material demand is shaped by semi-insulating SiC and GaN epitaxy serving high-frequency communication and radar designs. For rf material demand, Thermal stability and crystal resistivity matter differently from conductive power-grade SiC. During 2026–2036, the revenue boundary excludes the completed RF amplifier even when the wafer supplier also manufactures components; orders remain specification-led for rf material demand. A modeled ~25% share in 2026 represents rf material demand as an allocation, not verified wafer shipment revenue. Buyers assess semi-insulating SiC and GaN epitaxy serving high-frequency communication and radar designs alongside lot traceability and usable wafer area in rf material demand.
Optoelectronic Devices Optoelectronic substrate use is shaped by GaN and AlN structures for LEDs, ultraviolet emitters and specialty photonics. For optoelectronic substrate use, Wavelength, dislocation density and optical absorption govern selection, and qualification cycles can be long. During 2026–2036, small-diameter AlN templates are kept separate from mature SiC power wafers to avoid overstating scale; orders remain specification-led for optoelectronic substrate use. A modeled ~15% share in 2026 represents optoelectronic substrate use as an allocation, not verified wafer shipment revenue. Buyers assess GaN and AlN structures for LEDs, ultraviolet emitters and specialty photonics alongside lot traceability and usable wafer area in optoelectronic substrate use.

Application revenue allocation is shaped by the customer’s intended device process rather than a supplier company label. For application revenue allocation, Vertically integrated groups may serve power, RF and optical markets from different crystal lines. During 2026–2036, the modeled splits are useful for demand sensitivity but should not be read as measured global purchase orders; orders remain specification-led for application revenue allocation. A modeled ~60% share in 2026 represents application revenue allocation as an allocation, not verified wafer shipment revenue. Buyers assess the customer’s intended device process rather than a supplier company label alongside lot traceability and usable wafer area in application revenue allocation.
Regional Analysis

Asia-Pacific is the largest regional market at an estimated ~48% of 2026 wafer-material value, supported by substrate manufacturing in China, Japan and South Korea and extensive downstream device fabrication. North America is modeled at ~25%, Europe ~19%, South America ~4% and Middle East & Africa ~4%. Regional shares reflect modeled merchant sales and end-use allocation rather than audited country-level financial accounts.

Which regions concentrate WBG substrate production, qualification and downstream demand?

Regional demand mapping is shaped by the physical location of merchant wafer sales and qualified device-fabrication customers. For regional demand mapping, Asia-Pacific contains multiple material producers, North America combines major substrate capacity with contracted device makers, and Europe has high-value power device integration. During 2026–2036, supplier manufacturing footprints and customer procurement locations are not always the same region, so geographic allocations are scenario estimates; orders remain specification-led for regional demand mapping. Buyers assess the physical location of merchant wafer sales and qualified device-fabrication customers alongside lot traceability and usable wafer area in regional demand mapping.

Region Position Growth outlook Demand profile What decides supplier selection
Asia-Pacific ~48% of 2026 ~15.3% CAGR wafer-scale production, automotive power conversion and merchant epitaxy Crystal grade, qualification evidence, logistics and defect consistency
North America ~25% of 2026 ~13.2% CAGR commercial wafer technology, contracted supply and high-voltage qualification Crystal grade, qualification evidence, logistics and defect consistency
Europe ~19% of 2026 ~13.1% CAGR automotive power devices, wafer bonding and process engineering Crystal grade, qualification evidence, logistics and defect consistency
South America ~4% of 2026 ~14.9% CAGR industrial electronics demand with limited indigenous substrate manufacturing Crystal grade, qualification evidence, logistics and defect consistency
Middle East & Africa ~4% of 2026 ~10.1% CAGR research programs, telecom power and industrial electrification Crystal grade, qualification evidence, logistics and defect consistency

Asia-Pacific LARGEST · ~48% SHARE

What drives the Asia-Pacific WBG substrate market?

Asia-Pacific merchant wafer demand is shaped by wafer-scale production, automotive power conversion and merchant epitaxy. For asia-pacific merchant wafer demand, Production footprint, local device-line qualification and import sourcing together determine the region’s competitive position. During 2026–2036, the modeled regional CAGR is 15.3% and the 2026 share remains an analyst scenario; orders remain specification-led for asia-pacific merchant wafer demand. A modeled ~48% share in 2026 represents asia-pacific merchant wafer demand as an allocation, not verified wafer shipment revenue. Buyers assess wafer-scale production, automotive power conversion and merchant epitaxy alongside lot traceability and usable wafer area in asia-pacific merchant wafer demand.

Market positionEstimated ~48% share
Growth outlook~15.3% CAGR
Demand profilewafer-scale production, automotive power conversion and merchant epitaxy
Market access gateDefect and grade qualification
Country Position in region What drives demand
China Leading material supply China substrate demand is shaped by TanKeBlue and SICC offer SiC substrate product families, while Chinese power-device makers provide local qualification demand and scale incentives. For china substrate demand, The commercial opportunity depends on qualified wafer sourcing and the location of the device-fabrication customer. During 2026–2036, regional equipment demand is treated as context rather than direct material revenue; orders remain specification-led for china substrate demand. A modeled ~48% share in 2026 represents china substrate demand as an allocation, not verified wafer shipment revenue. Buyers assess TanKeBlue and SICC offer SiC substrate product families, while Chinese power-device makers provide local qualification demand and scale incentives alongside lot traceability and usable wafer area in china substrate demand.
Japan Materials engineering center Japan substrate demand is shaped by Sumitomo Chemical SCIOCS offers GaN and AlN platforms, SiCrystal is part of ROHM group and Japanese materials programs emphasize crystal quality and downstream device integration. For japan substrate demand, The commercial opportunity depends on qualified wafer sourcing and the location of the device-fabrication customer. During 2026–2036, regional equipment demand is treated as context rather than direct material revenue; orders remain specification-led for japan substrate demand. A modeled ~48% share in 2026 represents japan substrate demand as an allocation, not verified wafer shipment revenue. Buyers assess Sumitomo Chemical SCIOCS offers GaN and AlN platforms, SiCrystal is part of ROHM group and Japanese materials programs emphasize crystal quality and downstream device integration alongside lot traceability and usable wafer area in japan substrate demand.
South Korea Commercial 200 mm pathway South Korea substrate demand is shaped by SK Siltron CSS markets 150 mm and 200 mm SiC substrate and epitaxial products, linking Asian ownership to US-based manufacturing and multinational customers. For south korea substrate demand, The commercial opportunity depends on qualified wafer sourcing and the location of the device-fabrication customer. During 2026–2036, regional equipment demand is treated as context rather than direct material revenue; orders remain specification-led for south korea substrate demand. A modeled ~48% share in 2026 represents south korea substrate demand as an allocation, not verified wafer shipment revenue. Buyers assess SK Siltron CSS markets 150 mm and 200 mm SiC substrate and epitaxial products, linking Asian ownership to US-based manufacturing and multinational customers alongside lot traceability and usable wafer area in south korea substrate demand.

Market instances

  • Chinese SiC supply Chinese SiC supply is shaped by SICC and TanKeBlue list conductive and semi-insulating SiC product lines, indicating domestic merchant wafer competition across electrical grades and wafer diameters. For chinese sic supply, The example identifies a practical materials qualification or demand mechanism, not a measured regional sales total. During 2026–2036, the scenario remains linked to wafer value and excludes completed power or RF equipment; orders remain specification-led for chinese sic supply. A modeled ~48% share in 2026 represents chinese sic supply as an allocation, not verified wafer shipment revenue. Buyers assess SICC and TanKeBlue list conductive and semi-insulating SiC product lines, indicating domestic merchant wafer competition across electrical grades and wafer diameters alongside lot traceability and usable wafer area in chinese sic supply.
  • Japanese nitride materials Japanese nitride materials is shaped by SCIOCS lists native GaN, GaN epitaxy and AlN templates, allowing optical and power applications to be discussed separately rather than merged. For japanese nitride materials, The example identifies a practical materials qualification or demand mechanism, not a measured regional sales total. During 2026–2036, the scenario remains linked to wafer value and excludes completed power or RF equipment; orders remain specification-led for japanese nitride materials. A modeled ~48% share in 2026 represents japanese nitride materials as an allocation, not verified wafer shipment revenue. Buyers assess SCIOCS lists native GaN, GaN epitaxy and AlN templates, allowing optical and power applications to be discussed separately rather than merged alongside lot traceability and usable wafer area in japanese nitride materials.
In the full report: country-level merchant substrate demand for China, Japan, South Korea and Taiwan, wafer diameter, crystal grade, end-use and qualified supplier channels, with historical purchasing and forecast sensitivity to device-line utilization.

North America SECOND · ~25% SHARE

What drives the North America WBG substrate market?

North America merchant wafer demand is shaped by commercial wafer technology, contracted supply and high-voltage qualification. For north america merchant wafer demand, Production footprint, local device-line qualification and import sourcing together determine the region’s competitive position. During 2026–2036, the modeled regional CAGR is 13.2% and the 2026 share remains an analyst scenario; orders remain specification-led for north america merchant wafer demand. A modeled ~25% share in 2026 represents north america merchant wafer demand as an allocation, not verified wafer shipment revenue. Buyers assess commercial wafer technology, contracted supply and high-voltage qualification alongside lot traceability and usable wafer area in north america merchant wafer demand.

Market positionEstimated ~25% share
Growth outlook~13.2% CAGR
Demand profilecommercial wafer technology, contracted supply and high-voltage qualification
Market access gateDefect and grade qualification
Country Position in region What drives demand
United States Anchor supplier base United States substrate demand is shaped by Wolfspeed offers 200 mm commercial SiC wafers and Coherent offers 150 mm and 200 mm substrate and epitaxy products for power-device customers. For united states substrate demand, The commercial opportunity depends on qualified wafer sourcing and the location of the device-fabrication customer. During 2026–2036, regional equipment demand is treated as context rather than direct material revenue; orders remain specification-led for united states substrate demand. A modeled ~25% share in 2026 represents united states substrate demand as an allocation, not verified wafer shipment revenue. Buyers assess Wolfspeed offers 200 mm commercial SiC wafers and Coherent offers 150 mm and 200 mm substrate and epitaxy products for power-device customers alongside lot traceability and usable wafer area in united states substrate demand.
Canada Research and downstream integration Canada substrate demand is shaped by Canadian power-electronics design and advanced materials programs can source merchant substrates globally, while local purchasing is smaller than the US supplier footprint. For canada substrate demand, The commercial opportunity depends on qualified wafer sourcing and the location of the device-fabrication customer. During 2026–2036, regional equipment demand is treated as context rather than direct material revenue; orders remain specification-led for canada substrate demand. A modeled ~25% share in 2026 represents canada substrate demand as an allocation, not verified wafer shipment revenue. Buyers assess Canadian power-electronics design and advanced materials programs can source merchant substrates globally, while local purchasing is smaller than the US supplier footprint alongside lot traceability and usable wafer area in canada substrate demand.
Mexico Electronics supply-chain demand Mexico substrate demand is shaped by Automotive electronics assembly creates indirect downstream interest, although the merchant SiC crystal-growth capacity evidenced here is not centered in Mexico. For mexico substrate demand, The commercial opportunity depends on qualified wafer sourcing and the location of the device-fabrication customer. During 2026–2036, regional equipment demand is treated as context rather than direct material revenue; orders remain specification-led for mexico substrate demand. A modeled ~25% share in 2026 represents mexico substrate demand as an allocation, not verified wafer shipment revenue. Buyers assess Automotive electronics assembly creates indirect downstream interest, although the merchant SiC crystal-growth capacity evidenced here is not centered in Mexico alongside lot traceability and usable wafer area in mexico substrate demand.

Market instances

  • 200 mm commercial launch 200 mm commercial launch is shaped by Wolfspeed announced commercial 200 mm materials in September 2025 and premium substrates in September 2026, differentiating qualified sale from research samples. For 200 mm commercial launch, The example identifies a practical materials qualification or demand mechanism, not a measured regional sales total. During 2026–2036, the scenario remains linked to wafer value and excludes completed power or RF equipment; orders remain specification-led for 200 mm commercial launch. A modeled ~25% share in 2026 represents 200 mm commercial launch as an allocation, not verified wafer shipment revenue. Buyers assess Wolfspeed announced commercial 200 mm materials in September 2025 and premium substrates in September 2026, differentiating qualified sale from research samples alongside lot traceability and usable wafer area in 200 mm commercial launch.
  • Thick epitaxy Thick epitaxy is shaped by Coherent reported 150 mm and 200 mm thick SiC epi capability for up-to-10kV device architectures in April 2026, a high-voltage materials opportunity. For thick epitaxy, The example identifies a practical materials qualification or demand mechanism, not a measured regional sales total. During 2026–2036, the scenario remains linked to wafer value and excludes completed power or RF equipment; orders remain specification-led for thick epitaxy. A modeled ~25% share in 2026 represents thick epitaxy as an allocation, not verified wafer shipment revenue. Buyers assess Coherent reported 150 mm and 200 mm thick SiC epi capability for up-to-10kV device architectures in April 2026, a high-voltage materials opportunity alongside lot traceability and usable wafer area in thick epitaxy.
In the full report: country-level merchant substrate demand for United States and Canada, wafer diameter, crystal grade, end-use and qualified supplier channels, with historical purchasing and forecast sensitivity to device-line utilization.

Europe THIRD · ~19% SHARE

What drives the Europe WBG substrate market?

Europe merchant wafer demand is shaped by automotive power devices, wafer bonding and process engineering. For europe merchant wafer demand, Production footprint, local device-line qualification and import sourcing together determine the region’s competitive position. During 2026–2036, the modeled regional CAGR is 13.1% and the 2026 share remains an analyst scenario; orders remain specification-led for europe merchant wafer demand. A modeled ~19% share in 2026 represents europe merchant wafer demand as an allocation, not verified wafer shipment revenue. Buyers assess automotive power devices, wafer bonding and process engineering alongside lot traceability and usable wafer area in europe merchant wafer demand.

Market positionEstimated ~19% share
Growth outlook~13.1% CAGR
Demand profileautomotive power devices, wafer bonding and process engineering
Market access gateDefect and grade qualification
Country Position in region What drives demand
Germany Device integration and SiC materials Germany substrate demand is shaped by SiCrystal manufactures SiC wafers and European device makers qualify materials for automotive and industrial switching with long production lifecycles. For germany substrate demand, The commercial opportunity depends on qualified wafer sourcing and the location of the device-fabrication customer. During 2026–2036, regional equipment demand is treated as context rather than direct material revenue; orders remain specification-led for germany substrate demand. A modeled ~19% share in 2026 represents germany substrate demand as an allocation, not verified wafer shipment revenue. Buyers assess SiCrystal manufactures SiC wafers and European device makers qualify materials for automotive and industrial switching with long production lifecycles alongside lot traceability and usable wafer area in germany substrate demand.
France Engineered substrates France substrate demand is shaped by Soitec markets SmartSiC bonded substrates, introducing a different material cost and qualification profile from conventional bulk SiC wafers. For france substrate demand, The commercial opportunity depends on qualified wafer sourcing and the location of the device-fabrication customer. During 2026–2036, regional equipment demand is treated as context rather than direct material revenue; orders remain specification-led for france substrate demand. A modeled ~19% share in 2026 represents france substrate demand as an allocation, not verified wafer shipment revenue. Buyers assess Soitec markets SmartSiC bonded substrates, introducing a different material cost and qualification profile from conventional bulk SiC wafers alongside lot traceability and usable wafer area in france substrate demand.
Italy Power-device manufacturing Italy substrate demand is shaped by European automotive and industrial semiconductor production creates demand for qualified SiC substrates and epitaxy, though supplier revenues must not be inferred from device sales. For italy substrate demand, The commercial opportunity depends on qualified wafer sourcing and the location of the device-fabrication customer. During 2026–2036, regional equipment demand is treated as context rather than direct material revenue; orders remain specification-led for italy substrate demand. A modeled ~19% share in 2026 represents italy substrate demand as an allocation, not verified wafer shipment revenue. Buyers assess European automotive and industrial semiconductor production creates demand for qualified SiC substrates and epitaxy, though supplier revenues must not be inferred from device sales alongside lot traceability and usable wafer area in italy substrate demand.

Market instances

  • Engineered wafer collaboration Engineered wafer collaboration is shaped by Resonac and Soitec announced development of 200 mm bonded SiC substrates in September 2024, highlighting the innovation pipeline without proving mature shipment revenue. For engineered wafer collaboration, The example identifies a practical materials qualification or demand mechanism, not a measured regional sales total. During 2026–2036, the scenario remains linked to wafer value and excludes completed power or RF equipment; orders remain specification-led for engineered wafer collaboration. A modeled ~19% share in 2026 represents engineered wafer collaboration as an allocation, not verified wafer shipment revenue. Buyers assess Resonac and Soitec announced development of 200 mm bonded SiC substrates in September 2024, highlighting the innovation pipeline without proving mature shipment revenue alongside lot traceability and usable wafer area in engineered wafer collaboration.
  • Automotive qualification Automotive qualification is shaped by European power-device customers require low-defect material, long-term traceability and consistent electrical performance, which favors established qualified sources. For automotive qualification, The example identifies a practical materials qualification or demand mechanism, not a measured regional sales total. During 2026–2036, the scenario remains linked to wafer value and excludes completed power or RF equipment; orders remain specification-led for automotive qualification. A modeled ~19% share in 2026 represents automotive qualification as an allocation, not verified wafer shipment revenue. Buyers assess European power-device customers require low-defect material, long-term traceability and consistent electrical performance, which favors established qualified sources alongside lot traceability and usable wafer area in automotive qualification.
In the full report: country-level merchant substrate demand for Germany, France, Italy and wider Europe, wafer diameter, crystal grade, end-use and qualified supplier channels, with historical purchasing and forecast sensitivity to device-line utilization.

South America FOURTH · ~4% SHARE

What drives the South America WBG substrate market?

South America merchant wafer demand is shaped by industrial electronics demand with limited indigenous substrate manufacturing. For south america merchant wafer demand, Production footprint, local device-line qualification and import sourcing together determine the region’s competitive position. During 2026–2036, the modeled regional CAGR is 14.9% and the 2026 share remains an analyst scenario; orders remain specification-led for south america merchant wafer demand. A modeled ~4% share in 2026 represents south america merchant wafer demand as an allocation, not verified wafer shipment revenue. Buyers assess industrial electronics demand with limited indigenous substrate manufacturing alongside lot traceability and usable wafer area in south america merchant wafer demand.

Market positionEstimated ~4% share
Growth outlook~14.9% CAGR
Demand profileindustrial electronics demand with limited indigenous substrate manufacturing
Market access gateDefect and grade qualification
Country Position in region What drives demand
Brazil Largest downstream market Brazil substrate demand is shaped by Power electronics used in solar, industrial drives and electrified transport provide demand for devices built on imported SiC and GaN wafers. For brazil substrate demand, The commercial opportunity depends on qualified wafer sourcing and the location of the device-fabrication customer. During 2026–2036, regional equipment demand is treated as context rather than direct material revenue; orders remain specification-led for brazil substrate demand. A modeled ~4% share in 2026 represents brazil substrate demand as an allocation, not verified wafer shipment revenue. Buyers assess Power electronics used in solar, industrial drives and electrified transport provide demand for devices built on imported SiC and GaN wafers alongside lot traceability and usable wafer area in brazil substrate demand.
Argentina Industrial equipment demand Argentina substrate demand is shaped by Electrical conversion and renewable installations support end-device procurement, while merchant semiconductor substrate crystal-growth capacity is limited. For argentina substrate demand, The commercial opportunity depends on qualified wafer sourcing and the location of the device-fabrication customer. During 2026–2036, regional equipment demand is treated as context rather than direct material revenue; orders remain specification-led for argentina substrate demand. A modeled ~4% share in 2026 represents argentina substrate demand as an allocation, not verified wafer shipment revenue. Buyers assess Electrical conversion and renewable installations support end-device procurement, while merchant semiconductor substrate crystal-growth capacity is limited alongside lot traceability and usable wafer area in argentina substrate demand.
Chile Grid and renewable deployment Chile substrate demand is shaped by Mining electrification and renewable projects create downstream power-electronics opportunities but do not by themselves establish local wafer sales or production. For chile substrate demand, The commercial opportunity depends on qualified wafer sourcing and the location of the device-fabrication customer. During 2026–2036, regional equipment demand is treated as context rather than direct material revenue; orders remain specification-led for chile substrate demand. A modeled ~4% share in 2026 represents chile substrate demand as an allocation, not verified wafer shipment revenue. Buyers assess Mining electrification and renewable projects create downstream power-electronics opportunities but do not by themselves establish local wafer sales or production alongside lot traceability and usable wafer area in chile substrate demand.

Market instances

  • Import-led value chain Import-led value chain is shaped by Regional buyers typically access semiconductor wafers through international device makers and distributors, so factory-gate regional allocation is smaller than end-equipment demand. For import-led value chain, The example identifies a practical materials qualification or demand mechanism, not a measured regional sales total. During 2026–2036, the scenario remains linked to wafer value and excludes completed power or RF equipment; orders remain specification-led for import-led value chain. A modeled ~4% share in 2026 represents import-led value chain as an allocation, not verified wafer shipment revenue. Buyers assess Regional buyers typically access semiconductor wafers through international device makers and distributors, so factory-gate regional allocation is smaller than end-equipment demand alongside lot traceability and usable wafer area in import-led value chain.
  • Solar and industrial demand Solar and industrial demand is shaped by The modeled regional growth rate captures adoption of efficient power conversion, while excluding the much larger value of completed solar inverters and mining systems. For solar and industrial demand, The example identifies a practical materials qualification or demand mechanism, not a measured regional sales total. During 2026–2036, the scenario remains linked to wafer value and excludes completed power or RF equipment; orders remain specification-led for solar and industrial demand. A modeled ~4% share in 2026 represents solar and industrial demand as an allocation, not verified wafer shipment revenue. Buyers assess The modeled regional growth rate captures adoption of efficient power conversion, while excluding the much larger value of completed solar inverters and mining systems alongside lot traceability and usable wafer area in solar and industrial demand.
In the full report: country-level merchant substrate demand for Brazil, Argentina and Chile, wafer diameter, crystal grade, end-use and qualified supplier channels, with historical purchasing and forecast sensitivity to device-line utilization.

Middle East & Africa FIFTH · ~4% SHARE

What drives the Middle East & Africa WBG substrate market?

Middle East & Africa merchant wafer demand is shaped by research programs, telecom power and industrial electrification. For middle east & africa merchant wafer demand, Production footprint, local device-line qualification and import sourcing together determine the region’s competitive position. During 2026–2036, the modeled regional CAGR is 10.1% and the 2026 share remains an analyst scenario; orders remain specification-led for middle east & africa merchant wafer demand. A modeled ~4% share in 2026 represents middle east & africa merchant wafer demand as an allocation, not verified wafer shipment revenue. Buyers assess research programs, telecom power and industrial electrification alongside lot traceability and usable wafer area in middle east & africa merchant wafer demand.

Market positionEstimated ~4% share
Growth outlook~10.1% CAGR
Demand profileresearch programs, telecom power and industrial electrification
Market access gateDefect and grade qualification
Country Position in region What drives demand
Israel Semiconductor research Israel substrate demand is shaped by Specialty RF and advanced materials research creates niche substrate procurement, although wafer purchases cannot be inferred from total local chip exports. For israel substrate demand, The commercial opportunity depends on qualified wafer sourcing and the location of the device-fabrication customer. During 2026–2036, regional equipment demand is treated as context rather than direct material revenue; orders remain specification-led for israel substrate demand. A modeled ~4% share in 2026 represents israel substrate demand as an allocation, not verified wafer shipment revenue. Buyers assess Specialty RF and advanced materials research creates niche substrate procurement, although wafer purchases cannot be inferred from total local chip exports alongside lot traceability and usable wafer area in israel substrate demand.
United Arab Emirates Infrastructure applications United Arab Emirates substrate demand is shaped by Data-center and grid-power investment can support devices made from WBG wafers, but complete converter expenditure is outside the merchant-material revenue boundary. For united arab emirates substrate demand, The commercial opportunity depends on qualified wafer sourcing and the location of the device-fabrication customer. During 2026–2036, regional equipment demand is treated as context rather than direct material revenue; orders remain specification-led for united arab emirates substrate demand. A modeled ~4% share in 2026 represents united arab emirates substrate demand as an allocation, not verified wafer shipment revenue. Buyers assess Data-center and grid-power investment can support devices made from WBG wafers, but complete converter expenditure is outside the merchant-material revenue boundary alongside lot traceability and usable wafer area in united arab emirates substrate demand.
Saudi Arabia Industrial electrification Saudi Arabia substrate demand is shaped by Renewable and industrial projects create future device demand while upstream wafer growth and qualification require separate evidence from materials manufacturers. For saudi arabia substrate demand, The commercial opportunity depends on qualified wafer sourcing and the location of the device-fabrication customer. During 2026–2036, regional equipment demand is treated as context rather than direct material revenue; orders remain specification-led for saudi arabia substrate demand. A modeled ~4% share in 2026 represents saudi arabia substrate demand as an allocation, not verified wafer shipment revenue. Buyers assess Renewable and industrial projects create future device demand while upstream wafer growth and qualification require separate evidence from materials manufacturers alongside lot traceability and usable wafer area in saudi arabia substrate demand.

Market instances

  • Specialty material research Specialty material research is shaped by RF and optoelectronic laboratory programs can order GaN or AlN templates in small lots, creating a market distinct from large-volume SiC automotive wafers. For specialty material research, The example identifies a practical materials qualification or demand mechanism, not a measured regional sales total. During 2026–2036, the scenario remains linked to wafer value and excludes completed power or RF equipment; orders remain specification-led for specialty material research. A modeled ~4% share in 2026 represents specialty material research as an allocation, not verified wafer shipment revenue. Buyers assess RF and optoelectronic laboratory programs can order GaN or AlN templates in small lots, creating a market distinct from large-volume SiC automotive wafers alongside lot traceability and usable wafer area in specialty material research.
  • Power-system investment Power-system investment is shaped by Grid and data-center investments are relevant demand signals, but their dollar budgets should never be treated as semiconductor substrate revenue. For power-system investment, The example identifies a practical materials qualification or demand mechanism, not a measured regional sales total. During 2026–2036, the scenario remains linked to wafer value and excludes completed power or RF equipment; orders remain specification-led for power-system investment. A modeled ~4% share in 2026 represents power-system investment as an allocation, not verified wafer shipment revenue. Buyers assess Grid and data-center investments are relevant demand signals, but their dollar budgets should never be treated as semiconductor substrate revenue alongside lot traceability and usable wafer area in power-system investment.
In the full report: country-level merchant substrate demand for Israel, UAE, Saudi Arabia and South Africa, wafer diameter, crystal grade, end-use and qualified supplier channels, with historical purchasing and forecast sensitivity to device-line utilization.

WBG Semiconductor Material Manufacturers and Competitive Landscape

Competition in merchant WBG materials depends on crystal-growth yields, available wafer diameter, electrical grade and long qualification histories. Wolfspeed, Coherent, SK Siltron CSS, SiCrystal, SICC and TanKeBlue have commercial SiC wafer products, while SCIOCS, Kyma, Resonac and Soitec extend the competitive landscape into native nitrides and engineered materials. Qualified wafer purchases remain product-specific.

Merchant wafer competition is shaped by low defect density and repeatable boule-to-wafer manufacturing. For merchant wafer competition, Buyers typically commit only after sampling, process integration, electrical characterization and yield comparison across many lots. During 2026–2036, supplier product breadth must be distinguished from actual shipments because research announcements may precede commercial availability; orders remain specification-led for merchant wafer competition. Buyers assess low defect density and repeatable boule-to-wafer manufacturing alongside lot traceability and usable wafer area in merchant wafer competition.

Vertical integration is shaped by substrate makers that also participate in device manufacturing. For vertical integration, Internal wafer transfers are not necessarily merchant factory-gate sales, and consolidated company turnover includes unrelated activities. During 2026–2036, reported corporate revenue cannot be assigned wholesale to WBG substrate market share; orders remain specification-led for vertical integration. Buyers assess substrate makers that also participate in device manufacturing alongside lot traceability and usable wafer area in vertical integration.

Asian merchant expansion is shaped by Chinese conductive and semi-insulating SiC products alongside Japanese nitride materials. For asian merchant expansion, The supplier field spans mature power wafers, RF-oriented semi-insulating products and small optoelectronic templates. During 2026–2036, commercial qualification rather than company count determines who competes in a given substrate grade; orders remain specification-led for asian merchant expansion. Buyers assess Chinese conductive and semi-insulating SiC products alongside Japanese nitride materials alongside lot traceability and usable wafer area in asian merchant expansion.

Engineered substrate alternatives is shaped by Soitec bonded SmartSiC and Resonac collaborative development. For engineered substrate alternatives, Bonding approaches can change material utilization and wafer cost, yet research partnerships are not proof of broad revenue recognition. During 2026–2036, a bonded wafer is counted once at its factory-gate sale rather than alongside its input crystal value; orders remain specification-led for engineered substrate alternatives. Buyers assess Soitec bonded SmartSiC and Resonac collaborative development alongside lot traceability and usable wafer area in engineered substrate alternatives.

Tier structure

Tier Companies Basis of competition
Established SiC wafer suppliers Wolfspeed, Coherent, SiCrystal, SK Siltron CSS Established SiC wafer vendors is shaped by commercial 150 mm or 200 mm substrates and manufacturing qualification. For established sic wafer vendors, They compete on crystalline quality, electrical consistency, scale and contractual supply reliability. During 2026–2036, direct product evidence supports supplier inclusion without assigning audited market shares; orders remain specification-led for established sic wafer vendors. Buyers assess commercial 150 mm or 200 mm substrates and manufacturing qualification alongside lot traceability and usable wafer area in established sic wafer vendors.
Asian merchant and nitride specialists SICC, TanKeBlue, Sumitomo Chemical SCIOCS, Kyma Technologies Specialist material vendors is shaped by SiC conductive and semi-insulating grades plus GaN or AlN substrate platforms. For specialist material vendors, Different end-use grades command different qualification procedures and pricing structures. During 2026–2036, product listings demonstrate participation but not comparable shipment volumes; orders remain specification-led for specialist material vendors. Buyers assess SiC conductive and semi-insulating grades plus GaN or AlN substrate platforms alongside lot traceability and usable wafer area in specialist material vendors.
Engineered materials developers Resonac, Soitec Bonded and engineered substrate participants is shaped by joint development of 200 mm bonded SiC and proprietary material transfer. For bonded and engineered substrate participants, Such technologies can expand usable crystal area and improve economics after qualification. During 2026–2036, announced collaborations should not be mistaken for independently measured merchant production; orders remain specification-led for bonded and engineered substrate participants. Buyers assess joint development of 200 mm bonded SiC and proprietary material transfer alongside lot traceability and usable wafer area in bonded and engineered substrate participants.

Key companies profiled

  • Wolfspeed
  • Coherent
  • SiCrystal (ROHM Group)
  • SK Siltron CSS
  • SICC
  • TanKeBlue Semiconductor
  • Sumitomo Chemical SCIOCS
  • Kyma Technologies
  • Resonac
  • Soitec

WBG Semiconductor Material Production and Qualification Capacity

Production economics depend on crystal growth, polishing, epitaxy and electrical inspection rather than merely installed wafer-saw capacity. The transition from 150 mm to 200 mm is commercially significant, but a larger wafer contributes value only when its defect density, bow, surface quality and downstream device yield meet customer specifications. Qualified wafer purchases remain product-specific.

SiC crystal production is shaped by long growth cycles, boule defects and wafer slicing losses. For sic crystal production, Commercial 200 mm materials can improve area productivity but may face yield ramp costs during transfer from established 150 mm lines. During 2026–2036, premium substrates command value through usable die yield rather than nominal wafer area alone; orders remain specification-led for sic crystal production. Buyers assess long growth cycles, boule defects and wafer slicing losses alongside lot traceability and usable wafer area in sic crystal production.

Epitaxy capacity is shaped by precise doping and layer thickness control for high-voltage devices. For epitaxy capacity, Coherent describes thick 150 mm and 200 mm epi supporting up-to-10kV architectures, linking materials revenue to demanding industrial and grid applications. During 2026–2036, not every thick epi demonstration equates to independent substrate revenue or a guaranteed end-device design win; orders remain specification-led for epitaxy capacity. Buyers assess precise doping and layer thickness control for high-voltage devices alongside lot traceability and usable wafer area in epitaxy capacity.

Diameter development is shaped by 300 mm SiC single-crystal demonstrations and AI thermal packaging research. For diameter development, Wolfspeed reported a 300 mm single-crystal milestone in January 2026, while Coherent described a 300 mm thermal-management platform in December 2025. During 2026–2036, neither announcement by itself verifies 300 mm merchant power-grade wafer shipments; orders remain specification-led for diameter development. Buyers assess 300 mm SiC single-crystal demonstrations and AI thermal packaging research alongside lot traceability and usable wafer area in diameter development.

Nitride manufacturing is shaped by smaller native GaN wafers and specialist AlN templates. For nitride manufacturing, SCIOCS and Kyma list material formats for RF, power and optical research, illustrating a broader technology pipeline than SiC alone. During 2026–2036, early sample programs remain small relative to mainstream automotive power wafer demand; orders remain specification-led for nitride manufacturing. Buyers assess smaller native GaN wafers and specialist AlN templates alongside lot traceability and usable wafer area in nitride manufacturing.

WBG Semiconductor Material Market Dynamics, Drivers, Restraints and Opportunities

Wafer-material demand rises when power, RF and optoelectronic device makers qualify more compound-semiconductor designs, but manufacturing yields, capex, price erosion and substitution constrain realized revenue. The impact allocation below is a modeled decomposition of the reconciled headline growth rate, not an independently audited attribution of individual percentage points. Qualified wafer purchases remain product-specific.

MARKET DRIVERS

Drivers Impact Analysis

Market Drivers Impact Rank CAGR Contribution (%) 2026–2029 2030–2032 2033–2036
Power-device efficiency and electrification High +6.40% High High High
200 mm SiC migration and wafer utilization Medium-High +5.30% High High Medium
High-voltage grid and industrial epitaxy Medium +4.10% Medium High High
GaN and RF/optical design qualifications Low-Medium +2.90% Medium Medium High
Others (engineered wafer formats) Low +1.90% Low Medium High

Automotive and industrial power devices

Power semiconductor material demand is shaped by higher voltage and lower switching-loss designs for traction inverters, chargers and industrial drives. For power semiconductor material demand, Each new device platform needs qualified conductive SiC crystal and epitaxial layers with tight consistency. During 2026–2036, the modeled +6.40 percentage-point driver measures scenario contribution rather than audited device shipment statistics; orders remain specification-led for power semiconductor material demand. Buyers assess higher voltage and lower switching-loss designs for traction inverters, chargers and industrial drives alongside lot traceability and usable wafer area in power semiconductor material demand.

200 mm commercial wafer transition

The 200 mm migration is shaped by more die area per wafer and a growing set of commercially offered SiC substrates. For the 200 mm migration, Wolfspeed commercialized 200 mm material in 2025 and introduced a premium grade in 2026, while SK Siltron CSS and Coherent list 200 mm offerings. During 2026–2036, realized savings depend on usable die yield and capital efficiency; orders remain specification-led for the 200 mm migration. Buyers assess more die area per wafer and a growing set of commercially offered SiC substrates alongside lot traceability and usable wafer area in the 200 mm migration.

High-voltage epi specialization

Thick SiC epitaxial layers is shaped by industrial and data-center power architectures targeting multi-kilovolt devices. For thick sic epitaxial layers, Coherent reported 150 mm and 200 mm epitaxy capability for devices up to 10kV in April 2026. During 2026–2036, the material opportunity is distinct from the finished switch or converter revenue; orders remain specification-led for thick sic epitaxial layers. Buyers assess industrial and data-center power architectures targeting multi-kilovolt devices alongside lot traceability and usable wafer area in thick sic epitaxial layers.

MARKET RESTRAINTS

Restraints Impact Analysis

Market Restraints Impact Rank CAGR Contribution (%) 2026–2029 2030–2032 2033–2036
Crystal growth defects and qualification scrap High -3.20% High Medium Medium
Capex intensity and wafer pricing pressure Medium -2.00% High High Medium
Others (substitution and supply concentration) Low -1.20% Medium Medium Low

Defect-related wafer loss

Crystal quality risk is shaped by micropipes, dislocations, wafer bow and surface defects. For crystal quality risk, A larger substrate can increase gross area while still producing poor economics if process losses or device failures rise. During 2026–2036, qualification scrap and inspection intensity create a modeled negative contribution to growth; orders remain specification-led for crystal quality risk. Buyers assess micropipes, dislocations, wafer bow and surface defects alongside lot traceability and usable wafer area in crystal quality risk.

Investment and pricing cycles

Capital-intensive substrate capacity is shaped by long equipment lead times and unpredictable end-device utilization. For capital-intensive substrate capacity, Oversupply in one diameter or grade can reduce wafer selling prices even while physical unit shipments rise. During 2026–2036, factory-gate revenue therefore does not scale one-for-one with nominal crystal growth capacity; orders remain specification-led for capital-intensive substrate capacity. Buyers assess long equipment lead times and unpredictable end-device utilization alongside lot traceability and usable wafer area in capital-intensive substrate capacity.

MARKET OPPORTUNITIES

Premium low-defect 200 mm wafers

Premium SiC substrate opportunity is shaped by customer demand for higher good-die yield and reproducible electrical properties. For premium sic substrate opportunity, Wolfspeed premium 200 mm n-type product specifications provide a concrete example of wafer differentiation. During 2026–2036, successful qualification can shift purchases toward higher-value grades without assuming industry-wide defect rates; orders remain specification-led for premium sic substrate opportunity. Buyers assess customer demand for higher good-die yield and reproducible electrical properties alongside lot traceability and usable wafer area in premium sic substrate opportunity.

GaN and AlN specialty programs

Nitride material diversification is shaped by RF, power and ultraviolet optoelectronic devices requiring different epitaxial stacks. For nitride material diversification, SCIOCS lists GaN substrates, GaN epitaxy and AlN templates, while Kyma serves specialized nitride and oxide programs. During 2026–2036, the commercial opportunity depends on converting small samples into qualified repeated orders; orders remain specification-led for nitride material diversification. Buyers assess RF, power and ultraviolet optoelectronic devices requiring different epitaxial stacks alongside lot traceability and usable wafer area in nitride material diversification.

Bonded substrate process improvements

Engineered SiC wafer development is shaped by material transfer and bonding technologies that seek better crystal utilization. For engineered sic wafer development, Resonac and Soitec announced a 200 mm bonded-SiC collaboration in September 2024. During 2026–2036, the market model keeps R&D announcements distinct from confirmed volume shipments; orders remain specification-led for engineered sic wafer development. Buyers assess material transfer and bonding technologies that seek better crystal utilization alongside lot traceability and usable wafer area in engineered sic wafer development.

WBG Semiconductor Material Supply Chain and Value Addition

The value chain begins with high-purity feedstock and crystal-growth equipment, continues through boule growth, slicing, polishing and epitaxy, and ends with qualified wafers shipped to power, RF or optoelectronic device makers. Material revenue is counted at the qualified wafer sale, not again when that wafer becomes a packaged semiconductor. Qualified wafer purchases remain product-specific.

UpstreamHigh-purity SiC and nitride feedstocks, growth furnaces, seed crystals, metrology and polishing consumables
Materials processingBoule growth, slicing, lapping, polishing, doping and epitaxial deposition
Qualification and channelCrystal-grade testing, defect maps, long-term wafer contracts and merchant sales
DownstreamPower discrete fabrication, RF GaN processes, optical emitters and specialized research devices

Crystal growth. Upstream material preparation is shaped by purity control, thermal gradients and boule-growth stability. For upstream material preparation, These factors determine crystal defects and downstream polishing losses before a wafer can be sold. During 2026–2036, high input costs cannot be treated as independent market sales once incorporated into a finished substrate; orders remain specification-led for upstream material preparation. Buyers assess purity control, thermal gradients and boule-growth stability alongside lot traceability and usable wafer area in upstream material preparation.

Wafer and epitaxy. Manufacturing value addition is shaped by wafer slicing, surface preparation and controlled epitaxial growth. For manufacturing value addition, Selling a bare wafer differs from selling a processed epitaxial wafer, and a vertically integrated transfer differs from an external merchant invoice. During 2026–2036, the modeled format mix therefore separates saleable products without double counting intermediate processing; orders remain specification-led for manufacturing value addition. Buyers assess wafer slicing, surface preparation and controlled epitaxial growth alongside lot traceability and usable wafer area in manufacturing value addition.

Customer qualification. Commercial access is shaped by lot traceability, electrical mapping, thickness and bow tolerances. For commercial access, Automotive power-device customers may require lengthy repeated validation before sourcing from a new material supplier. During 2026–2036, technical brochures demonstrate capability but cannot establish global customer adoption or realized revenue; orders remain specification-led for commercial access. Buyers assess lot traceability, electrical mapping, thickness and bow tolerances alongside lot traceability and usable wafer area in commercial access.

Downstream fabrication. Device-making customers is shaped by implantation, lithography, contacts and packaging on qualified compound-semiconductor wafers. For device-making customers, Finished MOSFETs, RF amplifiers and optical components incorporate the material but create additional value downstream. During 2026–2036, their selling prices must be excluded from the upstream factory-gate substrate total; orders remain specification-led for device-making customers. Buyers assess implantation, lithography, contacts and packaging on qualified compound-semiconductor wafers alongside lot traceability and usable wafer area in device-making customers.

Recent Developments in WBG Semiconductor Substrates and Materials

  • 15 Oct 2026 SiC supply agreement
    SiC supply agreement is shaped by Wolfspeed and Infineon expanded their long-term SiC wafer supply agreement to include 200 mm products, illustrating the role of contracted material qualification in power device capacity planning. For sic supply agreement, The commercial significance lies in qualification or materials technology rather than a reported global revenue figure. During 2026–2036, the announcement does not independently establish the forecast market total; orders remain specification-led for sic supply agreement. Buyers assess Wolfspeed and Infineon expanded their long-term SiC wafer supply agreement to include 200 mm products, illustrating the role of contracted material qualification in power device capacity planning alongside lot traceability and usable wafer area in sic supply agreement. Source
  • 27 Sep 2026 Premium SiC wafer
    Premium SiC wafer is shaped by Wolfspeed announced commercial availability of premium 200 mm n-type substrates and disclosed fewer than 0.01 micropipes per square centimeter for the product, a supplier-specific quality metric. For premium sic wafer, The commercial significance lies in qualification or materials technology rather than a reported global revenue figure. During 2026–2036, the announcement does not independently establish the forecast market total; orders remain specification-led for premium sic wafer. Buyers assess Wolfspeed announced commercial availability of premium 200 mm n-type substrates and disclosed fewer than 0.01 micropipes per square centimeter for the product, a supplier-specific quality metric alongside lot traceability and usable wafer area in premium sic wafer. Source
  • 18 May 2026 GaN materials
    GaN materials is shaped by Sumitomo Chemical announced its PCIM Europe 2026 exhibition of GaN substrates and GaN-on-GaN epitaxial wafers, identifying material supply for next-generation power conversion. For gan materials, The commercial significance lies in qualification or materials technology rather than a reported global revenue figure. During 2026–2036, the announcement does not independently establish the forecast market total; orders remain specification-led for gan materials. Buyers assess Sumitomo Chemical announced its PCIM Europe 2026 exhibition of GaN substrates and GaN-on-GaN epitaxial wafers, identifying material supply for next-generation power conversion alongside lot traceability and usable wafer area in gan materials. Source
  • 9 Apr 2026 Thick SiC epitaxy
    Thick SiC epitaxy is shaped by Coherent disclosed thick 150 mm and 200 mm SiC epitaxy supporting device architectures up to 10 kV, connecting substrate quality with industrial and data-center power development. For thick sic epitaxy, The commercial significance lies in qualification or materials technology rather than a reported global revenue figure. During 2026–2036, the announcement does not independently establish the forecast market total; orders remain specification-led for thick sic epitaxy. Buyers assess Coherent disclosed thick 150 mm and 200 mm SiC epitaxy supporting device architectures up to 10 kV, connecting substrate quality with industrial and data-center power development alongside lot traceability and usable wafer area in thick sic epitaxy. Source
  • 13 Jan 2026 300 mm milestone
    300 mm milestone is shaped by Wolfspeed reported a 300 mm single-crystal SiC technology milestone; the development indicates research progress but does not prove routine merchant power-wafer volume shipments. For 300 mm milestone, The commercial significance lies in qualification or materials technology rather than a reported global revenue figure. During 2026–2036, the announcement does not independently establish the forecast market total; orders remain specification-led for 300 mm milestone. Buyers assess Wolfspeed reported a 300 mm single-crystal SiC technology milestone; the development indicates research progress but does not prove routine merchant power-wafer volume shipments alongside lot traceability and usable wafer area in 300 mm milestone. Source
  • 3 Dec 2025 Thermal materials boundary
    Thermal materials boundary is shaped by Coherent announced a 300 mm SiC platform primarily for AI data-center thermal management, which must be separated from power-device-grade wafer sales in a semiconductor substrate market. For thermal materials boundary, The commercial significance lies in qualification or materials technology rather than a reported global revenue figure. During 2026–2036, the announcement does not independently establish the forecast market total; orders remain specification-led for thermal materials boundary. Buyers assess Coherent announced a 300 mm SiC platform primarily for AI data-center thermal management, which must be separated from power-device-grade wafer sales in a semiconductor substrate market alongside lot traceability and usable wafer area in thermal materials boundary. Source
  • 10 Sep 2025 Commercial 200 mm
    Commercial 200 mm is shaped by Wolfspeed launched a commercial 200 mm SiC materials portfolio and offered 200 mm epitaxy for qualification, marking a distinct step beyond laboratory demonstrations. For commercial 200 mm, The commercial significance lies in qualification or materials technology rather than a reported global revenue figure. During 2026–2036, the announcement does not independently establish the forecast market total; orders remain specification-led for commercial 200 mm. Buyers assess Wolfspeed launched a commercial 200 mm SiC materials portfolio and offered 200 mm epitaxy for qualification, marking a distinct step beyond laboratory demonstrations alongside lot traceability and usable wafer area in commercial 200 mm. Source
  • 24 Sep 2024 Bonded substrate R&D
    Bonded substrate R&D is shaped by Resonac and Soitec announced joint development of bonded 200 mm SiC substrates for power semiconductors, showing an engineered-wafer path that still requires qualification before scale. For bonded substrate r&d, The commercial significance lies in qualification or materials technology rather than a reported global revenue figure. During 2026–2036, the announcement does not independently establish the forecast market total; orders remain specification-led for bonded substrate r&d. Buyers assess Resonac and Soitec announced joint development of bonded 200 mm SiC substrates for power semiconductors, showing an engineered-wafer path that still requires qualification before scale alongside lot traceability and usable wafer area in bonded substrate r&d. Source

REPORT SCOPE & SEGMENTATION

Attribute Details
Market Wide Bandgap (WBG) Semiconductor Material
Revenue boundary Factory-gate merchant SiC, GaN, AlN and other semiconductor substrates plus separately sold epitaxial wafers; excludes finished devices and generic ceramics
2026 base USD 1,191.48 million
2027 estimate USD 1,360.68 million
2036 forecast USD 4,495.21 million
CAGR 14.2%
Currency USD million
Source period 2023 USD 800 million and 2030 USD 2,026.53 million publisher endpoints; 2036 mathematical extension
By Type SiC Substrates · GaN Substrates · AlN Substrates · Other WBG Substrates
By Application Power Discrete Devices · RF Devices · Optoelectronic Devices
By Wafer Diameter 100 mm and Below · 150 mm · 200 mm
By Buyer Channel Integrated Device Manufacturers · Merchant Foundries and Epitaxy Specialists · Research and Other Qualified Buyers
By Product Format Bare Polished Wafers · Epitaxial Wafers · Bonded and Engineered Substrates
By Region Five-region coverage; 2026 shares are modeled estimates, not audited revenue splits.
North AmericaUnited States, Canada, Mexico
EuropeGermany, France, Italy, Rest of Europe
Asia-PacificChina, Japan, South Korea, Taiwan, India, Rest of Asia-Pacific
South AmericaBrazil, Argentina, Chile, Rest of South America
Middle East & AfricaIsrael, UAE, Saudi Arabia, South Africa, Rest of Middle East & Africa
Key Companies Profiled Wolfspeed, Coherent, SiCrystal (ROHM Group), SK Siltron CSS, SICC, TanKeBlue Semiconductor, Sumitomo Chemical SCIOCS, Kyma Technologies, Resonac, Soitec
Customization Scope Country, wafer-diameter, material grade, epitaxy and buyer-channel segmentation can be adapted for purchasing and investment decisions without mixing upstream and finished-device revenue.

Frequently Asked Questions

What is the 2026 global WBG semiconductor material market size?

The defined market is valued at USD 1,191.48 million in 2026, with a modeled 2036 forecast of USD 4,495.21 million and annual growth of 14.2%. It covers factory-gate sales of qualified wide-bandgap semiconductor substrates and separately sold epitaxial wafers. The monetary series extends beyond the original publisher endpoint and should be interpreted as a scenario rather than audited future revenue.

What materials are included?

The type segmentation includes SiC substrates, GaN substrates, AlN substrates and other specialty wide-bandgap substrates. SiC represents an estimated ~70% of 2026 sales, with GaN at ~20%, AlN at ~7% and other materials at ~3%. The categories are distinguished by crystal technology and device qualification, not by sales of finished power or RF chips.

Which region leads?

Asia-Pacific leads at an estimated ~48% of 2026 merchant material value because China, Japan and South Korea have significant substrate and device supply chains. North America accounts for a modeled ~25%, Europe ~19%, and South America and Middle East & Africa ~4% each. Regional values remain estimates; manufacturer disclosures do not audit these precise percentages.

What is the largest application?

Power discrete device fabrication represents an estimated ~60% of upstream wafer value, compared with ~25% for RF devices and ~15% for optoelectronic devices. SiC substrates serve high-voltage switches and diodes, semi-insulating SiC and GaN epitaxy support RF fabrication, and GaN or AlN templates can support optical emitters. Device revenue is excluded.

How does 200 mm adoption affect revenue?

Commercial 200 mm SiC material offerings increase potential good-die area and create qualification demand for larger wafer formats. Wolfspeed introduced a commercial 200 mm materials portfolio in September 2025 and a premium grade in September 2026. The benefit depends on defect density, wafer shape and process yields, so diameter growth alone cannot guarantee lower device cost.

Does the forecast include 300 mm SiC wafer sales?

Routine 300 mm power-device-grade merchant shipments are not assumed in the 2026 substrate allocation. Wolfspeed announced a 300 mm single-crystal milestone in January 2026, while Coherent described a 300 mm SiC platform for thermal-management applications. Both are important technology signals, but they do not establish commercially qualified mass-volume power wafers.

Who are the key substrate manufacturers?

Relevant direct-scope material participants include Wolfspeed, Coherent, SiCrystal, SK Siltron CSS, SICC, TanKeBlue, Sumitomo Chemical SCIOCS, Kyma, Resonac and Soitec. Their products range from commercial conductive SiC wafers to native GaN, AlN templates and bonded engineered substrates. Company size and total semiconductor turnover do not directly measure substrate-market shares. The figures describe merchant wafer value and must be distinguished from downstream device revenue and company-wide turnover.

What are the main risks?

Crystal defects, low initial 200 mm yields, capital intensity, price competition and long device qualification cycles constrain the market. Materials must satisfy tight electrical, geometric and surface specifications before high-volume adoption. Research announcements can precede merchant revenue by years, and an increase in physical wafer output does not necessarily translate into proportional dollar growth.

Is this market additive to finished WBG power devices?

No. The material series describes upstream substrates and sold epitaxial wafers; finished SiC and GaN switches or modules already embed these materials. Adding the two revenue pools would double count part of the value chain. The publisher anchors also duplicate another substrate-material entry in the cumulative tracker, so those two material totals must not be added.

How is the 2036 value interpreted?

The 2036 projection applies the growth ratio implied by the 2023 and 2030 monetary endpoints beyond the source period. The 2026 base is about USD 1.19 billion and the 2027 estimate is USD 1,360.68 million, with the reconciled annual growth rate applied through 2036. Supplier product evidence supports material technology, not the exact global forecast or segment shares.

Research Sources & Evidence Base
View research sources used for this overview
  1. Wolfspeed. Commercial launch of 200 mm SiC materials, September 2025 bare-wafer and epi qualification availability.
  2. Wolfspeed. 300 mm single-crystal SiC milestone, January 2026 research development, not proof of mass-volume sales.
  3. Wolfspeed. SiC materials for power electronics, Power-grade wafer electrical and dimensional specifications.
  4. Coherent. SiC substrates and epitaxy, Commercial product boundary for bare and epitaxial wafers.
  5. Coherent. 200 mm SiC epitaxial wafer production, September 2024 capacity and wafer process evidence.
  6. Sumitomo Chemical SCIOCS. GaN substrate products, Native nitride material grades and device applications.
  7. Sumitomo Chemical SCIOCS. GaN epitaxial wafer products, Native and heteroepitaxial nitride offerings.
  8. Sumitomo Chemical SCIOCS. AlN templates, Sample-stage UV optical substrate offerings.
  9. SiCrystal. Single-crystal SiC wafers, Commercial European substrate manufacturer identity.
  10. SK Siltron CSS. SiC substrate and epi catalog, 150 mm and 200 mm material products.
  11. TanKeBlue. SiC substrate and epitaxy portfolio, Chinese merchant wafer and epi supplier evidence.
  12. SICC. SiC product grades, Conductive and semi-insulating 4H-SiC categories.
  13. Kyma Technologies. GaN and AlN substrate products, Specialty nitride and oxide wafer materials.
  14. Soitec. SmartSiC engineered substrates, Bonded wafer technology and materials differentiation.
  15. Resonac. Bonded SiC substrate collaboration, September 2024 200 mm R&D agreement with Soitec.
  16. Wolfspeed. 200 mm wafer supply agreement, October 2026 material supply relationship.
  17. Wolfspeed. Premium 200 mm n-type SiC substrate, September 2026 supplier-specific defect specification.
  18. Sumitomo Chemical. GaN materials at PCIM Europe 2026, May 2026 nitride material product demonstration.
  19. Coherent. High-voltage thick SiC epitaxy, April 2026 150/200 mm epi platform for 10kV devices.
  20. Coherent. 300 mm SiC thermal platform, December 2025 adjacent thermal packaging context, excluded from core merchant power wafer revenue.
Wide Bandgap (WBG) Semiconductor Material Market

Get Sample Report PDF for Exclusive Insights

Report Sample Includes

  • Table of Contents
  • List of Tables & Figures
  • Charts, Research Methodology, and more...

PDF Icon Download Sample Report PDF

Download Sample Report

Table of Content

Table of Contents
1 Research Methodology and Statistical Scope
1.1 Market Definition and Statistical Scope of Wide Bandgap (WBG) Semiconductor Material
1.2 Key Market Segments
1.2.1 Wide Bandgap (WBG) Semiconductor Material Segment by Type
1.2.2 Wide Bandgap (WBG) Semiconductor Material Segment by Application
1.3 Methodology & Sources of Information
1.3.1 Research Methodology
1.3.2 Research Process
1.3.3 Market Breakdown and Data Triangulation
1.3.4 Base Year
1.3.5 Report Assumptions & Caveats
2 Wide Bandgap (WBG) Semiconductor Material Market Overview
2.1 Global Market Overview
2.1.1 Global Wide Bandgap (WBG) Semiconductor Material Market Size (M USD) Estimates and Forecasts (2026-2034)
2.1.2 Global Wide Bandgap (WBG) Semiconductor Material Sales Estimates and Forecasts (2026-2034)
2.2 Market Segment Executive Summary
2.3 Global Market Size by Region
3 Wide Bandgap (WBG) Semiconductor Material Market Competitive Landscape
3.1 Global Wide Bandgap (WBG) Semiconductor Material Sales by Manufacturers (2019-2025)
3.2 Global Wide Bandgap (WBG) Semiconductor Material Revenue Market Share by Manufacturers (2019-2025)
3.3 Wide Bandgap (WBG) Semiconductor Material Market Share by Company Type (Tier 1, Tier 2, and Tier 3)
3.4 Global Wide Bandgap (WBG) Semiconductor Material Average Price by Manufacturers (2019-2025)
3.5 Manufacturers Wide Bandgap (WBG) Semiconductor Material Sales Sites, Area Served, Product Type
3.6 Wide Bandgap (WBG) Semiconductor Material Market Competitive Situation and Trends
3.6.1 Wide Bandgap (WBG) Semiconductor Material Market Concentration Rate
3.6.2 Global 5 and 10 Largest Wide Bandgap (WBG) Semiconductor Material Players Market Share by Revenue
3.6.3 Mergers & Acquisitions, Expansion
4 Wide Bandgap (WBG) Semiconductor Material Industry Chain Analysis
4.1 Wide Bandgap (WBG) Semiconductor Material Industry Chain Analysis
4.2 Market Overview of Key Raw Materials
4.3 Midstream Market Analysis
4.4 Downstream Customer Analysis
5 The Development and Dynamics of Wide Bandgap (WBG) Semiconductor Material Market
5.1 Key Development Trends
5.2 Driving Factors
5.3 Market Challenges
5.4 Market Restraints
5.5 Industry News
5.5.1 New Product Developments
5.5.2 Mergers & Acquisitions
5.5.3 Expansions
5.5.4 Collaboration/Supply Contracts
5.6 Industry Policies
6 Wide Bandgap (WBG) Semiconductor Material Market Segmentation by Type
6.1 Evaluation Matrix of Segment Market Development Potential (Type)
6.2 Global Wide Bandgap (WBG) Semiconductor Material Sales Market Share by Type (2019-2025)
6.3 Global Wide Bandgap (WBG) Semiconductor Material Market Size Market Share by Type (2019-2025)
6.4 Global Wide Bandgap (WBG) Semiconductor Material Price by Type (2019-2025)
7 Wide Bandgap (WBG) Semiconductor Material Market Segmentation by Application
7.1 Evaluation Matrix of Segment Market Development Potential (Application)
7.2 Global Wide Bandgap (WBG) Semiconductor Material Market Sales by Application (2019-2025)
7.3 Global Wide Bandgap (WBG) Semiconductor Material Market Size (M USD) by Application (2019-2025)
7.4 Global Wide Bandgap (WBG) Semiconductor Material Sales Growth Rate by Application (2019-2025)
8 Wide Bandgap (WBG) Semiconductor Material Market Segmentation by Region
8.1 Global Wide Bandgap (WBG) Semiconductor Material Sales by Region
8.1.1 Global Wide Bandgap (WBG) Semiconductor Material Sales by Region
8.1.2 Global Wide Bandgap (WBG) Semiconductor Material Sales Market Share by Region
8.2 North America
8.2.1 North America Wide Bandgap (WBG) Semiconductor Material Sales by Country
8.2.2 U.S.
8.2.3 Canada
8.2.4 Mexico
8.3 Europe
8.3.1 Europe Wide Bandgap (WBG) Semiconductor Material Sales by Country
8.3.2 Germany
8.3.3 France
8.3.4 U.K.
8.3.5 Italy
8.3.6 Russia
8.4 Asia Pacific
8.4.1 Asia Pacific Wide Bandgap (WBG) Semiconductor Material Sales by Region
8.4.2 China
8.4.3 Japan
8.4.4 South Korea
8.4.5 India
8.4.6 Southeast Asia
8.5 South America
8.5.1 South America Wide Bandgap (WBG) Semiconductor Material Sales by Country
8.5.2 Brazil
8.5.3 Argentina
8.5.4 Columbia
8.6 Middle East and Africa
8.6.1 Middle East and Africa Wide Bandgap (WBG) Semiconductor Material Sales by Region
8.6.2 Saudi Arabia
8.6.3 UAE
8.6.4 Egypt
8.6.5 Nigeria
8.6.6 South Africa
9 Key Companies Profile
9.1 Wolfspeed
9.1.1 Wolfspeed Wide Bandgap (WBG) Semiconductor Material Basic Information
9.1.2 Wolfspeed Wide Bandgap (WBG) Semiconductor Material Product Overview
9.1.3 Wolfspeed Wide Bandgap (WBG) Semiconductor Material Product Market Performance
9.1.4 Wolfspeed Business Overview
9.1.5 Wolfspeed Wide Bandgap (WBG) Semiconductor Material SWOT Analysis
9.1.6 Wolfspeed Recent Developments
9.2 Coherent
9.2.1 Coherent Wide Bandgap (WBG) Semiconductor Material Basic Information
9.2.2 Coherent Wide Bandgap (WBG) Semiconductor Material Product Overview
9.2.3 Coherent Wide Bandgap (WBG) Semiconductor Material Product Market Performance
9.2.4 Coherent Business Overview
9.2.5 Coherent Wide Bandgap (WBG) Semiconductor Material SWOT Analysis
9.2.6 Coherent Recent Developments
9.3 TankeBlue Semiconductor
9.3.1 TankeBlue Semiconductor Wide Bandgap (WBG) Semiconductor Material Basic Information
9.3.2 TankeBlue Semiconductor Wide Bandgap (WBG) Semiconductor Material Product Overview
9.3.3 TankeBlue Semiconductor Wide Bandgap (WBG) Semiconductor Material Product Market Performance
9.3.4 TankeBlue Semiconductor Wide Bandgap (WBG) Semiconductor Material SWOT Analysis
9.3.5 TankeBlue Semiconductor Business Overview
9.3.6 TankeBlue Semiconductor Recent Developments
9.4 SICC Materials
9.4.1 SICC Materials Wide Bandgap (WBG) Semiconductor Material Basic Information
9.4.2 SICC Materials Wide Bandgap (WBG) Semiconductor Material Product Overview
9.4.3 SICC Materials Wide Bandgap (WBG) Semiconductor Material Product Market Performance
9.4.4 SICC Materials Business Overview
9.4.5 SICC Materials Recent Developments
9.5 Beijing Cengol Semiconductor
9.5.1 Beijing Cengol Semiconductor Wide Bandgap (WBG) Semiconductor Material Basic Information
9.5.2 Beijing Cengol Semiconductor Wide Bandgap (WBG) Semiconductor Material Product Overview
9.5.3 Beijing Cengol Semiconductor Wide Bandgap (WBG) Semiconductor Material Product Market Performance
9.5.4 Beijing Cengol Semiconductor Business Overview
9.5.5 Beijing Cengol Semiconductor Recent Developments
9.6 Resonac
9.6.1 Resonac Wide Bandgap (WBG) Semiconductor Material Basic Information
9.6.2 Resonac Wide Bandgap (WBG) Semiconductor Material Product Overview
9.6.3 Resonac Wide Bandgap (WBG) Semiconductor Material Product Market Performance
9.6.4 Resonac Business Overview
9.6.5 Resonac Recent Developments
9.7 Hebei Synlight Crystal
9.7.1 Hebei Synlight Crystal Wide Bandgap (WBG) Semiconductor Material Basic Information
9.7.2 Hebei Synlight Crystal Wide Bandgap (WBG) Semiconductor Material Product Overview
9.7.3 Hebei Synlight Crystal Wide Bandgap (WBG) Semiconductor Material Product Market Performance
9.7.4 Hebei Synlight Crystal Business Overview
9.7.5 Hebei Synlight Crystal Recent Developments
9.8 Norstel
9.8.1 Norstel Wide Bandgap (WBG) Semiconductor Material Basic Information
9.8.2 Norstel Wide Bandgap (WBG) Semiconductor Material Product Overview
9.8.3 Norstel Wide Bandgap (WBG) Semiconductor Material Product Market Performance
9.8.4 Norstel Business Overview
9.8.5 Norstel Recent Developments
9.9 ROHM Group (SiCrystal)
9.9.1 ROHM Group (SiCrystal) Wide Bandgap (WBG) Semiconductor Material Basic Information
9.9.2 ROHM Group (SiCrystal) Wide Bandgap (WBG) Semiconductor Material Product Overview
9.9.3 ROHM Group (SiCrystal) Wide Bandgap (WBG) Semiconductor Material Product Market Performance
9.9.4 ROHM Group (SiCrystal) Business Overview
9.9.5 ROHM Group (SiCrystal) Recent Developments
9.10 SK Siltron
9.10.1 SK Siltron Wide Bandgap (WBG) Semiconductor Material Basic Information
9.10.2 SK Siltron Wide Bandgap (WBG) Semiconductor Material Product Overview
9.10.3 SK Siltron Wide Bandgap (WBG) Semiconductor Material Product Market Performance
9.10.4 SK Siltron Business Overview
9.10.5 SK Siltron Recent Developments
9.11 San’an Optoelectronics
9.11.1 San’an Optoelectronics Wide Bandgap (WBG) Semiconductor Material Basic Information
9.11.2 San’an Optoelectronics Wide Bandgap (WBG) Semiconductor Material Product Overview
9.11.3 San’an Optoelectronics Wide Bandgap (WBG) Semiconductor Material Product Market Performance
9.11.4 San’an Optoelectronics Business Overview
9.11.5 San’an Optoelectronics Recent Developments
9.12 CETC
9.12.1 CETC Wide Bandgap (WBG) Semiconductor Material Basic Information
9.12.2 CETC Wide Bandgap (WBG) Semiconductor Material Product Overview
9.12.3 CETC Wide Bandgap (WBG) Semiconductor Material Product Market Performance
9.12.4 CETC Business Overview
9.12.5 CETC Recent Developments
9.13 Mitsubishi Chemical
9.13.1 Mitsubishi Chemical Wide Bandgap (WBG) Semiconductor Material Basic Information
9.13.2 Mitsubishi Chemical Wide Bandgap (WBG) Semiconductor Material Product Overview
9.13.3 Mitsubishi Chemical Wide Bandgap (WBG) Semiconductor Material Product Market Performance
9.13.4 Mitsubishi Chemical Business Overview
9.13.5 Mitsubishi Chemical Recent Developments
9.14 SUMITOMO ELECTRIC
9.14.1 SUMITOMO ELECTRIC Wide Bandgap (WBG) Semiconductor Material Basic Information
9.14.2 SUMITOMO ELECTRIC Wide Bandgap (WBG) Semiconductor Material Product Overview
9.14.3 SUMITOMO ELECTRIC Wide Bandgap (WBG) Semiconductor Material Product Market Performance
9.14.4 SUMITOMO ELECTRIC Business Overview
9.14.5 SUMITOMO ELECTRIC Recent Developments
9.15 Kyma Technologies
9.15.1 Kyma Technologies Wide Bandgap (WBG) Semiconductor Material Basic Information
9.15.2 Kyma Technologies Wide Bandgap (WBG) Semiconductor Material Product Overview
9.15.3 Kyma Technologies Wide Bandgap (WBG) Semiconductor Material Product Market Performance
9.15.4 Kyma Technologies Business Overview
9.15.5 Kyma Technologies Recent Developments
9.16 Element Six
9.16.1 Element Six Wide Bandgap (WBG) Semiconductor Material Basic Information
9.16.2 Element Six Wide Bandgap (WBG) Semiconductor Material Product Overview
9.16.3 Element Six Wide Bandgap (WBG) Semiconductor Material Product Market Performance
9.16.4 Element Six Business Overview
9.16.5 Element Six Recent Developments
9.17 Akash Systems
9.17.1 Akash Systems Wide Bandgap (WBG) Semiconductor Material Basic Information
9.17.2 Akash Systems Wide Bandgap (WBG) Semiconductor Material Product Overview
9.17.3 Akash Systems Wide Bandgap (WBG) Semiconductor Material Product Market Performance
9.17.4 Akash Systems Business Overview
9.17.5 Akash Systems Recent Developments
9.18 Qorvo
9.18.1 Qorvo Wide Bandgap (WBG) Semiconductor Material Basic Information
9.18.2 Qorvo Wide Bandgap (WBG) Semiconductor Material Product Overview
9.18.3 Qorvo Wide Bandgap (WBG) Semiconductor Material Product Market Performance
9.18.4 Qorvo Business Overview
9.18.5 Qorvo Recent Developments
9.19 RFHIC Corporation
9.19.1 RFHIC Corporation Wide Bandgap (WBG) Semiconductor Material Basic Information
9.19.2 RFHIC Corporation Wide Bandgap (WBG) Semiconductor Material Product Overview
9.19.3 RFHIC Corporation Wide Bandgap (WBG) Semiconductor Material Product Market Performance
9.19.4 RFHIC Corporation Business Overview
9.19.5 RFHIC Corporation Recent Developments
9.20 Maruwa
9.20.1 Maruwa Wide Bandgap (WBG) Semiconductor Material Basic Information
9.20.2 Maruwa Wide Bandgap (WBG) Semiconductor Material Product Overview
9.20.3 Maruwa Wide Bandgap (WBG) Semiconductor Material Product Market Performance
9.20.4 Maruwa Business Overview
9.20.5 Maruwa Recent Developments
9.21 Toshiba Materials
9.21.1 Toshiba Materials Wide Bandgap (WBG) Semiconductor Material Basic Information
9.21.2 Toshiba Materials Wide Bandgap (WBG) Semiconductor Material Product Overview
9.21.3 Toshiba Materials Wide Bandgap (WBG) Semiconductor Material Product Market Performance
9.21.4 Toshiba Materials Business Overview
9.21.5 Toshiba Materials Recent Developments
9.22 CeramTec
9.22.1 CeramTec Wide Bandgap (WBG) Semiconductor Material Basic Information
9.22.2 CeramTec Wide Bandgap (WBG) Semiconductor Material Product Overview
9.22.3 CeramTec Wide Bandgap (WBG) Semiconductor Material Product Market Performance
9.22.4 CeramTec Business Overview
9.22.5 CeramTec Recent Developments
9.23 Denka
9.23.1 Denka Wide Bandgap (WBG) Semiconductor Material Basic Information
9.23.2 Denka Wide Bandgap (WBG) Semiconductor Material Product Overview
9.23.3 Denka Wide Bandgap (WBG) Semiconductor Material Product Market Performance
9.23.4 Denka Business Overview
9.23.5 Denka Recent Developments
9.24 TD Power Materials
9.24.1 TD Power Materials Wide Bandgap (WBG) Semiconductor Material Basic Information
9.24.2 TD Power Materials Wide Bandgap (WBG) Semiconductor Material Product Overview
9.24.3 TD Power Materials Wide Bandgap (WBG) Semiconductor Material Product Market Performance
9.24.4 TD Power Materials Business Overview
9.24.5 TD Power Materials Recent Developments
9.25 Kyocera
9.25.1 Kyocera Wide Bandgap (WBG) Semiconductor Material Basic Information
9.25.2 Kyocera Wide Bandgap (WBG) Semiconductor Material Product Overview
9.25.3 Kyocera Wide Bandgap (WBG) Semiconductor Material Product Market Performance
9.25.4 Kyocera Business Overview
9.25.5 Kyocera Recent Developments
9.26 CoorsTek
9.26.1 CoorsTek Wide Bandgap (WBG) Semiconductor Material Basic Information
9.26.2 CoorsTek Wide Bandgap (WBG) Semiconductor Material Product Overview
9.26.3 CoorsTek Wide Bandgap (WBG) Semiconductor Material Product Market Performance
9.26.4 CoorsTek Business Overview
9.26.5 CoorsTek Recent Developments
9.27 LEATEC Fine Ceramics
9.27.1 LEATEC Fine Ceramics Wide Bandgap (WBG) Semiconductor Material Basic Information
9.27.2 LEATEC Fine Ceramics Wide Bandgap (WBG) Semiconductor Material Product Overview
9.27.3 LEATEC Fine Ceramics Wide Bandgap (WBG) Semiconductor Material Product Market Performance
9.27.4 LEATEC Fine Ceramics Business Overview
9.27.5 LEATEC Fine Ceramics Recent Developments
9.28 Fujian Huaqing Electronic Material Technology
9.28.1 Fujian Huaqing Electronic Material Technology Wide Bandgap (WBG) Semiconductor Material Basic Information
9.28.2 Fujian Huaqing Electronic Material Technology Wide Bandgap (WBG) Semiconductor Material Product Overview
9.28.3 Fujian Huaqing Electronic Material Technology Wide Bandgap (WBG) Semiconductor Material Product Market Performance
9.28.4 Fujian Huaqing Electronic Material Technology Business Overview
9.28.5 Fujian Huaqing Electronic Material Technology Recent Developments
9.29 Wuxi Hygood New Technology
9.29.1 Wuxi Hygood New Technology Wide Bandgap (WBG) Semiconductor Material Basic Information
9.29.2 Wuxi Hygood New Technology Wide Bandgap (WBG) Semiconductor Material Product Overview
9.29.3 Wuxi Hygood New Technology Wide Bandgap (WBG) Semiconductor Material Product Market Performance
9.29.4 Wuxi Hygood New Technology Business Overview
9.29.5 Wuxi Hygood New Technology Recent Developments
9.30 Zhuzhou Ascendus New Material Technology
9.30.1 Zhuzhou Ascendus New Material Technology Wide Bandgap (WBG) Semiconductor Material Basic Information
9.30.2 Zhuzhou Ascendus New Material Technology Wide Bandgap (WBG) Semiconductor Material Product Overview
9.30.3 Zhuzhou Ascendus New Material Technology Wide Bandgap (WBG) Semiconductor Material Product Market Performance
9.30.4 Zhuzhou Ascendus New Material Technology Business Overview
9.30.5 Zhuzhou Ascendus New Material Technology Recent Developments
10 Wide Bandgap (WBG) Semiconductor Material Market Forecast by Region
10.1 Global Wide Bandgap (WBG) Semiconductor Material Market Size Forecast
10.2 Global Wide Bandgap (WBG) Semiconductor Material Market Forecast by Region
10.2.1 North America Market Size Forecast by Country
10.2.2 Europe Wide Bandgap (WBG) Semiconductor Material Market Size Forecast by Country
10.2.3 Asia Pacific Wide Bandgap (WBG) Semiconductor Material Market Size Forecast by Region
10.2.4 South America Wide Bandgap (WBG) Semiconductor Material Market Size Forecast by Country
10.2.5 Middle East and Africa Forecasted Consumption of Wide Bandgap (WBG) Semiconductor Material by Country
11 Forecast Market by Type and by Application (2025-2030)
11.1 Global Wide Bandgap (WBG) Semiconductor Material Market Forecast by Type (2025-2030)
11.1.1 Global Forecasted Sales of Wide Bandgap (WBG) Semiconductor Material by Type (2025-2030)
11.1.2 Global Wide Bandgap (WBG) Semiconductor Material Market Size Forecast by Type (2025-2030)
11.1.3 Global Forecasted Price of Wide Bandgap (WBG) Semiconductor Material by Type (2025-2030)
11.2 Global Wide Bandgap (WBG) Semiconductor Material Market Forecast by Application (2025-2030)
11.2.1 Global Wide Bandgap (WBG) Semiconductor Material Sales (K Units) Forecast by Application
11.2.2 Global Wide Bandgap (WBG) Semiconductor Material Market Size (M USD) Forecast by Application (2025-2030)
12 Conclusion and Key FindingsList of Tables
Table 1. Introduction of the Type
Table 2. Introduction of the Application
Table 3. Market Size (M USD) Segment Executive Summary
Table 4. Wide Bandgap (WBG) Semiconductor Material Market Size Comparison by Region (M USD)
Table 5. Global Wide Bandgap (WBG) Semiconductor Material Sales (K Units) by Manufacturers (2019-2025)
Table 6. Global Wide Bandgap (WBG) Semiconductor Material Sales Market Share by Manufacturers (2019-2025)
Table 7. Global Wide Bandgap (WBG) Semiconductor Material Revenue (M USD) by Manufacturers (2019-2025)
Table 8. Global Wide Bandgap (WBG) Semiconductor Material Revenue Share by Manufacturers (2019-2025)
Table 9. Company Type (Tier 1, Tier 2, and Tier 3) & (based on the Revenue in Wide Bandgap (WBG) Semiconductor Material as of 2022)
Table 10. Global Market Wide Bandgap (WBG) Semiconductor Material Average Price (USD/Unit) of Key Manufacturers (2019-2025)
Table 11. Manufacturers Wide Bandgap (WBG) Semiconductor Material Sales Sites and Area Served
Table 12. Manufacturers Wide Bandgap (WBG) Semiconductor Material Product Type
Table 13. Global Wide Bandgap (WBG) Semiconductor Material Manufacturers Market Concentration Ratio (CR5 and HHI)
Table 14. Mergers & Acquisitions, Expansion Plans
Table 15. Industry Chain Map of Wide Bandgap (WBG) Semiconductor Material
Table 16. Market Overview of Key Raw Materials
Table 17. Midstream Market Analysis
Table 18. Downstream Customer Analysis
Table 19. Key Development Trends
Table 20. Driving Factors
Table 21. Wide Bandgap (WBG) Semiconductor Material Market Challenges
Table 22. Global Wide Bandgap (WBG) Semiconductor Material Sales by Type (K Units)
Table 23. Global Wide Bandgap (WBG) Semiconductor Material Market Size by Type (M USD)
Table 24. Global Wide Bandgap (WBG) Semiconductor Material Sales (K Units) by Type (2019-2025)
Table 25. Global Wide Bandgap (WBG) Semiconductor Material Sales Market Share by Type (2019-2025)
Table 26. Global Wide Bandgap (WBG) Semiconductor Material Market Size (M USD) by Type (2019-2025)
Table 27. Global Wide Bandgap (WBG) Semiconductor Material Market Size Share by Type (2019-2025)
Table 28. Global Wide Bandgap (WBG) Semiconductor Material Price (USD/Unit) by Type (2019-2025)
Table 29. Global Wide Bandgap (WBG) Semiconductor Material Sales (K Units) by Application
Table 30. Global Wide Bandgap (WBG) Semiconductor Material Market Size by Application
Table 31. Global Wide Bandgap (WBG) Semiconductor Material Sales by Application (2019-2025) & (K Units)
Table 32. Global Wide Bandgap (WBG) Semiconductor Material Sales Market Share by Application (2019-2025)
Table 33. Global Wide Bandgap (WBG) Semiconductor Material Sales by Application (2019-2025) & (M USD)
Table 34. Global Wide Bandgap (WBG) Semiconductor Material Market Share by Application (2019-2025)
Table 35. Global Wide Bandgap (WBG) Semiconductor Material Sales Growth Rate by Application (2019-2025)
Table 36. Global Wide Bandgap (WBG) Semiconductor Material Sales by Region (2019-2025) & (K Units)
Table 37. Global Wide Bandgap (WBG) Semiconductor Material Sales Market Share by Region (2019-2025)
Table 38. North America Wide Bandgap (WBG) Semiconductor Material Sales by Country (2019-2025) & (K Units)
Table 39. Europe Wide Bandgap (WBG) Semiconductor Material Sales by Country (2019-2025) & (K Units)
Table 40. Asia Pacific Wide Bandgap (WBG) Semiconductor Material Sales by Region (2019-2025) & (K Units)
Table 41. South America Wide Bandgap (WBG) Semiconductor Material Sales by Country (2019-2025) & (K Units)
Table 42. Middle East and Africa Wide Bandgap (WBG) Semiconductor Material Sales by Region (2019-2025) & (K Units)
Table 43. Wolfspeed Wide Bandgap (WBG) Semiconductor Material Basic Information
Table 44. Wolfspeed Wide Bandgap (WBG) Semiconductor Material Product Overview
Table 45. Wolfspeed Wide Bandgap (WBG) Semiconductor Material Sales (K Units), Revenue (M USD), Price (USD/Unit) and Gross Margin (2019-2025)
Table 46. Wolfspeed Business Overview
Table 47. Wolfspeed Wide Bandgap (WBG) Semiconductor Material SWOT Analysis
Table 48. Wolfspeed Recent Developments
Table 49. Coherent Wide Bandgap (WBG) Semiconductor Material Basic Information
Table 50. Coherent Wide Bandgap (WBG) Semiconductor Material Product Overview
Table 51. Coherent Wide Bandgap (WBG) Semiconductor Material Sales (K Units), Revenue (M USD), Price (USD/Unit) and Gross Margin (2019-2025)
Table 52. Coherent Business Overview
Table 53. Coherent Wide Bandgap (WBG) Semiconductor Material SWOT Analysis
Table 54. Coherent Recent Developments
Table 55. TankeBlue Semiconductor Wide Bandgap (WBG) Semiconductor Material Basic Information
Table 56. TankeBlue Semiconductor Wide Bandgap (WBG) Semiconductor Material Product Overview
Table 57. TankeBlue Semiconductor Wide Bandgap (WBG) Semiconductor Material Sales (K Units), Revenue (M USD), Price (USD/Unit) and Gross Margin (2019-2025)
Table 58. TankeBlue Semiconductor Wide Bandgap (WBG) Semiconductor Material SWOT Analysis
Table 59. TankeBlue Semiconductor Business Overview
Table 60. TankeBlue Semiconductor Recent Developments
Table 61. SICC Materials Wide Bandgap (WBG) Semiconductor Material Basic Information
Table 62. SICC Materials Wide Bandgap (WBG) Semiconductor Material Product Overview
Table 63. SICC Materials Wide Bandgap (WBG) Semiconductor Material Sales (K Units), Revenue (M USD), Price (USD/Unit) and Gross Margin (2019-2025)
Table 64. SICC Materials Business Overview
Table 65. SICC Materials Recent Developments
Table 66. Beijing Cengol Semiconductor Wide Bandgap (WBG) Semiconductor Material Basic Information
Table 67. Beijing Cengol Semiconductor Wide Bandgap (WBG) Semiconductor Material Product Overview
Table 68. Beijing Cengol Semiconductor Wide Bandgap (WBG) Semiconductor Material Sales (K Units), Revenue (M USD), Price (USD/Unit) and Gross Margin (2019-2025)
Table 69. Beijing Cengol Semiconductor Business Overview
Table 70. Beijing Cengol Semiconductor Recent Developments
Table 71. Resonac Wide Bandgap (WBG) Semiconductor Material Basic Information
Table 72. Resonac Wide Bandgap (WBG) Semiconductor Material Product Overview
Table 73. Resonac Wide Bandgap (WBG) Semiconductor Material Sales (K Units), Revenue (M USD), Price (USD/Unit) and Gross Margin (2019-2025)
Table 74. Resonac Business Overview
Table 75. Resonac Recent Developments
Table 76. Hebei Synlight Crystal Wide Bandgap (WBG) Semiconductor Material Basic Information
Table 77. Hebei Synlight Crystal Wide Bandgap (WBG) Semiconductor Material Product Overview
Table 78. Hebei Synlight Crystal Wide Bandgap (WBG) Semiconductor Material Sales (K Units), Revenue (M USD), Price (USD/Unit) and Gross Margin (2019-2025)
Table 79. Hebei Synlight Crystal Business Overview
Table 80. Hebei Synlight Crystal Recent Developments
Table 81. Norstel Wide Bandgap (WBG) Semiconductor Material Basic Information
Table 82. Norstel Wide Bandgap (WBG) Semiconductor Material Product Overview
Table 83. Norstel Wide Bandgap (WBG) Semiconductor Material Sales (K Units), Revenue (M USD), Price (USD/Unit) and Gross Margin (2019-2025)
Table 84. Norstel Business Overview
Table 85. Norstel Recent Developments
Table 86. ROHM Group (SiCrystal) Wide Bandgap (WBG) Semiconductor Material Basic Information
Table 87. ROHM Group (SiCrystal) Wide Bandgap (WBG) Semiconductor Material Product Overview
Table 88. ROHM Group (SiCrystal) Wide Bandgap (WBG) Semiconductor Material Sales (K Units), Revenue (M USD), Price (USD/Unit) and Gross Margin (2019-2025)
Table 89. ROHM Group (SiCrystal) Business Overview
Table 90. ROHM Group (SiCrystal) Recent Developments
Table 91. SK Siltron Wide Bandgap (WBG) Semiconductor Material Basic Information
Table 92. SK Siltron Wide Bandgap (WBG) Semiconductor Material Product Overview
Table 93. SK Siltron Wide Bandgap (WBG) Semiconductor Material Sales (K Units), Revenue (M USD), Price (USD/Unit) and Gross Margin (2019-2025)
Table 94. SK Siltron Business Overview
Table 95. SK Siltron Recent Developments
Table 96. San’an Optoelectronics Wide Bandgap (WBG) Semiconductor Material Basic Information
Table 97. San’an Optoelectronics Wide Bandgap (WBG) Semiconductor Material Product Overview
Table 98. San’an Optoelectronics Wide Bandgap (WBG) Semiconductor Material Sales (K Units), Revenue (M USD), Price (USD/Unit) and Gross Margin (2019-2025)
Table 99. San’an Optoelectronics Business Overview
Table 100. San’an Optoelectronics Recent Developments
Table 101. CETC Wide Bandgap (WBG) Semiconductor Material Basic Information
Table 102. CETC Wide Bandgap (WBG) Semiconductor Material Product Overview
Table 103. CETC Wide Bandgap (WBG) Semiconductor Material Sales (K Units), Revenue (M USD), Price (USD/Unit) and Gross Margin (2019-2025)
Table 104. CETC Business Overview
Table 105. CETC Recent Developments
Table 106. Mitsubishi Chemical Wide Bandgap (WBG) Semiconductor Material Basic Information
Table 107. Mitsubishi Chemical Wide Bandgap (WBG) Semiconductor Material Product Overview
Table 108. Mitsubishi Chemical Wide Bandgap (WBG) Semiconductor Material Sales (K Units), Revenue (M USD), Price (USD/Unit) and Gross Margin (2019-2025)
Table 109. Mitsubishi Chemical Business Overview
Table 110. Mitsubishi Chemical Recent Developments
Table 111. SUMITOMO ELECTRIC Wide Bandgap (WBG) Semiconductor Material Basic Information
Table 112. SUMITOMO ELECTRIC Wide Bandgap (WBG) Semiconductor Material Product Overview
Table 113. SUMITOMO ELECTRIC Wide Bandgap (WBG) Semiconductor Material Sales (K Units), Revenue (M USD), Price (USD/Unit) and Gross Margin (2019-2025)
Table 114. SUMITOMO ELECTRIC Business Overview
Table 115. SUMITOMO ELECTRIC Recent Developments
Table 116. Kyma Technologies Wide Bandgap (WBG) Semiconductor Material Basic Information
Table 117. Kyma Technologies Wide Bandgap (WBG) Semiconductor Material Product Overview
Table 118. Kyma Technologies Wide Bandgap (WBG) Semiconductor Material Sales (K Units), Revenue (M USD), Price (USD/Unit) and Gross Margin (2019-2025)
Table 119. Kyma Technologies Business Overview
Table 120. Kyma Technologies Recent Developments
Table 121. Element Six Wide Bandgap (WBG) Semiconductor Material Basic Information
Table 122. Element Six Wide Bandgap (WBG) Semiconductor Material Product Overview
Table 123. Element Six Wide Bandgap (WBG) Semiconductor Material Sales (K Units), Revenue (M USD), Price (USD/Unit) and Gross Margin (2019-2025)
Table 124. Element Six Business Overview
Table 125. Element Six Recent Developments
Table 126. Akash Systems Wide Bandgap (WBG) Semiconductor Material Basic Information
Table 127. Akash Systems Wide Bandgap (WBG) Semiconductor Material Product Overview
Table 128. Akash Systems Wide Bandgap (WBG) Semiconductor Material Sales (K Units), Revenue (M USD), Price (USD/Unit) and Gross Margin (2019-2025)
Table 129. Akash Systems Business Overview
Table 130. Akash Systems Recent Developments
Table 131. Qorvo Wide Bandgap (WBG) Semiconductor Material Basic Information
Table 132. Qorvo Wide Bandgap (WBG) Semiconductor Material Product Overview
Table 133. Qorvo Wide Bandgap (WBG) Semiconductor Material Sales (K Units), Revenue (M USD), Price (USD/Unit) and Gross Margin (2019-2025)
Table 134. Qorvo Business Overview
Table 135. Qorvo Recent Developments
Table 136. RFHIC Corporation Wide Bandgap (WBG) Semiconductor Material Basic Information
Table 137. RFHIC Corporation Wide Bandgap (WBG) Semiconductor Material Product Overview
Table 138. RFHIC Corporation Wide Bandgap (WBG) Semiconductor Material Sales (K Units), Revenue (M USD), Price (USD/Unit) and Gross Margin (2019-2025)
Table 139. RFHIC Corporation Business Overview
Table 140. RFHIC Corporation Recent Developments
Table 141. Maruwa Wide Bandgap (WBG) Semiconductor Material Basic Information
Table 142. Maruwa Wide Bandgap (WBG) Semiconductor Material Product Overview
Table 143. Maruwa Wide Bandgap (WBG) Semiconductor Material Sales (K Units), Revenue (M USD), Price (USD/Unit) and Gross Margin (2019-2025)
Table 144. Maruwa Business Overview
Table 145. Maruwa Recent Developments
Table 146. Toshiba Materials Wide Bandgap (WBG) Semiconductor Material Basic Information
Table 147. Toshiba Materials Wide Bandgap (WBG) Semiconductor Material Product Overview
Table 148. Toshiba Materials Wide Bandgap (WBG) Semiconductor Material Sales (K Units), Revenue (M USD), Price (USD/Unit) and Gross Margin (2019-2025)
Table 149. Toshiba Materials Business Overview
Table 150. Toshiba Materials Recent Developments
Table 151. CeramTec Wide Bandgap (WBG) Semiconductor Material Basic Information
Table 152. CeramTec Wide Bandgap (WBG) Semiconductor Material Product Overview
Table 153. CeramTec Wide Bandgap (WBG) Semiconductor Material Sales (K Units), Revenue (M USD), Price (USD/Unit) and Gross Margin (2019-2025)
Table 154. CeramTec Business Overview
Table 155. CeramTec Recent Developments
Table 156. Denka Wide Bandgap (WBG) Semiconductor Material Basic Information
Table 157. Denka Wide Bandgap (WBG) Semiconductor Material Product Overview
Table 158. Denka Wide Bandgap (WBG) Semiconductor Material Sales (K Units), Revenue (M USD), Price (USD/Unit) and Gross Margin (2019-2025)
Table 159. Denka Business Overview
Table 160. Denka Recent Developments
Table 161. TD Power Materials Wide Bandgap (WBG) Semiconductor Material Basic Information
Table 162. TD Power Materials Wide Bandgap (WBG) Semiconductor Material Product Overview
Table 163. TD Power Materials Wide Bandgap (WBG) Semiconductor Material Sales (K Units), Revenue (M USD), Price (USD/Unit) and Gross Margin (2019-2025)
Table 164. TD Power Materials Business Overview
Table 165. TD Power Materials Recent Developments
Table 166. Kyocera Wide Bandgap (WBG) Semiconductor Material Basic Information
Table 167. Kyocera Wide Bandgap (WBG) Semiconductor Material Product Overview
Table 168. Kyocera Wide Bandgap (WBG) Semiconductor Material Sales (K Units), Revenue (M USD), Price (USD/Unit) and Gross Margin (2019-2025)
Table 169. Kyocera Business Overview
Table 170. Kyocera Recent Developments
Table 171. CoorsTek Wide Bandgap (WBG) Semiconductor Material Basic Information
Table 172. CoorsTek Wide Bandgap (WBG) Semiconductor Material Product Overview
Table 173. CoorsTek Wide Bandgap (WBG) Semiconductor Material Sales (K Units), Revenue (M USD), Price (USD/Unit) and Gross Margin (2019-2025)
Table 174. CoorsTek Business Overview
Table 175. CoorsTek Recent Developments
Table 176. LEATEC Fine Ceramics Wide Bandgap (WBG) Semiconductor Material Basic Information
Table 177. LEATEC Fine Ceramics Wide Bandgap (WBG) Semiconductor Material Product Overview
Table 178. LEATEC Fine Ceramics Wide Bandgap (WBG) Semiconductor Material Sales (K Units), Revenue (M USD), Price (USD/Unit) and Gross Margin (2019-2025)
Table 179. LEATEC Fine Ceramics Business Overview
Table 180. LEATEC Fine Ceramics Recent Developments
Table 181. Fujian Huaqing Electronic Material Technology Wide Bandgap (WBG) Semiconductor Material Basic Information
Table 182. Fujian Huaqing Electronic Material Technology Wide Bandgap (WBG) Semiconductor Material Product Overview
Table 183. Fujian Huaqing Electronic Material Technology Wide Bandgap (WBG) Semiconductor Material Sales (K Units), Revenue (M USD), Price (USD/Unit) and Gross Margin (2019-2025)
Table 184. Fujian Huaqing Electronic Material Technology Business Overview
Table 185. Fujian Huaqing Electronic Material Technology Recent Developments
Table 186. Wuxi Hygood New Technology Wide Bandgap (WBG) Semiconductor Material Basic Information
Table 187. Wuxi Hygood New Technology Wide Bandgap (WBG) Semiconductor Material Product Overview
Table 188. Wuxi Hygood New Technology Wide Bandgap (WBG) Semiconductor Material Sales (K Units), Revenue (M USD), Price (USD/Unit) and Gross Margin (2019-2025)
Table 189. Wuxi Hygood New Technology Business Overview
Table 190. Wuxi Hygood New Technology Recent Developments
Table 191. Zhuzhou Ascendus New Material Technology Wide Bandgap (WBG) Semiconductor Material Basic Information
Table 192. Zhuzhou Ascendus New Material Technology Wide Bandgap (WBG) Semiconductor Material Product Overview
Table 193. Zhuzhou Ascendus New Material Technology Wide Bandgap (WBG) Semiconductor Material Sales (K Units), Revenue (M USD), Price (USD/Unit) and Gross Margin (2019-2025)
Table 194. Zhuzhou Ascendus New Material Technology Business Overview
Table 195. Zhuzhou Ascendus New Material Technology Recent Developments
Table 196. Global Wide Bandgap (WBG) Semiconductor Material Sales Forecast by Region (2025-2030) & (K Units)
Table 197. Global Wide Bandgap (WBG) Semiconductor Material Market Size Forecast by Region (2025-2030) & (M USD)
Table 198. North America Wide Bandgap (WBG) Semiconductor Material Sales Forecast by Country (2025-2030) & (K Units)
Table 199. North America Wide Bandgap (WBG) Semiconductor Material Market Size Forecast by Country (2025-2030) & (M USD)
Table 200. Europe Wide Bandgap (WBG) Semiconductor Material Sales Forecast by Country (2025-2030) & (K Units)
Table 201. Europe Wide Bandgap (WBG) Semiconductor Material Market Size Forecast by Country (2025-2030) & (M USD)
Table 202. Asia Pacific Wide Bandgap (WBG) Semiconductor Material Sales Forecast by Region (2025-2030) & (K Units)
Table 203. Asia Pacific Wide Bandgap (WBG) Semiconductor Material Market Size Forecast by Region (2025-2030) & (M USD)
Table 204. South America Wide Bandgap (WBG) Semiconductor Material Sales Forecast by Country (2025-2030) & (K Units)
Table 205. South America Wide Bandgap (WBG) Semiconductor Material Market Size Forecast by Country (2025-2030) & (M USD)
Table 206. Middle East and Africa Wide Bandgap (WBG) Semiconductor Material Consumption Forecast by Country (2025-2030) & (Units)
Table 207. Middle East and Africa Wide Bandgap (WBG) Semiconductor Material Market Size Forecast by Country (2025-2030) & (M USD)
Table 208. Global Wide Bandgap (WBG) Semiconductor Material Sales Forecast by Type (2025-2030) & (K Units)
Table 209. Global Wide Bandgap (WBG) Semiconductor Material Market Size Forecast by Type (2025-2030) & (M USD)
Table 210. Global Wide Bandgap (WBG) Semiconductor Material Price Forecast by Type (2025-2030) & (USD/Unit)
Table 211. Global Wide Bandgap (WBG) Semiconductor Material Sales (K Units) Forecast by Application (2025-2030)
Table 212. Global Wide Bandgap (WBG) Semiconductor Material Market Size Forecast by Application (2025-2030) & (M USD)
List of Figures
Figure 1. Product Picture of Wide Bandgap (WBG) Semiconductor Material
Figure 2. Data Triangulation
Figure 3. Key Caveats
Figure 4. Global Wide Bandgap (WBG) Semiconductor Material Market Size (M USD), 2026-2034
Figure 5. Global Wide Bandgap (WBG) Semiconductor Material Market Size (M USD) (2026-2034)
Figure 6. Global Wide Bandgap (WBG) Semiconductor Material Sales (K Units) & (2026-2034)
Figure 7. Evaluation Matrix of Segment Market Development Potential (Type)
Figure 8. Evaluation Matrix of Segment Market Development Potential (Application)
Figure 9. Evaluation Matrix of Regional Market Development Potential
Figure 10. Wide Bandgap (WBG) Semiconductor Material Market Size by Country (M USD)
Figure 11. Wide Bandgap (WBG) Semiconductor Material Sales Share by Manufacturers in 2023
Figure 12. Global Wide Bandgap (WBG) Semiconductor Material Revenue Share by Manufacturers in 2023
Figure 13. Wide Bandgap (WBG) Semiconductor Material Market Share by Company Type (Tier 1, Tier 2 and Tier 3): 2023
Figure 14. Global Market Wide Bandgap (WBG) Semiconductor Material Average Price (USD/Unit) of Key Manufacturers in 2023
Figure 15. The Global 5 and 10 Largest Players: Market Share by Wide Bandgap (WBG) Semiconductor Material Revenue in 2023
Figure 16. Evaluation Matrix of Segment Market Development Potential (Type)
Figure 17. Global Wide Bandgap (WBG) Semiconductor Material Market Share by Type
Figure 18. Sales Market Share of Wide Bandgap (WBG) Semiconductor Material by Type (2019-2025)
Figure 19. Sales Market Share of Wide Bandgap (WBG) Semiconductor Material by Type in 2023
Figure 20. Market Size Share of Wide Bandgap (WBG) Semiconductor Material by Type (2019-2025)
Figure 21. Market Size Market Share of Wide Bandgap (WBG) Semiconductor Material by Type in 2023
Figure 22. Evaluation Matrix of Segment Market Development Potential (Application)
Figure 23. Global Wide Bandgap (WBG) Semiconductor Material Market Share by Application
Figure 24. Global Wide Bandgap (WBG) Semiconductor Material Sales Market Share by Application (2019-2025)
Figure 25. Global Wide Bandgap (WBG) Semiconductor Material Sales Market Share by Application in 2023
Figure 26. Global Wide Bandgap (WBG) Semiconductor Material Market Share by Application (2019-2025)
Figure 27. Global Wide Bandgap (WBG) Semiconductor Material Market Share by Application in 2023
Figure 28. Global Wide Bandgap (WBG) Semiconductor Material Sales Growth Rate by Application (2019-2025)
Figure 29. Global Wide Bandgap (WBG) Semiconductor Material Sales Market Share by Region (2019-2025)
Figure 30. North America Wide Bandgap (WBG) Semiconductor Material Sales and Growth Rate (2019-2025) & (K Units)
Figure 31. North America Wide Bandgap (WBG) Semiconductor Material Sales Market Share by Country in 2023
Figure 32. U.S. Wide Bandgap (WBG) Semiconductor Material Sales and Growth Rate (2019-2025) & (K Units)
Figure 33. Canada Wide Bandgap (WBG) Semiconductor Material Sales (K Units) and Growth Rate (2019-2025)
Figure 34. Mexico Wide Bandgap (WBG) Semiconductor Material Sales (Units) and Growth Rate (2019-2025)
Figure 35. Europe Wide Bandgap (WBG) Semiconductor Material Sales and Growth Rate (2019-2025) & (K Units)
Figure 36. Europe Wide Bandgap (WBG) Semiconductor Material Sales Market Share by Country in 2023
Figure 37. Germany Wide Bandgap (WBG) Semiconductor Material Sales and Growth Rate (2019-2025) & (K Units)
Figure 38. France Wide Bandgap (WBG) Semiconductor Material Sales and Growth Rate (2019-2025) & (K Units)
Figure 39. U.K. Wide Bandgap (WBG) Semiconductor Material Sales and Growth Rate (2019-2025) & (K Units)
Figure 40. Italy Wide Bandgap (WBG) Semiconductor Material Sales and Growth Rate (2019-2025) & (K Units)
Figure 41. Russia Wide Bandgap (WBG) Semiconductor Material Sales and Growth Rate (2019-2025) & (K Units)
Figure 42. Asia Pacific Wide Bandgap (WBG) Semiconductor Material Sales and Growth Rate (K Units)
Figure 43. Asia Pacific Wide Bandgap (WBG) Semiconductor Material Sales Market Share by Region in 2023
Figure 44. China Wide Bandgap (WBG) Semiconductor Material Sales and Growth Rate (2019-2025) & (K Units)
Figure 45. Japan Wide Bandgap (WBG) Semiconductor Material Sales and Growth Rate (2019-2025) & (K Units)
Figure 46. South Korea Wide Bandgap (WBG) Semiconductor Material Sales and Growth Rate (2019-2025) & (K Units)
Figure 47. India Wide Bandgap (WBG) Semiconductor Material Sales and Growth Rate (2019-2025) & (K Units)
Figure 48. Southeast Asia Wide Bandgap (WBG) Semiconductor Material Sales and Growth Rate (2019-2025) & (K Units)
Figure 49. South America Wide Bandgap (WBG) Semiconductor Material Sales and Growth Rate (K Units)
Figure 50. South America Wide Bandgap (WBG) Semiconductor Material Sales Market Share by Country in 2023
Figure 51. Brazil Wide Bandgap (WBG) Semiconductor Material Sales and Growth Rate (2019-2025) & (K Units)
Figure 52. Argentina Wide Bandgap (WBG) Semiconductor Material Sales and Growth Rate (2019-2025) & (K Units)
Figure 53. Columbia Wide Bandgap (WBG) Semiconductor Material Sales and Growth Rate (2019-2025) & (K Units)
Figure 54. Middle East and Africa Wide Bandgap (WBG) Semiconductor Material Sales and Growth Rate (K Units)
Figure 55. Middle East and Africa Wide Bandgap (WBG) Semiconductor Material Sales Market Share by Region in 2023
Figure 56. Saudi Arabia Wide Bandgap (WBG) Semiconductor Material Sales and Growth Rate (2019-2025) & (K Units)
Figure 57. UAE Wide Bandgap (WBG) Semiconductor Material Sales and Growth Rate (2019-2025) & (K Units)
Figure 58. Egypt Wide Bandgap (WBG) Semiconductor Material Sales and Growth Rate (2019-2025) & (K Units)
Figure 59. Nigeria Wide Bandgap (WBG) Semiconductor Material Sales and Growth Rate (2019-2025) & (K Units)
Figure 60. South Africa Wide Bandgap (WBG) Semiconductor Material Sales and Growth Rate (2019-2025) & (K Units)
Figure 61. Global Wide Bandgap (WBG) Semiconductor Material Sales Forecast by Volume (2026-2034) & (K Units)
Figure 62. Global Wide Bandgap (WBG) Semiconductor Material Market Size Forecast by Value (2026-2034) & (M USD)
Figure 63. Global Wide Bandgap (WBG) Semiconductor Material Sales Market Share Forecast by Type (2025-2030)
Figure 64. Global Wide Bandgap (WBG) Semiconductor Material Market Share Forecast by Type (2025-2030)
Figure 65. Global Wide Bandgap (WBG) Semiconductor Material Sales Forecast by Application (2025-2030)
Figure 66. Global Wide Bandgap (WBG) Semiconductor Material Market Share Forecast by Application (2025-2030)