SEMICONDUCTOR INSIGHT
MARKET RESEARCH REPORT

Wide-Bandgap (WBG) Power Semiconductor Devices Market

2026 to 2034
MARKET INTELLIGENCE
ACROSS KEY REGIONS
2026 EDITION
POWER ELECTRONICS Semiconductor Market Research

Wide-Bandgap (WBG) Power Semiconductor Devices Market

Size, Share & Industry Analysis, By Type (Silicon Carbide (SiC) Power Devices, Gallium Nitride (GaN) Power Devices), By Application (Automotive, Telecom, Solar & Storage Systems, Other), By Voltage Class (Below 650 V, 650–900 V, 1200 V, Above 1200 V), By Product Format (Discrete Power Devices, Power Modules), and Regional Forecast, 2026–2036

◷
UPDATED 26 October 2026
▤
REPORT LENGTH Detailed Report
▣
REPORT CODE 35cf5d8b2b8b
▯
FORMATS PDF

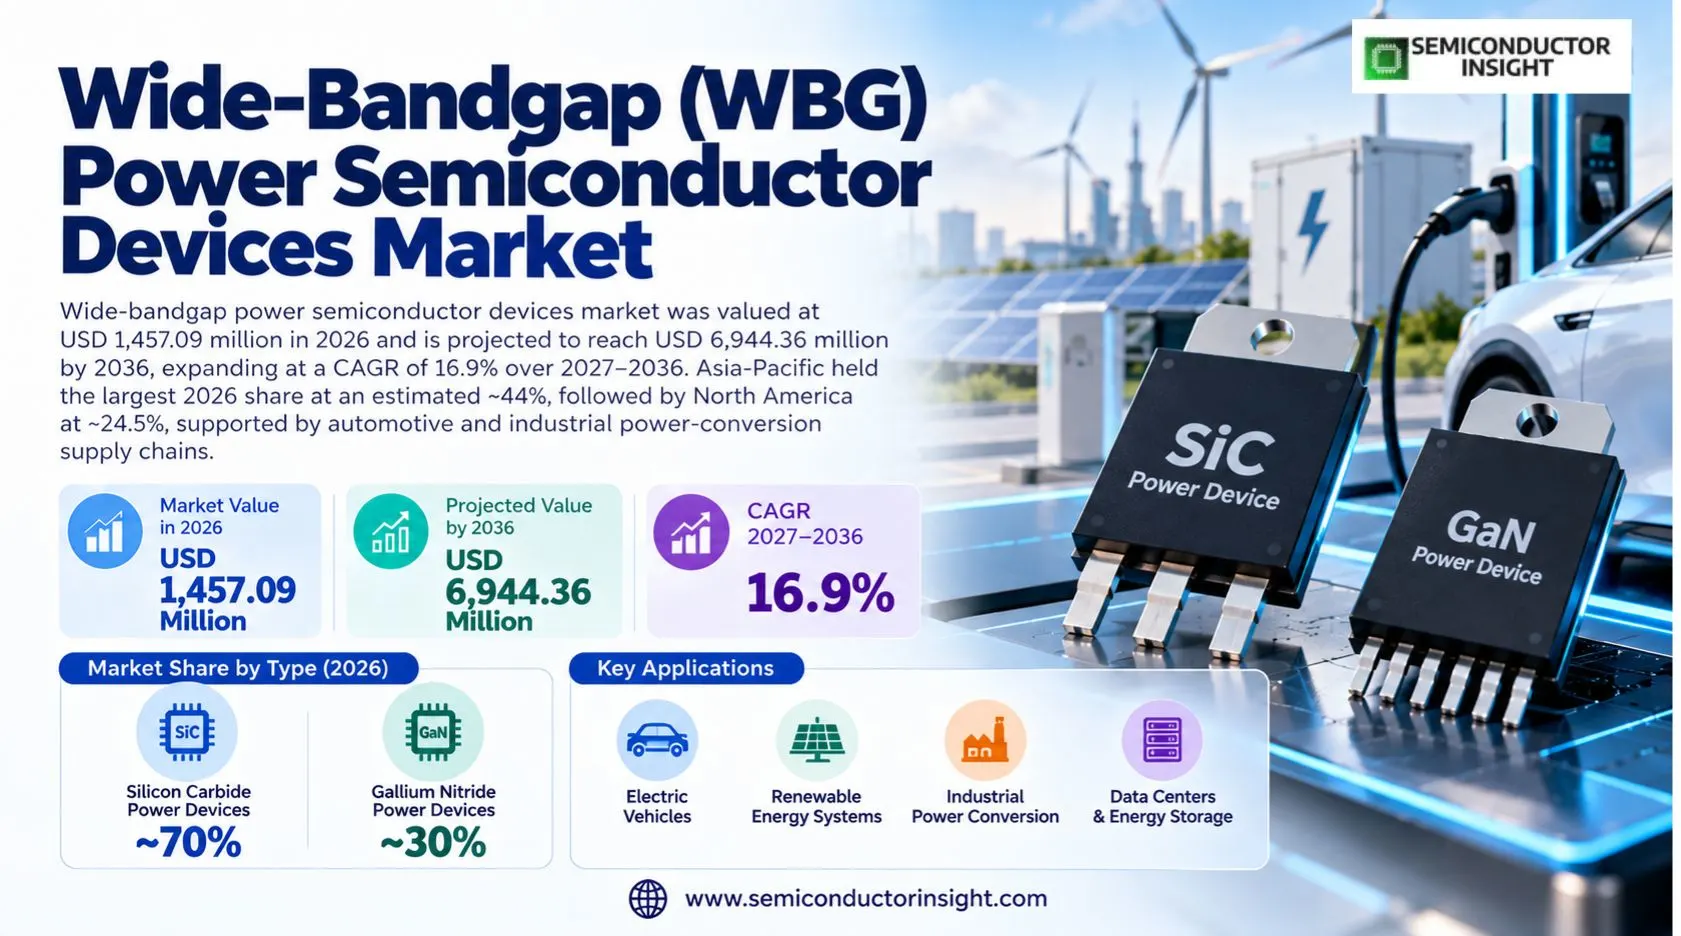
Wde-bandgap power semiconductor devices market was valued at USD 1,457.09 million in 2026 and is projected to reach USD 6,944.36 million by 2036, expanding at a CAGR of 16.9% over 2027–2036. Asia-Pacific held the largest 2026 share at an estimated ~44%, followed by North America at ~24.5%, supported by automotive and industrial power-conversion supply chains.

Get the sample PDF with study scope, segmentation and methodology details.

Key Statistics

2026 Market Size
USD 1,457.09 million
2036 Projected Size
USD 6,944.36 million
CAGR (2027–2036)
16.9%
Largest Market in 2026
Asia-Pacific (~44%)

Key Takeaways

  • Market outlook: Factory-gate SiC and GaN power-device sales begin at USD 1,457.09 million in 2026 and extend to USD 6,944.36 million in 2036 at 16.9%, supported by vehicle traction, renewable power conversion and charging infrastructure. This is a 2036 extension of earlier published monetary endpoints.
  • Silicon carbide: SiC is the largest device family at an estimated ~70% of 2026 revenue, reflecting 750 V and 1200 V traction and industrial designs; GaN is smaller at ~30% but expands more quickly where compact, high-frequency power stages matter.
  • Automotive conversion: Automotive leads applications with an estimated ~43% of 2026 revenue; solar and storage follow at ~27%, telecom accounts for ~14%, and the balance supports industrial, server-power and other conversion tasks.
  • Regional concentration: Asia-Pacific is the largest regional market at an estimated ~44% of 2026 device revenue; North America contributes ~24.5%, Europe ~21%, South America ~5.5%, and the Middle East and Africa ~5%.
  • Commercial barriers: SiC wafer defects, high-temperature reliability, package cycling, specialized gate drives and silicon-device competition shape profitability; the device-revenue boundary excludes substrate sales, standalone drivers and finished converters.

Wide-Bandgap (WBG) Power Semiconductor Devices Market Overview

Wde-bandgap power semiconductor devices market was valued at USD 1,457.09 million in 2026 and is projected to reach USD 6,944.36 million by 2036, expanding at a CAGR of 16.9% over 2027–2036. Asia-Pacific held the largest 2026 share at an estimated ~44%, followed by North America at ~24.5%, supported by automotive and industrial power-conversion supply chains.

Base year: 2026 · Estimated year: 2027 · Forecast period: 2027–2036 · Historical data: 2021–2025 · Values in USD million

Wide-bandgap power devices use silicon carbide or gallium nitride active semiconductor structures to reduce losses in converters that switch high voltages and currents. The relevant revenue comes from finished power transistors, rectifiers and integrated power modules, with one module counted once at its finished sale price rather than again as separate die. For factory-gate WBG device revenue, the relevant device ratings span 650 V, 750 V, 900 V, 1200 V and selected 2300 V industrial modules; qualification is linked to switching loss and fault tolerance. For factory-gate WBG device revenue, the 2026 commercial mix must be evaluated against 2026 demand shares of ~70% SiC and ~30% GaN; these are design and revenue-allocation indicators, not a replacement for a verified purchase order.
The main distinction between the two materials is the operating envelope rather than a simple performance ranking. SiC MOSFETs support traction and large stationary inverters at 750 V, 1200 V and above, while GaN power switches can improve compact AC-DC conversion at high switching frequencies. Silicon MOSFETs and IGBTs remain substitutes when lower initial cost outweighs efficiency. For SiC versus GaN technology, system buyers compare gate-drive complexity, transient thermal impedance, package parasitics and operating temperature before assigning a new power-conversion socket. For SiC versus GaN technology, the 2026 commercial mix must be evaluated against 650 V and 1200 V switching platforms; these are design and revenue-allocation indicators, not a replacement for a verified purchase order.

Infineon introduced 2300 V XHP 2 CoolSiC modules in May 2026 for DC links reaching 1500 V, illustrating how high-voltage systems can move beyond standard 1200 V classes. Its 750 V bidirectional switch launched in June 2026 shows another path: topology changes that reduce component count rather than simply increasing voltage. For power-module product development, the purchasing decision depends on electrical reliability under repeated load cycles, not simply on a laboratory efficiency figure or the nominal semiconductor bandgap. For power-module product development, the 2026 commercial mix must be evaluated against 2300 V, 1500 V and 750 V device classes; these are design and revenue-allocation indicators, not a replacement for a verified purchase order.

Automotive adoption depends on multi-year qualification and platform commitments. Onsemi and Geely described deeper EliteSiC integration in April 2026 across high-voltage vehicle platforms, while ST specified fourth-generation SiC MOSFET technology for traction inverters. These are product and design signals, not audited shares of global merchant power-device revenue. For automotive WBG design wins, power-module adoption adds thermal interfaces and interconnection quality to the procurement equation, while discrete-device sourcing puts greater emphasis on board-level design. For automotive WBG design wins, the 2026 commercial mix must be evaluated against 2026 automotive application share ~43%; these are design and revenue-allocation indicators, not a replacement for a verified purchase order.

The revenue projection is mathematically extended from a 2023 base of 912.10 million dollars and a 2030 endpoint of 2721.10 million dollars. On the same mathematical trajectory, the market stands at USD 1,457.09 million in 2026 and reaches USD 6,944.36 million in 2036 at 16.9% compound annual growth; later silicon-device substitution, wafer yields, pricing and customer program timing could shift realized sales materially. For long-range WBG revenue outlook, long-lived traction and grid designs reward traceable wafer processing, controlled defect density and stable supply over multiple qualification and production cycles. For long-range WBG revenue outlook, the 2026 commercial mix must be evaluated against 2023–2030 source window and 2027–2036 forecast period; these are design and revenue-allocation indicators, not a replacement for a verified purchase order.

Segment Analysis: By Type

By type, silicon carbide power devices are the largest 2026 segment with an estimated ~70% of revenue; gallium nitride power devices represent ~30%. SiC demand is supported by high-voltage traction and storage, while GaN penetration rises in frequency-sensitive power stages. Each technology requires different qualification evidence and is not interchangeable across every converter topology. For type segmentation, the conversion architecture determines whether lower switching loss offsets the price premium of a wide-bandgap transistor relative to an established silicon alternative. For type segmentation, the 2026 commercial mix must be evaluated against SiC ~70%, GaN ~30%, 1200 V and 650 V; these are design and revenue-allocation indicators, not a replacement for a verified purchase order.

Type Function Market position
Silicon Carbide (SiC) Power Devices Silicon Carbide (SiC) Power Devices convert electrical energy in High-voltage motor inverters, megawatt charging, storage and solid-state circuit protection. Their use depends on 750 V and 1200 V traction, 2300 V grid modules, where switching speed, gate-drive margins and power cycling determine viable voltage and current ranges. SiC requires low defect-density wafers and durable die attach; ST, Infineon and onsemi demonstrate different packaging and customer qualification routes. For Silicon Carbide (SiC) Power Devices, at higher switching frequencies, passive components can shrink, but electromagnetic interference, insulation coordination and gate-loop design become more demanding. For Silicon Carbide (SiC) Power Devices, the 2026 commercial mix must be evaluated against 2026 share ~70% and modeled CAGR ~16.0%; these are design and revenue-allocation indicators, not a replacement for a verified purchase order. Silicon Carbide (SiC) Power Devices hold an estimated ~70% of 2026 factory-gate revenue and carry a modeled ~16.0% segment CAGR. The commercial opportunity rests on High-voltage motor inverters, megawatt charging, storage and solid-state circuit protection; the technical barrier is 750 V and 1200 V traction, 2300 V grid modules. Qualification and cost-down priorities differ across customer platforms. SiC requires low defect-density wafers and durable die attach; ST, Infineon and onsemi demonstrate different packaging and customer qualification routes in silicon carbide (sic) power devices and module thermal-cycle qualification. For Silicon Carbide (SiC) Power Devices, supply agreements increasingly involve electrical characterization, application reference boards and reliability evidence rather than an interchangeable catalog part number. For Silicon Carbide (SiC) Power Devices, the 2026 commercial mix must be evaluated against 2026 share ~70%, 2027–2036 ~16.0% CAGR; these are design and revenue-allocation indicators, not a replacement for a verified purchase order.
Gallium Nitride (GaN) Power Devices Gallium Nitride (GaN) Power Devices convert electrical energy in Telecom rectifiers, high-density server power and industrial adapters. Their use depends on 400 V and 650 V compact converter architectures, where switching speed, gate-drive margins and power cycling determine viable voltage and current ranges. GaN switching enables smaller magnetic components, but driver layout and dynamic on-resistance affect field reliability; Renesas integrated Transphorm in 2024. For Gallium Nitride (GaN) Power Devices, the transition from 400 V vehicles to 800 V and 900 V platforms increases interest in high-voltage SiC switches and associated charging infrastructure. For Gallium Nitride (GaN) Power Devices, the 2026 commercial mix must be evaluated against 2026 share ~30% and modeled CAGR ~18.8%; these are design and revenue-allocation indicators, not a replacement for a verified purchase order. Gallium Nitride (GaN) Power Devices hold an estimated ~30% of 2026 factory-gate revenue and carry a modeled ~18.8% segment CAGR. The commercial opportunity rests on Telecom rectifiers, high-density server power and industrial adapters; the technical barrier is 400 V and 650 V compact converter architectures. Qualification and cost-down priorities differ across customer platforms. GaN switching enables smaller magnetic components, but driver layout and dynamic on-resistance affect field reliability; Renesas integrated Transphorm in 2024 in gallium nitride (gan) power devices and SiC wafer yield management. For Gallium Nitride (GaN) Power Devices, gaN devices compete particularly where switching frequency and compact magnetics matter; SiC maintains an advantage in high-power and high-voltage traction sockets. For Gallium Nitride (GaN) Power Devices, the 2026 commercial mix must be evaluated against 2026 share ~30%, 2027–2036 ~18.8% CAGR; these are design and revenue-allocation indicators, not a replacement for a verified purchase order.

SiC traction and high-voltage power stages

Silicon carbide adoption accelerates when the reduction in inverter switching loss translates into usable battery range, lower cooling demand or smaller passive components. The 1200 V class remains important for electric traction, while 2300 V products address selected high-voltage stationary systems. Automotive buyers still require thermal-cycling and short-circuit qualification. For SiC traction devices, the relevant device ratings span 650 V, 750 V, 900 V, 1200 V and selected 2300 V industrial modules; qualification is linked to switching loss and fault tolerance. For SiC traction devices, the 2026 commercial mix must be evaluated against 750 V, 1200 V and 2300 V ratings; these are design and revenue-allocation indicators, not a replacement for a verified purchase order.

High-voltage modules have different economics from discrete transistors because module packaging integrates several chips and thermal interfaces into one qualified component. In storage and charging systems, procurement therefore measures converter-level efficiency and repair cost as well as nominal device price. The market value counts the finished module once. For SiC module commercialization, system buyers compare gate-drive complexity, transient thermal impedance, package parasitics and operating temperature before assigning a new power-conversion socket. For SiC module commercialization, the 2026 commercial mix must be evaluated against 2025 EasyPACK C and 2026 XHP 2 introductions; these are design and revenue-allocation indicators, not a replacement for a verified purchase order.

GaN power conversion and packaging

Gallium nitride can raise switching frequency in compact AC-DC and DC-DC stages, especially when magnetic size constrains server and telecom power supplies. Infineon described a 12 kW server supply reference design using silicon, SiC and GaN in September 2025, demonstrating mixed-material architectures rather than complete silicon displacement. For GaN power stages, the purchasing decision depends on electrical reliability under repeated load cycles, not simply on a laboratory efficiency figure or the nominal semiconductor bandgap. For GaN power stages, the 2026 commercial mix must be evaluated against 2025 12 kW server reference design; these are design and revenue-allocation indicators, not a replacement for a verified purchase order.

The GaN supply chain changed after Renesas completed its Transphorm acquisition in June 2024, while Infineon had acquired GaN Systems in 2023. These transactions concentrate technology portfolios and customer support; historical standalone company rosters should not be treated as independent current market-share owners. For GaN competitive structure, power-module adoption adds thermal interfaces and interconnection quality to the procurement equation, while discrete-device sourcing puts greater emphasis on board-level design. For GaN competitive structure, the 2026 commercial mix must be evaluated against 2023 and 2024 acquisition milestones; these are design and revenue-allocation indicators, not a replacement for a verified purchase order.

Segment Analysis: By Application

Automotive applications hold an estimated ~43% of 2026 power-device revenue, ahead of solar and storage systems at ~27%, other conversion uses at ~16% and telecom at ~14%. These categories measure the converter using the device rather than the industry reporting its own downstream equipment sales. For application revenue allocation, long-lived traction and grid designs reward traceable wafer processing, controlled defect density and stable supply over multiple qualification and production cycles. For application revenue allocation, the 2026 commercial mix must be evaluated against 2026 modeled 43/27/16/14 percent distribution; these are design and revenue-allocation indicators, not a replacement for a verified purchase order.

Application Demand characteristics
Automotive Automotive account for an estimated ~43% of 2026 revenue and a modeled ~17.4% growth path through 2036. Power semiconductors are installed in traction inverter and onboard charging. EV traction programs require AEC qualification, power cycling, high-temperature junction characterization and supply agreements across vehicle generations. Supplier selection involves loss maps, field failure margins and thermal design, while system-level equipment prices are excluded from the device value. For Automotive, the conversion architecture determines whether lower switching loss offsets the price premium of a wide-bandgap transistor relative to an established silicon alternative. For Automotive, the 2026 commercial mix must be evaluated against ~43% base-year share and ~17.4% CAGR; these are design and revenue-allocation indicators, not a replacement for a verified purchase order.
Telecom Telecom account for an estimated ~14% of 2026 revenue and a modeled ~12.7% growth path through 2036. Power semiconductors are installed in rectifiers and base-station power. Telecom energy systems reward compact high-frequency conversion, low maintenance and high uptime, although RF-only GaN amplifiers fall outside this power-device market. Supplier selection involves loss maps, field failure margins and thermal design, while system-level equipment prices are excluded from the device value in telecom and GaN switching design. For Telecom, at higher switching frequencies, passive components can shrink, but electromagnetic interference, insulation coordination and gate-loop design become more demanding. For Telecom, the 2026 commercial mix must be evaluated against ~14% base-year share and ~12.7% CAGR; these are design and revenue-allocation indicators, not a replacement for a verified purchase order.
Solar & Storage Systems Solar & Storage Systems account for an estimated ~27% of 2026 revenue and a modeled ~19.1% growth path through 2036. Power semiconductors are installed in PV inverters and bidirectional battery conversion. Large stationary converters favor SiC modules where reduced cooling and switching loss offset higher acquisition costs. Supplier selection involves loss maps, field failure margins and thermal design, while system-level equipment prices are excluded from the device value in solar & storage systems and grid and storage power conversion. For Solar & Storage Systems, supply agreements increasingly involve electrical characterization, application reference boards and reliability evidence rather than an interchangeable catalog part number. For Solar & Storage Systems, the 2026 commercial mix must be evaluated against ~27% base-year share and ~19.1% CAGR; these are design and revenue-allocation indicators, not a replacement for a verified purchase order.
Other Other account for an estimated ~16% of 2026 revenue and a modeled ~14.4% growth path through 2036. Power semiconductors are installed in industrial drives and server power. Other applications include solid-state breakers, UPS, data-center supplies and factory automation, with varying qualification schedules. Supplier selection involves loss maps, field failure margins and thermal design, while system-level equipment prices are excluded from the device value in other and automotive converter sourcing. For Other, the transition from 400 V vehicles to 800 V and 900 V platforms increases interest in high-voltage SiC switches and associated charging infrastructure. For Other, the 2026 commercial mix must be evaluated against ~16% base-year share and ~14.4% CAGR; these are design and revenue-allocation indicators, not a replacement for a verified purchase order.

The application mix will not move in proportion to equipment unit shipments alone. A 900 V traction system may contain higher-value SiC modules than a 400 V platform, while GaN power stages can reduce passive components in a compact rectifier. Device counts, average selling prices and module integration all influence the value assigned to each end use. For application pricing, gaN devices compete particularly where switching frequency and compact magnetics matter; SiC maintains an advantage in high-power and high-voltage traction sockets. For application pricing, the 2026 commercial mix must be evaluated against 400 V versus 900 V architecture; these are design and revenue-allocation indicators, not a replacement for a verified purchase order.

Renewable energy demand spans residential string inverters, utility converters and battery energy storage systems, but their semiconductor content differs sharply. A 1500 V DC-link application can justify higher-voltage SiC modules, whereas smaller residential equipment may remain on silicon devices for cost reasons. That difference makes installed megawatts an imperfect proxy for merchant WBG revenue. For solar and storage conversion, the relevant device ratings span 650 V, 750 V, 900 V, 1200 V and selected 2300 V industrial modules; qualification is linked to switching loss and fault tolerance. For solar and storage conversion, the 2026 commercial mix must be evaluated against 1500 V DC-link design; these are design and revenue-allocation indicators, not a replacement for a verified purchase order.

The telecom category is restricted to power conversion and rectification. Gallium nitride radio-frequency amplifiers transmit communication signals rather than switch energy in the converter, so they are not counted in this power-device boundary. This separation prevents double counting between power semiconductor and RF component markets when analyzing telecom capital spending. For telecom power supply, system buyers compare gate-drive complexity, transient thermal impedance, package parasitics and operating temperature before assigning a new power-conversion socket. For telecom power supply, the 2026 commercial mix must be evaluated against 650 V and 400 V converter classes; these are design and revenue-allocation indicators, not a replacement for a verified purchase order.

Regional Analysis

Asia-Pacific leads the 2026 WBG power-device market at an estimated ~44% of revenue, with North America ~24.5%, Europe ~21%, South America ~5.5% and Middle East and Africa ~5%. The region ranking reflects electronics manufacturing concentration, converter engineering and EV adoption rather than an audited national sales census. For regional allocation, the purchasing decision depends on electrical reliability under repeated load cycles, not simply on a laboratory efficiency figure or the nominal semiconductor bandgap. For regional allocation, the 2026 commercial mix must be evaluated against 2026 region shares sum to 100%; these are design and revenue-allocation indicators, not a replacement for a verified purchase order.

How does the regional market structure affect SiC and GaN device adoption?

Regional competition depends on where power-device fabrication, automotive qualification and downstream converter assembly intersect. Asia-Pacific has the broadest production ecosystem, Europe has demanding traction and industrial applications, and North America emphasizes product reliability and resilient sourcing. Smaller regions generally buy WBG devices inside imported equipment rather than through local merchant die fabrication. For global WBG regional strategy, power-module adoption adds thermal interfaces and interconnection quality to the procurement equation, while discrete-device sourcing puts greater emphasis on board-level design. For global WBG regional strategy, the 2026 commercial mix must be evaluated against 2026 ~44% Asia-Pacific and ~21% Europe; these are design and revenue-allocation indicators, not a replacement for a verified purchase order.

Growth varies across regional application portfolios. Asia-Pacific is modeled at ~18.5% CAGR because of electronics and traction demand, while North America follows at ~15.0% and Europe at ~16.2%. South America grows from a smaller ~5.5% base, and the Middle East and Africa begin near ~5%, reflecting different conversion-equipment deployment schedules. For regional growth profiles, long-lived traction and grid designs reward traceable wafer processing, controlled defect density and stable supply over multiple qualification and production cycles. For regional growth profiles, the 2026 commercial mix must be evaluated against 2027–2036 CAGR ranges ~11.6% to ~18.5%; these are design and revenue-allocation indicators, not a replacement for a verified purchase order.

Region Position Growth outlook Demand profile What decides supplier selection
Asia-Pacific Estimated ~44% of 2026 revenue Modeled ~18.5% CAGR manufacturing concentration and EV traction electronics; 650 V to 2300 V product fit varies Japan and China host power-device fabrication and packaging, while regional EV and storage platforms create local converter demand. Buyers require electrical validation, module support and traceable supply contracts.
North America Estimated ~24.5% of 2026 revenue Modeled ~15.0% CAGR vehicle-platform qualification and industrial supply security; 650 V to 2300 V product fit varies U.S. power-device developers and automotive customers evaluate regional supply resilience, while Mexico integrates downstream vehicle manufacturing. Buyers require electrical validation, module support and traceable supply contracts.
Europe Estimated ~21% of 2026 revenue Modeled ~16.2% CAGR automotive inverter engineering and renewable integration; 650 V to 2300 V product fit varies German vehicle suppliers, European power-device manufacturers and grid converter integrators emphasize reliability and life-cycle efficiency. Buyers require electrical validation, module support and traceable supply contracts.
South America Estimated ~5.5% of 2026 revenue Modeled ~17.7% CAGR solar investment and selective EV charging; 650 V to 2300 V product fit varies Brazilian solar and industrial converter programs provide demand, while local distributor support determines device adoption. Buyers require electrical validation, module support and traceable supply contracts.
Middle East & Africa Estimated ~5% of 2026 revenue Modeled ~11.6% CAGR utility solar and grid infrastructure; 650 V to 2300 V product fit varies Large solar projects and charging networks create prospective demand, although imported converter procurement controls supplier access. Buyers require electrical validation, module support and traceable supply contracts.

Asia-Pacific Estimated ~44% share

Why is Asia-Pacific important to wide-bandgap power devices?

Asia-Pacific accounts for an estimated ~44% of 2026 factory-gate WBG device revenue and follows a modeled ~18.5% CAGR. Its defining demand driver is manufacturing concentration and EV traction electronics. Japan and China host power-device fabrication and packaging, while regional EV and storage platforms create local converter demand in asia-pacific and telecom rectifier integration. Converter buyers consider whether 750 V, 1200 V or 2300 V technology fits local power-system architecture. For Asia-Pacific, the conversion architecture determines whether lower switching loss offsets the price premium of a wide-bandgap transistor relative to an established silicon alternative. For Asia-Pacific, the 2026 commercial mix must be evaluated against ~44% base-year share and ~18.5% growth; these are design and revenue-allocation indicators, not a replacement for a verified purchase order.

Market positionEstimated ~44% of 2026 sales
Growth outlookModeled ~18.5% CAGR
Demand profilemanufacturing concentration and EV traction electronics
Market access gateProduct qualification and sourcing
Country Position in region What drives demand
China Major demand hub China contributes to Asia-Pacific through manufacturing concentration and EV traction electronics. Procurement combines manufacturer product qualification with converter maker production and channel distribution. Japan and China host power-device fabrication and packaging, while regional EV and storage platforms create local converter demand in asia-pacific and industrial protection systems. A shift toward 750 V or 1200 V switching can change semiconductor value per installation, even when overall equipment counts are unchanged. For China device procurement, at higher switching frequencies, passive components can shrink, but electromagnetic interference, insulation coordination and gate-loop design become more demanding. For China device procurement, the 2026 commercial mix must be evaluated against 2026 regional share ~44%; these are design and revenue-allocation indicators, not a replacement for a verified purchase order.
Japan Growth contributor Japan is part of the Asia-Pacific power-conversion value chain, with manufacturing concentration and EV traction electronics shaping the device opportunity. Electrical specifications, after-sales support and the local mix of SiC modules versus GaN discretes influence purchasing. Japan and China host power-device fabrication and packaging, while regional EV and storage platforms create local converter demand in asia-pacific and high-frequency power supplies. For Japan converter design, supply agreements increasingly involve electrical characterization, application reference boards and reliability evidence rather than an interchangeable catalog part number. For Japan converter design, the 2026 commercial mix must be evaluated against 2027–2036 regional CAGR ~18.5%; these are design and revenue-allocation indicators, not a replacement for a verified purchase order.

Market instances

  • Asia-Pacific power-conversion example: In Asia-Pacific, 2025–2026 product programs show how converter efficiency, 1200 V device qualification and module packaging can affect procurement. Japan and China host power-device fabrication and packaging, while regional EV and storage platforms create local converter demand in asia-pacific and discrete-device reliability. A project with a 1500 V DC link needs different silicon carbide blocking-voltage margins from a compact 650 V telecom rectifier. For Asia-Pacific market instance, the transition from 400 V vehicles to 800 V and 900 V platforms increases interest in high-voltage SiC switches and associated charging infrastructure. For Asia-Pacific market instance, the 2026 commercial mix must be evaluated against ~44% regional share and ~18.5% CAGR; these are design and revenue-allocation indicators, not a replacement for a verified purchase order.
In the full report: Asia-Pacific country-level demand and device mix span China, Japan, South Korea, India and Southeast Asia. The commercial outlook separates converter installations from merchant transistor and module shipments and tests the sensitivity to 750 V, 1200 V and higher-voltage equipment. Japan and China host power-device fabrication and packaging, while regional EV and storage platforms create local converter demand in asia-pacific and power module insulation. For Asia-Pacific detailed outlook, gaN devices compete particularly where switching frequency and compact magnetics matter; SiC maintains an advantage in high-power and high-voltage traction sockets. For Asia-Pacific detailed outlook, the 2026 commercial mix must be evaluated against 2026 share ~44% and CAGR ~18.5%; these are design and revenue-allocation indicators, not a replacement for a verified purchase order.

North America Estimated ~24.5% share

Why is North America important to wide-bandgap power devices?

North America accounts for an estimated ~24.5% of 2026 factory-gate WBG device revenue and follows a modeled ~15.0% CAGR. Its defining demand driver is vehicle-platform qualification and industrial supply security. U.S. power-device developers and automotive customers evaluate regional supply resilience, while Mexico integrates downstream vehicle manufacturing in north america and regional distribution networks. Converter buyers consider whether 750 V, 1200 V or 2300 V technology fits local power-system architecture in north america and charging-station installation. For North America, the relevant device ratings span 650 V, 750 V, 900 V, 1200 V and selected 2300 V industrial modules; qualification is linked to switching loss and fault tolerance. For North America, the 2026 commercial mix must be evaluated against ~24.5% base-year share and ~15.0% growth; these are design and revenue-allocation indicators, not a replacement for a verified purchase order.

Market positionEstimated ~24.5% of 2026 sales
Growth outlookModeled ~15.0% CAGR
Demand profilevehicle-platform qualification and industrial supply security
Market access gateProduct qualification and sourcing
Country Position in region What drives demand
United States Major demand hub United States contributes to North America through vehicle-platform qualification and industrial supply security. Procurement combines manufacturer product qualification with converter maker production and channel distribution in north america and supplier lifetime support. U.S. power-device developers and automotive customers evaluate regional supply resilience, while Mexico integrates downstream vehicle manufacturing in north america and inverter efficiency tradeoffs. A shift toward 750 V or 1200 V switching can change semiconductor value per installation, even when overall equipment counts are unchanged in north america and packaging parasitic control. For United States device procurement, system buyers compare gate-drive complexity, transient thermal impedance, package parasitics and operating temperature before assigning a new power-conversion socket. For United States device procurement, the 2026 commercial mix must be evaluated against 2026 regional share ~24.5%; these are design and revenue-allocation indicators, not a replacement for a verified purchase order.
Canada and Mexico Growth contributor Canada and Mexico is part of the North America power-conversion value chain, with vehicle-platform qualification and industrial supply security shaping the device opportunity. Electrical specifications, after-sales support and the local mix of SiC modules versus GaN discretes influence purchasing in north america and production program timing. U.S. power-device developers and automotive customers evaluate regional supply resilience, while Mexico integrates downstream vehicle manufacturing in north america and merchant component valuation. For Canada and Mexico converter design, the purchasing decision depends on electrical reliability under repeated load cycles, not simply on a laboratory efficiency figure or the nominal semiconductor bandgap. For Canada and Mexico converter design, the 2026 commercial mix must be evaluated against 2027–2036 regional CAGR ~15.0%; these are design and revenue-allocation indicators, not a replacement for a verified purchase order.

Market instances

  • North America power-conversion example: In North America, 2025–2026 product programs show how converter efficiency, 1200 V device qualification and module packaging can affect procurement. U.S. power-device developers and automotive customers evaluate regional supply resilience, while Mexico integrates downstream vehicle manufacturing in north america and 1500 V DC-link engineering. A project with a 1500 V DC link needs different silicon carbide blocking-voltage margins from a compact 650 V telecom rectifier in north america and 1200 V MOSFET switching. For North America market instance, power-module adoption adds thermal interfaces and interconnection quality to the procurement equation, while discrete-device sourcing puts greater emphasis on board-level design. For North America market instance, the 2026 commercial mix must be evaluated against ~24.5% regional share and ~15.0% CAGR; these are design and revenue-allocation indicators, not a replacement for a verified purchase order.
In the full report: North America country-level demand and device mix span United States, Canada and Mexico. The commercial outlook separates converter installations from merchant transistor and module shipments and tests the sensitivity to 750 V, 1200 V and higher-voltage equipment in north america and 750 V converter operation. U.S. power-device developers and automotive customers evaluate regional supply resilience, while Mexico integrates downstream vehicle manufacturing in north america and higher-voltage traction purchasing. For North America detailed outlook, long-lived traction and grid designs reward traceable wafer processing, controlled defect density and stable supply over multiple qualification and production cycles. For North America detailed outlook, the 2026 commercial mix must be evaluated against 2026 share ~24.5% and CAGR ~15.0%; these are design and revenue-allocation indicators, not a replacement for a verified purchase order.

Europe Estimated ~21% share

Why is Europe important to wide-bandgap power devices?

Europe accounts for an estimated ~21% of 2026 factory-gate WBG device revenue and follows a modeled ~16.2% CAGR. Its defining demand driver is automotive inverter engineering and renewable integration. German vehicle suppliers, European power-device manufacturers and grid converter integrators emphasize reliability and life-cycle efficiency in europe and module thermal-cycle qualification. Converter buyers consider whether 750 V, 1200 V or 2300 V technology fits local power-system architecture in europe and SiC wafer yield management. For Europe, the conversion architecture determines whether lower switching loss offsets the price premium of a wide-bandgap transistor relative to an established silicon alternative. For Europe, the 2026 commercial mix must be evaluated against ~21% base-year share and ~16.2% growth; these are design and revenue-allocation indicators, not a replacement for a verified purchase order.

Market positionEstimated ~21% of 2026 sales
Growth outlookModeled ~16.2% CAGR
Demand profileautomotive inverter engineering and renewable integration
Market access gateProduct qualification and sourcing
Country Position in region What drives demand
Germany Major demand hub Germany contributes to Europe through automotive inverter engineering and renewable integration. Procurement combines manufacturer product qualification with converter maker production and channel distribution in europe and GaN switching design. German vehicle suppliers, European power-device manufacturers and grid converter integrators emphasize reliability and life-cycle efficiency in europe and grid and storage power conversion. A shift toward 750 V or 1200 V switching can change semiconductor value per installation, even when overall equipment counts are unchanged in europe and automotive converter sourcing. For Germany device procurement, at higher switching frequencies, passive components can shrink, but electromagnetic interference, insulation coordination and gate-loop design become more demanding. For Germany device procurement, the 2026 commercial mix must be evaluated against 2026 regional share ~21%; these are design and revenue-allocation indicators, not a replacement for a verified purchase order.
France Growth contributor France is part of the Europe power-conversion value chain, with automotive inverter engineering and renewable integration shaping the device opportunity. Electrical specifications, after-sales support and the local mix of SiC modules versus GaN discretes influence purchasing in europe and telecom rectifier integration. German vehicle suppliers, European power-device manufacturers and grid converter integrators emphasize reliability and life-cycle efficiency in europe and industrial protection systems. For France converter design, supply agreements increasingly involve electrical characterization, application reference boards and reliability evidence rather than an interchangeable catalog part number. For France converter design, the 2026 commercial mix must be evaluated against 2027–2036 regional CAGR ~16.2%; these are design and revenue-allocation indicators, not a replacement for a verified purchase order.

Market instances

  • Europe power-conversion example: In Europe, 2025–2026 product programs show how converter efficiency, 1200 V device qualification and module packaging can affect procurement. German vehicle suppliers, European power-device manufacturers and grid converter integrators emphasize reliability and life-cycle efficiency in europe and high-frequency power supplies. A project with a 1500 V DC link needs different silicon carbide blocking-voltage margins from a compact 650 V telecom rectifier in europe and discrete-device reliability. For Europe market instance, the transition from 400 V vehicles to 800 V and 900 V platforms increases interest in high-voltage SiC switches and associated charging infrastructure. For Europe market instance, the 2026 commercial mix must be evaluated against ~21% regional share and ~16.2% CAGR; these are design and revenue-allocation indicators, not a replacement for a verified purchase order.
In the full report: Europe country-level demand and device mix span Germany, France, Italy, United Kingdom and Nordic countries. The commercial outlook separates converter installations from merchant transistor and module shipments and tests the sensitivity to 750 V, 1200 V and higher-voltage equipment in europe and power module insulation. German vehicle suppliers, European power-device manufacturers and grid converter integrators emphasize reliability and life-cycle efficiency in europe and regional distribution networks. For Europe detailed outlook, gaN devices compete particularly where switching frequency and compact magnetics matter; SiC maintains an advantage in high-power and high-voltage traction sockets. For Europe detailed outlook, the 2026 commercial mix must be evaluated against 2026 share ~21% and CAGR ~16.2%; these are design and revenue-allocation indicators, not a replacement for a verified purchase order.

South America Estimated ~5.5% share

Why is South America important to wide-bandgap power devices?

South America accounts for an estimated ~5.5% of 2026 factory-gate WBG device revenue and follows a modeled ~17.7% CAGR. Its defining demand driver is solar investment and selective EV charging. Brazilian solar and industrial converter programs provide demand, while local distributor support determines device adoption in south america and charging-station installation. Converter buyers consider whether 750 V, 1200 V or 2300 V technology fits local power-system architecture in south america and supplier lifetime support. For South America, the relevant device ratings span 650 V, 750 V, 900 V, 1200 V and selected 2300 V industrial modules; qualification is linked to switching loss and fault tolerance. For South America, the 2026 commercial mix must be evaluated against ~5.5% base-year share and ~17.7% growth; these are design and revenue-allocation indicators, not a replacement for a verified purchase order.

Market positionEstimated ~5.5% of 2026 sales
Growth outlookModeled ~17.7% CAGR
Demand profilesolar investment and selective EV charging
Market access gateProduct qualification and sourcing
Country Position in region What drives demand
Brazil Major demand hub Brazil contributes to South America through solar investment and selective EV charging. Procurement combines manufacturer product qualification with converter maker production and channel distribution in south america and inverter efficiency tradeoffs. Brazilian solar and industrial converter programs provide demand, while local distributor support determines device adoption in south america and packaging parasitic control. A shift toward 750 V or 1200 V switching can change semiconductor value per installation, even when overall equipment counts are unchanged in south america and production program timing. For Brazil device procurement, system buyers compare gate-drive complexity, transient thermal impedance, package parasitics and operating temperature before assigning a new power-conversion socket. For Brazil device procurement, the 2026 commercial mix must be evaluated against 2026 regional share ~5.5%; these are design and revenue-allocation indicators, not a replacement for a verified purchase order.
Argentina Growth contributor Argentina is part of the South America power-conversion value chain, with solar investment and selective EV charging shaping the device opportunity. Electrical specifications, after-sales support and the local mix of SiC modules versus GaN discretes influence purchasing in south america and merchant component valuation. Brazilian solar and industrial converter programs provide demand, while local distributor support determines device adoption in south america and 1500 V DC-link engineering. For Argentina converter design, the purchasing decision depends on electrical reliability under repeated load cycles, not simply on a laboratory efficiency figure or the nominal semiconductor bandgap. For Argentina converter design, the 2026 commercial mix must be evaluated against 2027–2036 regional CAGR ~17.7%; these are design and revenue-allocation indicators, not a replacement for a verified purchase order.

Market instances

  • South America power-conversion example: In South America, 2025–2026 product programs show how converter efficiency, 1200 V device qualification and module packaging can affect procurement. Brazilian solar and industrial converter programs provide demand, while local distributor support determines device adoption in south america and 1200 V MOSFET switching. A project with a 1500 V DC link needs different silicon carbide blocking-voltage margins from a compact 650 V telecom rectifier in south america and 750 V converter operation. For South America market instance, power-module adoption adds thermal interfaces and interconnection quality to the procurement equation, while discrete-device sourcing puts greater emphasis on board-level design. For South America market instance, the 2026 commercial mix must be evaluated against ~5.5% regional share and ~17.7% CAGR; these are design and revenue-allocation indicators, not a replacement for a verified purchase order.
In the full report: South America country-level demand and device mix span Brazil, Argentina, Chile and Colombia. The commercial outlook separates converter installations from merchant transistor and module shipments and tests the sensitivity to 750 V, 1200 V and higher-voltage equipment in south america and higher-voltage traction purchasing. Brazilian solar and industrial converter programs provide demand, while local distributor support determines device adoption in south america and module thermal-cycle qualification. For South America detailed outlook, long-lived traction and grid designs reward traceable wafer processing, controlled defect density and stable supply over multiple qualification and production cycles. For South America detailed outlook, the 2026 commercial mix must be evaluated against 2026 share ~5.5% and CAGR ~17.7%; these are design and revenue-allocation indicators, not a replacement for a verified purchase order.

Middle East & Africa Estimated ~5% share

Why is Middle East & Africa important to wide-bandgap power devices?

Middle East & Africa accounts for an estimated ~5% of 2026 factory-gate WBG device revenue and follows a modeled ~11.6% CAGR. Its defining demand driver is utility solar and grid infrastructure. Large solar projects and charging networks create prospective demand, although imported converter procurement controls supplier access in middle east & africa and SiC wafer yield management. Converter buyers consider whether 750 V, 1200 V or 2300 V technology fits local power-system architecture in middle east & africa and GaN switching design. For Middle East & Africa, the conversion architecture determines whether lower switching loss offsets the price premium of a wide-bandgap transistor relative to an established silicon alternative. For Middle East & Africa, the 2026 commercial mix must be evaluated against ~5% base-year share and ~11.6% growth; these are design and revenue-allocation indicators, not a replacement for a verified purchase order.

Market positionEstimated ~5% of 2026 sales
Growth outlookModeled ~11.6% CAGR
Demand profileutility solar and grid infrastructure
Market access gateProduct qualification and sourcing
Country Position in region What drives demand
Saudi Arabia Major demand hub Saudi Arabia contributes to Middle East & Africa through utility solar and grid infrastructure. Procurement combines manufacturer product qualification with converter maker production and channel distribution in middle east & africa and grid and storage power conversion. Large solar projects and charging networks create prospective demand, although imported converter procurement controls supplier access in middle east & africa and automotive converter sourcing. A shift toward 750 V or 1200 V switching can change semiconductor value per installation, even when overall equipment counts are unchanged in middle east & africa and telecom rectifier integration. For Saudi Arabia device procurement, at higher switching frequencies, passive components can shrink, but electromagnetic interference, insulation coordination and gate-loop design become more demanding. For Saudi Arabia device procurement, the 2026 commercial mix must be evaluated against 2026 regional share ~5%; these are design and revenue-allocation indicators, not a replacement for a verified purchase order.
UAE Growth contributor UAE is part of the Middle East & Africa power-conversion value chain, with utility solar and grid infrastructure shaping the device opportunity. Electrical specifications, after-sales support and the local mix of SiC modules versus GaN discretes influence purchasing in middle east & africa and industrial protection systems. Large solar projects and charging networks create prospective demand, although imported converter procurement controls supplier access in middle east & africa and high-frequency power supplies. For UAE converter design, supply agreements increasingly involve electrical characterization, application reference boards and reliability evidence rather than an interchangeable catalog part number. For UAE converter design, the 2026 commercial mix must be evaluated against 2027–2036 regional CAGR ~11.6%; these are design and revenue-allocation indicators, not a replacement for a verified purchase order.

Market instances

  • Middle East & Africa power-conversion example: In Middle East & Africa, 2025–2026 product programs show how converter efficiency, 1200 V device qualification and module packaging can affect procurement. Large solar projects and charging networks create prospective demand, although imported converter procurement controls supplier access in middle east & africa and discrete-device reliability. A project with a 1500 V DC link needs different silicon carbide blocking-voltage margins from a compact 650 V telecom rectifier in middle east & africa and power module insulation. For Middle East & Africa market instance, the transition from 400 V vehicles to 800 V and 900 V platforms increases interest in high-voltage SiC switches and associated charging infrastructure. For Middle East & Africa market instance, the 2026 commercial mix must be evaluated against ~5% regional share and ~11.6% CAGR; these are design and revenue-allocation indicators, not a replacement for a verified purchase order.
In the full report: Middle East & Africa country-level demand and device mix span Saudi Arabia, UAE, South Africa and Egypt. The commercial outlook separates converter installations from merchant transistor and module shipments and tests the sensitivity to 750 V, 1200 V and higher-voltage equipment in middle east & africa and regional distribution networks. Large solar projects and charging networks create prospective demand, although imported converter procurement controls supplier access in middle east & africa and charging-station installation. For Middle East & Africa detailed outlook, gaN devices compete particularly where switching frequency and compact magnetics matter; SiC maintains an advantage in high-power and high-voltage traction sockets. For Middle East & Africa detailed outlook, the 2026 commercial mix must be evaluated against 2026 share ~5% and CAGR ~11.6%; these are design and revenue-allocation indicators, not a replacement for a verified purchase order.

Competitive Landscape and Company Positioning

Competition is organized around automotive-qualified SiC manufacturing, industrial power-module packaging and high-frequency GaN switching. Infineon, STMicroelectronics, onsemi, ROHM and other suppliers compete on product breadth and application engineering; acquired GaN businesses now operate within larger portfolios. Company-wide semiconductor sales are not equal to revenue from this narrowly defined WBG power-device market. For WBG supplier competition, the relevant device ratings span 650 V, 750 V, 900 V, 1200 V and selected 2300 V industrial modules; qualification is linked to switching loss and fault tolerance. For WBG supplier competition, the 2026 commercial mix must be evaluated against 2024 Transphorm and 2023 GaN Systems acquisitions; these are design and revenue-allocation indicators, not a replacement for a verified purchase order.

Infineon sells SiC and GaN products across discrete and module families and announced new 750 V and 2300 V technologies in 2026. ST has qualified fourth-generation SiC technology for automotive traction, while onsemi described EliteSiC adoption within Geely vehicle architectures in April 2026. The competitive advantage is repeatable qualification and device-level reliability rather than a single efficiency claim. For Tier 1 SiC competition, system buyers compare gate-drive complexity, transient thermal impedance, package parasitics and operating temperature before assigning a new power-conversion socket. For Tier 1 SiC competition, the 2026 commercial mix must be evaluated against 2026 launches at 750 V and 2300 V; these are design and revenue-allocation indicators, not a replacement for a verified purchase order.

Nexperia introduced 1200 V QDPAK SiC devices in June 2026 with automotive and industrial variants, illustrating competition through packaging and thermal management. Smaller suppliers can win selected discrete sockets when they deliver pin compatibility and dependable lead times, although complex automotive programs favor established quality systems and field-support teams. For specialized discrete suppliers, the purchasing decision depends on electrical reliability under repeated load cycles, not simply on a laboratory efficiency figure or the nominal semiconductor bandgap. For specialized discrete suppliers, the 2026 commercial mix must be evaluated against 1200 V and 17–80 milliohm offerings; these are design and revenue-allocation indicators, not a replacement for a verified purchase order.

GaN industry consolidation changes how historical supplier lists should be interpreted. Infineon acquired GaN Systems in 2023, and Renesas completed the Transphorm acquisition on 20 June 2024. Both brands remain relevant to technology heritage, but counting them as independent corporate market-share owners alongside the acquirers would duplicate competition. For GaN acquisition integration, power-module adoption adds thermal interfaces and interconnection quality to the procurement equation, while discrete-device sourcing puts greater emphasis on board-level design. For GaN acquisition integration, the 2026 commercial mix must be evaluated against 2023–2024 transactions; these are design and revenue-allocation indicators, not a replacement for a verified purchase order.

Supplier roles differ along the value chain: Wolfspeed operates in SiC materials and devices, while some named electronics groups emphasize RF, controllers, substrates or converter integration. Only finished SiC and GaN power switching devices and modules are within the revenue boundary. A materials supplier or power-management IC vendor should not automatically receive a finished-device market share. For supplier-role due diligence, long-lived traction and grid designs reward traceable wafer processing, controlled defect density and stable supply over multiple qualification and production cycles. For supplier-role due diligence, the 2026 commercial mix must be evaluated against 2026 device revenue boundary; these are design and revenue-allocation indicators, not a replacement for a verified purchase order.

Tier structure

Tier Companies Basis of competition
Tier 1 Infineon Technologies; STMicroelectronics; onsemi; ROHM Semiconductor; Wolfspeed Large qualified SiC portfolios, application laboratories, packaging development and multi-year automotive or industrial design support define the top competitive tier. These manufacturers address 650 V, 750 V, 1200 V and higher-voltage needs, with product economics tied to yield, thermal reliability and device performance rather than overall group revenue. For Tier 1 manufacturers, the conversion architecture determines whether lower switching loss offsets the price premium of a wide-bandgap transistor relative to an established silicon alternative. For Tier 1 manufacturers, the 2026 commercial mix must be evaluated against 2026 high-voltage product qualifications; these are design and revenue-allocation indicators, not a replacement for a verified purchase order.
Tier 2 Nexperia; Microchip; Mitsubishi Electric / Vincotech; Littelfuse / IXYS; Renesas / Transphorm Specialist suppliers compete through selected power-device voltage classes, GaN switching expertise and modules for industrial converters. Nexperia QDPAK packaging and Renesas Transphorm integration show how differentiation can be based on thermal design or acquired GaN know-how. Customer programs still require extensive validation and lifecycle support. For Tier 2 suppliers, at higher switching frequencies, passive components can shrink, but electromagnetic interference, insulation coordination and gate-loop design become more demanding. For Tier 2 suppliers, the 2026 commercial mix must be evaluated against 2024–2026 product milestones; these are design and revenue-allocation indicators, not a replacement for a verified purchase order.
Tier 3 Regional and niche device vendors; selected legacy RF or silicon suppliers Smaller or adjacent suppliers can address local sourcing needs and narrow industrial power applications but should not be assigned audited global WBG market shares without product-specific evidence. Device-level qualification, channel reach and technical support constrain entry, especially when the design requires 1200 V switching or multi-year automotive reliability. For Tier 3 participants, supply agreements increasingly involve electrical characterization, application reference boards and reliability evidence rather than an interchangeable catalog part number. For Tier 3 participants, the 2026 commercial mix must be evaluated against 650 V and 1200 V commercial entry requirements; these are design and revenue-allocation indicators, not a replacement for a verified purchase order.

Key companies profiled

  • Qorvo
  • STMicroelectronics
  • Infineon Technologies
  • Microchip Technology
  • Texas Instruments
  • onsemi
  • ROHM Semiconductor
  • Nexperia
  • Littelfuse / IXYS
  • Wolfspeed
  • Alpha & Omega Semiconductor
  • Fuji Electric
  • Diodes Incorporated
  • Mitsubishi Electric / Vincotech
  • China Resources Microelectronics
  • Yangzhou Yangjie Electronic Technology
  • NCEPOWER
  • Hangzhou Silan Microelectronics
  • Transphorm (Renesas)
  • GaN Systems (Infineon)

Manufacturing Economics and Technology Development

Power-device economics depend on the conversion from processed SiC or GaN wafers into qualified discrete packages and power modules. Yield loss, epitaxial defects, packaging reliability and test intensity shape finished-device cost. Module pricing includes assembly and thermal interfaces, whereas substrate and epitaxial sales remain upstream inputs excluded from finished-device revenue. For manufacturing value chain, the transition from 400 V vehicles to 800 V and 900 V platforms increases interest in high-voltage SiC switches and associated charging infrastructure. For manufacturing value chain, the 2026 commercial mix must be evaluated against 2026 device classes 650 V through 2300 V; these are design and revenue-allocation indicators, not a replacement for a verified purchase order.

Silicon carbide fabrication demands control of crystal defects and process uniformity because device yield affects die cost at each voltage class. At 1200 V, blocking margin and on-resistance are linked to chip area and thermal loss, making simple comparisons of wafer capacity misleading. Productive die yield and tested package output determine marketable supply. For SiC wafer processing, gaN devices compete particularly where switching frequency and compact magnetics matter; SiC maintains an advantage in high-power and high-voltage traction sockets. For SiC wafer processing, the 2026 commercial mix must be evaluated against 1200 V MOSFET electrical yield; these are design and revenue-allocation indicators, not a replacement for a verified purchase order.

Power-module assembly introduces direct-bonded substrates, die attach, bond interconnects and thermal interface materials that must survive cycling. Infineon described its EasyPACK C in October 2025 and XHP 2 in May 2026 as platforms improving thermal and electrical performance. Such packaging innovation can support higher module value without increasing the number of semiconductor die. For module packaging, the relevant device ratings span 650 V, 750 V, 900 V, 1200 V and selected 2300 V industrial modules; qualification is linked to switching loss and fault tolerance. For module packaging, the 2026 commercial mix must be evaluated against 2025 EasyPACK and 2026 XHP 2; these are design and revenue-allocation indicators, not a replacement for a verified purchase order.

GaN conversion uses a different manufacturing and qualification path, with switching behavior sensitive to gate design and dynamic on-resistance. Integrating Transphorm within Renesas broadens design support for GaN power stages, but manufacturing expansion must still translate into customer-qualified production. Product launches alone do not establish realized merchant device revenue. For GaN manufacturing, system buyers compare gate-drive complexity, transient thermal impedance, package parasitics and operating temperature before assigning a new power-conversion socket. For GaN manufacturing, the 2026 commercial mix must be evaluated against 2024 Renesas acquisition and 2026 market horizon; these are design and revenue-allocation indicators, not a replacement for a verified purchase order.

Market Dynamics, Drivers, Restraints and Opportunities

Market expansion is led by electrified transport, higher-efficiency charging, stationary storage and compact power supplies, but conversion design wins have long qualification cycles. The analytical driver contributions total +23.10 percentage points while constraints subtract 6.20 points, yielding a net 16.90-point growth rate. Cost competition from silicon remains material in price-sensitive equipment. For power-device growth balance, the purchasing decision depends on electrical reliability under repeated load cycles, not simply on a laboratory efficiency figure or the nominal semiconductor bandgap. For power-device growth balance, the 2026 commercial mix must be evaluated against 2027–2029, 2030–2032 and 2033–2036 periods; these are design and revenue-allocation indicators, not a replacement for a verified purchase order.

MARKET DRIVERS

Drivers Impact Analysis

Market Drivers Impact Rank CAGR Contribution (%) 2027–2029 2030–2032 2033–2036
Electric traction inverter and charging platform adoption High +6.20% High High Medium
Solar, battery storage and grid conversion expansion High +5.00% High High High
Higher voltage and switching-efficiency product migration Medium-High +4.30% Medium High High
GaN power density in telecom and server supplies Medium +3.20% Medium High High
Industrial solid-state protection and drives Low-Medium +2.60% Low Medium High
Others (module packaging, procurement diversification and reference designs) Low +1.80% Medium Medium Low

Vehicle electrification and high-voltage platforms

Electric traction and onboard charging demand high-efficiency switches that can operate across 750 V and 1200 V architectures. Onsemi and Geely disclosed a broader EliteSiC collaboration in April 2026, while ST developed its fourth-generation SiC platform for traction. Design qualification can convert platform commitments into several years of merchant device demand. For automotive driver, power-module adoption adds thermal interfaces and interconnection quality to the procurement equation, while discrete-device sourcing puts greater emphasis on board-level design. For automotive driver, the 2026 commercial mix must be evaluated against 2026 application share ~43%; these are design and revenue-allocation indicators, not a replacement for a verified purchase order.

Stationary storage and renewable conversion

Battery storage and renewable inverters use high-voltage conversion stages where SiC modules can reduce loss and cooling requirements. Infineon introduced 2300 V XHP 2 modules in May 2026 for systems with 1500 V DC links, creating an example of the technical requirement behind module purchases. For renewable driver, long-lived traction and grid designs reward traceable wafer processing, controlled defect density and stable supply over multiple qualification and production cycles. For renewable driver, the 2026 commercial mix must be evaluated against 2300 V switches and 1500 V links; these are design and revenue-allocation indicators, not a replacement for a verified purchase order.

Higher power density in compact supplies

GaN and lower-voltage SiC enable switching frequency increases that reduce passive-component size in selected converter designs. Infineon presented a 12 kW server PSU reference design in September 2025 combining silicon, SiC and GaN, showing that mixed-material power stages can outperform blanket technology substitution. For GaN density driver, the conversion architecture determines whether lower switching loss offsets the price premium of a wide-bandgap transistor relative to an established silicon alternative. For GaN density driver, the 2026 commercial mix must be evaluated against 12 kW server reference design; these are design and revenue-allocation indicators, not a replacement for a verified purchase order.

MARKET RESTRAINTS

Restraints Impact Analysis

Market Restraints Impact Rank CAGR Contribution (%) 2027–2029 2030–2032 2033–2036
SiC wafer and module manufacturing cost premium High -2.40% High High Medium
Long qualification and reliability test cycles Medium-High -1.70% High Medium Medium
Silicon device competition and pricing pressure Medium -1.30% High High High
Others (supply concentration, gate-drive complexity and integration) Low -0.80% Medium Medium Low

Manufacturing cost and yield exposure

SiC material defects, device processing and module assembly impose costs above conventional silicon in many voltage classes. Automotive programs cannot compensate by accepting lower reliability, so yield improvement and thermal cycling qualification must precede scale pricing. The risk is particularly important when silicon IGBTs remain adequate for the converter duty cycle. For SiC cost restraint, at higher switching frequencies, passive components can shrink, but electromagnetic interference, insulation coordination and gate-loop design become more demanding. For SiC cost restraint, the 2026 commercial mix must be evaluated against 750 V and 1200 V device classes; these are design and revenue-allocation indicators, not a replacement for a verified purchase order.

System redesign and qualification time

A switch with lower nominal loss may still require changes to gate drive, insulation, thermal management and electromagnetic compatibility. Vehicle and grid customers validate the entire converter before accepting a new SiC or GaN device. This creates a timing gap between a 2026 product announcement and broad shipment revenue. For integration restraint, supply agreements increasingly involve electrical characterization, application reference boards and reliability evidence rather than an interchangeable catalog part number. For integration restraint, the 2026 commercial mix must be evaluated against 2026–2030 customer qualification window; these are design and revenue-allocation indicators, not a replacement for a verified purchase order.

Price competition and supply concentration

Multiple suppliers offer 650 V and 1200 V devices, intensifying competition as portfolios expand. Buyers also assess SiC substrate sourcing and the concentration of specialized wafer processes. Strong silicon alternatives can win price-sensitive sockets, especially in compact low-voltage industrial systems where the energy savings are modest. For competitive restraint, the transition from 400 V vehicles to 800 V and 900 V platforms increases interest in high-voltage SiC switches and associated charging infrastructure. For competitive restraint, the 2026 commercial mix must be evaluated against 650 V and 1200 V product overlap; these are design and revenue-allocation indicators, not a replacement for a verified purchase order.

MARKET OPPORTUNITIES

Megawatt charging and heavy-duty electrification

High-power charging stations require switching devices that tolerate demanding thermal and electrical cycles. Infineon announced a July 2026 supply relationship for 1200 V CoolSiC devices used in megawatt charging converters. This application can support premium module content, although project schedules and utilization determine the pace of adoption. For megawatt charging opportunity, gaN devices compete particularly where switching frequency and compact magnetics matter; SiC maintains an advantage in high-power and high-voltage traction sockets. For megawatt charging opportunity, the 2026 commercial mix must be evaluated against 2026 1200 V charging product supply; these are design and revenue-allocation indicators, not a replacement for a verified purchase order.

Bidirectional solid-state power distribution

Infineon introduced 750 V bidirectional SiC switches in June 2026, illustrating opportunities to replace electromechanical switching in selected power-distribution designs. Adoption depends on fault isolation, short-circuit behavior and maintenance economics rather than transistor speed alone. Storage and industrial distribution systems are potential early adopters. For bidirectional protection opportunity, the relevant device ratings span 650 V, 750 V, 900 V, 1200 V and selected 2300 V industrial modules; qualification is linked to switching loss and fault tolerance. For bidirectional protection opportunity, the 2026 commercial mix must be evaluated against 750 V switching and 2026 launch; these are design and revenue-allocation indicators, not a replacement for a verified purchase order.

Thermally optimized module packaging

Nexperia launched 1200 V QDPAK SiC MOSFETs in June 2026, and Infineon expanded EasyPACK C modules in October 2025. Improved cooling and interconnection can increase power density within existing converter footprints, opening replacement opportunities even when the system voltage stays unchanged. For packaging opportunity, system buyers compare gate-drive complexity, transient thermal impedance, package parasitics and operating temperature before assigning a new power-conversion socket. For packaging opportunity, the 2026 commercial mix must be evaluated against 2025–2026 module advances; these are design and revenue-allocation indicators, not a replacement for a verified purchase order.

Supply Chain and Procurement Outlook

The SiC and GaN power-device chain connects crystal or epitaxial input supply, semiconductor wafer fabrication, discrete or module packaging, and converter integration. The relevant market value is captured at the qualified device or module sale; wafer material and completed equipment values are excluded. Procurement concentration and testing requirements vary by voltage class. For supply-chain value boundary, the purchasing decision depends on electrical reliability under repeated load cycles, not simply on a laboratory efficiency figure or the nominal semiconductor bandgap. For supply-chain value boundary, the 2026 commercial mix must be evaluated against 2026 650 V to 2300 V products; these are design and revenue-allocation indicators, not a replacement for a verified purchase order.

MaterialsSiC crystal and GaN epitaxial material quality influences defect density, voltage blocking and yield. Material suppliers are upstream participants, so substrate revenue is not counted a second time as finished transistor sales. For upstream materials, power-module adoption adds thermal interfaces and interconnection quality to the procurement equation, while discrete-device sourcing puts greater emphasis on board-level design. For upstream materials, the 2026 commercial mix must be evaluated against 1200 V die quality; these are design and revenue-allocation indicators, not a replacement for a verified purchase order.
FabricationPower MOSFET and GaN transistor fabrication must control switching characteristics, breakdown voltage and reliability. Productive yield at 650 V, 750 V or 1200 V changes the economics of commercial converter designs. For wafer fabrication, long-lived traction and grid designs reward traceable wafer processing, controlled defect density and stable supply over multiple qualification and production cycles. For wafer fabrication, the 2026 commercial mix must be evaluated against 650 V to 1200 V devices; these are design and revenue-allocation indicators, not a replacement for a verified purchase order.
PackagingDiscrete packages and integrated modules combine die, thermal pathways and electrical isolation. Automotive qualification and industrial power cycling determine which package can enter a production bill of materials. For packaging process, the conversion architecture determines whether lower switching loss offsets the price premium of a wide-bandgap transistor relative to an established silicon alternative. For packaging process, the 2026 commercial mix must be evaluated against 2025–2026 qualification programs; these are design and revenue-allocation indicators, not a replacement for a verified purchase order.
ApplicationsTraction, charging, renewable, telecom and industrial converter manufacturers select qualified devices and integrate them into equipment. Only device and module sales count, not the downstream inverter or finished vehicle. For downstream demand, at higher switching frequencies, passive components can shrink, but electromagnetic interference, insulation coordination and gate-loop design become more demanding. For downstream demand, the 2026 commercial mix must be evaluated against 2026 applications ~43% automotive; these are design and revenue-allocation indicators, not a replacement for a verified purchase order.

Upstream supply. SiC wafer quality and GaN epitaxial processing determine the achievable die yield and blocking-voltage reliability. Upstream capacity announcements may improve future device availability but do not directly equal merchant finished-device revenue. A 1200 V traction part requires different defect-control tolerances from a compact 650 V converter transistor. For upstream capacity, supply agreements increasingly involve electrical characterization, application reference boards and reliability evidence rather than an interchangeable catalog part number. For upstream capacity, the 2026 commercial mix must be evaluated against 650 V and 1200 V device needs; these are design and revenue-allocation indicators, not a replacement for a verified purchase order.

Device fabrication. SiC MOSFET and GaN power-switch processing must deliver reproducible threshold behavior, low conduction loss and stable switching over thermal excursions. Device fabrication is capital intensive, but its economic contribution becomes visible only when tested chips are sold as discrete products or integrated into qualified modules. For device manufacturing, the transition from 400 V vehicles to 800 V and 900 V platforms increases interest in high-voltage SiC switches and associated charging infrastructure. For device manufacturing, the 2026 commercial mix must be evaluated against 2026 device production; these are design and revenue-allocation indicators, not a replacement for a verified purchase order.

Packaging and test. Thermal cycling, die attach and module insulation define the final reliability envelope. ST ACEPACK DMT-32 and Infineon EasyPACK C show different packaging strategies for automotive and industrial power stages. The selling price of a finished module includes integrated chips, preventing separate counting of those chips again. For module assembly, gaN devices compete particularly where switching frequency and compact magnetics matter; SiC maintains an advantage in high-power and high-voltage traction sockets. For module assembly, the 2026 commercial mix must be evaluated against 175C junction and 1200 V module classes; these are design and revenue-allocation indicators, not a replacement for a verified purchase order.

Customer qualification. Automotive and grid converter customers require documented failure modes, lifetime projections and supply continuity. A 2026 product announcement is an early commercial signal, while design-in and volume qualification can extend across subsequent model years. This lag affects regional growth timing and the mix of GaN discretes versus SiC modules. For converter qualification, the relevant device ratings span 650 V, 750 V, 900 V, 1200 V and selected 2300 V industrial modules; qualification is linked to switching loss and fault tolerance. For converter qualification, the 2026 commercial mix must be evaluated against 2027–2036 forecast window; these are design and revenue-allocation indicators, not a replacement for a verified purchase order.

Recent Developments in Wide-Bandgap Power Semiconductor Devices

  • 8 July 2026 Supply agreement
    Infineon announced 1200 V CoolSiC MOSFET supply for ADVANTICS liquid-cooled megawatt charging converters. The arrangement connects finished SiC switching devices to a defined heavy-duty charging use and shows how 2026 infrastructure investment can generate component demand. The 1200 V rating supports the voltage and thermal requirements of these high-power conversion stages. For dated WBG development, system buyers compare gate-drive complexity, transient thermal impedance, package parasitics and operating temperature before assigning a new power-conversion socket. For dated WBG development, the 2026 commercial mix must be evaluated against 2025–2026 technical program 7; these are design and revenue-allocation indicators, not a replacement for a verified purchase order. Source
  • 9 June 2026 Product launch
    Nexperia introduced QDPAK 1200 V SiC MOSFETs with automotive and industrial variants and on-resistance options from 17 to 80 milliohms. Top-side cooling improves thermal integration in dense converters, while qualification variants widen the addressable socket base. The announcement concerns merchant power devices, not the selling value of complete inverters. For dated WBG development, the purchasing decision depends on electrical reliability under repeated load cycles, not simply on a laboratory efficiency figure or the nominal semiconductor bandgap. For dated WBG development, the 2026 commercial mix must be evaluated against 2025–2026 technical program 13; these are design and revenue-allocation indicators, not a replacement for a verified purchase order. Source
  • 2 June 2026 Technology launch
    Infineon launched 750 V bidirectional CoolSiC switches with common-drain dual-die construction and top-side cooling. Bidirectional switching can simplify power-stage topology in onboard chargers and distribution circuits, reducing the need for separate switching elements. Commercial uptake depends on fault robustness, board design and qualification rather than the device launch alone. For dated WBG development, power-module adoption adds thermal interfaces and interconnection quality to the procurement equation, while discrete-device sourcing puts greater emphasis on board-level design. For dated WBG development, the 2026 commercial mix must be evaluated against 2025–2026 technical program 2; these are design and revenue-allocation indicators, not a replacement for a verified purchase order. Source
  • 11 May 2026 Module launch
    Infineon expanded XHP 2 modules with 2300 V CoolSiC MOSFET technology for 1500 V DC-link power systems. The portfolio addresses renewable energy and storage converters requiring higher voltage capability, with module insulation and cooling affecting system design. These specifications illustrate the industrial high-voltage opportunity distinct from compact GaN applications. For dated WBG development, long-lived traction and grid designs reward traceable wafer processing, controlled defect density and stable supply over multiple qualification and production cycles. For dated WBG development, the 2026 commercial mix must be evaluated against 2025–2026 technical program 1; these are design and revenue-allocation indicators, not a replacement for a verified purchase order. Source
  • 28 April 2026 Automotive collaboration
    Onsemi and Geely expanded collaboration around EliteSiC technologies for new electric and hybrid vehicle platforms. The companies described high-voltage architecture integration, creating a route from qualified SiC components to vehicle-scale procurement. The announcement is evidence of product use and design collaboration, not a disclosed audited share of worldwide WBG sales. For dated WBG development, the conversion architecture determines whether lower switching loss offsets the price premium of a wide-bandgap transistor relative to an established silicon alternative. For dated WBG development, the 2026 commercial mix must be evaluated against 2025–2026 technical program 9; these are design and revenue-allocation indicators, not a replacement for a verified purchase order. Source
  • 29 October 2025 Packaging launch
    Infineon introduced EasyPACK C power modules using 1200 V CoolSiC G2 MOSFETs for charging, storage and UPS applications. The package emphasizes power cycling and higher power density, demonstrating how thermal integration can increase the value of finished power modules. Its revenue contribution depends on later customer production rather than product availability alone. For dated WBG development, at higher switching frequencies, passive components can shrink, but electromagnetic interference, insulation coordination and gate-loop design become more demanding. For dated WBG development, the 2026 commercial mix must be evaluated against 2025–2026 technical program 11; these are design and revenue-allocation indicators, not a replacement for a verified purchase order. Source
  • 30 September 2025 Portfolio expansion
    Infineon expanded 400 V and 440 V CoolSiC MOSFET options for server supplies, solar inverters and other high-power applications. New package choices provide designers with additional thermal configurations at lower voltage classes than traction modules. This broadens potential WBG penetration while leaving silicon devices competitive in cost-sensitive sockets. For dated WBG development, supply agreements increasingly involve electrical characterization, application reference boards and reliability evidence rather than an interchangeable catalog part number. For dated WBG development, the 2026 commercial mix must be evaluated against 2025–2026 technical program 5; these are design and revenue-allocation indicators, not a replacement for a verified purchase order. Source
  • 5 May 2025 Product development
    Infineon introduced a CoolSiC JFET family for solid-state protection and distribution, with engineering samples planned in 2025 and volume production in 2026. The devices target breakers, hot-swap systems and industrial safety functions where controlled fault behavior matters. The launch expands application scope beyond traction and renewable inverters. For dated WBG development, the transition from 400 V vehicles to 800 V and 900 V platforms increases interest in high-voltage SiC switches and associated charging infrastructure. For dated WBG development, the 2026 commercial mix must be evaluated against 2025–2026 technical program 3; these are design and revenue-allocation indicators, not a replacement for a verified purchase order. Source

REPORT SCOPE & SEGMENTATION

Attribute Details
Market definition Finished SiC and GaN power transistors, rectifiers and power modules sold at factory gate; no double counting of integrated die.
Base year 2026
Estimated year 2027
Forecast period 2027–2036
Historical period 2021–2025
Currency USD million
By Type Silicon Carbide (SiC) Power Devices · Gallium Nitride (GaN) Power Devices
By Application Automotive · Telecom · Solar & Storage Systems · Other
By Voltage Class Below 650 V · 650–900 V · 1200 V · Above 1200 V
By Product Format Discrete Power Devices · Power Modules
By Conversion Use Case Traction Inverters · Charging Infrastructure · Renewables & Grid · Telecom Power · Industrial & Other
By Region Five regional markets with 2026 modeled shares and 2027–2036 growth profiles.
North AmericaUnited States, Canada, Mexico
EuropeGermany, France, Italy, United Kingdom, Nordic countries
Asia-PacificChina, Japan, South Korea, India, Southeast Asia
South AmericaBrazil, Argentina, Chile, Colombia
Middle East & AfricaSaudi Arabia, UAE, South Africa, Egypt
Key Companies Profiled Qorvo, STMicroelectronics, Infineon Technologies, Microchip Technology, Texas Instruments, onsemi, ROHM Semiconductor, Nexperia, Littelfuse / IXYS, Wolfspeed, Alpha & Omega Semiconductor, Fuji Electric, Diodes Incorporated, Mitsubishi Electric / Vincotech, China Resources Microelectronics, Yangzhou Yangjie Electronic Technology, NCEPOWER, Hangzhou Silan Microelectronics, Transphorm (Renesas), GaN Systems (Infineon)
Customization Scope Country-level SiC and GaN voltage-class allocation, customer qualification schedules and conversion-application scenarios can be customized to specific procurement questions.

Frequently Asked Questions

What is the 2026 global market size?

The market is valued at USD 1,457.09 million in 2026 and projected to reach USD 6,944.36 million by 2036 at a CAGR of 16.9% for 2027–2036. The revenue object is finished SiC and GaN power switching devices and modules, not substrates, silicon switches or the value of finished inverters and vehicles. For WBG market FAQ, gaN devices compete particularly where switching frequency and compact magnetics matter; SiC maintains an advantage in high-power and high-voltage traction sockets. For WBG market FAQ, the 2026 commercial mix must be evaluated against 2026–2036 scope question 1; these are design and revenue-allocation indicators, not a replacement for a verified purchase order.

Which semiconductor type holds the largest share?

Silicon carbide is the largest type with an estimated ~70% of 2026 device revenue, while gallium nitride represents ~30%. SiC has broad adoption in 750 V and 1200 V traction and stationary power stages; GaN has stronger potential in compact high-frequency conversion. These proportions are modeled allocations, not audited manufacturer market shares. For WBG market FAQ, the relevant device ratings span 650 V, 750 V, 900 V, 1200 V and selected 2300 V industrial modules; qualification is linked to switching loss and fault tolerance. For WBG market FAQ, the 2026 commercial mix must be evaluated against 2026–2036 scope question 2; these are design and revenue-allocation indicators, not a replacement for a verified purchase order.

What is the role of GaN in power conversion?

GaN power transistors enable high-frequency switching in selected telecom rectifiers, server power supplies and compact converters, potentially reducing magnetic-component size. Their commercial suitability depends on driver design, dynamic resistance, packaging and field reliability. GaN radio-frequency amplifiers are excluded because they perform signal amplification rather than the power-switching function counted in this market. For WBG market FAQ, system buyers compare gate-drive complexity, transient thermal impedance, package parasitics and operating temperature before assigning a new power-conversion socket. For WBG market FAQ, the 2026 commercial mix must be evaluated against 2026–2036 scope question 3; these are design and revenue-allocation indicators, not a replacement for a verified purchase order.

Why is Asia-Pacific the largest region?

Asia-Pacific holds an estimated ~44% of 2026 revenue because it combines power-device manufacturing, converter assembly, automotive electronics and renewable power systems. The region is modeled to grow at ~18.5% CAGR through 2036. North America follows near ~24.5%, with a different mix of qualification, local sourcing and industrial applications. For WBG market FAQ, the purchasing decision depends on electrical reliability under repeated load cycles, not simply on a laboratory efficiency figure or the nominal semiconductor bandgap. For WBG market FAQ, the 2026 commercial mix must be evaluated against 2026–2036 scope question 4; these are design and revenue-allocation indicators, not a replacement for a verified purchase order.

What are the leading applications?

Automotive is the largest application at an estimated ~43% of 2026 revenue, followed by solar and storage systems at ~27%, other industrial and server power uses at ~16%, and telecom power conversion at ~14%. Traction inverters and charging equipment favor qualified high-voltage SiC devices, while compact rectifiers offer opportunities for GaN. For WBG market FAQ, power-module adoption adds thermal interfaces and interconnection quality to the procurement equation, while discrete-device sourcing puts greater emphasis on board-level design. For WBG market FAQ, the 2026 commercial mix must be evaluated against 2026–2036 scope question 5; these are design and revenue-allocation indicators, not a replacement for a verified purchase order.

How do SiC power modules differ from discrete devices?

A discrete SiC transistor is a packaged switching component, whereas a power module integrates several die, interconnections, insulation and thermal interfaces into one qualified assembly. Modules support high-power traction and grid converters, while discretes offer flexibility for smaller stages. Market revenue counts the finished module once and does not separately add its integrated die sales. For WBG market FAQ, long-lived traction and grid designs reward traceable wafer processing, controlled defect density and stable supply over multiple qualification and production cycles. For WBG market FAQ, the 2026 commercial mix must be evaluated against 2026–2036 scope question 6; these are design and revenue-allocation indicators, not a replacement for a verified purchase order.

What limits faster adoption of wide-bandgap devices?

The principal constraints are SiC wafer and packaging costs, long automotive and grid qualification cycles, complex gate-drive and electromagnetic compatibility design, and price competition from mature silicon devices. A lower switching-loss figure does not guarantee system cost savings. Customers must validate thermal cycling, fault behavior and converter-level efficiency before approving volume production. For WBG market FAQ, the conversion architecture determines whether lower switching loss offsets the price premium of a wide-bandgap transistor relative to an established silicon alternative. For WBG market FAQ, the 2026 commercial mix must be evaluated against 2026–2036 scope question 7; these are design and revenue-allocation indicators, not a replacement for a verified purchase order.

Which companies are relevant to the market?

Infineon, STMicroelectronics, onsemi, ROHM, Wolfspeed, Nexperia, Microchip, Renesas and selected regional device manufacturers participate in SiC or GaN power markets. GaN Systems joined Infineon in 2023 and Transphorm joined Renesas in 2024. Historical company rosters therefore include former independent suppliers and adjacent firms whose total revenue cannot be equated with this market. For WBG market FAQ, at higher switching frequencies, passive components can shrink, but electromagnetic interference, insulation coordination and gate-loop design become more demanding. For WBG market FAQ, the 2026 commercial mix must be evaluated against 2026–2036 scope question 8; these are design and revenue-allocation indicators, not a replacement for a verified purchase order.

What happened in 2026 that supports the outlook?

Infineon announced 2300 V CoolSiC modules in May 2026, a 750 V bidirectional SiC switch in June and 1200 V charging-converter supply in July. Nexperia introduced 1200 V QDPAK SiC devices in June, while onsemi expanded its Geely automotive collaboration in April. These dated product and customer events establish technology activity but not audited global revenue. For WBG market FAQ, supply agreements increasingly involve electrical characterization, application reference boards and reliability evidence rather than an interchangeable catalog part number. For WBG market FAQ, the 2026 commercial mix must be evaluated against 2026–2036 scope question 9; these are design and revenue-allocation indicators, not a replacement for a verified purchase order.

What does the 2036 forecast include?

The forecast covers factory-gate SiC and GaN power devices and modules used in automotive, telecom power, solar, storage and other electrical conversion applications. It excludes GaN RF-only amplifiers, upstream substrates, silicon IGBTs, complete EVs and inverter system revenue. The 2036 value extends six years beyond the original 2030 monetary endpoint and is sensitive to pricing and qualification schedules. For WBG market FAQ, the transition from 400 V vehicles to 800 V and 900 V platforms increases interest in high-voltage SiC switches and associated charging infrastructure. For WBG market FAQ, the 2026 commercial mix must be evaluated against 2026–2036 scope question 10; these are design and revenue-allocation indicators, not a replacement for a verified purchase order.

Research Sources & Evidence Base

View research sources used for this overview
  1. infineon.com. 2300V CoolSiC XHP2 power modules for 1500V DC link renewable and storage conversion., direct evidence for WBG power-device technology, power conversion and 2024–2026 commercial developments.
  2. infineon.com. 750V SiC bidirectional switches, automotive on-board charging and grid applications., direct evidence for WBG power-device technology, power conversion and 2024–2026 commercial developments in power-device market and supplier lifetime support.
  3. infineon.com. CoolSiC JFET for solid-state protection, direct evidence for WBG power-device technology, power conversion and 2024–2026 commercial developments in power-device market and inverter efficiency tradeoffs.
  4. renesas.com. Renesas completed Transphorm GaN acquisition and expanded GaN power portfolio., direct evidence for WBG power-device technology, power conversion and 2024–2026 commercial developments in power-device market and packaging parasitic control.
  5. infineon.com. 400V/440V SiC MOSFETs address AI power, solar and industrial conversion., direct evidence for WBG power-device technology, power conversion and 2024–2026 commercial developments in power-device market and production program timing.
  6. infineon.com. 12kW server PSU reference design combines Si, SiC and GaN power devices., direct evidence for WBG power-device technology, power conversion and 2024–2026 commercial developments in power-device market and merchant component valuation.
  7. infineon.com. 1200V SiC MOSFET supply for megawatt charging and energy storage power converters., direct evidence for WBG power-device technology, power conversion and 2024–2026 commercial developments in power-device market and 1500 V DC-link engineering.
  8. st.com. ST automotive/industrial SiC power modules with 175C junction limit and on-board charging use., direct evidence for WBG power-device technology, power conversion and 2024–2026 commercial developments in power-device market and 1200 V MOSFET switching.
  9. onsemi.com. Geely vehicle platform integrates EliteSiC technology for higher-voltage EV systems., direct evidence for WBG power-device technology, power conversion and 2024–2026 commercial developments in power-device market and 750 V converter operation.
  10. infineon.com. 650V and 1200V CoolSiC MOSFET Generation2 with up to20% improved performance figures., direct evidence for WBG power-device technology, power conversion and 2024–2026 commercial developments in power-device market and higher-voltage traction purchasing.
  11. infineon.com. EasyPACK C 1200V SiC modules for charging, storage and UPS with packaging improvement., direct evidence for WBG power-device technology, power conversion and 2024–2026 commercial developments in power-device market and module thermal-cycle qualification.
  12. newsroom.st.com. ST fourth-generation SiC 750V/1200V devices for EV traction, direct evidence for WBG power-device technology, power conversion and 2024–2026 commercial developments in power-device market and SiC wafer yield management.
  13. nexperia.com. 1200V SiC QDPAK automotive and industrial variants at 17-80mOhm., direct evidence for WBG power-device technology, power conversion and 2024–2026 commercial developments in power-device market and GaN switching design.
  14. wolfspeed.com. SiC substrate and advanced packaging R&D, adjacent evidence for WBG power-device technology, power conversion and 2024–2026 commercial developments.
  15. infineon.com. Manufacturer power catalogue distinguishes SiC/GaN power devices from silicon devices, controll, direct evidence for WBG power-device technology, power conversion and 2024–2026 commercial developments in power-device market and grid and storage power conversion.
Wide-Bandgap (WBG) Power Semiconductor Devices Market Size, Share & Industry Analysis, By Type (Silicon Carbide (SiC) Power Devices, Gallium Nitride (GaN) Power Devices), By Application (Automotive, Telecom, Solar & Storage Systems, Other), By Voltage Class (Below 650 V, 650–900 V, 1200 V, Above 1200 V), By Product Format (Discrete Power Devices, Power Modules), and Regional Forecast, 2026–2036

Get Sample Report PDF for Exclusive Insights

Report Sample Includes

  • Table of Contents
  • List of Tables & Figures
  • Charts, Research Methodology, and more...

PDF Icon Download Sample Report PDF

Download Sample Report

Table of Content

Table of Contents
1 Research Methodology and Statistical Scope
1.1 Market Definition and Statistical Scope of Wide-Bandgap (WBG) Power Semiconductor Devices
1.2 Key Market Segments
1.2.1 Wide-Bandgap (WBG) Power Semiconductor Devices Segment by Type
1.2.2 Wide-Bandgap (WBG) Power Semiconductor Devices Segment by Application
1.3 Methodology & Sources of Information
1.3.1 Research Methodology
1.3.2 Research Process
1.3.3 Market Breakdown and Data Triangulation
1.3.4 Base Year
1.3.5 Report Assumptions & Caveats
2 Wide-Bandgap (WBG) Power Semiconductor Devices Market Overview
2.1 Global Market Overview
2.1.1 Global Wide-Bandgap (WBG) Power Semiconductor Devices Market Size (M USD) Estimates and Forecasts (2026-2034)
2.1.2 Global Wide-Bandgap (WBG) Power Semiconductor Devices Sales Estimates and Forecasts (2026-2034)
2.2 Market Segment Executive Summary
2.3 Global Market Size by Region
3 Wide-Bandgap (WBG) Power Semiconductor Devices Market Competitive Landscape
3.1 Global Wide-Bandgap (WBG) Power Semiconductor Devices Sales by Manufacturers (2019-2025)
3.2 Global Wide-Bandgap (WBG) Power Semiconductor Devices Revenue Market Share by Manufacturers (2019-2025)
3.3 Wide-Bandgap (WBG) Power Semiconductor Devices Market Share by Company Type (Tier 1, Tier 2, and Tier 3)
3.4 Global Wide-Bandgap (WBG) Power Semiconductor Devices Average Price by Manufacturers (2019-2025)
3.5 Manufacturers Wide-Bandgap (WBG) Power Semiconductor Devices Sales Sites, Area Served, Product Type
3.6 Wide-Bandgap (WBG) Power Semiconductor Devices Market Competitive Situation and Trends
3.6.1 Wide-Bandgap (WBG) Power Semiconductor Devices Market Concentration Rate
3.6.2 Global 5 and 10 Largest Wide-Bandgap (WBG) Power Semiconductor Devices Players Market Share by Revenue
3.6.3 Mergers & Acquisitions, Expansion
4 Wide-Bandgap (WBG) Power Semiconductor Devices Industry Chain Analysis
4.1 Wide-Bandgap (WBG) Power Semiconductor Devices Industry Chain Analysis
4.2 Market Overview of Key Raw Materials
4.3 Midstream Market Analysis
4.4 Downstream Customer Analysis
5 The Development and Dynamics of Wide-Bandgap (WBG) Power Semiconductor Devices Market
5.1 Key Development Trends
5.2 Driving Factors
5.3 Market Challenges
5.4 Market Restraints
5.5 Industry News
5.5.1 New Product Developments
5.5.2 Mergers & Acquisitions
5.5.3 Expansions
5.5.4 Collaboration/Supply Contracts
5.6 Industry Policies
6 Wide-Bandgap (WBG) Power Semiconductor Devices Market Segmentation by Type
6.1 Evaluation Matrix of Segment Market Development Potential (Type)
6.2 Global Wide-Bandgap (WBG) Power Semiconductor Devices Sales Market Share by Type (2019-2025)
6.3 Global Wide-Bandgap (WBG) Power Semiconductor Devices Market Size Market Share by Type (2019-2025)
6.4 Global Wide-Bandgap (WBG) Power Semiconductor Devices Price by Type (2019-2025)
7 Wide-Bandgap (WBG) Power Semiconductor Devices Market Segmentation by Application
7.1 Evaluation Matrix of Segment Market Development Potential (Application)
7.2 Global Wide-Bandgap (WBG) Power Semiconductor Devices Market Sales by Application (2019-2025)
7.3 Global Wide-Bandgap (WBG) Power Semiconductor Devices Market Size (M USD) by Application (2019-2025)
7.4 Global Wide-Bandgap (WBG) Power Semiconductor Devices Sales Growth Rate by Application (2019-2025)
8 Wide-Bandgap (WBG) Power Semiconductor Devices Market Segmentation by Region
8.1 Global Wide-Bandgap (WBG) Power Semiconductor Devices Sales by Region
8.1.1 Global Wide-Bandgap (WBG) Power Semiconductor Devices Sales by Region
8.1.2 Global Wide-Bandgap (WBG) Power Semiconductor Devices Sales Market Share by Region
8.2 North America
8.2.1 North America Wide-Bandgap (WBG) Power Semiconductor Devices Sales by Country
8.2.2 U.S.
8.2.3 Canada
8.2.4 Mexico
8.3 Europe
8.3.1 Europe Wide-Bandgap (WBG) Power Semiconductor Devices Sales by Country
8.3.2 Germany
8.3.3 France
8.3.4 U.K.
8.3.5 Italy
8.3.6 Russia
8.4 Asia Pacific
8.4.1 Asia Pacific Wide-Bandgap (WBG) Power Semiconductor Devices Sales by Region
8.4.2 China
8.4.3 Japan
8.4.4 South Korea
8.4.5 India
8.4.6 Southeast Asia
8.5 South America
8.5.1 South America Wide-Bandgap (WBG) Power Semiconductor Devices Sales by Country
8.5.2 Brazil
8.5.3 Argentina
8.5.4 Columbia
8.6 Middle East and Africa
8.6.1 Middle East and Africa Wide-Bandgap (WBG) Power Semiconductor Devices Sales by Region
8.6.2 Saudi Arabia
8.6.3 UAE
8.6.4 Egypt
8.6.5 Nigeria
8.6.6 South Africa
9 Key Companies Profile
9.1 Qorvo
9.1.1 Qorvo Wide-Bandgap (WBG) Power Semiconductor Devices Basic Information
9.1.2 Qorvo Wide-Bandgap (WBG) Power Semiconductor Devices Product Overview
9.1.3 Qorvo Wide-Bandgap (WBG) Power Semiconductor Devices Product Market Performance
9.1.4 Qorvo Business Overview
9.1.5 Qorvo Wide-Bandgap (WBG) Power Semiconductor Devices SWOT Analysis
9.1.6 Qorvo Recent Developments
9.2 STMicroelectronics
9.2.1 STMicroelectronics Wide-Bandgap (WBG) Power Semiconductor Devices Basic Information
9.2.2 STMicroelectronics Wide-Bandgap (WBG) Power Semiconductor Devices Product Overview
9.2.3 STMicroelectronics Wide-Bandgap (WBG) Power Semiconductor Devices Product Market Performance
9.2.4 STMicroelectronics Business Overview
9.2.5 STMicroelectronics Wide-Bandgap (WBG) Power Semiconductor Devices SWOT Analysis
9.2.6 STMicroelectronics Recent Developments
9.3 Infineon Technologies
9.3.1 Infineon Technologies Wide-Bandgap (WBG) Power Semiconductor Devices Basic Information
9.3.2 Infineon Technologies Wide-Bandgap (WBG) Power Semiconductor Devices Product Overview
9.3.3 Infineon Technologies Wide-Bandgap (WBG) Power Semiconductor Devices Product Market Performance
9.3.4 Infineon Technologies Wide-Bandgap (WBG) Power Semiconductor Devices SWOT Analysis
9.3.5 Infineon Technologies Business Overview
9.3.6 Infineon Technologies Recent Developments
9.4 Microchip
9.4.1 Microchip Wide-Bandgap (WBG) Power Semiconductor Devices Basic Information
9.4.2 Microchip Wide-Bandgap (WBG) Power Semiconductor Devices Product Overview
9.4.3 Microchip Wide-Bandgap (WBG) Power Semiconductor Devices Product Market Performance
9.4.4 Microchip Business Overview
9.4.5 Microchip Recent Developments
9.5 TI
9.5.1 TI Wide-Bandgap (WBG) Power Semiconductor Devices Basic Information
9.5.2 TI Wide-Bandgap (WBG) Power Semiconductor Devices Product Overview
9.5.3 TI Wide-Bandgap (WBG) Power Semiconductor Devices Product Market Performance
9.5.4 TI Business Overview
9.5.5 TI Recent Developments
9.6 Onsemi
9.6.1 Onsemi Wide-Bandgap (WBG) Power Semiconductor Devices Basic Information
9.6.2 Onsemi Wide-Bandgap (WBG) Power Semiconductor Devices Product Overview
9.6.3 Onsemi Wide-Bandgap (WBG) Power Semiconductor Devices Product Market Performance
9.6.4 Onsemi Business Overview
9.6.5 Onsemi Recent Developments
9.7 ROHM Semiconductor
9.7.1 ROHM Semiconductor Wide-Bandgap (WBG) Power Semiconductor Devices Basic Information
9.7.2 ROHM Semiconductor Wide-Bandgap (WBG) Power Semiconductor Devices Product Overview
9.7.3 ROHM Semiconductor Wide-Bandgap (WBG) Power Semiconductor Devices Product Market Performance
9.7.4 ROHM Semiconductor Business Overview
9.7.5 ROHM Semiconductor Recent Developments
9.8 Nexperia
9.8.1 Nexperia Wide-Bandgap (WBG) Power Semiconductor Devices Basic Information
9.8.2 Nexperia Wide-Bandgap (WBG) Power Semiconductor Devices Product Overview
9.8.3 Nexperia Wide-Bandgap (WBG) Power Semiconductor Devices Product Market Performance
9.8.4 Nexperia Business Overview
9.8.5 Nexperia Recent Developments
9.9 Littelfuse (IXYS)
9.9.1 Littelfuse (IXYS) Wide-Bandgap (WBG) Power Semiconductor Devices Basic Information
9.9.2 Littelfuse (IXYS) Wide-Bandgap (WBG) Power Semiconductor Devices Product Overview
9.9.3 Littelfuse (IXYS) Wide-Bandgap (WBG) Power Semiconductor Devices Product Market Performance
9.9.4 Littelfuse (IXYS) Business Overview
9.9.5 Littelfuse (IXYS) Recent Developments
9.10 Wolfspeed
9.10.1 Wolfspeed Wide-Bandgap (WBG) Power Semiconductor Devices Basic Information
9.10.2 Wolfspeed Wide-Bandgap (WBG) Power Semiconductor Devices Product Overview
9.10.3 Wolfspeed Wide-Bandgap (WBG) Power Semiconductor Devices Product Market Performance
9.10.4 Wolfspeed Business Overview
9.10.5 Wolfspeed Recent Developments
9.11 Alpha and Omega Semiconductor
9.11.1 Alpha and Omega Semiconductor Wide-Bandgap (WBG) Power Semiconductor Devices Basic Information
9.11.2 Alpha and Omega Semiconductor Wide-Bandgap (WBG) Power Semiconductor Devices Product Overview
9.11.3 Alpha and Omega Semiconductor Wide-Bandgap (WBG) Power Semiconductor Devices Product Market Performance
9.11.4 Alpha and Omega Semiconductor Business Overview
9.11.5 Alpha and Omega Semiconductor Recent Developments
9.12 Fuji Electric
9.12.1 Fuji Electric Wide-Bandgap (WBG) Power Semiconductor Devices Basic Information
9.12.2 Fuji Electric Wide-Bandgap (WBG) Power Semiconductor Devices Product Overview
9.12.3 Fuji Electric Wide-Bandgap (WBG) Power Semiconductor Devices Product Market Performance
9.12.4 Fuji Electric Business Overview
9.12.5 Fuji Electric Recent Developments
9.13 Diodes Incorporated
9.13.1 Diodes Incorporated Wide-Bandgap (WBG) Power Semiconductor Devices Basic Information
9.13.2 Diodes Incorporated Wide-Bandgap (WBG) Power Semiconductor Devices Product Overview
9.13.3 Diodes Incorporated Wide-Bandgap (WBG) Power Semiconductor Devices Product Market Performance
9.13.4 Diodes Incorporated Business Overview
9.13.5 Diodes Incorporated Recent Developments
9.14 Mitsubishi Electric (Vincotech)
9.14.1 Mitsubishi Electric (Vincotech) Wide-Bandgap (WBG) Power Semiconductor Devices Basic Information
9.14.2 Mitsubishi Electric (Vincotech) Wide-Bandgap (WBG) Power Semiconductor Devices Product Overview
9.14.3 Mitsubishi Electric (Vincotech) Wide-Bandgap (WBG) Power Semiconductor Devices Product Market Performance
9.14.4 Mitsubishi Electric (Vincotech) Business Overview
9.14.5 Mitsubishi Electric (Vincotech) Recent Developments
9.15 China Resources Microelectronics Limited
9.15.1 China Resources Microelectronics Limited Wide-Bandgap (WBG) Power Semiconductor Devices Basic Information
9.15.2 China Resources Microelectronics Limited Wide-Bandgap (WBG) Power Semiconductor Devices Product Overview
9.15.3 China Resources Microelectronics Limited Wide-Bandgap (WBG) Power Semiconductor Devices Product Market Performance
9.15.4 China Resources Microelectronics Limited Business Overview
9.15.5 China Resources Microelectronics Limited Recent Developments
9.16 Yangzhou Yangjie Electronic Technology
9.16.1 Yangzhou Yangjie Electronic Technology Wide-Bandgap (WBG) Power Semiconductor Devices Basic Information
9.16.2 Yangzhou Yangjie Electronic Technology Wide-Bandgap (WBG) Power Semiconductor Devices Product Overview
9.16.3 Yangzhou Yangjie Electronic Technology Wide-Bandgap (WBG) Power Semiconductor Devices Product Market Performance
9.16.4 Yangzhou Yangjie Electronic Technology Business Overview
9.16.5 Yangzhou Yangjie Electronic Technology Recent Developments
9.17 NCEPOWER
9.17.1 NCEPOWER Wide-Bandgap (WBG) Power Semiconductor Devices Basic Information
9.17.2 NCEPOWER Wide-Bandgap (WBG) Power Semiconductor Devices Product Overview
9.17.3 NCEPOWER Wide-Bandgap (WBG) Power Semiconductor Devices Product Market Performance
9.17.4 NCEPOWER Business Overview
9.17.5 NCEPOWER Recent Developments
9.18 Hangzhou Silan Microelectronics
9.18.1 Hangzhou Silan Microelectronics Wide-Bandgap (WBG) Power Semiconductor Devices Basic Information
9.18.2 Hangzhou Silan Microelectronics Wide-Bandgap (WBG) Power Semiconductor Devices Product Overview
9.18.3 Hangzhou Silan Microelectronics Wide-Bandgap (WBG) Power Semiconductor Devices Product Market Performance
9.18.4 Hangzhou Silan Microelectronics Business Overview
9.18.5 Hangzhou Silan Microelectronics Recent Developments
9.19 Transphorm
9.19.1 Transphorm Wide-Bandgap (WBG) Power Semiconductor Devices Basic Information
9.19.2 Transphorm Wide-Bandgap (WBG) Power Semiconductor Devices Product Overview
9.19.3 Transphorm Wide-Bandgap (WBG) Power Semiconductor Devices Product Market Performance
9.19.4 Transphorm Business Overview
9.19.5 Transphorm Recent Developments
9.20 GaN Systems
9.20.1 GaN Systems Wide-Bandgap (WBG) Power Semiconductor Devices Basic Information
9.20.2 GaN Systems Wide-Bandgap (WBG) Power Semiconductor Devices Product Overview
9.20.3 GaN Systems Wide-Bandgap (WBG) Power Semiconductor Devices Product Market Performance
9.20.4 GaN Systems Business Overview
9.20.5 GaN Systems Recent Developments
10 Wide-Bandgap (WBG) Power Semiconductor Devices Market Forecast by Region
10.1 Global Wide-Bandgap (WBG) Power Semiconductor Devices Market Size Forecast
10.2 Global Wide-Bandgap (WBG) Power Semiconductor Devices Market Forecast by Region
10.2.1 North America Market Size Forecast by Country
10.2.2 Europe Wide-Bandgap (WBG) Power Semiconductor Devices Market Size Forecast by Country
10.2.3 Asia Pacific Wide-Bandgap (WBG) Power Semiconductor Devices Market Size Forecast by Region
10.2.4 South America Wide-Bandgap (WBG) Power Semiconductor Devices Market Size Forecast by Country
10.2.5 Middle East and Africa Forecasted Consumption of Wide-Bandgap (WBG) Power Semiconductor Devices by Country
11 Forecast Market by Type and by Application (2025-2030)
11.1 Global Wide-Bandgap (WBG) Power Semiconductor Devices Market Forecast by Type (2025-2030)
11.1.1 Global Forecasted Sales of Wide-Bandgap (WBG) Power Semiconductor Devices by Type (2025-2030)
11.1.2 Global Wide-Bandgap (WBG) Power Semiconductor Devices Market Size Forecast by Type (2025-2030)
11.1.3 Global Forecasted Price of Wide-Bandgap (WBG) Power Semiconductor Devices by Type (2025-2030)
11.2 Global Wide-Bandgap (WBG) Power Semiconductor Devices Market Forecast by Application (2025-2030)
11.2.1 Global Wide-Bandgap (WBG) Power Semiconductor Devices Sales (K Units) Forecast by Application
11.2.2 Global Wide-Bandgap (WBG) Power Semiconductor Devices Market Size (M USD) Forecast by Application (2025-2030)
12 Conclusion and Key FindingsList of Tables
Table 1. Introduction of the Type
Table 2. Introduction of the Application
Table 3. Market Size (M USD) Segment Executive Summary
Table 4. Wide-Bandgap (WBG) Power Semiconductor Devices Market Size Comparison by Region (M USD)
Table 5. Global Wide-Bandgap (WBG) Power Semiconductor Devices Sales (K Units) by Manufacturers (2019-2025)
Table 6. Global Wide-Bandgap (WBG) Power Semiconductor Devices Sales Market Share by Manufacturers (2019-2025)
Table 7. Global Wide-Bandgap (WBG) Power Semiconductor Devices Revenue (M USD) by Manufacturers (2019-2025)
Table 8. Global Wide-Bandgap (WBG) Power Semiconductor Devices Revenue Share by Manufacturers (2019-2025)
Table 9. Company Type (Tier 1, Tier 2, and Tier 3) & (based on the Revenue in Wide-Bandgap (WBG) Power Semiconductor Devices as of 2022)
Table 10. Global Market Wide-Bandgap (WBG) Power Semiconductor Devices Average Price (USD/Unit) of Key Manufacturers (2019-2025)
Table 11. Manufacturers Wide-Bandgap (WBG) Power Semiconductor Devices Sales Sites and Area Served
Table 12. Manufacturers Wide-Bandgap (WBG) Power Semiconductor Devices Product Type
Table 13. Global Wide-Bandgap (WBG) Power Semiconductor Devices Manufacturers Market Concentration Ratio (CR5 and HHI)
Table 14. Mergers & Acquisitions, Expansion Plans
Table 15. Industry Chain Map of Wide-Bandgap (WBG) Power Semiconductor Devices
Table 16. Market Overview of Key Raw Materials
Table 17. Midstream Market Analysis
Table 18. Downstream Customer Analysis
Table 19. Key Development Trends
Table 20. Driving Factors
Table 21. Wide-Bandgap (WBG) Power Semiconductor Devices Market Challenges
Table 22. Global Wide-Bandgap (WBG) Power Semiconductor Devices Sales by Type (K Units)
Table 23. Global Wide-Bandgap (WBG) Power Semiconductor Devices Market Size by Type (M USD)
Table 24. Global Wide-Bandgap (WBG) Power Semiconductor Devices Sales (K Units) by Type (2019-2025)
Table 25. Global Wide-Bandgap (WBG) Power Semiconductor Devices Sales Market Share by Type (2019-2025)
Table 26. Global Wide-Bandgap (WBG) Power Semiconductor Devices Market Size (M USD) by Type (2019-2025)
Table 27. Global Wide-Bandgap (WBG) Power Semiconductor Devices Market Size Share by Type (2019-2025)
Table 28. Global Wide-Bandgap (WBG) Power Semiconductor Devices Price (USD/Unit) by Type (2019-2025)
Table 29. Global Wide-Bandgap (WBG) Power Semiconductor Devices Sales (K Units) by Application
Table 30. Global Wide-Bandgap (WBG) Power Semiconductor Devices Market Size by Application
Table 31. Global Wide-Bandgap (WBG) Power Semiconductor Devices Sales by Application (2019-2025) & (K Units)
Table 32. Global Wide-Bandgap (WBG) Power Semiconductor Devices Sales Market Share by Application (2019-2025)
Table 33. Global Wide-Bandgap (WBG) Power Semiconductor Devices Sales by Application (2019-2025) & (M USD)
Table 34. Global Wide-Bandgap (WBG) Power Semiconductor Devices Market Share by Application (2019-2025)
Table 35. Global Wide-Bandgap (WBG) Power Semiconductor Devices Sales Growth Rate by Application (2019-2025)
Table 36. Global Wide-Bandgap (WBG) Power Semiconductor Devices Sales by Region (2019-2025) & (K Units)
Table 37. Global Wide-Bandgap (WBG) Power Semiconductor Devices Sales Market Share by Region (2019-2025)
Table 38. North America Wide-Bandgap (WBG) Power Semiconductor Devices Sales by Country (2019-2025) & (K Units)
Table 39. Europe Wide-Bandgap (WBG) Power Semiconductor Devices Sales by Country (2019-2025) & (K Units)
Table 40. Asia Pacific Wide-Bandgap (WBG) Power Semiconductor Devices Sales by Region (2019-2025) & (K Units)
Table 41. South America Wide-Bandgap (WBG) Power Semiconductor Devices Sales by Country (2019-2025) & (K Units)
Table 42. Middle East and Africa Wide-Bandgap (WBG) Power Semiconductor Devices Sales by Region (2019-2025) & (K Units)
Table 43. Qorvo Wide-Bandgap (WBG) Power Semiconductor Devices Basic Information
Table 44. Qorvo Wide-Bandgap (WBG) Power Semiconductor Devices Product Overview
Table 45. Qorvo Wide-Bandgap (WBG) Power Semiconductor Devices Sales (K Units), Revenue (M USD), Price (USD/Unit) and Gross Margin (2019-2025)
Table 46. Qorvo Business Overview
Table 47. Qorvo Wide-Bandgap (WBG) Power Semiconductor Devices SWOT Analysis
Table 48. Qorvo Recent Developments
Table 49. STMicroelectronics Wide-Bandgap (WBG) Power Semiconductor Devices Basic Information
Table 50. STMicroelectronics Wide-Bandgap (WBG) Power Semiconductor Devices Product Overview
Table 51. STMicroelectronics Wide-Bandgap (WBG) Power Semiconductor Devices Sales (K Units), Revenue (M USD), Price (USD/Unit) and Gross Margin (2019-2025)
Table 52. STMicroelectronics Business Overview
Table 53. STMicroelectronics Wide-Bandgap (WBG) Power Semiconductor Devices SWOT Analysis
Table 54. STMicroelectronics Recent Developments
Table 55. Infineon Technologies Wide-Bandgap (WBG) Power Semiconductor Devices Basic Information
Table 56. Infineon Technologies Wide-Bandgap (WBG) Power Semiconductor Devices Product Overview
Table 57. Infineon Technologies Wide-Bandgap (WBG) Power Semiconductor Devices Sales (K Units), Revenue (M USD), Price (USD/Unit) and Gross Margin (2019-2025)
Table 58. Infineon Technologies Wide-Bandgap (WBG) Power Semiconductor Devices SWOT Analysis
Table 59. Infineon Technologies Business Overview
Table 60. Infineon Technologies Recent Developments
Table 61. Microchip Wide-Bandgap (WBG) Power Semiconductor Devices Basic Information
Table 62. Microchip Wide-Bandgap (WBG) Power Semiconductor Devices Product Overview
Table 63. Microchip Wide-Bandgap (WBG) Power Semiconductor Devices Sales (K Units), Revenue (M USD), Price (USD/Unit) and Gross Margin (2019-2025)
Table 64. Microchip Business Overview
Table 65. Microchip Recent Developments
Table 66. TI Wide-Bandgap (WBG) Power Semiconductor Devices Basic Information
Table 67. TI Wide-Bandgap (WBG) Power Semiconductor Devices Product Overview
Table 68. TI Wide-Bandgap (WBG) Power Semiconductor Devices Sales (K Units), Revenue (M USD), Price (USD/Unit) and Gross Margin (2019-2025)
Table 69. TI Business Overview
Table 70. TI Recent Developments
Table 71. Onsemi Wide-Bandgap (WBG) Power Semiconductor Devices Basic Information
Table 72. Onsemi Wide-Bandgap (WBG) Power Semiconductor Devices Product Overview
Table 73. Onsemi Wide-Bandgap (WBG) Power Semiconductor Devices Sales (K Units), Revenue (M USD), Price (USD/Unit) and Gross Margin (2019-2025)
Table 74. Onsemi Business Overview
Table 75. Onsemi Recent Developments
Table 76. ROHM Semiconductor Wide-Bandgap (WBG) Power Semiconductor Devices Basic Information
Table 77. ROHM Semiconductor Wide-Bandgap (WBG) Power Semiconductor Devices Product Overview
Table 78. ROHM Semiconductor Wide-Bandgap (WBG) Power Semiconductor Devices Sales (K Units), Revenue (M USD), Price (USD/Unit) and Gross Margin (2019-2025)
Table 79. ROHM Semiconductor Business Overview
Table 80. ROHM Semiconductor Recent Developments
Table 81. Nexperia Wide-Bandgap (WBG) Power Semiconductor Devices Basic Information
Table 82. Nexperia Wide-Bandgap (WBG) Power Semiconductor Devices Product Overview
Table 83. Nexperia Wide-Bandgap (WBG) Power Semiconductor Devices Sales (K Units), Revenue (M USD), Price (USD/Unit) and Gross Margin (2019-2025)
Table 84. Nexperia Business Overview
Table 85. Nexperia Recent Developments
Table 86. Littelfuse (IXYS) Wide-Bandgap (WBG) Power Semiconductor Devices Basic Information
Table 87. Littelfuse (IXYS) Wide-Bandgap (WBG) Power Semiconductor Devices Product Overview
Table 88. Littelfuse (IXYS) Wide-Bandgap (WBG) Power Semiconductor Devices Sales (K Units), Revenue (M USD), Price (USD/Unit) and Gross Margin (2019-2025)
Table 89. Littelfuse (IXYS) Business Overview
Table 90. Littelfuse (IXYS) Recent Developments
Table 91. Wolfspeed Wide-Bandgap (WBG) Power Semiconductor Devices Basic Information
Table 92. Wolfspeed Wide-Bandgap (WBG) Power Semiconductor Devices Product Overview
Table 93. Wolfspeed Wide-Bandgap (WBG) Power Semiconductor Devices Sales (K Units), Revenue (M USD), Price (USD/Unit) and Gross Margin (2019-2025)
Table 94. Wolfspeed Business Overview
Table 95. Wolfspeed Recent Developments
Table 96. Alpha and Omega Semiconductor Wide-Bandgap (WBG) Power Semiconductor Devices Basic Information
Table 97. Alpha and Omega Semiconductor Wide-Bandgap (WBG) Power Semiconductor Devices Product Overview
Table 98. Alpha and Omega Semiconductor Wide-Bandgap (WBG) Power Semiconductor Devices Sales (K Units), Revenue (M USD), Price (USD/Unit) and Gross Margin (2019-2025)
Table 99. Alpha and Omega Semiconductor Business Overview
Table 100. Alpha and Omega Semiconductor Recent Developments
Table 101. Fuji Electric Wide-Bandgap (WBG) Power Semiconductor Devices Basic Information
Table 102. Fuji Electric Wide-Bandgap (WBG) Power Semiconductor Devices Product Overview
Table 103. Fuji Electric Wide-Bandgap (WBG) Power Semiconductor Devices Sales (K Units), Revenue (M USD), Price (USD/Unit) and Gross Margin (2019-2025)
Table 104. Fuji Electric Business Overview
Table 105. Fuji Electric Recent Developments
Table 106. Diodes Incorporated Wide-Bandgap (WBG) Power Semiconductor Devices Basic Information
Table 107. Diodes Incorporated Wide-Bandgap (WBG) Power Semiconductor Devices Product Overview
Table 108. Diodes Incorporated Wide-Bandgap (WBG) Power Semiconductor Devices Sales (K Units), Revenue (M USD), Price (USD/Unit) and Gross Margin (2019-2025)
Table 109. Diodes Incorporated Business Overview
Table 110. Diodes Incorporated Recent Developments
Table 111. Mitsubishi Electric (Vincotech) Wide-Bandgap (WBG) Power Semiconductor Devices Basic Information
Table 112. Mitsubishi Electric (Vincotech) Wide-Bandgap (WBG) Power Semiconductor Devices Product Overview
Table 113. Mitsubishi Electric (Vincotech) Wide-Bandgap (WBG) Power Semiconductor Devices Sales (K Units), Revenue (M USD), Price (USD/Unit) and Gross Margin (2019-2025)
Table 114. Mitsubishi Electric (Vincotech) Business Overview
Table 115. Mitsubishi Electric (Vincotech) Recent Developments
Table 116. China Resources Microelectronics Limited Wide-Bandgap (WBG) Power Semiconductor Devices Basic Information
Table 117. China Resources Microelectronics Limited Wide-Bandgap (WBG) Power Semiconductor Devices Product Overview
Table 118. China Resources Microelectronics Limited Wide-Bandgap (WBG) Power Semiconductor Devices Sales (K Units), Revenue (M USD), Price (USD/Unit) and Gross Margin (2019-2025)
Table 119. China Resources Microelectronics Limited Business Overview
Table 120. China Resources Microelectronics Limited Recent Developments
Table 121. Yangzhou Yangjie Electronic Technology Wide-Bandgap (WBG) Power Semiconductor Devices Basic Information
Table 122. Yangzhou Yangjie Electronic Technology Wide-Bandgap (WBG) Power Semiconductor Devices Product Overview
Table 123. Yangzhou Yangjie Electronic Technology Wide-Bandgap (WBG) Power Semiconductor Devices Sales (K Units), Revenue (M USD), Price (USD/Unit) and Gross Margin (2019-2025)
Table 124. Yangzhou Yangjie Electronic Technology Business Overview
Table 125. Yangzhou Yangjie Electronic Technology Recent Developments
Table 126. NCEPOWER Wide-Bandgap (WBG) Power Semiconductor Devices Basic Information
Table 127. NCEPOWER Wide-Bandgap (WBG) Power Semiconductor Devices Product Overview
Table 128. NCEPOWER Wide-Bandgap (WBG) Power Semiconductor Devices Sales (K Units), Revenue (M USD), Price (USD/Unit) and Gross Margin (2019-2025)
Table 129. NCEPOWER Business Overview
Table 130. NCEPOWER Recent Developments
Table 131. Hangzhou Silan Microelectronics Wide-Bandgap (WBG) Power Semiconductor Devices Basic Information
Table 132. Hangzhou Silan Microelectronics Wide-Bandgap (WBG) Power Semiconductor Devices Product Overview
Table 133. Hangzhou Silan Microelectronics Wide-Bandgap (WBG) Power Semiconductor Devices Sales (K Units), Revenue (M USD), Price (USD/Unit) and Gross Margin (2019-2025)
Table 134. Hangzhou Silan Microelectronics Business Overview
Table 135. Hangzhou Silan Microelectronics Recent Developments
Table 136. Transphorm Wide-Bandgap (WBG) Power Semiconductor Devices Basic Information
Table 137. Transphorm Wide-Bandgap (WBG) Power Semiconductor Devices Product Overview
Table 138. Transphorm Wide-Bandgap (WBG) Power Semiconductor Devices Sales (K Units), Revenue (M USD), Price (USD/Unit) and Gross Margin (2019-2025)
Table 139. Transphorm Business Overview
Table 140. Transphorm Recent Developments
Table 141. GaN Systems Wide-Bandgap (WBG) Power Semiconductor Devices Basic Information
Table 142. GaN Systems Wide-Bandgap (WBG) Power Semiconductor Devices Product Overview
Table 143. GaN Systems Wide-Bandgap (WBG) Power Semiconductor Devices Sales (K Units), Revenue (M USD), Price (USD/Unit) and Gross Margin (2019-2025)
Table 144. GaN Systems Business Overview
Table 145. GaN Systems Recent Developments
Table 146. Global Wide-Bandgap (WBG) Power Semiconductor Devices Sales Forecast by Region (2025-2030) & (K Units)
Table 147. Global Wide-Bandgap (WBG) Power Semiconductor Devices Market Size Forecast by Region (2025-2030) & (M USD)
Table 148. North America Wide-Bandgap (WBG) Power Semiconductor Devices Sales Forecast by Country (2025-2030) & (K Units)
Table 149. North America Wide-Bandgap (WBG) Power Semiconductor Devices Market Size Forecast by Country (2025-2030) & (M USD)
Table 150. Europe Wide-Bandgap (WBG) Power Semiconductor Devices Sales Forecast by Country (2025-2030) & (K Units)
Table 151. Europe Wide-Bandgap (WBG) Power Semiconductor Devices Market Size Forecast by Country (2025-2030) & (M USD)
Table 152. Asia Pacific Wide-Bandgap (WBG) Power Semiconductor Devices Sales Forecast by Region (2025-2030) & (K Units)
Table 153. Asia Pacific Wide-Bandgap (WBG) Power Semiconductor Devices Market Size Forecast by Region (2025-2030) & (M USD)
Table 154. South America Wide-Bandgap (WBG) Power Semiconductor Devices Sales Forecast by Country (2025-2030) & (K Units)
Table 155. South America Wide-Bandgap (WBG) Power Semiconductor Devices Market Size Forecast by Country (2025-2030) & (M USD)
Table 156. Middle East and Africa Wide-Bandgap (WBG) Power Semiconductor Devices Consumption Forecast by Country (2025-2030) & (Units)
Table 157. Middle East and Africa Wide-Bandgap (WBG) Power Semiconductor Devices Market Size Forecast by Country (2025-2030) & (M USD)
Table 158. Global Wide-Bandgap (WBG) Power Semiconductor Devices Sales Forecast by Type (2025-2030) & (K Units)
Table 159. Global Wide-Bandgap (WBG) Power Semiconductor Devices Market Size Forecast by Type (2025-2030) & (M USD)
Table 160. Global Wide-Bandgap (WBG) Power Semiconductor Devices Price Forecast by Type (2025-2030) & (USD/Unit)
Table 161. Global Wide-Bandgap (WBG) Power Semiconductor Devices Sales (K Units) Forecast by Application (2025-2030)
Table 162. Global Wide-Bandgap (WBG) Power Semiconductor Devices Market Size Forecast by Application (2025-2030) & (M USD)
List of Figures
Figure 1. Product Picture of Wide-Bandgap (WBG) Power Semiconductor Devices
Figure 2. Data Triangulation
Figure 3. Key Caveats
Figure 4. Global Wide-Bandgap (WBG) Power Semiconductor Devices Market Size (M USD), 2026-2034
Figure 5. Global Wide-Bandgap (WBG) Power Semiconductor Devices Market Size (M USD) (2026-2034)
Figure 6. Global Wide-Bandgap (WBG) Power Semiconductor Devices Sales (K Units) & (2026-2034)
Figure 7. Evaluation Matrix of Segment Market Development Potential (Type)
Figure 8. Evaluation Matrix of Segment Market Development Potential (Application)
Figure 9. Evaluation Matrix of Regional Market Development Potential
Figure 10. Wide-Bandgap (WBG) Power Semiconductor Devices Market Size by Country (M USD)
Figure 11. Wide-Bandgap (WBG) Power Semiconductor Devices Sales Share by Manufacturers in 2023
Figure 12. Global Wide-Bandgap (WBG) Power Semiconductor Devices Revenue Share by Manufacturers in 2023
Figure 13. Wide-Bandgap (WBG) Power Semiconductor Devices Market Share by Company Type (Tier 1, Tier 2 and Tier 3): 2023
Figure 14. Global Market Wide-Bandgap (WBG) Power Semiconductor Devices Average Price (USD/Unit) of Key Manufacturers in 2023
Figure 15. The Global 5 and 10 Largest Players: Market Share by Wide-Bandgap (WBG) Power Semiconductor Devices Revenue in 2023
Figure 16. Evaluation Matrix of Segment Market Development Potential (Type)
Figure 17. Global Wide-Bandgap (WBG) Power Semiconductor Devices Market Share by Type
Figure 18. Sales Market Share of Wide-Bandgap (WBG) Power Semiconductor Devices by Type (2019-2025)
Figure 19. Sales Market Share of Wide-Bandgap (WBG) Power Semiconductor Devices by Type in 2023
Figure 20. Market Size Share of Wide-Bandgap (WBG) Power Semiconductor Devices by Type (2019-2025)
Figure 21. Market Size Market Share of Wide-Bandgap (WBG) Power Semiconductor Devices by Type in 2023
Figure 22. Evaluation Matrix of Segment Market Development Potential (Application)
Figure 23. Global Wide-Bandgap (WBG) Power Semiconductor Devices Market Share by Application
Figure 24. Global Wide-Bandgap (WBG) Power Semiconductor Devices Sales Market Share by Application (2019-2025)
Figure 25. Global Wide-Bandgap (WBG) Power Semiconductor Devices Sales Market Share by Application in 2023
Figure 26. Global Wide-Bandgap (WBG) Power Semiconductor Devices Market Share by Application (2019-2025)
Figure 27. Global Wide-Bandgap (WBG) Power Semiconductor Devices Market Share by Application in 2023
Figure 28. Global Wide-Bandgap (WBG) Power Semiconductor Devices Sales Growth Rate by Application (2019-2025)
Figure 29. Global Wide-Bandgap (WBG) Power Semiconductor Devices Sales Market Share by Region (2019-2025)
Figure 30. North America Wide-Bandgap (WBG) Power Semiconductor Devices Sales and Growth Rate (2019-2025) & (K Units)
Figure 31. North America Wide-Bandgap (WBG) Power Semiconductor Devices Sales Market Share by Country in 2023
Figure 32. U.S. Wide-Bandgap (WBG) Power Semiconductor Devices Sales and Growth Rate (2019-2025) & (K Units)
Figure 33. Canada Wide-Bandgap (WBG) Power Semiconductor Devices Sales (K Units) and Growth Rate (2019-2025)
Figure 34. Mexico Wide-Bandgap (WBG) Power Semiconductor Devices Sales (Units) and Growth Rate (2019-2025)
Figure 35. Europe Wide-Bandgap (WBG) Power Semiconductor Devices Sales and Growth Rate (2019-2025) & (K Units)
Figure 36. Europe Wide-Bandgap (WBG) Power Semiconductor Devices Sales Market Share by Country in 2023
Figure 37. Germany Wide-Bandgap (WBG) Power Semiconductor Devices Sales and Growth Rate (2019-2025) & (K Units)
Figure 38. France Wide-Bandgap (WBG) Power Semiconductor Devices Sales and Growth Rate (2019-2025) & (K Units)
Figure 39. U.K. Wide-Bandgap (WBG) Power Semiconductor Devices Sales and Growth Rate (2019-2025) & (K Units)
Figure 40. Italy Wide-Bandgap (WBG) Power Semiconductor Devices Sales and Growth Rate (2019-2025) & (K Units)
Figure 41. Russia Wide-Bandgap (WBG) Power Semiconductor Devices Sales and Growth Rate (2019-2025) & (K Units)
Figure 42. Asia Pacific Wide-Bandgap (WBG) Power Semiconductor Devices Sales and Growth Rate (K Units)
Figure 43. Asia Pacific Wide-Bandgap (WBG) Power Semiconductor Devices Sales Market Share by Region in 2023
Figure 44. China Wide-Bandgap (WBG) Power Semiconductor Devices Sales and Growth Rate (2019-2025) & (K Units)
Figure 45. Japan Wide-Bandgap (WBG) Power Semiconductor Devices Sales and Growth Rate (2019-2025) & (K Units)
Figure 46. South Korea Wide-Bandgap (WBG) Power Semiconductor Devices Sales and Growth Rate (2019-2025) & (K Units)
Figure 47. India Wide-Bandgap (WBG) Power Semiconductor Devices Sales and Growth Rate (2019-2025) & (K Units)
Figure 48. Southeast Asia Wide-Bandgap (WBG) Power Semiconductor Devices Sales and Growth Rate (2019-2025) & (K Units)
Figure 49. South America Wide-Bandgap (WBG) Power Semiconductor Devices Sales and Growth Rate (K Units)
Figure 50. South America Wide-Bandgap (WBG) Power Semiconductor Devices Sales Market Share by Country in 2023
Figure 51. Brazil Wide-Bandgap (WBG) Power Semiconductor Devices Sales and Growth Rate (2019-2025) & (K Units)
Figure 52. Argentina Wide-Bandgap (WBG) Power Semiconductor Devices Sales and Growth Rate (2019-2025) & (K Units)
Figure 53. Columbia Wide-Bandgap (WBG) Power Semiconductor Devices Sales and Growth Rate (2019-2025) & (K Units)
Figure 54. Middle East and Africa Wide-Bandgap (WBG) Power Semiconductor Devices Sales and Growth Rate (K Units)
Figure 55. Middle East and Africa Wide-Bandgap (WBG) Power Semiconductor Devices Sales Market Share by Region in 2023
Figure 56. Saudi Arabia Wide-Bandgap (WBG) Power Semiconductor Devices Sales and Growth Rate (2019-2025) & (K Units)
Figure 57. UAE Wide-Bandgap (WBG) Power Semiconductor Devices Sales and Growth Rate (2019-2025) & (K Units)
Figure 58. Egypt Wide-Bandgap (WBG) Power Semiconductor Devices Sales and Growth Rate (2019-2025) & (K Units)
Figure 59. Nigeria Wide-Bandgap (WBG) Power Semiconductor Devices Sales and Growth Rate (2019-2025) & (K Units)
Figure 60. South Africa Wide-Bandgap (WBG) Power Semiconductor Devices Sales and Growth Rate (2019-2025) & (K Units)
Figure 61. Global Wide-Bandgap (WBG) Power Semiconductor Devices Sales Forecast by Volume (2026-2034) & (K Units)
Figure 62. Global Wide-Bandgap (WBG) Power Semiconductor Devices Market Size Forecast by Value (2026-2034) & (M USD)
Figure 63. Global Wide-Bandgap (WBG) Power Semiconductor Devices Sales Market Share Forecast by Type (2025-2030)
Figure 64. Global Wide-Bandgap (WBG) Power Semiconductor Devices Market Share Forecast by Type (2025-2030)
Figure 65. Global Wide-Bandgap (WBG) Power Semiconductor Devices Sales Forecast by Application (2025-2030)
Figure 66. Global Wide-Bandgap (WBG) Power Semiconductor Devices Market Share Forecast by Application (2025-2030)