WBG Semiconductor Market Analysis:
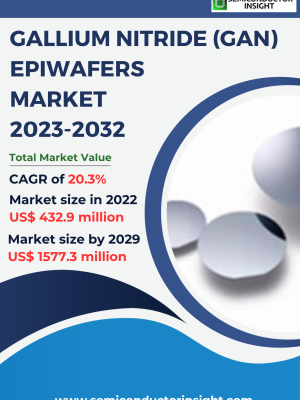
The global WBG Semiconductor Market size was estimated at USD 912.10 million in 2023 and is projected to reach USD 2721.10 million by 2030, exhibiting a CAGR of 16.90% during the forecast period.
North America WBG Semiconductor market size was USD 237.67 million in 2023, at a CAGR of 14.49% during the forecast period of 2025 through 2030.
WBG Semiconductor Market Overview
Wide-bandgap semiconductors (WBG) are semiconductor materials which have a relatively large band gap compared to typical semiconductors.
This report provides a deep insight into the global WBG Semiconductor market covering all its essential aspects. This ranges from a macro overview of the market to micro details of the market size, competitive landscape, development trend, niche market, key market drivers and challenges, SWOT analysis, value chain analysis, etc.
The analysis helps the reader to shape the competition within the industries and strategies for the competitive environment to enhance the potential profit. Furthermore, it provides a simple framework for evaluating and accessing the position of the business organization. The report structure also focuses on the competitive landscape of the Global WBG Semiconductor Market, this report introduces in detail the market share, market performance, product situation, operation situation, etc. of the main players, which helps the readers in the industry to identify the main competitors and deeply understand the competition pattern of the market.
In a word, this report is a must-read for industry players, investors, researchers, consultants, business strategists, and all those who have any kind of stake or are planning to foray into the WBG Semiconductor market in any manner.
WBG Semiconductor Key Market Trends :
- Growing Demand for Electric Vehicles (EVs)
The adoption of EVs is driving demand for wide-bandgap semiconductors due to their efficiency in power conversion and energy savings. - Advancements in 5G Technology
The rapid expansion of 5G networks is boosting the demand for GaN-based semiconductors for high-frequency, high-power applications. - Increasing Use in Renewable Energy Systems
WBG semiconductors are playing a crucial role in solar inverters and wind energy systems, improving energy efficiency. - Rising Investments in Defense and Aerospace
The defense sector is increasingly using SiC and GaN semiconductors in radar, electronic warfare, and satellite systems. - Expanding Industrial Automation and IoT
The growth of Industry 4.0 and IoT applications is fueling the demand for high-performance semiconductor components.
WBG Semiconductor Market Regional Analysis :

-
North America:
Strong demand driven by EVs, 5G infrastructure, and renewable energy, with the U.S. leading the market.
-
Europe:
Growth fueled by automotive electrification, renewable energy, and strong regulatory support, with Germany as a key player.
-
Asia-Pacific:
Dominates the market due to large-scale manufacturing in China and Japan, with growing demand from EVs, 5G, and semiconductors.
-
South America:
Emerging market, driven by renewable energy and EV adoption, with Brazil leading growth.
-
Middle East & Africa:
Gradual growth, mainly due to investments in renewable energy and EV infrastructure, with Saudi Arabia and UAE as key contributors.
WBG Semiconductor Market Segmentation :
The research report includes specific segments by region (country), manufacturers, Type, and Application. Market segmentation creates subsets of a market based on product type, end-user or application, Geographic, and other factors. By understanding the market segments, the decision-maker can leverage this targeting in the product, sales, and marketing strategies. Market segments can power your product development cycles by informing how you create product offerings for different segments.
Key Company
- Mersen
- GaN Systems
- ROHM Semiconductor
- ON Semiconductor
- STMicroelectronics
- Infineon Technologies
- Renesas Electronics Corporation
- NXP Semiconductors
- Fujitsu
- Mitsubishi Electric
Market Segmentation (by Type)
- Silicon Carbide (SiC)
- Gallium Nitride (GaN)
- Aluminum Nitride (AIN)
- Gallium Oxide
- Others
Market Segmentation (by Application)
- Electrical
- Automotive
- Industrial
- Military
- Others
Drivers
- Increasing Adoption of Electric Vehicles (EVs)
The automotive industry is integrating SiC and GaN semiconductors for better energy efficiency and performance. - Rising Demand for Energy-Efficient Devices
Wide-bandgap semiconductors enhance power efficiency, reducing energy consumption in various applications. - Government Support and Funding
Governments worldwide are investing in semiconductor R&D, accelerating market growth.
Restraints
- High Manufacturing Costs
The complex production process of SiC and GaN materials makes them more expensive than traditional silicon-based semiconductors. - Limited Supply Chain and Material Availability
Shortages of high-purity SiC and GaN wafers may slow down production and adoption rates. - Technical Challenges in Integration
The adoption of WBG semiconductors in existing systems requires specialized designs and expertise, making integration challenging.
Opportunities
- Expansion of 5G and Telecommunication Networks
The deployment of 5G infrastructure is creating new opportunities for high-frequency power amplifiers. - Growing Focus on Sustainable Energy Solutions
Increasing demand for renewable energy solutions is pushing the adoption of SiC-based inverters. - Emerging Market in Developing Regions
Countries like India and Brazil are seeing rising demand for WBG semiconductors in various industries.
Challenges
- Lack of Standardization
The industry lacks standardized manufacturing processes, leading to compatibility issues. - Competition from Traditional Silicon Semiconductors
Silicon-based semiconductors still dominate the market due to their lower costs and widespread availability. - Shortage of Skilled Professionals
The design and manufacturing of WBG semiconductors require specialized skills, creating a talent gap in the industry.
Key Benefits of This Market Research:
- Industry drivers, restraints, and opportunities covered in the study
- Neutral perspective on the market performance
- Recent industry trends and developments
- Competitive landscape & strategies of key players
- Potential & niche segments and regions exhibiting promising growth covered
- Historical, current, and projected market size, in terms of value
- In-depth analysis of the WBG Semiconductor Market
- Overview of the regional outlook of the WBG Semiconductor Market:
Key Reasons to Buy this Report:
- Access to date statistics compiled by our researchers. These provide you with historical and forecast data, which is analyzed to tell you why your market is set to change
- This enables you to anticipate market changes to remain ahead of your competitors
- You will be able to copy data from the Excel spreadsheet straight into your marketing plans, business presentations, or other strategic documents
- The concise analysis, clear graph, and table format will enable you to pinpoint the information you require quickly
- Provision of market value (USD Billion) data for each segment and sub-segment
- Indicates the region and segment that is expected to witness the fastest growth as well as to dominate the market
- Provides insight into the market through Value Chain
- Market dynamics scenario, along with growth opportunities of the market in the years to come
- 6-month post-sales analyst support
Customization of the Report
In case of any queries or customization requirements, please connect with our sales team, who will ensure that your requirements are met.
FAQs
Q: What are the key driving factors and opportunities in the WBG Semiconductor Market?
A: The market is driven by EV adoption, energy-efficient devices, and government support. Opportunities lie in 5G, renewable energy, and developing markets.
Q: Which region is projected to have the largest market share?
A: Asia-Pacific is expected to dominate the market due to rapid industrialization, strong semiconductor manufacturing hubs, and increasing demand for electronics.
Q: Who are the top players in the global WBG Semiconductor Market?
A: Leading companies include Infineon Technologies, ON Semiconductor, STMicroelectronics, GaN Systems, and ROHM Semiconductor.
Q: What are the latest technological advancements in the industry?
A: Innovations include higher efficiency SiC MOSFETs, advanced GaN transistors, and integration of AI-driven semiconductor designs.
Q: What is the current size of the global WBG Semiconductor Market?
A: The market was valued at USD 912.10 million in 2023 and is projected to reach USD 2721.10 million by 2030, growing at a CAGR of 16.90%.

Get Sample Report PDF for Exclusive Insights
Report Sample Includes
- Table of Contents
- List of Tables & Figures
- Charts, Research Methodology, and more...