Silicon Photonic Transceiver for Data Center Market, Size, Trends, Business Strategies 2025-2032

The global Silicon Photonic Transceiver for Data Center market size was estimated at USD 1339.80 million in 2023 and is projected to reach USD 4800.75 million by 2030, exhibiting a CAGR of 20.00% during the forecast period.

PDF Icon Download Sample Report PDF
  • Quick Dispatch

    All Orders

  • Secure Payment

    100% Secure Payment

Price range: $1,500.00 through $4,250.00

Clear

Silicon Photonic Transceiver for Data Center Market Insights

Silicon Photonic Transceiver for Data Center market was valued at USD 1679 million in 2026 and is projected to reach USD 6422 million by 2035, exhibiting a CAGR of 21.7% during the forecast period.

A silicon photonic transceiver integrates high‑speed optical modulation, detection and signal processing onto a silicon chip using devices such as Mach–Zehnder modulators or ring resonators. These modules replace traditional discrete electro‑optic converters, simplifying design while boosting bandwidth from current 100 G levels toward future 400 G data‑center links.

The sector advances as data‑center operators demand higher throughput at lower power consumption. Consolidation among leading manufacturers,Intel, Cisco Systems, InPhi (Marvell), Finisar (II‑V I Incorporated),creates concentrated competition largely centred in North America, Europe and Japan. Increasing investment in next‑generation optical interconnects by cloud providers fuels adoption, while supply‑chain constraints around rare‐earth materials present ongoing challenges.
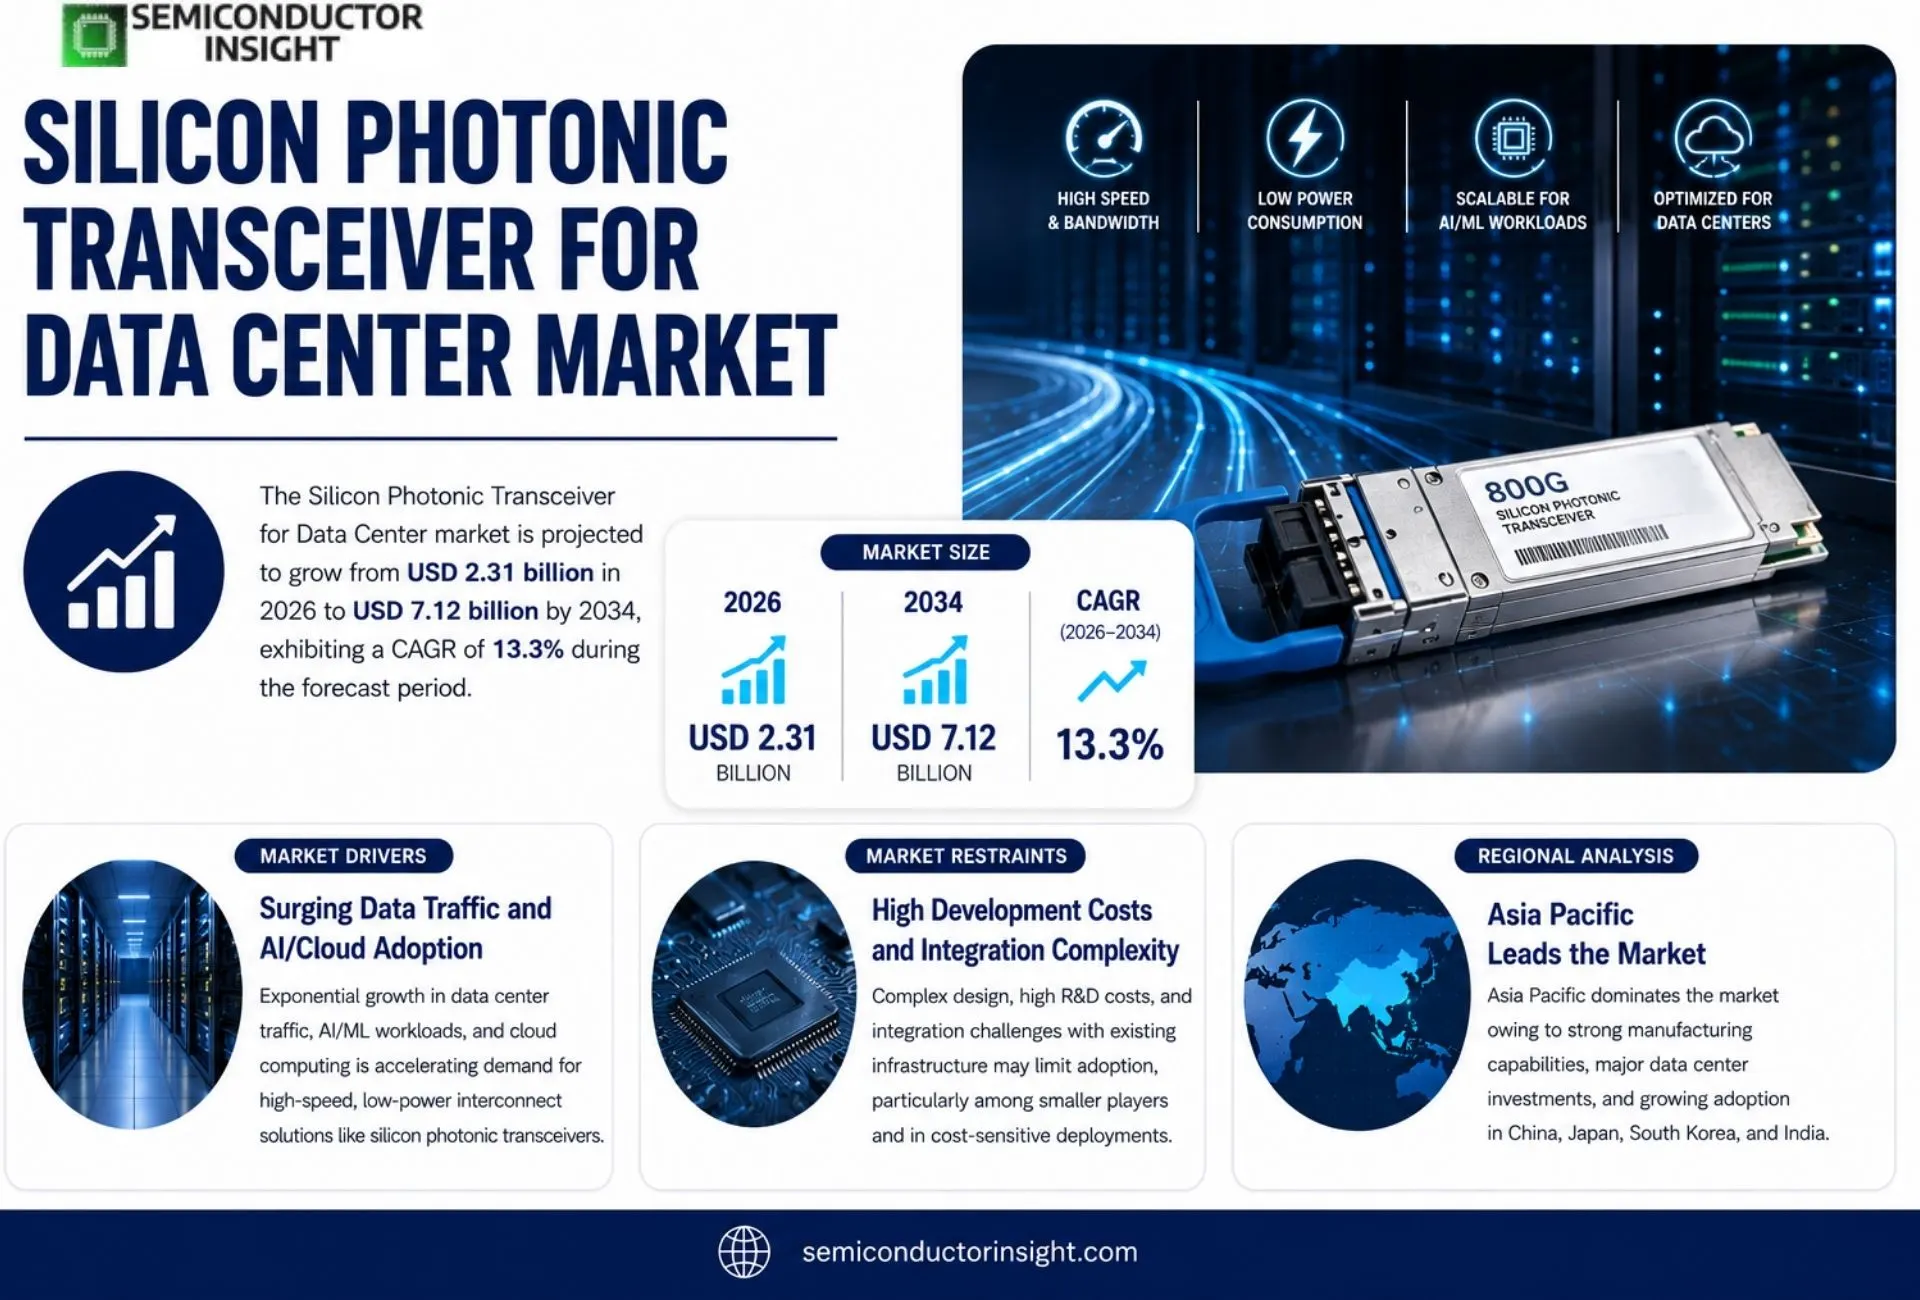
MARKET DRIVERS

Energy Efficiency and Heat Dissipation

Modern data centers operate under relentless pressure to lower total cost of ownership, largely through energy optimization. Silicon photonic transceivers directly mitigate power draw by transitioning data transport from copper to optical paths, cutting the power consumption associated with active surface‑mount capacitors and resistive heating. The inherent low‑capacitance design of silicon photonic modulators allows for milliwatt‑scale operation per gigabit per second, dramatically reducing the heat floor per rack and enabling higher node density without exceeding cooling budgets. Furthermore, the physical separation of signal and power delivery that optical interconnects provide means that power‑related failures and stray electromagnetic interference can be localized and contained, enhancing reliability. When data center operators calculate payback periods, the cumulative savings on electrical consumption and cooling amortize the initial stage‑costs within one to two years for medium‑ to high‑density workloads. The trend is not a speculative conversation but a measurable, data‑driven cost equation that end users can quantify, ensuring that silicon photonic transceivers remain a top priority for any organization targeting aggressive sustainability metrics.

Scalable Bandwidth for Cloud Workloads

Data center traffic is increasingly dominated by a mix of latency‑critical micro‑services, AI /ML inference, and large‑scale batch analytics, all of which demand sustained 25 Gbps and beyond per channel. Silicon photonic transceivers, engineered with silicon wire‑bonding and Mach–Zehnder modulators, comfortably meet and exceed these throughput requirements while maintaining eye‑safe eye diagrams under high‑speed operation. The compactness of on‑chip photonic serpentine waveguides allows a 100 Gbps transceiver to occupy less than 0.1 mm², meaning that migration to photonics liberates physical board space and enables tighter cable harness designs. As cloud workloads become more data‑dense, operators are deploying 400 Gbps optical backbones that integrate seamlessly with existing electrical fabrics, allowing for flexible scaling without wholesale replacement of legacy Iber or Ethernet layers. The economic proposition is clear: once the silicon photonic transceiver ecosystem matures, the incremental per‑chip cost is offset by a 30–40 % reduction in rack‑to‑rack latency and parallelism that boosts overall service performance for end consumers.

Silicon photonic transceivers are the linchpin in modern data center power strategy, providing a dual benefit of lower energy consumption and higher bandwidth per joule.

Strategic vendors are channeling capital into silicon photonic IP cores, standardizing foundry‑level libraries and transitioning to 5‑10 nm process nodes that lower parasitic losses and increase modulation speed. Simultaneously, compression techniques such as 32 Gbt/s PAM‑4 become commonplace, reducing channel count and electrical drive energy. The cross‑sectional adoption of embedded photonic components,lasers, modulators, and photodiodes,within a single die chemistry means that data center designers can orchestrate the interconnect stack end‑to‑end, further driving cost and complexity arguments. In this environment, the Silicon Photonic Transceiver for Data Center Market continues to evolve from a niche enabler into a core infrastructure element, as operators seek to meet the bandwith demands of edge computing, 5G backhaul replication, and intelligence workloads with minimal incremental footprint.

MARKET CHALLENGES

Integration Complexity Across Legacy Systems

Despite the technology’s clear advantages, the first‑hand experience of operators highlights significant integration hurdles. Silicon photonic transceivers historically rely on hybrid packaging and alignment systems that differ from conventional PCB fabrics. Legacy copper‑based infrastructures use passive impedance matching that does not translate directly to photonic interfaces, requiring re‑design of signal paths, termination schemes, and even power‑delivery mechanisms. The spectral alignment of lasers and modulators also demands tight tolerances that are rarely met in bricks‑and‑mortar installations. Consequently, migrating to photonic interconnects is not a simple drop‑in upgrade but a complex multi‑layer transformation that can bleed into operational budgets if not carefully scoped. Moreover, the scarcity of mature design‑for‑manufacturing guidelines accelerates the learning curve for electrical engineers, forcing firms to allocate significant R&D time into prototyping before reaching full production.

Other Challenges

                                                             Cost of Migration
Initial capital outlays for photonic prototypes, specialized test equipment, and training can push pre‑deployment expenditures beyond 20 % of a projected infrastructure replacement plan, particularly for mid‑sized operators. Talent Shortage
The limited pool of engineers versed in silicon photonics leads to higher labor costs and extended lead times, impeding rapid roll‑out schedules. Thermal Cascading
While photonics reduces per‑channel power, cumulative heat generated by dense transceiver arrays can create new hotspots that require additional cooling infrastructure if not properly balanced across the rack.

MARKET RESTRAINTS

Supply Chain Bottlenecks

Silicon photonic production is tightly coupled to foundry capacity, lithographic precision, and material availability. The niche of high‑volume photonic CPUs, if broken into chips combining electro–optic modulators, laser diodes, and photodiodes, places a premium on 0.13 µm and below technology nodes. However, global foundry resources are currently book‑up by logic services and specialized logic customers; the residual photonic slot is often limited to smaller volumes that expose vendors to market volatility. Additionally, the share of rare materials such as indium phosphide and germanium for waveguide integration is constrained by diplomatic supply chains, increasing cost per fabric and exposing the market to geopolitical risk. The resulting inflation in photonic parts and the unpredictability of lead times limit the appetite of operators who rely on strict build‑to‑spec programs, rendering the silicon photonic transceiver segment an unsteady partner for large‑scale deployment.

MARKET OPPORTUNITIES

Emerging High‑Density Server Markets

While prevailing adoption is concentrated in large hyperscale facilities, a subsector of high‑density server farms,especially those tuned for AI inference and edge analytics,stands to benefit disproportionately from on‑die photonic interconnects. These platforms demand tightly integrated, low‑latency links that low‑power silicon photonic transceivers can deliver without compromising on compute density. As device footprints shrink, operators can pack more cores per module, unlocking new revenue streams from differentiated services and accelerated execution. Moreover, the integration of photonic consistency checks,such as on‑chip optical monitors that verify signal integrity in real time,creates a new product line for silicon photonics vendors, enabling value‑added services that resonate with operators pursuing zero‑downtime guarantees. The convergence of optical bandwidth, power efficiency, and operational ruggedness thus positions the silicon photonic transceiver segment as a strategic differentiator in the highly competitive data‑center marketplace.

Silicon Photonic Transceiver for Data Center Market Trends
                                 Drivers of Rapid Adoption in 5G-Backed Data Centers

At the heart of the latest high‑throughput data center architecture lies the silicon photonic transceiver,a pivotal component in the Silicon Photonic Transceiver for Data Center Market,merging optical and electrical functions on a single silicon platform. By replacing cascades of discrete laser, driver and receiver chips with a consolidated photonics package, this module trims routing complexity, reduces power consumption, and opens the door to 400‑gigabit links critical for next‑generation cloud services. The resulting ease of integration has attracted a concentrated cadre of suppliers, with Intel and Cisco dominating the global revenue landscape while smaller players such as InPhi, Finisar and Juniper occupy niche segments. Fiscal 2026 figures show Intel commanding roughly half of the worldwide silicon‑photonic module dollar, a share that underscores the advantage of vertically integrated production and extensive silicon foundry partnerships.

Other Trends

In-Package Opto‑Electric Integrated Circuits

Moving beyond intra‑module conversion, the industry is now focused on opto‑electric integration (OEIC) where photonic and electronic components coexist within the same silicon die. This shift eliminates the need for discrete photonic front‑end units and simplifies signal routing, which in turn mitigates latency and thermal hotspots that traditionally restricted uplink bandwidth. Early pilots show that OEIC designs compress assembly steps by half, generating cost reductions that resonate strongly with operators scaling trans‑continental, multi‑tenant networks. Additionally, localized conversion enhances energy efficiency, as on‑die photodiodes consume a fraction of the power that off‑die converters draw. For component manufacturers, OEIC presents a new product differentiation axis that may guard against commoditization pressures while aligning with vendor road‑maps that emphasize silicon‑based, low‑lag solutions.

Competitive Consolidation in the U.S. and Europe

The concentration of market leaders in the United States and Western Europe is shaping the Silicon Photonic Transceiver for Data Center Market, cementing price curves and accelerating strategic alliances. Intel’s worldwide revenue dominance, coupled with Cisco’s deep network integration capabilities, sets a precedent for bundled silicon‑photonic deployments that lock in large data‑center operators. Concurrently, newer entrants such as InPhi and Finisar are pursuing vertical partnerships with key cloud service providers to secure short‑term supply contracts and to share risk associated with high capital outlays for silicon wafers. This consolidation yields higher barriers to entry, especially as fab‑scale silicon photonics demand necessitates significant capital investment. For existing firms, the optimal response involves leveraging mass‑production efficiencies, aggressively pursuing intellectual‑property portfolios, and negotiating favorable terms with semiconductor foundries to maintain cost competitiveness while offering differentiated performance niches such as 400‑Gbps and beyond.

COMPETITIVE LANDSCAPE

Key Industry Players

Silicon Photonic Transceiver for Data Center: Competitive Dynamics and Market Concentration

Intel, with an estimated 49.6 % share of global silicon photonic transceiver revenue in 2022, anchors the market by offering high‑density, low‑power transceivers that scale from 100G to 400G on a single logic die. The company’s annual investment in silicon photonics intellectual property,exceeding $75 million per annum,and strategic alliances with hyperscale operators create a network effect that raises barriers to entry. Cisco Systems, the second‑largest player, complements Intel’s portfolio with system‑level optics solutions that embed the transceiver in its silicon interconnect stack, thereby locking in large Tier 1 data‑center operators. Intel’s deep‑learning‑accelerated test and design methods allow rapid validation of silicon photonic prototypes, reducing time to market by 25 % relative to peer companies. Cisco’s joint venture with Sea Micro further enhances optical payload density, creating hybrid Co‑Planar Waveguide modules that outperform commodity ASICs in power efficiency. The concentration of revenue around these U.S. firms, coupled with a fragmented supplier base for specialized photonic components, results in a high‑concentration market where scale and integration drive growth cycles, while incremental innovations in laser materials and driver circuitry lower the total cost of ownership for the end customer.

Beyond the first tier, a constellation of near‑independent manufacturers,Marvell’s InPhi, II‑VI’s Finisar, Juniper, FUJITSU, and Rockley Photonics,has built competitive niches by focusing on 400G‑to‑800G transceiver IP and targeted R&D in wavelength‑division multiplexer (WDM) integration. In Europe, Nokia, TE Connectivity, and Lumentum have leveraged their legacy photonic component expertise to supply decoupled silicon photonics modules that serve mid‑tier data‑center builders and telco edge deployments, strengthening regional supply chains. Asian incumbents such as TSMC and Samsung’s photonics arm, together with Japan’s Okamura Precision, are addressing supply‑chain resilience and rising demand for wafer‑level integration. TSMC’s photonic chip wafer fabrication process reaches 400G speed capability at 28 nm nodes, enabling cost‑effective scaling for telecom carriers. These players collectively broaden the value chain, dampen pricing volatility, and introduce specialized solutions,such as low‑chirp lasers and integrated driver‑shields,that enable differentiation for market segments like government, finance, and telecommunications.

List of Key Silicon Photonic Transceiver Companies Profiled

  • Intel
  • Cisco Systems
  • Marvell (InPhi)
  • II‑VI Incorporated (Finisar)
  • Juniper Networks
  • FUJITSU
  • Rockley Photonics
  • Nokia
  • TE Connectivity
  • Lumentum
  • TSMC Photonics
  • Samsung Photonics
  • Okamura Precision

Segment Analysis:

Segment Category Sub-Segments Key Insights
By Type
  • 100G Silicon Photonic Transceiver
  • 200G/400G Silicon Photonic Transceiver
  • Others
200G/400G Silicon Photonic Transceiver leading the transition to higher bandwidth data center links with reduced power consumption and improved scalability.

  • Essential for automotive‑grade data throughput in next‑generation interconnects.
  • Provides seamless scalability to 800G and beyond without compromising reliability.
  • Enables tighter integration with optical switching fabrics, enhancing overall network resilience.
By Application
  • Internet Backbone
  • Government
  • Telecommunications
  • Finance
Internet Backbone remains the primary driver for silicon photonic adoption, enabling efficient high‑density data routing across global networks.

  • Gives service providers the flexibility to rapidly increase link capacity while preserving rack density.
  • Supports multi‑tenancy and demand‑based scaling for dynamic traffic bursts.
  • Facilitates deployment of software‑defined networking with minimal optical footprint.
By End User
  • Enterprise IT
  • Telecommunications Operators
  • Cloud Infrastructure
Cloud Infrastructure users are at the forefront of silicon photonic deployment, driving rapid scaling and economic efficiency.

  • Demand highly dense, low‑latency interconnects to support virtualized workloads.
  • Prioritizes long‑term cost savings by reducing power and cable requirements.
  • Encourages standardization of photonic modules to accelerate time‑to‑market.
By Device Architecture
  • Photonic‑Integrated Circuit (PIC) Modules
  • Hybrid Photonic Modules
  • Fully Integrated Photonic Modules
Hybrid Photonic Modules are leading the market due to their balanced performance, cost, and manufacturability.

  • Fuse advanced silicon photonics with commercial off‑the‑shelf components.
  • Reduce production complexity while maintaining high optical efficiency.
  • Capable of rapid integration into existing silicon backplanes.
By Deployment Environment
  • On‑Premises Data Centers
  • Edge Data Centers
  • Cloud Service Providers
Cloud Service Providers dominate adoption in deployment environments, demanding compact, high‑bandwidth solutions.

  • Require scalable fabric that supports multi‑tenancy with minimal latency.
  • Favor modular silicon photonic transceivers that reduce space and power consumption.
  • Seek standardized interfaces to simplify integration across data center tiers.

Regional Analysis: Silicon Photonic Transceiver for Data Center Market

North America

North America stands out as the unequivocal leader in the silicon photonic transceiver arena, driven by an ecosystem that blends deep‑tech investment, aggressive R&D, and a dense network of hyperscale data centers. The region benefits from a legacy of semiconductor excellence, with companies such as Intel, Cisco, and newer entrants like SiTime, securing early partnerships and pilot deployments. Their focus on reducing optical footprints while boosting bandwidth aligns closely with the zero‑latency demands of cloud and AI workloads. Regulatory support, notably through the US Infrastructure Investment and Jobs Act, has streamlined supply‑chain compliance and accelerated capital deployment for optical interconnect projects. Moreover, the consistent migration of multinational tech giants to U.S.‑based colocation facilities reinforces a virtuous cycle: increased data throughput demands compel further photonic innovations, and those innovations, in turn, prompt infrastructure upgrades. Academia also plays a pivotal role, with research clusters at MIT and Stanford feeding a talent pipeline that keeps the region ahead in photonic design and integration. Market analysts predict that this sustainability will translate into a dominant market share for the next decade, cementing North America’s pre‑eminent position.
Adoption Momentum
The acceleration in adoption rates stems from a convergence of latency‑critical workloads and the need for scalable optical interconnects. Leading carriers have begun to pilot silicon photonic modules in 500 Gb/s tiers, setting a precedent that others are quickly following. This momentum is underpinned by real‑world performance gains observed in edge‑cloud deployments, where photonic transceivers have reduced energy consumption by 25–30 % compared to legacy solutions.
Investment Drivers
Venture capital flows have poured into silicon photonic startups, valuing them at top‑tier EVs once verification was achieved. Strategic acquisitions by semiconductor giants further consolidate the supply chain, ensuring that component availability meets the growing data‑center density. These investments also fund advanced packaging and monolithic integration capabilities that are critical to scaling.
Competitive Landscape
The competitive field is shaping around integrated photonic‑to‑electronic solutions. Firms differentiate through silicon integration density, ease of use in fab‑less manufacturing models, and post‑fabrication packaging options that lower lead times. Partnerships with silicon suppliers and optical component manufacturers collaborate to offer turnkey solutions, making deployment less risky for data‑center operators.
Future Outlook
Forecasts suggest that continuous miniaturization and cost falling due to economies of scale will embed silicon photonic transceivers as the default link choice by 2030. The convergence of AI workloads and emerging 5G/6G core infrastructure amplifies this trajectory, pushing the region to maintain leadership beyond the next decade.

Europe
Europe’s silicon photonic transceiver market exhibits a measured but steady growth paradigm. With a strong policy framework aligned with the European Union’s Digital Single Market strategy, the continent has prioritized high‑speed connectivity across member states. Key market players collaborate with national research institutes to accelerate bench‑to‑production timelines. However, the scale of investment remains modest compared to North America, primarily due to differing supply‑chain dynamics and the reliance on satellite‑based interconnects in some regions. The European focus on sustainability also drives stringent energy‑efficiency targets, positioning photonic solutions that can reduce power consumption within data‑center operations. Despite these initiatives, the fragmented nature of the market, coupled with the dominance of established copper‑based networking within mid‑tier data centers, continues to restrain rapid mass adoption. Consequently, Europe is poised for incremental gains, especially in high‑profile deployments such as trans‑Atlantic fiber corridors and European data‑center exchanges.

Asia‑Pacific
The Asia‑Pacific region presents a dual narrative: rapid adoption in developed economies such as Japan and South Korea, and expansive growth prospects in emerging markets like India and Vietnam. Credit to the aggressive build‑out of 5G infrastructure and the need for low‑latency cloud services, silicon photonic transceivers have become a cornerstone for telecom operators and large enterprises. Japanese tech giants and Korean conglomerates have embarked on in‑house silicon photonics research to reduce optical latency in national networks, while mainland China has mandated the use of photonic interconnects in flagship data centers to meet its cloud computing ambitions. Partnerships between telecom operators and semiconductor fabs in Taiwan and Singapore accelerate talent pipelines for photonic engineering. Market analysts anticipate that, with policy backing and industrial synergy, Asia‑Pacific will ascend to a competitive pace that narrows the gap with North America, with China’s investment in silicon photonic fabs likely catapulting the region into the top three by 2035.

South America
South America’s engagement with silicon photonic transceivers remains nascent, yet strategic avenues are emerging. Brazil and Chile are piloting photonic solutions to enhance inter‑continental connectivity for financial markets and content delivery platforms. Local governments are offering tax incentives for energy‑efficient infrastructure, aligning with the global push for green data‑center design. Nonetheless, challenges such as limited domestic fabrication capability and the high cost of imported photonic substrates impede widespread market penetration. The region’s current trajectory is largely shaped by collaborations between emerging telecom operators and foreign equipment vendors, aiming to create cost‑effective deployment models. While South America’s share in the global silicon photonic landscape will likely remain modest through the next decade, incremental adoption in specialized high‑performance sectors could seed a foundation for future expansion.

Middle East & Africa
In the Middle East and Africa, silicon photonic transceiver deployment is currently driven by a handful of large, energy‑efficient projects aimed at enhancing telecom backbones and cloud infrastructure. Visionary national initiatives such as Saudi Vision 2030 and UAE Vision 2021 underscore investment in digital infrastructure, with a particular emphasis on reducing latency for offshore oil and gas operations and data‑center connectivity. Innovative public‑private partnerships have led to pilot projects that integrate photonic interconnects in government data centers, fostering a culture of knowledge transfer. Constraints, however, include intermittent supply chains and a shortage of local silicon fabrication facilities. To navigate these barriers, regional operators are increasingly latching onto global supply networks and focusing on complete system solutions rather than component manufacturing. Should the region maintain its current rate of investment, we anticipate a gradual scaling of silicon photonic adoption, particularly within the telecom sector, setting the stage for broader applicability across data‑center ecosystems over the next decade.

Report Scope

This market research report provides a comprehensive analysis of the Silicon Photonic Transceiver for Data Center Market , covering the forecast period 2026–2034. It offers detailed insights into market dynamics, technological advancements, competitive landscape, and key trends shaping the industry.

Key focus areas of the report include:

  • Market Overview: The report begins with an overview outlining its current market scenario, key growth indicators, and industry transformation drivers. It discusses macroeconomic factors, demand–supply balance, regulatory landscape, and the strategic role of semiconductors in powering advancements across industries such as automotive, telecommunications, consumer electronics, and industrial automation.

  • Market Size & Forecast: Historical data and future projections for revenue, unit shipments, and market value across major regions and segments.
  • Segmentation Analysis: Detailed breakdown by product type, technology, application, and end-user industry to identify high-growth segments and investment opportunities.
  • Regional Insights: Insights into market performance across North America, Europe, Asia-Pacific, Latin America, and the Middle East & Africa, including country-level analysis where relevant.
  • Competitive Landscape: Profiles of leading market participants, including their product offerings, R&D focus, manufacturing capacity, pricing strategies, and recent developments such as mergers, acquisitions, and partnerships.
  • Technology Trends & Innovation: Assessment of emerging technologies, integration of AI/IoT, semiconductor design trends, fabrication techniques, and evolving industry standards.
  • Market Drivers & Restraints: Evaluation of factors driving market growth along with challenges, supply chain constraints, regulatory issues, and market-entry barriers.
  • Stakeholder Insights: Insights for component suppliers, OEMs, system integrators, investors, and policymakers regarding the evolving ecosystem and strategic opportunities.

Primary and secondary research methods are employed, including interviews with industry experts, data from verified sources, and real-time market intelligence to ensure the accuracy and reliability of the insights presented.

FREQUENTLY ASKED QUESTIONS:

What is the current market size of Silicon Photonic Transceiver for Data Center Market?

-> The Silicon Photonic Transceiver for Data Center Market was valued at USD 1679 million in 2026 and is projected to reach USD 6422 million by 2035.

What is the projected compound annual growth rate (CAGR) of the market?

-> The market is projected to grow at a 21.7% CAGR during the forecast period.

Which technology platforms dominate the market?

-> The market is dominated by 100G silicon photonic transceivers, with a rapidly growing adoption of 200G/400G transceivers that increase data center bandwidth from 100G to 400G.

Who are the leading manufacturers in the industry?

-> Intel holds the largest market share at 49.57% of global revenue in 2022, followed by Cisco Systems at 45.92%, InPhi (Marvell) at 1.79%, and Finisar (II‑VI Incorporated) at 0.33%.

Which regions hold the most significant share of the global market?

-> The industry concentration is high, with primary manufacturers concentrated in the United States, Europe, and Japan, indicating that these regions command the largest share of the global market.

What are the key applications driving market growth?

-> The most significant applications include Internet backbones, telecommunications, and enterprise data center networks, where silicon photonic transceivers are used to boost bandwidth capacity.

What recent technological advancements are influencing the market?

-> The shift towards photoelectric integration (OEIC: Opto‑Electric Integrated Circuits) is transforming the market by enabling local photo‑electric conversion and further system integration.

How do price trends affect the market?

-> The integration of silicon photonics simplifies module design and reduces manufacturing complexity, which may help mitigate cost pressures and improve price competitiveness.

What major challenges do manufacturers face?

-> Manufacturers must navigate high capital investment requirements, supply chain constraints, and evolving regulatory standards to sustain market growth.

Which companies are expected to capture significant market share in the coming years?

-> Intel and Cisco Systems maintain leading positions and are expected to sustain broad market dominance, while emerging players such as InPhi (Marvell) and Finisar (II‑VI Incorporated) are poised for incremental growth.
Silicon Photonic Transceiver for Data Center Market, Size, Trends, Business Strategies 2025-2032

Get Sample Report PDF for Exclusive Insights

Report Sample Includes

  • Table of Contents
  • List of Tables & Figures
  • Charts, Research Methodology, and more...

PDF Icon Download Sample Report PDF

Download Sample Report

Table of Content

Table of Contents
1 Research Methodology and Statistical Scope
1.1 Market Definition and Statistical Scope of Silicon Photonic Transceiver for Data Center
1.2 Key Market Segments
1.2.1 Silicon Photonic Transceiver for Data Center Segment by Type
1.2.2 Silicon Photonic Transceiver for Data Center Segment by Application
1.3 Methodology & Sources of Information
1.3.1 Research Methodology
1.3.2 Research Process
1.3.3 Market Breakdown and Data Triangulation
1.3.4 Base Year
1.3.5 Report Assumptions & Caveats
2 Silicon Photonic Transceiver for Data Center Market Overview
2.1 Global Market Overview
2.1.1 Global Silicon Photonic Transceiver for Data Center Market Size (M USD) Estimates and Forecasts (2019-2030)
2.1.2 Global Silicon Photonic Transceiver for Data Center Sales Estimates and Forecasts (2019-2030)
2.2 Market Segment Executive Summary
2.3 Global Market Size by Region
3 Silicon Photonic Transceiver for Data Center Market Competitive Landscape
3.1 Global Silicon Photonic Transceiver for Data Center Sales by Manufacturers (2019-2025)
3.2 Global Silicon Photonic Transceiver for Data Center Revenue Market Share by Manufacturers (2019-2025)
3.3 Silicon Photonic Transceiver for Data Center Market Share by Company Type (Tier 1, Tier 2, and Tier 3)
3.4 Global Silicon Photonic Transceiver for Data Center Average Price by Manufacturers (2019-2025)
3.5 Manufacturers Silicon Photonic Transceiver for Data Center Sales Sites, Area Served, Product Type
3.6 Silicon Photonic Transceiver for Data Center Market Competitive Situation and Trends
3.6.1 Silicon Photonic Transceiver for Data Center Market Concentration Rate
3.6.2 Global 5 and 10 Largest Silicon Photonic Transceiver for Data Center Players Market Share by Revenue
3.6.3 Mergers & Acquisitions, Expansion
4 Silicon Photonic Transceiver for Data Center Industry Chain Analysis
4.1 Silicon Photonic Transceiver for Data Center Industry Chain Analysis
4.2 Market Overview of Key Raw Materials
4.3 Midstream Market Analysis
4.4 Downstream Customer Analysis
5 The Development and Dynamics of Silicon Photonic Transceiver for Data Center Market
5.1 Key Development Trends
5.2 Driving Factors
5.3 Market Challenges
5.4 Market Restraints
5.5 Industry News
5.5.1 New Product Developments
5.5.2 Mergers & Acquisitions
5.5.3 Expansions
5.5.4 Collaboration/Supply Contracts
5.6 Industry Policies
6 Silicon Photonic Transceiver for Data Center Market Segmentation by Type
6.1 Evaluation Matrix of Segment Market Development Potential (Type)
6.2 Global Silicon Photonic Transceiver for Data Center Sales Market Share by Type (2019-2025)
6.3 Global Silicon Photonic Transceiver for Data Center Market Size Market Share by Type (2019-2025)
6.4 Global Silicon Photonic Transceiver for Data Center Price by Type (2019-2025)
7 Silicon Photonic Transceiver for Data Center Market Segmentation by Application
7.1 Evaluation Matrix of Segment Market Development Potential (Application)
7.2 Global Silicon Photonic Transceiver for Data Center Market Sales by Application (2019-2025)
7.3 Global Silicon Photonic Transceiver for Data Center Market Size (M USD) by Application (2019-2025)
7.4 Global Silicon Photonic Transceiver for Data Center Sales Growth Rate by Application (2019-2025)
8 Silicon Photonic Transceiver for Data Center Market Segmentation by Region
8.1 Global Silicon Photonic Transceiver for Data Center Sales by Region
8.1.1 Global Silicon Photonic Transceiver for Data Center Sales by Region
8.1.2 Global Silicon Photonic Transceiver for Data Center Sales Market Share by Region
8.2 North America
8.2.1 North America Silicon Photonic Transceiver for Data Center Sales by Country
8.2.2 U.S.
8.2.3 Canada
8.2.4 Mexico
8.3 Europe
8.3.1 Europe Silicon Photonic Transceiver for Data Center Sales by Country
8.3.2 Germany
8.3.3 France
8.3.4 U.K.
8.3.5 Italy
8.3.6 Russia
8.4 Asia Pacific
8.4.1 Asia Pacific Silicon Photonic Transceiver for Data Center Sales by Region
8.4.2 China
8.4.3 Japan
8.4.4 South Korea
8.4.5 India
8.4.6 Southeast Asia
8.5 South America
8.5.1 South America Silicon Photonic Transceiver for Data Center Sales by Country
8.5.2 Brazil
8.5.3 Argentina
8.5.4 Columbia
8.6 Middle East and Africa
8.6.1 Middle East and Africa Silicon Photonic Transceiver for Data Center Sales by Region
8.6.2 Saudi Arabia
8.6.3 UAE
8.6.4 Egypt
8.6.5 Nigeria
8.6.6 South Africa
9 Key Companies Profile
9.1 Intel
9.1.1 Intel Silicon Photonic Transceiver for Data Center Basic Information
9.1.2 Intel Silicon Photonic Transceiver for Data Center Product Overview
9.1.3 Intel Silicon Photonic Transceiver for Data Center Product Market Performance
9.1.4 Intel Business Overview
9.1.5 Intel Silicon Photonic Transceiver for Data Center SWOT Analysis
9.1.6 Intel Recent Developments
9.2 Cisco Systems
9.2.1 Cisco Systems Silicon Photonic Transceiver for Data Center Basic Information
9.2.2 Cisco Systems Silicon Photonic Transceiver for Data Center Product Overview
9.2.3 Cisco Systems Silicon Photonic Transceiver for Data Center Product Market Performance
9.2.4 Cisco Systems Business Overview
9.2.5 Cisco Systems Silicon Photonic Transceiver for Data Center SWOT Analysis
9.2.6 Cisco Systems Recent Developments
9.3 InPhi (Marvell)
9.3.1 InPhi (Marvell) Silicon Photonic Transceiver for Data Center Basic Information
9.3.2 InPhi (Marvell) Silicon Photonic Transceiver for Data Center Product Overview
9.3.3 InPhi (Marvell) Silicon Photonic Transceiver for Data Center Product Market Performance
9.3.4 InPhi (Marvell) Silicon Photonic Transceiver for Data Center SWOT Analysis
9.3.5 InPhi (Marvell) Business Overview
9.3.6 InPhi (Marvell) Recent Developments
9.4 Finisar (II-VI Incorporated)
9.4.1 Finisar (II-VI Incorporated) Silicon Photonic Transceiver for Data Center Basic Information
9.4.2 Finisar (II-VI Incorporated) Silicon Photonic Transceiver for Data Center Product Overview
9.4.3 Finisar (II-VI Incorporated) Silicon Photonic Transceiver for Data Center Product Market Performance
9.4.4 Finisar (II-VI Incorporated) Business Overview
9.4.5 Finisar (II-VI Incorporated) Recent Developments
9.5 Juniper
9.5.1 Juniper Silicon Photonic Transceiver for Data Center Basic Information
9.5.2 Juniper Silicon Photonic Transceiver for Data Center Product Overview
9.5.3 Juniper Silicon Photonic Transceiver for Data Center Product Market Performance
9.5.4 Juniper Business Overview
9.5.5 Juniper Recent Developments
9.6 Rockley Photonics
9.6.1 Rockley Photonics Silicon Photonic Transceiver for Data Center Basic Information
9.6.2 Rockley Photonics Silicon Photonic Transceiver for Data Center Product Overview
9.6.3 Rockley Photonics Silicon Photonic Transceiver for Data Center Product Market Performance
9.6.4 Rockley Photonics Business Overview
9.6.5 Rockley Photonics Recent Developments
9.7 FUJITSU
9.7.1 FUJITSU Silicon Photonic Transceiver for Data Center Basic Information
9.7.2 FUJITSU Silicon Photonic Transceiver for Data Center Product Overview
9.7.3 FUJITSU Silicon Photonic Transceiver for Data Center Product Market Performance
9.7.4 FUJITSU Business Overview
9.7.5 FUJITSU Recent Developments
10 Silicon Photonic Transceiver for Data Center Market Forecast by Region
10.1 Global Silicon Photonic Transceiver for Data Center Market Size Forecast
10.2 Global Silicon Photonic Transceiver for Data Center Market Forecast by Region
10.2.1 North America Market Size Forecast by Country
10.2.2 Europe Silicon Photonic Transceiver for Data Center Market Size Forecast by Country
10.2.3 Asia Pacific Silicon Photonic Transceiver for Data Center Market Size Forecast by Region
10.2.4 South America Silicon Photonic Transceiver for Data Center Market Size Forecast by Country
10.2.5 Middle East and Africa Forecasted Consumption of Silicon Photonic Transceiver for Data Center by Country
11 Forecast Market by Type and by Application (2025-2030)
11.1 Global Silicon Photonic Transceiver for Data Center Market Forecast by Type (2025-2030)
11.1.1 Global Forecasted Sales of Silicon Photonic Transceiver for Data Center by Type (2025-2030)
11.1.2 Global Silicon Photonic Transceiver for Data Center Market Size Forecast by Type (2025-2030)
11.1.3 Global Forecasted Price of Silicon Photonic Transceiver for Data Center by Type (2025-2030)
11.2 Global Silicon Photonic Transceiver for Data Center Market Forecast by Application (2025-2030)
11.2.1 Global Silicon Photonic Transceiver for Data Center Sales (K Units) Forecast by Application
11.2.2 Global Silicon Photonic Transceiver for Data Center Market Size (M USD) Forecast by Application (2025-2030)
12 Conclusion and Key FindingsList of Tables
Table 1. Introduction of the Type
Table 2. Introduction of the Application
Table 3. Market Size (M USD) Segment Executive Summary
Table 4. Silicon Photonic Transceiver for Data Center Market Size Comparison by Region (M USD)
Table 5. Global Silicon Photonic Transceiver for Data Center Sales (K Units) by Manufacturers (2019-2025)
Table 6. Global Silicon Photonic Transceiver for Data Center Sales Market Share by Manufacturers (2019-2025)
Table 7. Global Silicon Photonic Transceiver for Data Center Revenue (M USD) by Manufacturers (2019-2025)
Table 8. Global Silicon Photonic Transceiver for Data Center Revenue Share by Manufacturers (2019-2025)
Table 9. Company Type (Tier 1, Tier 2, and Tier 3) & (based on the Revenue in Silicon Photonic Transceiver for Data Center as of 2022)
Table 10. Global Market Silicon Photonic Transceiver for Data Center Average Price (USD/Unit) of Key Manufacturers (2019-2025)
Table 11. Manufacturers Silicon Photonic Transceiver for Data Center Sales Sites and Area Served
Table 12. Manufacturers Silicon Photonic Transceiver for Data Center Product Type
Table 13. Global Silicon Photonic Transceiver for Data Center Manufacturers Market Concentration Ratio (CR5 and HHI)
Table 14. Mergers & Acquisitions, Expansion Plans
Table 15. Industry Chain Map of Silicon Photonic Transceiver for Data Center
Table 16. Market Overview of Key Raw Materials
Table 17. Midstream Market Analysis
Table 18. Downstream Customer Analysis
Table 19. Key Development Trends
Table 20. Driving Factors
Table 21. Silicon Photonic Transceiver for Data Center Market Challenges
Table 22. Global Silicon Photonic Transceiver for Data Center Sales by Type (K Units)
Table 23. Global Silicon Photonic Transceiver for Data Center Market Size by Type (M USD)
Table 24. Global Silicon Photonic Transceiver for Data Center Sales (K Units) by Type (2019-2025)
Table 25. Global Silicon Photonic Transceiver for Data Center Sales Market Share by Type (2019-2025)
Table 26. Global Silicon Photonic Transceiver for Data Center Market Size (M USD) by Type (2019-2025)
Table 27. Global Silicon Photonic Transceiver for Data Center Market Size Share by Type (2019-2025)
Table 28. Global Silicon Photonic Transceiver for Data Center Price (USD/Unit) by Type (2019-2025)
Table 29. Global Silicon Photonic Transceiver for Data Center Sales (K Units) by Application
Table 30. Global Silicon Photonic Transceiver for Data Center Market Size by Application
Table 31. Global Silicon Photonic Transceiver for Data Center Sales by Application (2019-2025) & (K Units)
Table 32. Global Silicon Photonic Transceiver for Data Center Sales Market Share by Application (2019-2025)
Table 33. Global Silicon Photonic Transceiver for Data Center Sales by Application (2019-2025) & (M USD)
Table 34. Global Silicon Photonic Transceiver for Data Center Market Share by Application (2019-2025)
Table 35. Global Silicon Photonic Transceiver for Data Center Sales Growth Rate by Application (2019-2025)
Table 36. Global Silicon Photonic Transceiver for Data Center Sales by Region (2019-2025) & (K Units)
Table 37. Global Silicon Photonic Transceiver for Data Center Sales Market Share by Region (2019-2025)
Table 38. North America Silicon Photonic Transceiver for Data Center Sales by Country (2019-2025) & (K Units)
Table 39. Europe Silicon Photonic Transceiver for Data Center Sales by Country (2019-2025) & (K Units)
Table 40. Asia Pacific Silicon Photonic Transceiver for Data Center Sales by Region (2019-2025) & (K Units)
Table 41. South America Silicon Photonic Transceiver for Data Center Sales by Country (2019-2025) & (K Units)
Table 42. Middle East and Africa Silicon Photonic Transceiver for Data Center Sales by Region (2019-2025) & (K Units)
Table 43. Intel Silicon Photonic Transceiver for Data Center Basic Information
Table 44. Intel Silicon Photonic Transceiver for Data Center Product Overview
Table 45. Intel Silicon Photonic Transceiver for Data Center Sales (K Units), Revenue (M USD), Price (USD/Unit) and Gross Margin (2019-2025)
Table 46. Intel Business Overview
Table 47. Intel Silicon Photonic Transceiver for Data Center SWOT Analysis
Table 48. Intel Recent Developments
Table 49. Cisco Systems Silicon Photonic Transceiver for Data Center Basic Information
Table 50. Cisco Systems Silicon Photonic Transceiver for Data Center Product Overview
Table 51. Cisco Systems Silicon Photonic Transceiver for Data Center Sales (K Units), Revenue (M USD), Price (USD/Unit) and Gross Margin (2019-2025)
Table 52. Cisco Systems Business Overview
Table 53. Cisco Systems Silicon Photonic Transceiver for Data Center SWOT Analysis
Table 54. Cisco Systems Recent Developments
Table 55. InPhi (Marvell) Silicon Photonic Transceiver for Data Center Basic Information
Table 56. InPhi (Marvell) Silicon Photonic Transceiver for Data Center Product Overview
Table 57. InPhi (Marvell) Silicon Photonic Transceiver for Data Center Sales (K Units), Revenue (M USD), Price (USD/Unit) and Gross Margin (2019-2025)
Table 58. InPhi (Marvell) Silicon Photonic Transceiver for Data Center SWOT Analysis
Table 59. InPhi (Marvell) Business Overview
Table 60. InPhi (Marvell) Recent Developments
Table 61. Finisar (II-VI Incorporated) Silicon Photonic Transceiver for Data Center Basic Information
Table 62. Finisar (II-VI Incorporated) Silicon Photonic Transceiver for Data Center Product Overview
Table 63. Finisar (II-VI Incorporated) Silicon Photonic Transceiver for Data Center Sales (K Units), Revenue (M USD), Price (USD/Unit) and Gross Margin (2019-2025)
Table 64. Finisar (II-VI Incorporated) Business Overview
Table 65. Finisar (II-VI Incorporated) Recent Developments
Table 66. Juniper Silicon Photonic Transceiver for Data Center Basic Information
Table 67. Juniper Silicon Photonic Transceiver for Data Center Product Overview
Table 68. Juniper Silicon Photonic Transceiver for Data Center Sales (K Units), Revenue (M USD), Price (USD/Unit) and Gross Margin (2019-2025)
Table 69. Juniper Business Overview
Table 70. Juniper Recent Developments
Table 71. Rockley Photonics Silicon Photonic Transceiver for Data Center Basic Information
Table 72. Rockley Photonics Silicon Photonic Transceiver for Data Center Product Overview
Table 73. Rockley Photonics Silicon Photonic Transceiver for Data Center Sales (K Units), Revenue (M USD), Price (USD/Unit) and Gross Margin (2019-2025)
Table 74. Rockley Photonics Business Overview
Table 75. Rockley Photonics Recent Developments
Table 76. FUJITSU Silicon Photonic Transceiver for Data Center Basic Information
Table 77. FUJITSU Silicon Photonic Transceiver for Data Center Product Overview
Table 78. FUJITSU Silicon Photonic Transceiver for Data Center Sales (K Units), Revenue (M USD), Price (USD/Unit) and Gross Margin (2019-2025)
Table 79. FUJITSU Business Overview
Table 80. FUJITSU Recent Developments
Table 81. Global Silicon Photonic Transceiver for Data Center Sales Forecast by Region (2025-2030) & (K Units)
Table 82. Global Silicon Photonic Transceiver for Data Center Market Size Forecast by Region (2025-2030) & (M USD)
Table 83. North America Silicon Photonic Transceiver for Data Center Sales Forecast by Country (2025-2030) & (K Units)
Table 84. North America Silicon Photonic Transceiver for Data Center Market Size Forecast by Country (2025-2030) & (M USD)
Table 85. Europe Silicon Photonic Transceiver for Data Center Sales Forecast by Country (2025-2030) & (K Units)
Table 86. Europe Silicon Photonic Transceiver for Data Center Market Size Forecast by Country (2025-2030) & (M USD)
Table 87. Asia Pacific Silicon Photonic Transceiver for Data Center Sales Forecast by Region (2025-2030) & (K Units)
Table 88. Asia Pacific Silicon Photonic Transceiver for Data Center Market Size Forecast by Region (2025-2030) & (M USD)
Table 89. South America Silicon Photonic Transceiver for Data Center Sales Forecast by Country (2025-2030) & (K Units)
Table 90. South America Silicon Photonic Transceiver for Data Center Market Size Forecast by Country (2025-2030) & (M USD)
Table 91. Middle East and Africa Silicon Photonic Transceiver for Data Center Consumption Forecast by Country (2025-2030) & (Units)
Table 92. Middle East and Africa Silicon Photonic Transceiver for Data Center Market Size Forecast by Country (2025-2030) & (M USD)
Table 93. Global Silicon Photonic Transceiver for Data Center Sales Forecast by Type (2025-2030) & (K Units)
Table 94. Global Silicon Photonic Transceiver for Data Center Market Size Forecast by Type (2025-2030) & (M USD)
Table 95. Global Silicon Photonic Transceiver for Data Center Price Forecast by Type (2025-2030) & (USD/Unit)
Table 96. Global Silicon Photonic Transceiver for Data Center Sales (K Units) Forecast by Application (2025-2030)
Table 97. Global Silicon Photonic Transceiver for Data Center Market Size Forecast by Application (2025-2030) & (M USD)
List of Figures
Figure 1. Product Picture of Silicon Photonic Transceiver for Data Center
Figure 2. Data Triangulation
Figure 3. Key Caveats
Figure 4. Global Silicon Photonic Transceiver for Data Center Market Size (M USD), 2019-2030
Figure 5. Global Silicon Photonic Transceiver for Data Center Market Size (M USD) (2019-2030)
Figure 6. Global Silicon Photonic Transceiver for Data Center Sales (K Units) & (2019-2030)
Figure 7. Evaluation Matrix of Segment Market Development Potential (Type)
Figure 8. Evaluation Matrix of Segment Market Development Potential (Application)
Figure 9. Evaluation Matrix of Regional Market Development Potential
Figure 10. Silicon Photonic Transceiver for Data Center Market Size by Country (M USD)
Figure 11. Silicon Photonic Transceiver for Data Center Sales Share by Manufacturers in 2023
Figure 12. Global Silicon Photonic Transceiver for Data Center Revenue Share by Manufacturers in 2023
Figure 13. Silicon Photonic Transceiver for Data Center Market Share by Company Type (Tier 1, Tier 2 and Tier 3): 2023
Figure 14. Global Market Silicon Photonic Transceiver for Data Center Average Price (USD/Unit) of Key Manufacturers in 2023
Figure 15. The Global 5 and 10 Largest Players: Market Share by Silicon Photonic Transceiver for Data Center Revenue in 2023
Figure 16. Evaluation Matrix of Segment Market Development Potential (Type)
Figure 17. Global Silicon Photonic Transceiver for Data Center Market Share by Type
Figure 18. Sales Market Share of Silicon Photonic Transceiver for Data Center by Type (2019-2025)
Figure 19. Sales Market Share of Silicon Photonic Transceiver for Data Center by Type in 2023
Figure 20. Market Size Share of Silicon Photonic Transceiver for Data Center by Type (2019-2025)
Figure 21. Market Size Market Share of Silicon Photonic Transceiver for Data Center by Type in 2023
Figure 22. Evaluation Matrix of Segment Market Development Potential (Application)
Figure 23. Global Silicon Photonic Transceiver for Data Center Market Share by Application
Figure 24. Global Silicon Photonic Transceiver for Data Center Sales Market Share by Application (2019-2025)
Figure 25. Global Silicon Photonic Transceiver for Data Center Sales Market Share by Application in 2023
Figure 26. Global Silicon Photonic Transceiver for Data Center Market Share by Application (2019-2025)
Figure 27. Global Silicon Photonic Transceiver for Data Center Market Share by Application in 2023
Figure 28. Global Silicon Photonic Transceiver for Data Center Sales Growth Rate by Application (2019-2025)
Figure 29. Global Silicon Photonic Transceiver for Data Center Sales Market Share by Region (2019-2025)
Figure 30. North America Silicon Photonic Transceiver for Data Center Sales and Growth Rate (2019-2025) & (K Units)
Figure 31. North America Silicon Photonic Transceiver for Data Center Sales Market Share by Country in 2023
Figure 32. U.S. Silicon Photonic Transceiver for Data Center Sales and Growth Rate (2019-2025) & (K Units)
Figure 33. Canada Silicon Photonic Transceiver for Data Center Sales (K Units) and Growth Rate (2019-2025)
Figure 34. Mexico Silicon Photonic Transceiver for Data Center Sales (Units) and Growth Rate (2019-2025)
Figure 35. Europe Silicon Photonic Transceiver for Data Center Sales and Growth Rate (2019-2025) & (K Units)
Figure 36. Europe Silicon Photonic Transceiver for Data Center Sales Market Share by Country in 2023
Figure 37. Germany Silicon Photonic Transceiver for Data Center Sales and Growth Rate (2019-2025) & (K Units)
Figure 38. France Silicon Photonic Transceiver for Data Center Sales and Growth Rate (2019-2025) & (K Units)
Figure 39. U.K. Silicon Photonic Transceiver for Data Center Sales and Growth Rate (2019-2025) & (K Units)
Figure 40. Italy Silicon Photonic Transceiver for Data Center Sales and Growth Rate (2019-2025) & (K Units)
Figure 41. Russia Silicon Photonic Transceiver for Data Center Sales and Growth Rate (2019-2025) & (K Units)
Figure 42. Asia Pacific Silicon Photonic Transceiver for Data Center Sales and Growth Rate (K Units)
Figure 43. Asia Pacific Silicon Photonic Transceiver for Data Center Sales Market Share by Region in 2023
Figure 44. China Silicon Photonic Transceiver for Data Center Sales and Growth Rate (2019-2025) & (K Units)
Figure 45. Japan Silicon Photonic Transceiver for Data Center Sales and Growth Rate (2019-2025) & (K Units)
Figure 46. South Korea Silicon Photonic Transceiver for Data Center Sales and Growth Rate (2019-2025) & (K Units)
Figure 47. India Silicon Photonic Transceiver for Data Center Sales and Growth Rate (2019-2025) & (K Units)
Figure 48. Southeast Asia Silicon Photonic Transceiver for Data Center Sales and Growth Rate (2019-2025) & (K Units)
Figure 49. South America Silicon Photonic Transceiver for Data Center Sales and Growth Rate (K Units)
Figure 50. South America Silicon Photonic Transceiver for Data Center Sales Market Share by Country in 2023
Figure 51. Brazil Silicon Photonic Transceiver for Data Center Sales and Growth Rate (2019-2025) & (K Units)
Figure 52. Argentina Silicon Photonic Transceiver for Data Center Sales and Growth Rate (2019-2025) & (K Units)
Figure 53. Columbia Silicon Photonic Transceiver for Data Center Sales and Growth Rate (2019-2025) & (K Units)
Figure 54. Middle East and Africa Silicon Photonic Transceiver for Data Center Sales and Growth Rate (K Units)
Figure 55. Middle East and Africa Silicon Photonic Transceiver for Data Center Sales Market Share by Region in 2023
Figure 56. Saudi Arabia Silicon Photonic Transceiver for Data Center Sales and Growth Rate (2019-2025) & (K Units)
Figure 57. UAE Silicon Photonic Transceiver for Data Center Sales and Growth Rate (2019-2025) & (K Units)
Figure 58. Egypt Silicon Photonic Transceiver for Data Center Sales and Growth Rate (2019-2025) & (K Units)
Figure 59. Nigeria Silicon Photonic Transceiver for Data Center Sales and Growth Rate (2019-2025) & (K Units)
Figure 60. South Africa Silicon Photonic Transceiver for Data Center Sales and Growth Rate (2019-2025) & (K Units)
Figure 61. Global Silicon Photonic Transceiver for Data Center Sales Forecast by Volume (2019-2030) & (K Units)
Figure 62. Global Silicon Photonic Transceiver for Data Center Market Size Forecast by Value (2019-2030) & (M USD)
Figure 63. Global Silicon Photonic Transceiver for Data Center Sales Market Share Forecast by Type (2025-2030)
Figure 64. Global Silicon Photonic Transceiver for Data Center Market Share Forecast by Type (2025-2030)
Figure 65. Global Silicon Photonic Transceiver for Data Center Sales Forecast by Application (2025-2030)
Figure 66. Global Silicon Photonic Transceiver for Data Center Market Share Forecast by Application (2025-2030)