SEMICONDUCTOR INSIGHT
MARKET RESEARCH REPORT

SiC Based Power Electronics Market

2026 to 2034
MARKET INTELLIGENCE
ACROSS KEY REGIONS
2026 EDITION
POWER ELECTRONICS Semiconductor Market Research

SiC Based Power Electronics Market

Size, Share & Industry Analysis, By Type (SiC MOSFET Module, SiC MOSFET Discrete, SiC SBD, Others), By Application (Automotive & EV/HEV, EV Charging, Industrial Motor/Drive, PV/Energy Storage/Wind Power, UPS/Data Center/Server, Rail Transport, Others), By Voltage Class (Below 650V, 650–1200V, Above 1200V), By End User (Automotive OEMs, Industrial Equipment, Energy & Utilities, Data Centers, Transportation), and Regional Forecast, 2026-2034

◷
UPDATED 12 October 2026
▤
REPORT LENGTH Detailed Report
▣
REPORT CODE 6483250f4ce7
▯
FORMATS PDF

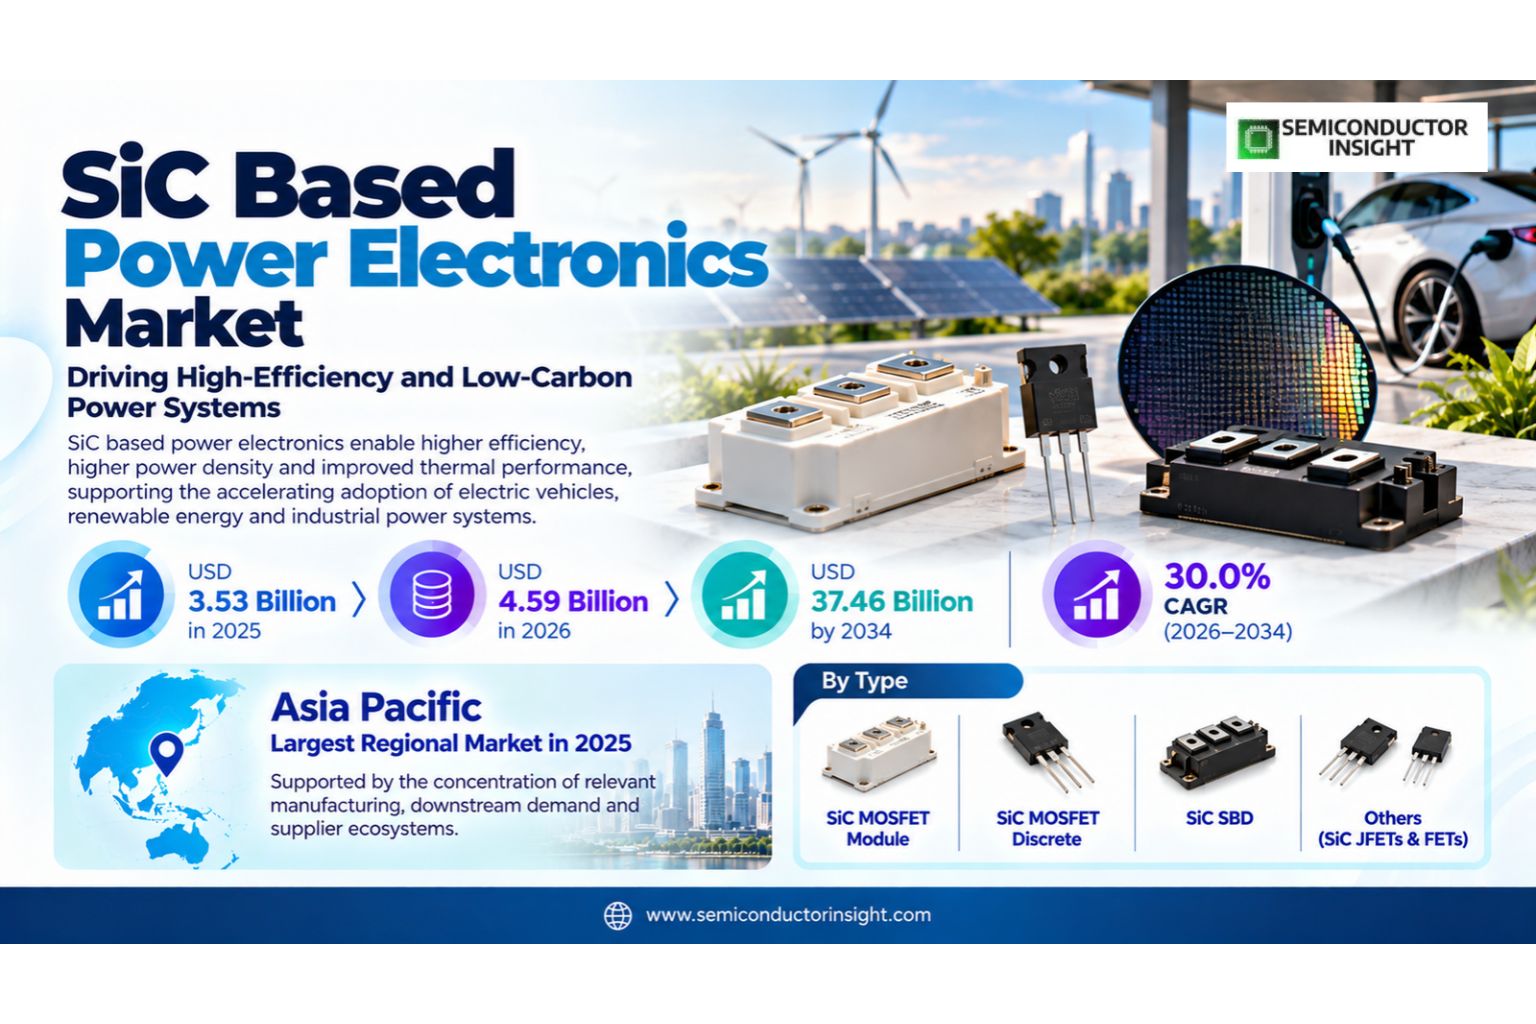
SIC based power electronics market was valued at USD 3.53 billion in 2025, is estimated at USD 4.59 billion in 2026, and is projected to reach USD 37.46 billion by 2034, advancing at a 30.0% CAGR during 2026–2034. Asia Pacific represents the largest regional market in 2025, supported by the concentration of relevant manufacturing, downstream demand and supplier ecosystems.

Get the sample PDF with study scope, segmentation and methodology details.

Key Statistics

2025 Market Size
USD 3.53 billion
2034 Projected Market Size
USD 37.46 billion
CAGR (2026–2034)
30.0%
Largest Market in 2025
Asia Pacific

Key Takeaways

  • SIC based power electronics market was valued at USD 3.53 billion in 2025 and is projected to reach USD 37.46 billion by 2034, representing a 30.0% CAGR over 2026–2034.
  • SiC MOSFET modules are the highest-value segment because traction inverters, fast chargers and industrial converters increasingly require integrated high-voltage switching with optimized thermal and gate-drive behavior.
  • Automotive and EV/HEV applications lead demand, while data-center power conversion and renewable-energy systems are becoming major secondary growth engines as power density and efficiency targets tighten.
  • Asia Pacific leads through EV production and semiconductor manufacturing in China and Japan, while Europe and North America are investing heavily in regional 200 mm SiC capacity.
  • The transition from 150 mm to 200 mm is a central structural shift because larger wafers can improve die economics and manufacturing scale, but only if defect density, epitaxy and yield remain tightly controlled.

SiC Based Power Electronics Market Overview

SIC based power electronics market was valued at USD 3.53 billion in 2025, is estimated at USD 4.59 billion in 2026, and is projected to reach USD 37.46 billion by 2034, advancing at a 30.0% CAGR during 2026–2034. Asia Pacific represents the largest regional market in 2025, supported by the concentration of relevant manufacturing, downstream demand and supplier ecosystems.

Base year: 2025 · Estimated year: 2026 · Forecast period: 2026–2034 · Values in USD million unless otherwise stated

Silicon carbide power electronics use wide-bandgap SiC material in MOSFETs, Schottky diodes, JFETs and integrated power modules. Compared with conventional silicon devices, SiC can switch faster, operate at higher voltage and temperature, and reduce conduction or switching losses in demanding power-conversion systems.

The market is expanding fastest where system efficiency has direct economic value: electric-vehicle range, charging speed, renewable-energy conversion, industrial motor efficiency and data-center power density. The resulting competition spans substrate quality, epitaxy, wafer fabrication, device architecture, packaging and module integration rather than discrete chips alone.

The commercial structure of the sic based power electronics market is shaped by design qualification, production economics and the interaction between component performance and downstream system requirements. Suppliers that can combine consistent manufacturing, application engineering and supply assurance are better positioned to convert technical eligibility into repeat business. Customer decisions increasingly account for lifecycle continuity, geographic resilience and integration cost, which makes proven process control and ecosystem compatibility as important as nominal product capability.

Segment Analysis: By Type

By type, the SiC Based Power Electronics market is segmented into SiC MOSFET Module, SiC MOSFET Discrete, SiC SBD, Others (SiC JFETs & FETs). MOSFET modules capture the highest system value in traction, charging and industrial applications, while discrete MOSFETs and SBDs remain important for lower-power converters and designs that require flexible topology. JFET and cascode approaches occupy specialized niches. Purchasing decisions vary by performance requirement, qualification burden, integration complexity and lifecycle economics, so suppliers compete on application fit rather than on a single technical specification.

Type Role in the market Demand characteristics
SiC MOSFET Module SiC MOSFET Module addresses a distinct part of the product and process mix. Its commercial position depends on technical fit, manufacturing maturity, integration requirements and customer qualification rather than on headline specifications alone. Demand is strongest where the segment aligns with established customer designs, predictable supply, and measurable system-level performance. Suppliers that can document repeatability, compatibility and lifecycle support are better placed to defend design wins.
SiC MOSFET Discrete SiC MOSFET Discrete addresses a distinct part of the product and process mix. Its commercial position depends on technical fit, manufacturing maturity, integration requirements and customer qualification rather than on headline specifications alone. Demand is strongest where the segment aligns with established customer designs, predictable supply, and measurable system-level performance. Suppliers that can document repeatability, compatibility and lifecycle support are better placed to defend design wins.
SiC SBD SiC SBD addresses a distinct part of the product and process mix. Its commercial position depends on technical fit, manufacturing maturity, integration requirements and customer qualification rather than on headline specifications alone. Demand is strongest where the segment aligns with established customer designs, predictable supply, and measurable system-level performance. Suppliers that can document repeatability, compatibility and lifecycle support are better placed to defend design wins.
Others (SiC JFETs & FETs) Others (SiC JFETs & FETs) addresses a distinct part of the product and process mix. Its commercial position depends on technical fit, manufacturing maturity, integration requirements and customer qualification rather than on headline specifications alone. Demand is strongest where the segment aligns with established customer designs, predictable supply, and measurable system-level performance. Suppliers that can document repeatability, compatibility and lifecycle support are better placed to defend design wins.

Segment Analysis: By Voltage Class

By voltage class, the SiC Based Power Electronics market is segmented into Below 650V, 650–1200V, Above 1200V. 650–1200 V devices form the commercial center of gravity for EVs, solar, industrial drives and server power. Above 1200 V is gaining relevance in grid, rail and heavy industrial applications where silicon losses become more restrictive. Purchasing decisions vary by performance requirement, qualification burden, integration complexity and lifecycle economics, so suppliers compete on application fit rather than on a single technical specification.

Voltage Class Role in the market Demand characteristics
Below 650V Below 650V represents a relevant purchasing and deployment pathway within this market. Commercial attractiveness depends on how well it aligns with customer architecture, supply-chain constraints and required performance. Growth is linked to design-in activity, installed-base transitions and the ability of suppliers to meet qualification, cost and availability requirements over the full product lifecycle.
650–1200V 650–1200V represents a relevant purchasing and deployment pathway within this market. Commercial attractiveness depends on how well it aligns with customer architecture, supply-chain constraints and required performance. Growth is linked to design-in activity, installed-base transitions and the ability of suppliers to meet qualification, cost and availability requirements over the full product lifecycle.
Above 1200V Above 1200V represents a relevant purchasing and deployment pathway within this market. Commercial attractiveness depends on how well it aligns with customer architecture, supply-chain constraints and required performance. Growth is linked to design-in activity, installed-base transitions and the ability of suppliers to meet qualification, cost and availability requirements over the full product lifecycle.

Segment Analysis: By Application

By application, the SiC Based Power Electronics market is segmented into Automotive & EV/HEV, EV Charging, Industrial Motor/Drive, PV, Energy Storage & Wind Power, UPS, Data Center & Server, Rail Transport, Others. Automotive is the largest application because traction inverters and onboard chargers can translate lower switching loss into vehicle range and smaller cooling systems. Renewable energy, data centers and fast charging broaden demand beyond vehicles and reduce reliance on one end market. Purchasing decisions vary by performance requirement, qualification burden, integration complexity and lifecycle economics, so suppliers compete on application fit rather than on a single technical specification.

Application Role in the market Demand characteristics
Automotive & EV/HEV Automotive & EV/HEV creates demand when the underlying system requires the market’s core function at production scale. Procurement is normally tied to platform launches, equipment upgrades, capacity expansion or replacement cycles. Buyers evaluate reliability, qualification time, integration cost and vendor support alongside unit economics. Adoption accelerates when the solution removes a system bottleneck or supports a new performance tier without creating disproportionate redesign risk.
EV Charging EV Charging creates demand when the underlying system requires the market’s core function at production scale. Procurement is normally tied to platform launches, equipment upgrades, capacity expansion or replacement cycles. Buyers evaluate reliability, qualification time, integration cost and vendor support alongside unit economics. Adoption accelerates when the solution removes a system bottleneck or supports a new performance tier without creating disproportionate redesign risk.
Industrial Motor/Drive Industrial Motor/Drive creates demand when the underlying system requires the market’s core function at production scale. Procurement is normally tied to platform launches, equipment upgrades, capacity expansion or replacement cycles. Buyers evaluate reliability, qualification time, integration cost and vendor support alongside unit economics. Adoption accelerates when the solution removes a system bottleneck or supports a new performance tier without creating disproportionate redesign risk.
PV, Energy Storage & Wind Power PV, Energy Storage & Wind Power creates demand when the underlying system requires the market’s core function at production scale. Procurement is normally tied to platform launches, equipment upgrades, capacity expansion or replacement cycles. Buyers evaluate reliability, qualification time, integration cost and vendor support alongside unit economics. Adoption accelerates when the solution removes a system bottleneck or supports a new performance tier without creating disproportionate redesign risk.
UPS, Data Center & Server UPS, Data Center & Server creates demand when the underlying system requires the market’s core function at production scale. Procurement is normally tied to platform launches, equipment upgrades, capacity expansion or replacement cycles. Buyers evaluate reliability, qualification time, integration cost and vendor support alongside unit economics. Adoption accelerates when the solution removes a system bottleneck or supports a new performance tier without creating disproportionate redesign risk.
Rail Transport Rail Transport creates demand when the underlying system requires the market’s core function at production scale. Procurement is normally tied to platform launches, equipment upgrades, capacity expansion or replacement cycles. Buyers evaluate reliability, qualification time, integration cost and vendor support alongside unit economics. Adoption accelerates when the solution removes a system bottleneck or supports a new performance tier without creating disproportionate redesign risk.
Others Others creates demand when the underlying system requires the market’s core function at production scale. Procurement is normally tied to platform launches, equipment upgrades, capacity expansion or replacement cycles. Buyers evaluate reliability, qualification time, integration cost and vendor support alongside unit economics. Adoption accelerates when the solution removes a system bottleneck or supports a new performance tier without creating disproportionate redesign risk.

Segment Analysis: By End User

By end user, the SiC Based Power Electronics market is segmented into Automotive OEMs, Industrial Equipment, Energy & Utilities, Data Centers, Transportation. Automotive OEMs impose the longest qualification and supply commitments, data centers value power density and energy efficiency, and industrial customers prioritize ruggedness, service life and predictable availability. Purchasing decisions vary by performance requirement, qualification burden, integration complexity and lifecycle economics, so suppliers compete on application fit rather than on a single technical specification.

End User Role in the market Demand characteristics
Automotive OEMs Automotive OEMs represents a relevant purchasing and deployment pathway within this market. Commercial attractiveness depends on how well it aligns with customer architecture, supply-chain constraints and required performance. Growth is linked to design-in activity, installed-base transitions and the ability of suppliers to meet qualification, cost and availability requirements over the full product lifecycle.
Industrial Equipment Industrial Equipment represents a relevant purchasing and deployment pathway within this market. Commercial attractiveness depends on how well it aligns with customer architecture, supply-chain constraints and required performance. Growth is linked to design-in activity, installed-base transitions and the ability of suppliers to meet qualification, cost and availability requirements over the full product lifecycle.
Energy & Utilities Energy & Utilities represents a relevant purchasing and deployment pathway within this market. Commercial attractiveness depends on how well it aligns with customer architecture, supply-chain constraints and required performance. Growth is linked to design-in activity, installed-base transitions and the ability of suppliers to meet qualification, cost and availability requirements over the full product lifecycle.
Data Centers Data Centers represents a relevant purchasing and deployment pathway within this market. Commercial attractiveness depends on how well it aligns with customer architecture, supply-chain constraints and required performance. Growth is linked to design-in activity, installed-base transitions and the ability of suppliers to meet qualification, cost and availability requirements over the full product lifecycle.
Transportation Transportation represents a relevant purchasing and deployment pathway within this market. Commercial attractiveness depends on how well it aligns with customer architecture, supply-chain constraints and required performance. Growth is linked to design-in activity, installed-base transitions and the ability of suppliers to meet qualification, cost and availability requirements over the full product lifecycle.

Regional Analysis

Asia Pacific leads the sic based power electronics market in 2025, while regional growth patterns differ according to manufacturing concentration, customer investment cycles, regulation, product mix and supply-chain access. The most important regional distinction is not simply market size; it is the mechanism that converts local investment and end-market demand into qualified purchases.

How does regional demand differ across the sic based power electronics market?

Regional demand for sic based power electronics is structurally uneven because manufacturing assets, design centers, downstream customers and qualification ecosystems are not distributed evenly. Asia Pacific typically has the deepest electronics manufacturing base, North America combines technology development with capital investment, Europe emphasizes reliability and industrial requirements, and emerging regions are more dependent on imported systems. These differences influence vendor selection, inventory policy, service expectations and the pace at which new technologies are adopted.

Region Market position Growth outlook Demand profile Supplier-selection gate
Asia Pacific Largest Very strong EV, device manufacturing and power electronics led Cost, quality and supply scale
North America Strategic capacity hub Strong Materials, EV and data-center led 200mm yield and customer qualification
Europe Automotive and capacity hub Strong EV, industrial and integrated manufacturing led Automotive qualification and fab ramp
South America Emerging Strong from smaller base Renewable-energy and mobility led System cost and imported supply
Middle East & Africa Developing Strong from smaller base Renewable energy, data centers and rail led Project economics and imported supply

Detailed Regional Blocks

Asia Pacific LARGEST MARKET

What defines the Asia Pacific sic based power electronics market?

Asia Pacific leads because China and Japan combine large EV and renewable-energy markets with extensive power-semiconductor manufacturing. Regional device makers, substrate suppliers and module manufacturers are scaling SiC rapidly, making the area both the largest demand center and a major source of global supply. Supplier strategies therefore need to reflect local qualification practices, channel structure, end-market priorities and the availability of technically comparable alternatives rather than treating the region as a uniform extension of global demand.

Market positionLargest
Growth outlookVery strong
Demand profileEV, device manufacturing and power electronics led
Market access gateCost, quality and supply scale
Country / subregion Role Demand logic
China Largest growth engine EVs, chargers, solar and domestic SiC manufacturing drive rapid adoption.
Japan Technology and automotive hub ROHM, Mitsubishi Electric and automotive customers support advanced devices.
South Korea Electronics and mobility demand Automotive and industrial systems create expanding SiC use.

Market instances

STMicroelectronics previously announced a joint venture with Sanan for high-volume 200 mm SiC device manufacturing in China, linking regional demand directly to new manufacturing capacity. For suppliers in Asia Pacific, the commercial implication is a stronger need to align product qualification, account coverage and inventory planning with the local demand mechanism rather than relying on broad global growth assumptions.

China’s scale in EV production and charging infrastructure creates a large addressable market for 650–1200 V SiC MOSFETs and modules. For suppliers in Asia Pacific, the commercial implication is a stronger need to align product qualification, account coverage and inventory planning with the local demand mechanism rather than relying on broad global growth assumptions.

Japanese suppliers continue to invest in SiC materials, devices and modules, supporting both domestic automotive programs and global industrial customers. For suppliers in Asia Pacific, the commercial implication is a stronger need to align product qualification, account coverage and inventory planning with the local demand mechanism rather than relying on broad global growth assumptions.

Full-report coverage for Asia Pacific examines country-level demand, customer concentration, supplier positioning and the technical or commercial requirements that influence qualification. The regional view is designed to distinguish structural demand drivers from short-lived purchasing cycles and to show where market access depends on local manufacturing, distribution, standards, service capability or long-term customer relationships.

North America STRATEGIC CAPACITY HUB

What defines the North America sic based power electronics market?

North America is strategically important because Wolfspeed has invested heavily in vertically integrated 200 mm SiC materials and device production while automotive, renewable-energy and AI data-center demand support high-efficiency power conversion. The region’s challenge is turning new capacity into competitive yield and stable supply. Supplier strategies therefore need to reflect local qualification practices, channel structure, end-market priorities and the availability of technically comparable alternatives rather than treating the region as a uniform extension of global demand.

Market positionStrategic capacity hub
Growth outlookStrong
Demand profileMaterials, EV and data-center led
Market access gate200mm yield and customer qualification
Country / subregion Role Demand logic
United States Materials and device hub Wolfspeed’s 200 mm ecosystem and large EV/data-center markets drive investment.
Canada Clean-energy niche Industrial and renewable applications support selected SiC demand.
Mexico Automotive manufacturing Vehicle production creates downstream module demand.

Market instances

Wolfspeed commercially launched its 200 mm SiC materials portfolio in September 2025, including bare wafers and epitaxy for customer qualification. The move expands access to larger-diameter starting material across automotive, renewable-energy and industrial applications. For suppliers in North America, the commercial implication is a stronger need to align product qualification, account coverage and inventory planning with the local demand mechanism rather than relying on broad global growth assumptions.

Wolfspeed’s 2025 sustainability report states that its John Palmour materials facility is intended to increase materials capacity tenfold and focus on 200 mm wafers, while the Mohawk Valley fab had reached 25% of wafer-start capacity. For suppliers in North America, the commercial implication is a stronger need to align product qualification, account coverage and inventory planning with the local demand mechanism rather than relying on broad global growth assumptions.

In September 2026 Wolfspeed expanded its 200 mm portfolio with a premium n-type substrate aimed at lower defect density and improved wafer-shape stability, showing that material quality remains a competitive lever alongside diameter. For suppliers in North America, the commercial implication is a stronger need to align product qualification, account coverage and inventory planning with the local demand mechanism rather than relying on broad global growth assumptions.

Full-report coverage for North America examines country-level demand, customer concentration, supplier positioning and the technical or commercial requirements that influence qualification. The regional view is designed to distinguish structural demand drivers from short-lived purchasing cycles and to show where market access depends on local manufacturing, distribution, standards, service capability or long-term customer relationships.

Europe AUTOMOTIVE AND CAPACITY HUB

What defines the Europe sic based power electronics market?

Europe is a major SiC market because automotive electrification, industrial drives and renewable energy create strong demand while STMicroelectronics is building a vertically integrated 200 mm SiC campus in Catania. The region combines high-value customers with a strategic goal of greater semiconductor supply resilience. Supplier strategies therefore need to reflect local qualification practices, channel structure, end-market priorities and the availability of technically comparable alternatives rather than treating the region as a uniform extension of global demand.

Market positionAutomotive and capacity hub
Growth outlookStrong
Demand profileEV, industrial and integrated manufacturing led
Market access gateAutomotive qualification and fab ramp
Country / subregion Role Demand logic
Italy Integrated manufacturing hub ST’s Catania campus combines substrate, epitaxy, front-end and module capabilities.
Germany Automotive demand EV OEMs and industrial power electronics create large qualified demand.
France Industrial and energy demand Power conversion and transport systems support SiC adoption.

Market instances

STMicroelectronics is building an integrated 200 mm SiC campus in Catania covering substrate, epitaxy, front-end and module back-end manufacturing. Production is targeted to start in 2026. For suppliers in Europe, the commercial implication is a stronger need to align product qualification, account coverage and inventory planning with the local demand mechanism rather than relying on broad global growth assumptions.

ST states that the Catania site is planned to ramp to as much as 15,000 wafers per week at full build-out by 2033, demonstrating the scale of European commitment to SiC. For suppliers in Europe, the commercial implication is a stronger need to align product qualification, account coverage and inventory planning with the local demand mechanism rather than relying on broad global growth assumptions.

European EV platforms increasingly use SiC in traction inverters where efficiency gains can reduce battery or cooling requirements, supporting premium device qualification. For suppliers in Europe, the commercial implication is a stronger need to align product qualification, account coverage and inventory planning with the local demand mechanism rather than relying on broad global growth assumptions.

Full-report coverage for Europe examines country-level demand, customer concentration, supplier positioning and the technical or commercial requirements that influence qualification. The regional view is designed to distinguish structural demand drivers from short-lived purchasing cycles and to show where market access depends on local manufacturing, distribution, standards, service capability or long-term customer relationships.

South America EMERGING

What defines the South America sic based power electronics market?

South America is an emerging SiC market driven by solar, industrial drives and gradual EV adoption. Brazil is the main demand center, while most devices and modules are imported. Adoption depends on whether higher SiC component cost is offset by smaller cooling systems, lower energy loss or improved converter size.

Market positionEmerging
Growth outlookStrong from smaller base
Demand profileRenewable-energy and mobility led
Market access gateSystem cost and imported supply
Country / subregion Role Demand logic
Brazil Largest regional base Solar, industrial and automotive applications support SiC demand.
Chile Renewable-energy market Solar and storage projects create high-efficiency converter demand.
Argentina Industrial niche Drives and energy systems create selective use.

Market instances

Utility-scale solar and storage projects create demand for high-voltage inverters where SiC efficiency can reduce losses. For suppliers in South America, the commercial implication is a stronger need to align product qualification, account coverage and inventory planning with the local demand mechanism rather than relying on broad global growth assumptions.

EV adoption increases traction and charging demand, although vehicle volume remains well below Asia, Europe and North America. For suppliers in South America, the commercial implication is a stronger need to align product qualification, account coverage and inventory planning with the local demand mechanism rather than relying on broad global growth assumptions.

Import dependence makes total module cost and distributor support important adoption variables for regional equipment makers. For suppliers in South America, the commercial implication is a stronger need to align product qualification, account coverage and inventory planning with the local demand mechanism rather than relying on broad global growth assumptions.

Full-report coverage for South America examines country-level demand, customer concentration, supplier positioning and the technical or commercial requirements that influence qualification. The regional view is designed to distinguish structural demand drivers from short-lived purchasing cycles and to show where market access depends on local manufacturing, distribution, standards, service capability or long-term customer relationships.

Middle East & Africa DEVELOPING

What defines the Middle East & Africa sic based power electronics market?

Middle East and Africa demand is expanding through large solar projects, data centers, rail and industrial infrastructure. Gulf markets have the strongest near-term opportunity because high utilization and hot operating environments can increase the value of efficient high-temperature power electronics. Supplier strategies therefore need to reflect local qualification practices, channel structure, end-market priorities and the availability of technically comparable alternatives rather than treating the region as a uniform extension of global demand.

Market positionDeveloping
Growth outlookStrong from smaller base
Demand profileRenewable energy, data centers and rail led
Market access gateProject economics and imported supply
Country / subregion Role Demand logic
Saudi Arabia Energy and infrastructure demand Solar, storage and new industrial projects support SiC adoption.
United Arab Emirates Data-center and renewable demand Cloud infrastructure and solar projects create high-efficiency power requirements.
South Africa Industrial and grid demand Renewables, mining and transport support selective SiC use.

Market instances

Large solar and storage projects can justify SiC in inverter stages where lower switching loss improves lifetime energy yield. For suppliers in Middle East & Africa, the commercial implication is a stronger need to align product qualification, account coverage and inventory planning with the local demand mechanism rather than relying on broad global growth assumptions.

AI and cloud data-center growth in Gulf markets raises the value of efficient server and UPS power conversion at high rack densities. For suppliers in Middle East & Africa, the commercial implication is a stronger need to align product qualification, account coverage and inventory planning with the local demand mechanism rather than relying on broad global growth assumptions.

Rail and industrial projects create opportunities for high-voltage modules where rugged operation and reduced cooling are commercially valuable. For suppliers in Middle East & Africa, the commercial implication is a stronger need to align product qualification, account coverage and inventory planning with the local demand mechanism rather than relying on broad global growth assumptions.

Full-report coverage for Middle East & Africa examines country-level demand, customer concentration, supplier positioning and the technical or commercial requirements that influence qualification. The regional view is designed to distinguish structural demand drivers from short-lived purchasing cycles and to show where market access depends on local manufacturing, distribution, standards, service capability or long-term customer relationships.

Competitive Landscape

Competition in the sic based power electronics market is determined by technical qualification, manufacturing consistency, customer relationships and the ability to support product lifecycles. Price matters, but it rarely overrides reliability, integration effort or switching cost once a supplier has been designed into a production platform.

The competitive field includes STMicroelectronics, Infineon, Wolfspeed, ROHM, onsemi, BYD Semiconductor, alongside other specialized suppliers. Market share can shift when a vendor gains access to a new platform, expands qualified capacity or introduces a technology that materially improves system performance. Because customer validation can be lengthy, incumbent suppliers often benefit from continuity, while challengers need a clear technical or supply-chain advantage to displace an approved source.

Competitive strategy is increasingly multi-dimensional. Leading suppliers invest in process or product development, application engineering and regional support at the same time, while customers seek second-source options where technically feasible. This creates a market in which differentiation is sustained through documented performance, manufacturing yield, quality systems, responsiveness and the ability to support future roadmap transitions without forcing unnecessary redesigns.

Company Competitive position Primary basis of competition
STMicroelectronics Established global / strategic supplier Competes through product capability, qualification, account access and supply execution.
Infineon Established global / strategic supplier Competes through product capability, qualification, account access and supply execution.
Wolfspeed Established global / strategic supplier Competes through product capability, qualification, account access and supply execution.
ROHM Established global / strategic supplier Competes through product capability, qualification, account access and supply execution.
onsemi Established global / strategic supplier Competes through product capability, qualification, account access and supply execution.
BYD Semiconductor Established global / strategic supplier Competes through product capability, qualification, account access and supply execution.
Microchip Specialist / regional competitor Competes through product capability, qualification, account access and supply execution.
Mitsubishi Electric Specialist / regional competitor Competes through product capability, qualification, account access and supply execution.
Semikron Danfoss Specialist / regional competitor Competes through product capability, qualification, account access and supply execution.
Fuji Electric Specialist / regional competitor Competes through product capability, qualification, account access and supply execution.
Navitas / GeneSiC Specialist / regional competitor Competes through product capability, qualification, account access and supply execution.
Toshiba Specialist / regional competitor Competes through product capability, qualification, account access and supply execution.
Qorvo / UnitedSiC Focused challenger / niche participant Competes through product capability, qualification, account access and supply execution.
San’an Optoelectronics Focused challenger / niche participant Competes through product capability, qualification, account access and supply execution.
Littelfuse Focused challenger / niche participant Competes through product capability, qualification, account access and supply execution.
BASiC Semiconductor Focused challenger / niche participant Competes through product capability, qualification, account access and supply execution.
Nexperia Focused challenger / niche participant Competes through product capability, qualification, account access and supply execution.
Vishay Intertechnology Focused challenger / niche participant Competes through product capability, qualification, account access and supply execution.

Production Capacity Analysis

SiC capacity is constrained by crystal growth, substrate quality, epitaxy and fab yield rather than lithography alone. Material defects propagate into device yield, making vertically integrated supply especially valuable. The migration to 200 mm can improve throughput, but it increases the importance of wafer bow, doping uniformity and low defect density.

North America and Europe are adding major 200 mm capacity while Asia Pacific continues to expand device and module manufacturing. Wolfspeed’s materials and fab investments and ST’s Catania campus illustrate the industry’s shift toward larger wafers and more integrated supply chains.

Capacity should therefore be evaluated on a qualified-output basis rather than as nominal installed capability. A supplier may possess equipment or production lines that appear suitable but still require customer-specific validation, process tuning, test correlation or upstream material qualification. This distinction becomes especially important during demand spikes, when headline capacity can overstate the volume that is immediately available for a particular application, technology generation or reliability class.

Market Dynamics

The sic based power electronics market is being shaped by rising performance requirements and technology transitions on the demand side, while qualification complexity, supply concentration and cost discipline constrain the pace of adoption. The balance of these forces favors suppliers that can solve a measurable system problem without increasing integration risk.

Demand expansion is not uniform across all product variants or customer groups. New technology creates attractive design opportunities, but buyers typically require a clear economic or performance case before changing a qualified architecture. At the same time, supply-chain localization, capacity investment and tighter quality requirements are changing procurement behavior. As a result, growth is likely to concentrate around applications where performance upgrades, manufacturing scale and lifecycle value reinforce one another.

Market Drivers

Four forces provide the strongest support for demand in the sic based power electronics market: performance-driven technology upgrades, expansion of relevant downstream applications, investment in manufacturing or infrastructure, and the need for more resilient supply. Their importance varies by segment, but each creates a direct reason for customers to qualify or purchase additional solutions.

Driver Impact Commercial mechanism
EV traction inverters improve range with lower losses High SiC switching can reduce inverter loss and cooling requirements, improving system efficiency in electric vehicles.
Fast charging requires higher power density High Higher switching frequency can reduce passive-component size and support compact high-power charging hardware.
Renewable-energy conversion rewards efficiency Medium-High Solar, wind and storage systems operate for many hours, making small efficiency gains economically meaningful.
AI data centers increase power-conversion pressure Medium-High Rising rack power density makes lower-loss power supplies and UPS systems more valuable, expanding SiC beyond traditional automotive demand.

EV traction inverters improve range with lower losses

SiC switching can reduce inverter loss and cooling requirements, improving system efficiency in electric vehicles. The commercial effect is strongest where customers can link the technology change to higher throughput, lower power, improved reliability, reduced lifecycle cost or access to a new end-market requirement.

Fast charging requires higher power density

Higher switching frequency can reduce passive-component size and support compact high-power charging hardware. The commercial effect is strongest where customers can link the technology change to higher throughput, lower power, improved reliability, reduced lifecycle cost or access to a new end-market requirement.

Renewable-energy conversion rewards efficiency

Solar, wind and storage systems operate for many hours, making small efficiency gains economically meaningful. The commercial effect is strongest where customers can link the technology change to higher throughput, lower power, improved reliability, reduced lifecycle cost or access to a new end-market requirement.

AI data centers increase power-conversion pressure

Rising rack power density makes lower-loss power supplies and UPS systems more valuable, expanding SiC beyond traditional automotive demand. The commercial effect is strongest where customers can link the technology change to higher throughput, lower power, improved reliability, reduced lifecycle cost or access to a new end-market requirement.

Market Restraints

Growth is moderated by qualification burden, cyclical purchasing, technology substitution and supply-chain risk. These restraints do not eliminate demand, but they can extend sales cycles, limit supplier switching and reduce the speed at which technically superior solutions convert into production revenue.

Restraint Impact Commercial consequence
SiC substrates remain more expensive than silicon High Crystal growth and defect control make SiC starting material costly, placing pressure on device economics.
Yield and defect density matter strongly at 200 mm High Larger wafers improve scale only when crystal quality, epitaxy and fab process control maintain competitive yield.
Silicon and GaN remain alternatives Medium Silicon IGBTs retain cost advantages in many applications, while GaN competes in lower-voltage high-frequency power conversion.
Automotive qualification slows new suppliers Medium OEMs require extended reliability validation and long supply commitments before adopting new SiC devices or modules.

SiC substrates remain more expensive than silicon

Crystal growth and defect control make SiC starting material costly, placing pressure on device economics. Suppliers can mitigate part of this pressure through stronger qualification support, transparent lifecycle planning, dual-source strategies and better alignment between product roadmaps and customer production schedules.

Yield and defect density matter strongly at 200 mm

Larger wafers improve scale only when crystal quality, epitaxy and fab process control maintain competitive yield. Suppliers can mitigate part of this pressure through stronger qualification support, transparent lifecycle planning, dual-source strategies and better alignment between product roadmaps and customer production schedules.

Silicon and GaN remain alternatives

Silicon IGBTs retain cost advantages in many applications, while GaN competes in lower-voltage high-frequency power conversion. Suppliers can mitigate part of this pressure through stronger qualification support, transparent lifecycle planning, dual-source strategies and better alignment between product roadmaps and customer production schedules.

Automotive qualification slows new suppliers

OEMs require extended reliability validation and long supply commitments before adopting new SiC devices or modules. Suppliers can mitigate part of this pressure through stronger qualification support, transparent lifecycle planning, dual-source strategies and better alignment between product roadmaps and customer production schedules.

Market Opportunities

The most attractive opportunities in the sic based power electronics market occur where a technology transition creates measurable value and where suppliers can enter before the customer architecture is locked. Early engagement, application-specific engineering and credible supply planning can convert these windows into durable design positions.

200 mm manufacturing scale

Larger wafers can lower cost per die and improve equipment productivity once defect and yield performance are controlled. The opportunity is strongest for suppliers that can demonstrate performance with production-relevant data, provide engineering support during qualification and maintain a roadmap that gives customers confidence in long-term availability.

AI server and data-center power

High-density power shelves, UPS and bus converters create fast-growing applications outside automotive. The opportunity is strongest for suppliers that can demonstrate performance with production-relevant data, provide engineering support during qualification and maintain a roadmap that gives customers confidence in long-term availability.

Grid and renewable energy

High-voltage SiC can improve inverter efficiency and reduce system size in solar, storage and wind applications. The opportunity is strongest for suppliers that can demonstrate performance with production-relevant data, provide engineering support during qualification and maintain a roadmap that gives customers confidence in long-term availability.

Heavy transport and rail

Higher-voltage modules can reduce losses and cooling in trains, commercial vehicles and charging infrastructure. The opportunity is strongest for suppliers that can demonstrate performance with production-relevant data, provide engineering support during qualification and maintain a roadmap that gives customers confidence in long-term availability.

Supply Chain Analysis

Stage 1
SiC crystal growth and substrates
Stage 2
Epitaxy and device fabrication
Stage 3
Packaging and power modules
Stage 4
Power-system integration

SiC crystal growth and substrates

High-purity SiC boules are grown, sliced and polished into wafers with controlled defect density and doping. Value capture at this stage depends on quality consistency, technical differentiation and the difficulty of substitution. Bottlenecks can propagate downstream when qualification or material compatibility prevents customers from shifting quickly to an alternative supplier.

Epitaxy and device fabrication

Epitaxial layers are deposited before MOSFET, diode or JFET structures are formed in specialized fabs. Value capture at this stage depends on quality consistency, technical differentiation and the difficulty of substitution. Bottlenecks can propagate downstream when qualification or material compatibility prevents customers from shifting quickly to an alternative supplier.

Packaging and power modules

Dies are assembled with advanced interconnect, substrates and cooling into discrete packages or modules. Value capture at this stage depends on quality consistency, technical differentiation and the difficulty of substitution. Bottlenecks can propagate downstream when qualification or material compatibility prevents customers from shifting quickly to an alternative supplier.

Power-system integration

Automotive, charging, renewable, industrial and data-center customers integrate SiC into complete converters and inverters. Value capture at this stage depends on quality consistency, technical differentiation and the difficulty of substitution. Bottlenecks can propagate downstream when qualification or material compatibility prevents customers from shifting quickly to an alternative supplier.

Recent Developments

Recent developments show how technology roadmaps, manufacturing investment and standards are changing the competitive requirements of the sic based power electronics market. The entries below are selected for their direct relevance to product capability, capacity, qualification or downstream adoption rather than for general corporate activity.

September 2026 · Wolfspeed

Wolfspeed announced commercial availability of a premium 200 mm n-type SiC substrate with improved defect density and wafer-shape stability, targeting better device-manufacturing yield. The launch shows that the 200 mm transition is moving from basic diameter scaling toward tighter material quality. Source

September 2025 · Wolfspeed

Wolfspeed commercially launched its 200 mm SiC materials portfolio, including bare wafers and epitaxy for immediate qualification. Wider access to qualified 200 mm material supports customers shifting new device platforms toward larger wafers. Source

2026 · STMicroelectronics

STMicroelectronics’ Catania Silicon Carbide Campus is targeted to begin production in 2026 and integrate substrate, epitaxy, 200 mm front-end fabrication and module back-end assembly on one site, strengthening Europe’s SiC manufacturing base. Source

Report Scope & Segmentation

Report attribute Coverage
Market SiC Based Power Electronics
Base Year 2025
Estimated Year 2026
Forecast Period 2026–2034
2025 Market Size USD 3.53 billion
2026 Estimated Size USD 4.59 billion
2034 Forecast Size USD 37.46 billion
CAGR (2026–2034) 30.0%
Largest Market in 2025 Asia Pacific
By Type SiC MOSFET Module, SiC MOSFET Discrete, SiC SBD, Others (SiC JFETs & FETs)
By Application Automotive & EV/HEV, EV Charging, Industrial Motor/Drive, PV, Energy Storage & Wind Power, UPS, Data Center & Server, Rail Transport, Others
By Voltage Class Below 650V, 650–1200V, Above 1200V
By End User Automotive OEMs, Industrial Equipment, Energy & Utilities, Data Centers, Transportation
Companies Profiled STMicroelectronics, Infineon, Wolfspeed, ROHM, onsemi, BYD Semiconductor, Microchip, Mitsubishi Electric, Semikron Danfoss, Fuji Electric, Navitas / GeneSiC, Toshiba, Qorvo / UnitedSiC, San’an Optoelectronics, Littelfuse, BASiC Semiconductor, Nexperia, Vishay Intertechnology

Frequently Asked Questions

What was the sic based power electronics market size in 2025?

The global sic based power electronics market was valued at USD 3.53 billion in 2025. The 2025 value is the base-year reference used throughout this overview and provides the starting point for comparing the 2026 estimate and the 2034 forecast.

What is the projected sic based power electronics market size in 2034?

The global market is projected to reach USD 37.46 billion by 2034. The forecast reflects the interaction of downstream adoption, technology transitions, production investment and the qualification requirements that shape commercial conversion across the market.

What is the CAGR of the sic based power electronics market from 2026 to 2034?

The sic based power electronics market is expected to expand at a 30.0% CAGR during 2026–2034. Growth will not be uniform across every product or region because customer qualification, capital cycles, supply constraints and application-specific performance requirements differ materially.

Which region is the largest sic based power electronics market?

Asia Pacific is the largest regional market in 2025. Its position is supported by the concentration of relevant manufacturing, customers, technology ecosystems and downstream demand, although the precise commercial mechanism differs by country and application.

How is the sic based power electronics market segmented by type?

By type, the market is segmented into SiC MOSFET Module, SiC MOSFET Discrete, SiC SBD, Others (SiC JFETs & FETs). These categories address different performance, cost and integration requirements, so supplier selection depends on application fit, qualification history and lifecycle economics rather than a single specification.

What are the main applications for sic based power electronics?

By application, the market covers Automotive & EV/HEV, EV Charging, Industrial Motor/Drive, PV, Energy Storage & Wind Power, UPS, Data Center & Server, Rail Transport, Others. Demand in each application is linked to platform launches, capacity expansion, equipment replacement and the degree to which the technology improves system performance or manufacturing economics.

What are the principal growth drivers for the sic based power electronics market?

Key drivers include ev traction inverters improve range with lower losses and fast charging requires higher power density. These forces increase demand when customers can translate technical improvements into higher performance, lower cost, greater reliability or access to new applications.

What are the main restraints in the sic based power electronics market?

Important restraints include sic substrates remain more expensive than silicon and yield and defect density matter strongly at 200 mm. The resulting qualification burden, purchasing cyclicality and technology risk can extend sales cycles and limit rapid supplier substitution even when new solutions offer clear technical advantages.

Which companies participate in the sic based power electronics market?

Companies profiled in this market include STMicroelectronics, Infineon, Wolfspeed, ROHM, onsemi, BYD Semiconductor, Microchip, Mitsubishi Electric. Competition centers on qualification, product or process performance, manufacturing consistency, customer support and the ability to maintain supply across the required product lifecycle.

What should buyers evaluate when selecting a sic based power electronics supplier?

Buyers should evaluate demonstrated performance, qualification history, manufacturing consistency, lifecycle support, supply resilience and integration cost. A technically strong product can still face adoption barriers if it increases redesign risk, lacks regional support or cannot meet the customer’s production and quality requirements.

Research Sources & Evidence Base

View research sources used for this overview.
  1. Wolfspeed. Commercial launch of 200 mm SiC materials — 200 mm bare wafers, epitaxy and qualification for automotive, renewable and industrial applications.
  2. Wolfspeed. 2025 Sustainability Report — 200 mm materials and device capacity, John Palmour facility and Mohawk Valley ramp context.
  3. Wolfspeed. Premium 200 mm n-type SiC substrate — 2026 material-quality improvements for device yield.
  4. STMicroelectronics. Integrated Silicon Carbide Campus in Catania — 200 mm substrate, epitaxy, front-end and module manufacturing capacity.

SiC Based Power Electronics Market Size, Share & Industry Analysis, By Type (SiC MOSFET Module, SiC MOSFET Discrete, SiC SBD, Others), By Application (Automotive & EV/HEV, EV Charging, Industrial Motor/Drive, PV/Energy Storage/Wind Power, UPS/Data Center/Server, Rail Transport, Others), By Voltage Class (Below 650V, 650–1200V, Above 1200V), By End User (Automotive OEMs, Industrial Equipment, Energy & Utilities, Data Centers, Transportation), and Regional Forecast, 2026-2034

Get Sample Report PDF for Exclusive Insights

Report Sample Includes

  • Table of Contents
  • List of Tables & Figures
  • Charts, Research Methodology, and more...
Download Sample Report PDF

Download Sample Report

Table of Content

Table of Contents
1 Research Methodology and Statistical Scope
1.1 Market Definition and Statistical Scope of SiC Based Power Electronics
1.2 Key Market Segments
1.2.1 SiC Based Power Electronics Segment by Type
1.2.2 SiC Based Power Electronics Segment by Application
1.3 Methodology & Sources of Information
1.3.1 Research Methodology
1.3.2 Research Process
1.3.3 Market Breakdown and Data Triangulation
1.3.4 Base Year
1.3.5 Report Assumptions & Caveats
2 SiC Based Power Electronics Market Overview
2.1 Global Market Overview
2.1.1 Global SiC Based Power Electronics Market Size (M USD) Estimates and Forecasts (2026-2034)
2.1.2 Global SiC Based Power Electronics Sales Estimates and Forecasts (2026-2034)
2.2 Market Segment Executive Summary
2.3 Global Market Size by Region
3 SiC Based Power Electronics Market Competitive Landscape
3.1 Global SiC Based Power Electronics Sales by Manufacturers (2019-2025)
3.2 Global SiC Based Power Electronics Revenue Market Share by Manufacturers (2019-2025)
3.3 SiC Based Power Electronics Market Share by Company Type (Tier 1, Tier 2, and Tier 3)
3.4 Global SiC Based Power Electronics Average Price by Manufacturers (2019-2025)
3.5 Manufacturers SiC Based Power Electronics Sales Sites, Area Served, Product Type
3.6 SiC Based Power Electronics Market Competitive Situation and Trends
3.6.1 SiC Based Power Electronics Market Concentration Rate
3.6.2 Global 5 and 10 Largest SiC Based Power Electronics Players Market Share by Revenue
3.6.3 Mergers & Acquisitions, Expansion
4 SiC Based Power Electronics Industry Chain Analysis
4.1 SiC Based Power Electronics Industry Chain Analysis
4.2 Market Overview of Key Raw Materials
4.3 Midstream Market Analysis
4.4 Downstream Customer Analysis
5 The Development and Dynamics of SiC Based Power Electronics Market
5.1 Key Development Trends
5.2 Driving Factors
5.3 Market Challenges
5.4 Market Restraints
5.5 Industry News
5.5.1 New Product Developments
5.5.2 Mergers & Acquisitions
5.5.3 Expansions
5.5.4 Collaboration/Supply Contracts
5.6 Industry Policies
6 SiC Based Power Electronics Market Segmentation by Type
6.1 Evaluation Matrix of Segment Market Development Potential (Type)
6.2 Global SiC Based Power Electronics Sales Market Share by Type (2019-2025)
6.3 Global SiC Based Power Electronics Market Size Market Share by Type (2019-2025)
6.4 Global SiC Based Power Electronics Price by Type (2019-2025)
7 SiC Based Power Electronics Market Segmentation by Application
7.1 Evaluation Matrix of Segment Market Development Potential (Application)
7.2 Global SiC Based Power Electronics Market Sales by Application (2019-2025)
7.3 Global SiC Based Power Electronics Market Size (M USD) by Application (2019-2025)
7.4 Global SiC Based Power Electronics Sales Growth Rate by Application (2019-2025)
8 SiC Based Power Electronics Market Segmentation by Region
8.1 Global SiC Based Power Electronics Sales by Region
8.1.1 Global SiC Based Power Electronics Sales by Region
8.1.2 Global SiC Based Power Electronics Sales Market Share by Region
8.2 North America
8.2.1 North America SiC Based Power Electronics Sales by Country
8.2.2 U.S.
8.2.3 Canada
8.2.4 Mexico
8.3 Europe
8.3.1 Europe SiC Based Power Electronics Sales by Country
8.3.2 Germany
8.3.3 France
8.3.4 U.K.
8.3.5 Italy
8.3.6 Russia
8.4 Asia Pacific
8.4.1 Asia Pacific SiC Based Power Electronics Sales by Region
8.4.2 China
8.4.3 Japan
8.4.4 South Korea
8.4.5 India
8.4.6 Southeast Asia
8.5 South America
8.5.1 South America SiC Based Power Electronics Sales by Country
8.5.2 Brazil
8.5.3 Argentina
8.5.4 Columbia
8.6 Middle East and Africa
8.6.1 Middle East and Africa SiC Based Power Electronics Sales by Region
8.6.2 Saudi Arabia
8.6.3 UAE
8.6.4 Egypt
8.6.5 Nigeria
8.6.6 South Africa
9 Key Companies Profile
9.1 STMicroelectronics
9.1.1 STMicroelectronics SiC Based Power Electronics Basic Information
9.1.2 STMicroelectronics SiC Based Power Electronics Product Overview
9.1.3 STMicroelectronics SiC Based Power Electronics Product Market Performance
9.1.4 STMicroelectronics Business Overview
9.1.5 STMicroelectronics SiC Based Power Electronics SWOT Analysis
9.1.6 STMicroelectronics Recent Developments
9.2 Infineon
9.2.1 Infineon SiC Based Power Electronics Basic Information
9.2.2 Infineon SiC Based Power Electronics Product Overview
9.2.3 Infineon SiC Based Power Electronics Product Market Performance
9.2.4 Infineon Business Overview
9.2.5 Infineon SiC Based Power Electronics SWOT Analysis
9.2.6 Infineon Recent Developments
9.3 Wolfspeed
9.3.1 Wolfspeed SiC Based Power Electronics Basic Information
9.3.2 Wolfspeed SiC Based Power Electronics Product Overview
9.3.3 Wolfspeed SiC Based Power Electronics Product Market Performance
9.3.4 Wolfspeed SiC Based Power Electronics SWOT Analysis
9.3.5 Wolfspeed Business Overview
9.3.6 Wolfspeed Recent Developments
9.4 Rohm
9.4.1 Rohm SiC Based Power Electronics Basic Information
9.4.2 Rohm SiC Based Power Electronics Product Overview
9.4.3 Rohm SiC Based Power Electronics Product Market Performance
9.4.4 Rohm Business Overview
9.4.5 Rohm Recent Developments
9.5 onsemi
9.5.1 onsemi SiC Based Power Electronics Basic Information
9.5.2 onsemi SiC Based Power Electronics Product Overview
9.5.3 onsemi SiC Based Power Electronics Product Market Performance
9.5.4 onsemi Business Overview
9.5.5 onsemi Recent Developments
9.6 BYD Semiconductor
9.6.1 BYD Semiconductor SiC Based Power Electronics Basic Information
9.6.2 BYD Semiconductor SiC Based Power Electronics Product Overview
9.6.3 BYD Semiconductor SiC Based Power Electronics Product Market Performance
9.6.4 BYD Semiconductor Business Overview
9.6.5 BYD Semiconductor Recent Developments
9.7 Microchip (Microsemi)
9.7.1 Microchip (Microsemi) SiC Based Power Electronics Basic Information
9.7.2 Microchip (Microsemi) SiC Based Power Electronics Product Overview
9.7.3 Microchip (Microsemi) SiC Based Power Electronics Product Market Performance
9.7.4 Microchip (Microsemi) Business Overview
9.7.5 Microchip (Microsemi) Recent Developments
9.8 Mitsubishi Electric (Vincotech)
9.8.1 Mitsubishi Electric (Vincotech) SiC Based Power Electronics Basic Information
9.8.2 Mitsubishi Electric (Vincotech) SiC Based Power Electronics Product Overview
9.8.3 Mitsubishi Electric (Vincotech) SiC Based Power Electronics Product Market Performance
9.8.4 Mitsubishi Electric (Vincotech) Business Overview
9.8.5 Mitsubishi Electric (Vincotech) Recent Developments
9.9 Semikron Danfoss
9.9.1 Semikron Danfoss SiC Based Power Electronics Basic Information
9.9.2 Semikron Danfoss SiC Based Power Electronics Product Overview
9.9.3 Semikron Danfoss SiC Based Power Electronics Product Market Performance
9.9.4 Semikron Danfoss Business Overview
9.9.5 Semikron Danfoss Recent Developments
9.10 Fuji Electric
9.10.1 Fuji Electric SiC Based Power Electronics Basic Information
9.10.2 Fuji Electric SiC Based Power Electronics Product Overview
9.10.3 Fuji Electric SiC Based Power Electronics Product Market Performance
9.10.4 Fuji Electric Business Overview
9.10.5 Fuji Electric Recent Developments
9.11 Navitas (GeneSiC)
9.11.1 Navitas (GeneSiC) SiC Based Power Electronics Basic Information
9.11.2 Navitas (GeneSiC) SiC Based Power Electronics Product Overview
9.11.3 Navitas (GeneSiC) SiC Based Power Electronics Product Market Performance
9.11.4 Navitas (GeneSiC) Business Overview
9.11.5 Navitas (GeneSiC) Recent Developments
9.12 Toshiba
9.12.1 Toshiba SiC Based Power Electronics Basic Information
9.12.2 Toshiba SiC Based Power Electronics Product Overview
9.12.3 Toshiba SiC Based Power Electronics Product Market Performance
9.12.4 Toshiba Business Overview
9.12.5 Toshiba Recent Developments
9.13 Qorvo (UnitedSiC)
9.13.1 Qorvo (UnitedSiC) SiC Based Power Electronics Basic Information
9.13.2 Qorvo (UnitedSiC) SiC Based Power Electronics Product Overview
9.13.3 Qorvo (UnitedSiC) SiC Based Power Electronics Product Market Performance
9.13.4 Qorvo (UnitedSiC) Business Overview
9.13.5 Qorvo (UnitedSiC) Recent Developments
9.14 San’an Optoelectronics
9.14.1 San’an Optoelectronics SiC Based Power Electronics Basic Information
9.14.2 San’an Optoelectronics SiC Based Power Electronics Product Overview
9.14.3 San’an Optoelectronics SiC Based Power Electronics Product Market Performance
9.14.4 San’an Optoelectronics Business Overview
9.14.5 San’an Optoelectronics Recent Developments
9.15 Littelfuse (IXYS)
9.15.1 Littelfuse (IXYS) SiC Based Power Electronics Basic Information
9.15.2 Littelfuse (IXYS) SiC Based Power Electronics Product Overview
9.15.3 Littelfuse (IXYS) SiC Based Power Electronics Product Market Performance
9.15.4 Littelfuse (IXYS) Business Overview
9.15.5 Littelfuse (IXYS) Recent Developments
9.16 CETC 55
9.16.1 CETC 55 SiC Based Power Electronics Basic Information
9.16.2 CETC 55 SiC Based Power Electronics Product Overview
9.16.3 CETC 55 SiC Based Power Electronics Product Market Performance
9.16.4 CETC 55 Business Overview
9.16.5 CETC 55 Recent Developments
9.17 WeEn Semiconductors
9.17.1 WeEn Semiconductors SiC Based Power Electronics Basic Information
9.17.2 WeEn Semiconductors SiC Based Power Electronics Product Overview
9.17.3 WeEn Semiconductors SiC Based Power Electronics Product Market Performance
9.17.4 WeEn Semiconductors Business Overview
9.17.5 WeEn Semiconductors Recent Developments
9.18 BASiC Semiconductor
9.18.1 BASiC Semiconductor SiC Based Power Electronics Basic Information
9.18.2 BASiC Semiconductor SiC Based Power Electronics Product Overview
9.18.3 BASiC Semiconductor SiC Based Power Electronics Product Market Performance
9.18.4 BASiC Semiconductor Business Overview
9.18.5 BASiC Semiconductor Recent Developments
9.19 SemiQ
9.19.1 SemiQ SiC Based Power Electronics Basic Information
9.19.2 SemiQ SiC Based Power Electronics Product Overview
9.19.3 SemiQ SiC Based Power Electronics Product Market Performance
9.19.4 SemiQ Business Overview
9.19.5 SemiQ Recent Developments
9.20 Diodes Incorporated
9.20.1 Diodes Incorporated SiC Based Power Electronics Basic Information
9.20.2 Diodes Incorporated SiC Based Power Electronics Product Overview
9.20.3 Diodes Incorporated SiC Based Power Electronics Product Market Performance
9.20.4 Diodes Incorporated Business Overview
9.20.5 Diodes Incorporated Recent Developments
9.21 SanRex
9.21.1 SanRex SiC Based Power Electronics Basic Information
9.21.2 SanRex SiC Based Power Electronics Product Overview
9.21.3 SanRex SiC Based Power Electronics Product Market Performance
9.21.4 SanRex Business Overview
9.21.5 SanRex Recent Developments
9.22 Alpha and Omega Semiconductor
9.22.1 Alpha and Omega Semiconductor SiC Based Power Electronics Basic Information
9.22.2 Alpha and Omega Semiconductor SiC Based Power Electronics Product Overview
9.22.3 Alpha and Omega Semiconductor SiC Based Power Electronics Product Market Performance
9.22.4 Alpha and Omega Semiconductor Business Overview
9.22.5 Alpha and Omega Semiconductor Recent Developments
9.23 Bosch
9.23.1 Bosch SiC Based Power Electronics Basic Information
9.23.2 Bosch SiC Based Power Electronics Product Overview
9.23.3 Bosch SiC Based Power Electronics Product Market Performance
9.23.4 Bosch Business Overview
9.23.5 Bosch Recent Developments
9.24 GE Aerospace
9.24.1 GE Aerospace SiC Based Power Electronics Basic Information
9.24.2 GE Aerospace SiC Based Power Electronics Product Overview
9.24.3 GE Aerospace SiC Based Power Electronics Product Market Performance
9.24.4 GE Aerospace Business Overview
9.24.5 GE Aerospace Recent Developments
9.25 KEC Corporation
9.25.1 KEC Corporation SiC Based Power Electronics Basic Information
9.25.2 KEC Corporation SiC Based Power Electronics Product Overview
9.25.3 KEC Corporation SiC Based Power Electronics Product Market Performance
9.25.4 KEC Corporation Business Overview
9.25.5 KEC Corporation Recent Developments
9.26 PANJIT Group
9.26.1 PANJIT Group SiC Based Power Electronics Basic Information
9.26.2 PANJIT Group SiC Based Power Electronics Product Overview
9.26.3 PANJIT Group SiC Based Power Electronics Product Market Performance
9.26.4 PANJIT Group Business Overview
9.26.5 PANJIT Group Recent Developments
9.27 Nexperia
9.27.1 Nexperia SiC Based Power Electronics Basic Information
9.27.2 Nexperia SiC Based Power Electronics Product Overview
9.27.3 Nexperia SiC Based Power Electronics Product Market Performance
9.27.4 Nexperia Business Overview
9.27.5 Nexperia Recent Developments
9.28 Vishay Intertechnology
9.28.1 Vishay Intertechnology SiC Based Power Electronics Basic Information
9.28.2 Vishay Intertechnology SiC Based Power Electronics Product Overview
9.28.3 Vishay Intertechnology SiC Based Power Electronics Product Market Performance
9.28.4 Vishay Intertechnology Business Overview
9.28.5 Vishay Intertechnology Recent Developments
9.29 Zhuzhou CRRC Times Electric
9.29.1 Zhuzhou CRRC Times Electric SiC Based Power Electronics Basic Information
9.29.2 Zhuzhou CRRC Times Electric SiC Based Power Electronics Product Overview
9.29.3 Zhuzhou CRRC Times Electric SiC Based Power Electronics Product Market Performance
9.29.4 Zhuzhou CRRC Times Electric Business Overview
9.29.5 Zhuzhou CRRC Times Electric Recent Developments
9.30 China Resources Microelectronics Limited
9.30.1 China Resources Microelectronics Limited SiC Based Power Electronics Basic Information
9.30.2 China Resources Microelectronics Limited SiC Based Power Electronics Product Overview
9.30.3 China Resources Microelectronics Limited SiC Based Power Electronics Product Market Performance
9.30.4 China Resources Microelectronics Limited Business Overview
9.30.5 China Resources Microelectronics Limited Recent Developments
10 SiC Based Power Electronics Market Forecast by Region
10.1 Global SiC Based Power Electronics Market Size Forecast
10.2 Global SiC Based Power Electronics Market Forecast by Region
10.2.1 North America Market Size Forecast by Country
10.2.2 Europe SiC Based Power Electronics Market Size Forecast by Country
10.2.3 Asia Pacific SiC Based Power Electronics Market Size Forecast by Region
10.2.4 South America SiC Based Power Electronics Market Size Forecast by Country
10.2.5 Middle East and Africa Forecasted Consumption of SiC Based Power Electronics by Country
11 Forecast Market by Type and by Application (2025-2030)
11.1 Global SiC Based Power Electronics Market Forecast by Type (2025-2030)
11.1.1 Global Forecasted Sales of SiC Based Power Electronics by Type (2025-2030)
11.1.2 Global SiC Based Power Electronics Market Size Forecast by Type (2025-2030)
11.1.3 Global Forecasted Price of SiC Based Power Electronics by Type (2025-2030)
11.2 Global SiC Based Power Electronics Market Forecast by Application (2025-2030)
11.2.1 Global SiC Based Power Electronics Sales (K Units) Forecast by Application
11.2.2 Global SiC Based Power Electronics Market Size (M USD) Forecast by Application (2025-2030)
12 Conclusion and Key FindingsList of Tables
Table 1. Introduction of the Type
Table 2. Introduction of the Application
Table 3. Market Size (M USD) Segment Executive Summary
Table 4. SiC Based Power Electronics Market Size Comparison by Region (M USD)
Table 5. Global SiC Based Power Electronics Sales (K Units) by Manufacturers (2019-2025)
Table 6. Global SiC Based Power Electronics Sales Market Share by Manufacturers (2019-2025)
Table 7. Global SiC Based Power Electronics Revenue (M USD) by Manufacturers (2019-2025)
Table 8. Global SiC Based Power Electronics Revenue Share by Manufacturers (2019-2025)
Table 9. Company Type (Tier 1, Tier 2, and Tier 3) & (based on the Revenue in SiC Based Power Electronics as of 2022)
Table 10. Global Market SiC Based Power Electronics Average Price (USD/Unit) of Key Manufacturers (2019-2025)
Table 11. Manufacturers SiC Based Power Electronics Sales Sites and Area Served
Table 12. Manufacturers SiC Based Power Electronics Product Type
Table 13. Global SiC Based Power Electronics Manufacturers Market Concentration Ratio (CR5 and HHI)
Table 14. Mergers & Acquisitions, Expansion Plans
Table 15. Industry Chain Map of SiC Based Power Electronics
Table 16. Market Overview of Key Raw Materials
Table 17. Midstream Market Analysis
Table 18. Downstream Customer Analysis
Table 19. Key Development Trends
Table 20. Driving Factors
Table 21. SiC Based Power Electronics Market Challenges
Table 22. Global SiC Based Power Electronics Sales by Type (K Units)
Table 23. Global SiC Based Power Electronics Market Size by Type (M USD)
Table 24. Global SiC Based Power Electronics Sales (K Units) by Type (2019-2025)
Table 25. Global SiC Based Power Electronics Sales Market Share by Type (2019-2025)
Table 26. Global SiC Based Power Electronics Market Size (M USD) by Type (2019-2025)
Table 27. Global SiC Based Power Electronics Market Size Share by Type (2019-2025)
Table 28. Global SiC Based Power Electronics Price (USD/Unit) by Type (2019-2025)
Table 29. Global SiC Based Power Electronics Sales (K Units) by Application
Table 30. Global SiC Based Power Electronics Market Size by Application
Table 31. Global SiC Based Power Electronics Sales by Application (2019-2025) & (K Units)
Table 32. Global SiC Based Power Electronics Sales Market Share by Application (2019-2025)
Table 33. Global SiC Based Power Electronics Sales by Application (2019-2025) & (M USD)
Table 34. Global SiC Based Power Electronics Market Share by Application (2019-2025)
Table 35. Global SiC Based Power Electronics Sales Growth Rate by Application (2019-2025)
Table 36. Global SiC Based Power Electronics Sales by Region (2019-2025) & (K Units)
Table 37. Global SiC Based Power Electronics Sales Market Share by Region (2019-2025)
Table 38. North America SiC Based Power Electronics Sales by Country (2019-2025) & (K Units)
Table 39. Europe SiC Based Power Electronics Sales by Country (2019-2025) & (K Units)
Table 40. Asia Pacific SiC Based Power Electronics Sales by Region (2019-2025) & (K Units)
Table 41. South America SiC Based Power Electronics Sales by Country (2019-2025) & (K Units)
Table 42. Middle East and Africa SiC Based Power Electronics Sales by Region (2019-2025) & (K Units)
Table 43. STMicroelectronics SiC Based Power Electronics Basic Information
Table 44. STMicroelectronics SiC Based Power Electronics Product Overview
Table 45. STMicroelectronics SiC Based Power Electronics Sales (K Units), Revenue (M USD), Price (USD/Unit) and Gross Margin (2019-2025)
Table 46. STMicroelectronics Business Overview
Table 47. STMicroelectronics SiC Based Power Electronics SWOT Analysis
Table 48. STMicroelectronics Recent Developments
Table 49. Infineon SiC Based Power Electronics Basic Information
Table 50. Infineon SiC Based Power Electronics Product Overview
Table 51. Infineon SiC Based Power Electronics Sales (K Units), Revenue (M USD), Price (USD/Unit) and Gross Margin (2019-2025)
Table 52. Infineon Business Overview
Table 53. Infineon SiC Based Power Electronics SWOT Analysis
Table 54. Infineon Recent Developments
Table 55. Wolfspeed SiC Based Power Electronics Basic Information
Table 56. Wolfspeed SiC Based Power Electronics Product Overview
Table 57. Wolfspeed SiC Based Power Electronics Sales (K Units), Revenue (M USD), Price (USD/Unit) and Gross Margin (2019-2025)
Table 58. Wolfspeed SiC Based Power Electronics SWOT Analysis
Table 59. Wolfspeed Business Overview
Table 60. Wolfspeed Recent Developments
Table 61. Rohm SiC Based Power Electronics Basic Information
Table 62. Rohm SiC Based Power Electronics Product Overview
Table 63. Rohm SiC Based Power Electronics Sales (K Units), Revenue (M USD), Price (USD/Unit) and Gross Margin (2019-2025)
Table 64. Rohm Business Overview
Table 65. Rohm Recent Developments
Table 66. onsemi SiC Based Power Electronics Basic Information
Table 67. onsemi SiC Based Power Electronics Product Overview
Table 68. onsemi SiC Based Power Electronics Sales (K Units), Revenue (M USD), Price (USD/Unit) and Gross Margin (2019-2025)
Table 69. onsemi Business Overview
Table 70. onsemi Recent Developments
Table 71. BYD Semiconductor SiC Based Power Electronics Basic Information
Table 72. BYD Semiconductor SiC Based Power Electronics Product Overview
Table 73. BYD Semiconductor SiC Based Power Electronics Sales (K Units), Revenue (M USD), Price (USD/Unit) and Gross Margin (2019-2025)
Table 74. BYD Semiconductor Business Overview
Table 75. BYD Semiconductor Recent Developments
Table 76. Microchip (Microsemi) SiC Based Power Electronics Basic Information
Table 77. Microchip (Microsemi) SiC Based Power Electronics Product Overview
Table 78. Microchip (Microsemi) SiC Based Power Electronics Sales (K Units), Revenue (M USD), Price (USD/Unit) and Gross Margin (2019-2025)
Table 79. Microchip (Microsemi) Business Overview
Table 80. Microchip (Microsemi) Recent Developments
Table 81. Mitsubishi Electric (Vincotech) SiC Based Power Electronics Basic Information
Table 82. Mitsubishi Electric (Vincotech) SiC Based Power Electronics Product Overview
Table 83. Mitsubishi Electric (Vincotech) SiC Based Power Electronics Sales (K Units), Revenue (M USD), Price (USD/Unit) and Gross Margin (2019-2025)
Table 84. Mitsubishi Electric (Vincotech) Business Overview
Table 85. Mitsubishi Electric (Vincotech) Recent Developments
Table 86. Semikron Danfoss SiC Based Power Electronics Basic Information
Table 87. Semikron Danfoss SiC Based Power Electronics Product Overview
Table 88. Semikron Danfoss SiC Based Power Electronics Sales (K Units), Revenue (M USD), Price (USD/Unit) and Gross Margin (2019-2025)
Table 89. Semikron Danfoss Business Overview
Table 90. Semikron Danfoss Recent Developments
Table 91. Fuji Electric SiC Based Power Electronics Basic Information
Table 92. Fuji Electric SiC Based Power Electronics Product Overview
Table 93. Fuji Electric SiC Based Power Electronics Sales (K Units), Revenue (M USD), Price (USD/Unit) and Gross Margin (2019-2025)
Table 94. Fuji Electric Business Overview
Table 95. Fuji Electric Recent Developments
Table 96. Navitas (GeneSiC) SiC Based Power Electronics Basic Information
Table 97. Navitas (GeneSiC) SiC Based Power Electronics Product Overview
Table 98. Navitas (GeneSiC) SiC Based Power Electronics Sales (K Units), Revenue (M USD), Price (USD/Unit) and Gross Margin (2019-2025)
Table 99. Navitas (GeneSiC) Business Overview
Table 100. Navitas (GeneSiC) Recent Developments
Table 101. Toshiba SiC Based Power Electronics Basic Information
Table 102. Toshiba SiC Based Power Electronics Product Overview
Table 103. Toshiba SiC Based Power Electronics Sales (K Units), Revenue (M USD), Price (USD/Unit) and Gross Margin (2019-2025)
Table 104. Toshiba Business Overview
Table 105. Toshiba Recent Developments
Table 106. Qorvo (UnitedSiC) SiC Based Power Electronics Basic Information
Table 107. Qorvo (UnitedSiC) SiC Based Power Electronics Product Overview
Table 108. Qorvo (UnitedSiC) SiC Based Power Electronics Sales (K Units), Revenue (M USD), Price (USD/Unit) and Gross Margin (2019-2025)
Table 109. Qorvo (UnitedSiC) Business Overview
Table 110. Qorvo (UnitedSiC) Recent Developments
Table 111. San’an Optoelectronics SiC Based Power Electronics Basic Information
Table 112. San’an Optoelectronics SiC Based Power Electronics Product Overview
Table 113. San’an Optoelectronics SiC Based Power Electronics Sales (K Units), Revenue (M USD), Price (USD/Unit) and Gross Margin (2019-2025)
Table 114. San’an Optoelectronics Business Overview
Table 115. San’an Optoelectronics Recent Developments
Table 116. Littelfuse (IXYS) SiC Based Power Electronics Basic Information
Table 117. Littelfuse (IXYS) SiC Based Power Electronics Product Overview
Table 118. Littelfuse (IXYS) SiC Based Power Electronics Sales (K Units), Revenue (M USD), Price (USD/Unit) and Gross Margin (2019-2025)
Table 119. Littelfuse (IXYS) Business Overview
Table 120. Littelfuse (IXYS) Recent Developments
Table 121. CETC 55 SiC Based Power Electronics Basic Information
Table 122. CETC 55 SiC Based Power Electronics Product Overview
Table 123. CETC 55 SiC Based Power Electronics Sales (K Units), Revenue (M USD), Price (USD/Unit) and Gross Margin (2019-2025)
Table 124. CETC 55 Business Overview
Table 125. CETC 55 Recent Developments
Table 126. WeEn Semiconductors SiC Based Power Electronics Basic Information
Table 127. WeEn Semiconductors SiC Based Power Electronics Product Overview
Table 128. WeEn Semiconductors SiC Based Power Electronics Sales (K Units), Revenue (M USD), Price (USD/Unit) and Gross Margin (2019-2025)
Table 129. WeEn Semiconductors Business Overview
Table 130. WeEn Semiconductors Recent Developments
Table 131. BASiC Semiconductor SiC Based Power Electronics Basic Information
Table 132. BASiC Semiconductor SiC Based Power Electronics Product Overview
Table 133. BASiC Semiconductor SiC Based Power Electronics Sales (K Units), Revenue (M USD), Price (USD/Unit) and Gross Margin (2019-2025)
Table 134. BASiC Semiconductor Business Overview
Table 135. BASiC Semiconductor Recent Developments
Table 136. SemiQ SiC Based Power Electronics Basic Information
Table 137. SemiQ SiC Based Power Electronics Product Overview
Table 138. SemiQ SiC Based Power Electronics Sales (K Units), Revenue (M USD), Price (USD/Unit) and Gross Margin (2019-2025)
Table 139. SemiQ Business Overview
Table 140. SemiQ Recent Developments
Table 141. Diodes Incorporated SiC Based Power Electronics Basic Information
Table 142. Diodes Incorporated SiC Based Power Electronics Product Overview
Table 143. Diodes Incorporated SiC Based Power Electronics Sales (K Units), Revenue (M USD), Price (USD/Unit) and Gross Margin (2019-2025)
Table 144. Diodes Incorporated Business Overview
Table 145. Diodes Incorporated Recent Developments
Table 146. SanRex SiC Based Power Electronics Basic Information
Table 147. SanRex SiC Based Power Electronics Product Overview
Table 148. SanRex SiC Based Power Electronics Sales (K Units), Revenue (M USD), Price (USD/Unit) and Gross Margin (2019-2025)
Table 149. SanRex Business Overview
Table 150. SanRex Recent Developments
Table 151. Alpha and Omega Semiconductor SiC Based Power Electronics Basic Information
Table 152. Alpha and Omega Semiconductor SiC Based Power Electronics Product Overview
Table 153. Alpha and Omega Semiconductor SiC Based Power Electronics Sales (K Units), Revenue (M USD), Price (USD/Unit) and Gross Margin (2019-2025)
Table 154. Alpha and Omega Semiconductor Business Overview
Table 155. Alpha and Omega Semiconductor Recent Developments
Table 156. Bosch SiC Based Power Electronics Basic Information
Table 157. Bosch SiC Based Power Electronics Product Overview
Table 158. Bosch SiC Based Power Electronics Sales (K Units), Revenue (M USD), Price (USD/Unit) and Gross Margin (2019-2025)
Table 159. Bosch Business Overview
Table 160. Bosch Recent Developments
Table 161. GE Aerospace SiC Based Power Electronics Basic Information
Table 162. GE Aerospace SiC Based Power Electronics Product Overview
Table 163. GE Aerospace SiC Based Power Electronics Sales (K Units), Revenue (M USD), Price (USD/Unit) and Gross Margin (2019-2025)
Table 164. GE Aerospace Business Overview
Table 165. GE Aerospace Recent Developments
Table 166. KEC Corporation SiC Based Power Electronics Basic Information
Table 167. KEC Corporation SiC Based Power Electronics Product Overview
Table 168. KEC Corporation SiC Based Power Electronics Sales (K Units), Revenue (M USD), Price (USD/Unit) and Gross Margin (2019-2025)
Table 169. KEC Corporation Business Overview
Table 170. KEC Corporation Recent Developments
Table 171. PANJIT Group SiC Based Power Electronics Basic Information
Table 172. PANJIT Group SiC Based Power Electronics Product Overview
Table 173. PANJIT Group SiC Based Power Electronics Sales (K Units), Revenue (M USD), Price (USD/Unit) and Gross Margin (2019-2025)
Table 174. PANJIT Group Business Overview
Table 175. PANJIT Group Recent Developments
Table 176. Nexperia SiC Based Power Electronics Basic Information
Table 177. Nexperia SiC Based Power Electronics Product Overview
Table 178. Nexperia SiC Based Power Electronics Sales (K Units), Revenue (M USD), Price (USD/Unit) and Gross Margin (2019-2025)
Table 179. Nexperia Business Overview
Table 180. Nexperia Recent Developments
Table 181. Vishay Intertechnology SiC Based Power Electronics Basic Information
Table 182. Vishay Intertechnology SiC Based Power Electronics Product Overview
Table 183. Vishay Intertechnology SiC Based Power Electronics Sales (K Units), Revenue (M USD), Price (USD/Unit) and Gross Margin (2019-2025)
Table 184. Vishay Intertechnology Business Overview
Table 185. Vishay Intertechnology Recent Developments
Table 186. Zhuzhou CRRC Times Electric SiC Based Power Electronics Basic Information
Table 187. Zhuzhou CRRC Times Electric SiC Based Power Electronics Product Overview
Table 188. Zhuzhou CRRC Times Electric SiC Based Power Electronics Sales (K Units), Revenue (M USD), Price (USD/Unit) and Gross Margin (2019-2025)
Table 189. Zhuzhou CRRC Times Electric Business Overview
Table 190. Zhuzhou CRRC Times Electric Recent Developments
Table 191. China Resources Microelectronics Limited SiC Based Power Electronics Basic Information
Table 192. China Resources Microelectronics Limited SiC Based Power Electronics Product Overview
Table 193. China Resources Microelectronics Limited SiC Based Power Electronics Sales (K Units), Revenue (M USD), Price (USD/Unit) and Gross Margin (2019-2025)
Table 194. China Resources Microelectronics Limited Business Overview
Table 195. China Resources Microelectronics Limited Recent Developments
Table 196. Global SiC Based Power Electronics Sales Forecast by Region (2025-2030) & (K Units)
Table 197. Global SiC Based Power Electronics Market Size Forecast by Region (2025-2030) & (M USD)
Table 198. North America SiC Based Power Electronics Sales Forecast by Country (2025-2030) & (K Units)
Table 199. North America SiC Based Power Electronics Market Size Forecast by Country (2025-2030) & (M USD)
Table 200. Europe SiC Based Power Electronics Sales Forecast by Country (2025-2030) & (K Units)
Table 201. Europe SiC Based Power Electronics Market Size Forecast by Country (2025-2030) & (M USD)
Table 202. Asia Pacific SiC Based Power Electronics Sales Forecast by Region (2025-2030) & (K Units)
Table 203. Asia Pacific SiC Based Power Electronics Market Size Forecast by Region (2025-2030) & (M USD)
Table 204. South America SiC Based Power Electronics Sales Forecast by Country (2025-2030) & (K Units)
Table 205. South America SiC Based Power Electronics Market Size Forecast by Country (2025-2030) & (M USD)
Table 206. Middle East and Africa SiC Based Power Electronics Consumption Forecast by Country (2025-2030) & (Units)
Table 207. Middle East and Africa SiC Based Power Electronics Market Size Forecast by Country (2025-2030) & (M USD)
Table 208. Global SiC Based Power Electronics Sales Forecast by Type (2025-2030) & (K Units)
Table 209. Global SiC Based Power Electronics Market Size Forecast by Type (2025-2030) & (M USD)
Table 210. Global SiC Based Power Electronics Price Forecast by Type (2025-2030) & (USD/Unit)
Table 211. Global SiC Based Power Electronics Sales (K Units) Forecast by Application (2025-2030)
Table 212. Global SiC Based Power Electronics Market Size Forecast by Application (2025-2030) & (M USD)
List of Figures
Figure 1. Product Picture of SiC Based Power Electronics
Figure 2. Data Triangulation
Figure 3. Key Caveats
Figure 4. Global SiC Based Power Electronics Market Size (M USD), 2026-2034
Figure 5. Global SiC Based Power Electronics Market Size (M USD) (2026-2034)
Figure 6. Global SiC Based Power Electronics Sales (K Units) & (2026-2034)
Figure 7. Evaluation Matrix of Segment Market Development Potential (Type)
Figure 8. Evaluation Matrix of Segment Market Development Potential (Application)
Figure 9. Evaluation Matrix of Regional Market Development Potential
Figure 10. SiC Based Power Electronics Market Size by Country (M USD)
Figure 11. SiC Based Power Electronics Sales Share by Manufacturers in 2023
Figure 12. Global SiC Based Power Electronics Revenue Share by Manufacturers in 2023
Figure 13. SiC Based Power Electronics Market Share by Company Type (Tier 1, Tier 2 and Tier 3): 2023
Figure 14. Global Market SiC Based Power Electronics Average Price (USD/Unit) of Key Manufacturers in 2023
Figure 15. The Global 5 and 10 Largest Players: Market Share by SiC Based Power Electronics Revenue in 2023
Figure 16. Evaluation Matrix of Segment Market Development Potential (Type)
Figure 17. Global SiC Based Power Electronics Market Share by Type
Figure 18. Sales Market Share of SiC Based Power Electronics by Type (2019-2025)
Figure 19. Sales Market Share of SiC Based Power Electronics by Type in 2023
Figure 20. Market Size Share of SiC Based Power Electronics by Type (2019-2025)
Figure 21. Market Size Market Share of SiC Based Power Electronics by Type in 2023
Figure 22. Evaluation Matrix of Segment Market Development Potential (Application)
Figure 23. Global SiC Based Power Electronics Market Share by Application
Figure 24. Global SiC Based Power Electronics Sales Market Share by Application (2019-2025)
Figure 25. Global SiC Based Power Electronics Sales Market Share by Application in 2023
Figure 26. Global SiC Based Power Electronics Market Share by Application (2019-2025)
Figure 27. Global SiC Based Power Electronics Market Share by Application in 2023
Figure 28. Global SiC Based Power Electronics Sales Growth Rate by Application (2019-2025)
Figure 29. Global SiC Based Power Electronics Sales Market Share by Region (2019-2025)
Figure 30. North America SiC Based Power Electronics Sales and Growth Rate (2019-2025) & (K Units)
Figure 31. North America SiC Based Power Electronics Sales Market Share by Country in 2023
Figure 32. U.S. SiC Based Power Electronics Sales and Growth Rate (2019-2025) & (K Units)
Figure 33. Canada SiC Based Power Electronics Sales (K Units) and Growth Rate (2019-2025)
Figure 34. Mexico SiC Based Power Electronics Sales (Units) and Growth Rate (2019-2025)
Figure 35. Europe SiC Based Power Electronics Sales and Growth Rate (2019-2025) & (K Units)
Figure 36. Europe SiC Based Power Electronics Sales Market Share by Country in 2023
Figure 37. Germany SiC Based Power Electronics Sales and Growth Rate (2019-2025) & (K Units)
Figure 38. France SiC Based Power Electronics Sales and Growth Rate (2019-2025) & (K Units)
Figure 39. U.K. SiC Based Power Electronics Sales and Growth Rate (2019-2025) & (K Units)
Figure 40. Italy SiC Based Power Electronics Sales and Growth Rate (2019-2025) & (K Units)
Figure 41. Russia SiC Based Power Electronics Sales and Growth Rate (2019-2025) & (K Units)
Figure 42. Asia Pacific SiC Based Power Electronics Sales and Growth Rate (K Units)
Figure 43. Asia Pacific SiC Based Power Electronics Sales Market Share by Region in 2023
Figure 44. China SiC Based Power Electronics Sales and Growth Rate (2019-2025) & (K Units)
Figure 45. Japan SiC Based Power Electronics Sales and Growth Rate (2019-2025) & (K Units)
Figure 46. South Korea SiC Based Power Electronics Sales and Growth Rate (2019-2025) & (K Units)
Figure 47. India SiC Based Power Electronics Sales and Growth Rate (2019-2025) & (K Units)
Figure 48. Southeast Asia SiC Based Power Electronics Sales and Growth Rate (2019-2025) & (K Units)
Figure 49. South America SiC Based Power Electronics Sales and Growth Rate (K Units)
Figure 50. South America SiC Based Power Electronics Sales Market Share by Country in 2023
Figure 51. Brazil SiC Based Power Electronics Sales and Growth Rate (2019-2025) & (K Units)
Figure 52. Argentina SiC Based Power Electronics Sales and Growth Rate (2019-2025) & (K Units)
Figure 53. Columbia SiC Based Power Electronics Sales and Growth Rate (2019-2025) & (K Units)
Figure 54. Middle East and Africa SiC Based Power Electronics Sales and Growth Rate (K Units)
Figure 55. Middle East and Africa SiC Based Power Electronics Sales Market Share by Region in 2023
Figure 56. Saudi Arabia SiC Based Power Electronics Sales and Growth Rate (2019-2025) & (K Units)
Figure 57. UAE SiC Based Power Electronics Sales and Growth Rate (2019-2025) & (K Units)
Figure 58. Egypt SiC Based Power Electronics Sales and Growth Rate (2019-2025) & (K Units)
Figure 59. Nigeria SiC Based Power Electronics Sales and Growth Rate (2019-2025) & (K Units)
Figure 60. South Africa SiC Based Power Electronics Sales and Growth Rate (2019-2025) & (K Units)
Figure 61. Global SiC Based Power Electronics Sales Forecast by Volume (2026-2034) & (K Units)
Figure 62. Global SiC Based Power Electronics Market Size Forecast by Value (2026-2034) & (M USD)
Figure 63. Global SiC Based Power Electronics Sales Market Share Forecast by Type (2025-2030)
Figure 64. Global SiC Based Power Electronics Market Share Forecast by Type (2025-2030)
Figure 65. Global SiC Based Power Electronics Sales Forecast by Application (2025-2030)
Figure 66. Global SiC Based Power Electronics Market Share Forecast by Application (2025-2030)