SEMICONDUCTOR INSIGHT
MARKET RESEARCH REPORT

Si Photonics Transceivers Market

2026 to 2034
MARKET INTELLIGENCE
ACROSS KEY REGIONS
2026 EDITION
OPTOELECTRONICS Semiconductor Market Research

Si Photonics Transceivers Market

◷
UPDATED 19 October 2026
▤
REPORT LENGTH Detailed Report
▣
REPORT CODE 025fe9831618
▯
FORMATS PDF

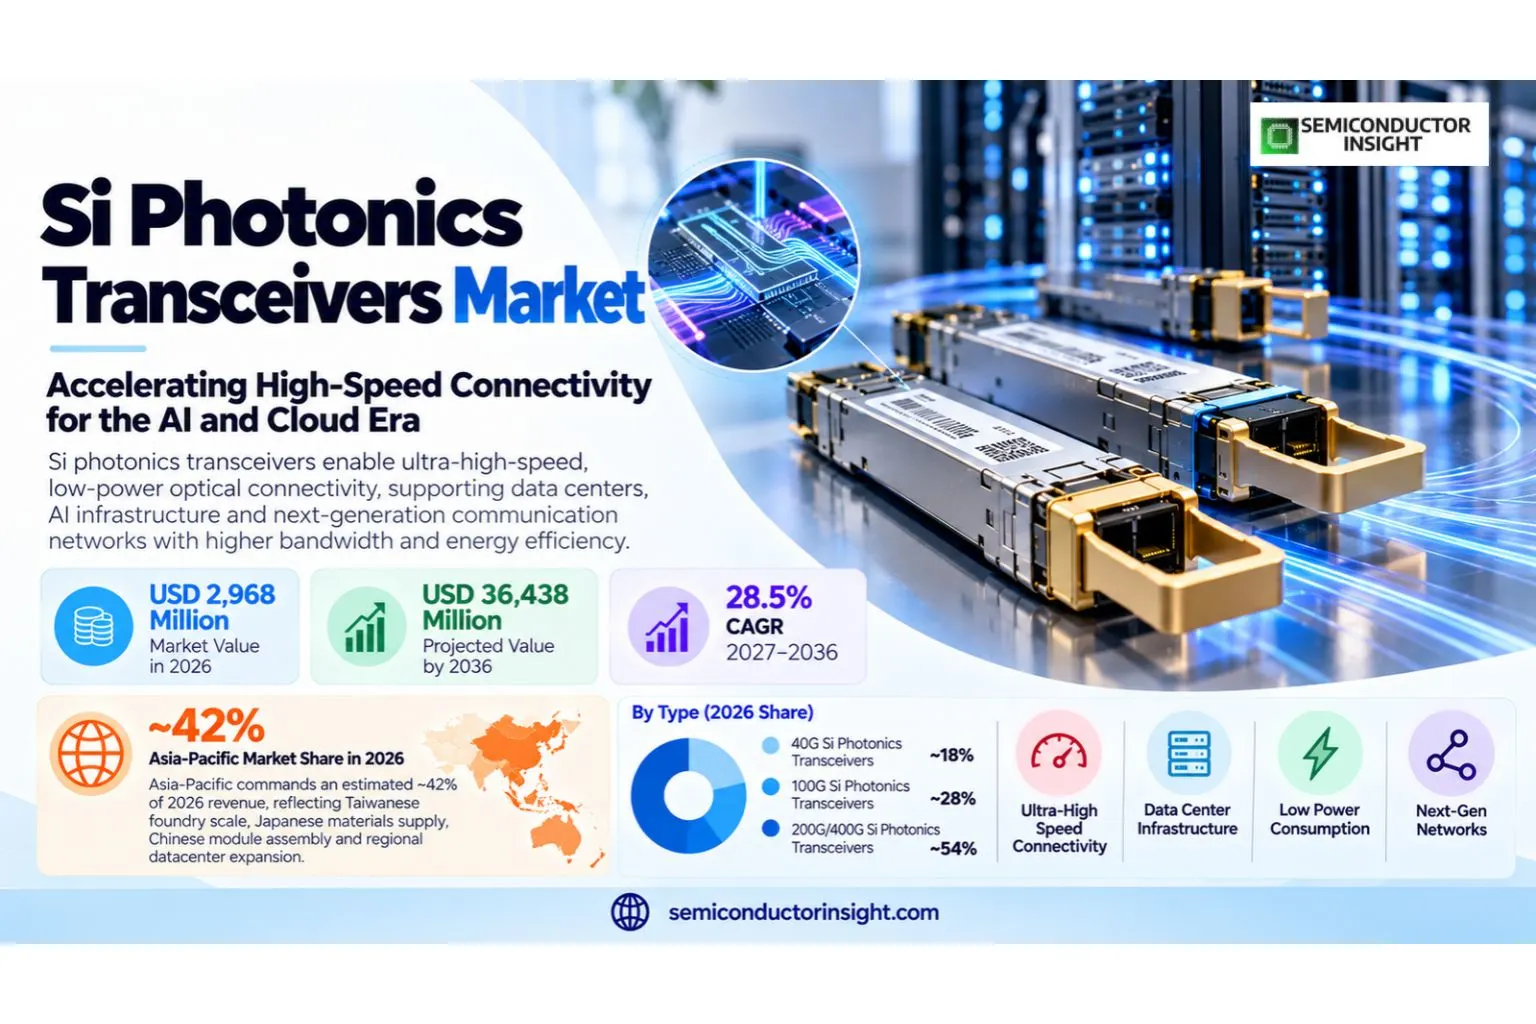
Si photonics transceivers market was valued at USD 2,968 million in 2026 and is projected to reach USD 36,438 million by 2036, representing a CAGR of 28.5% over 2027–2036. Asia-Pacific commands an estimated ~42% of 2026 revenue, reflecting Taiwanese foundry scale, Japanese materials supply, Chinese module assembly and regional datacenter expansion.

Get the sample PDF with study scope, segmentation and methodology details.

Key Statistics

2026 Market Size
USD 2,968 million
2036 Projected Size
USD 36,438 million
CAGR (2027–2036)
28.5%
Largest Market in 2026
Asia-Pacific (~42%)

Key Takeaways

  • Market trajectory: The si photonics transceivers market stands at USD 2,968 million in 2026 and is projected to reach USD 36,438 million by 2036, a 28.5% CAGR during 2027–2036. Demand reflects AI accelerator cluster scaling, higher-speed Ethernet ports, and migration from 100G/400G toward 800G and 1.6T optical links, with buyers increasingly insisting on silicon photonics PICs, silicon waveguides, electro-optic modulators, germanium photodetectors, 200G/lane PAM4 electronics and optical coupling that support measurable performance and cost control.
  • 200G/400G Si Photonics Transceivers lead: An estimated ~54% of base-year revenue is assigned to 200G/400G Si Photonics Transceivers, while 200G/400G Si Photonics Transceivers carries an estimated ~33.2% CAGR and ~54% share. The technological transition matters for procurement because buyers must weigh productivity and serviceability against the qualification effort associated with a new technical platform.
  • Datacenter Transceivers application: The leading application accounts for an estimated ~66% share, with Optical Interconnects representing the fastest estimated application growth at ~32.0% CAGR. Requirements differ between high-volume and specialist users, especially where an upgraded optical interface changes both the delivered product specification and the cost of field support.
  • Asia-Pacific leadership: The region captures an estimated ~42% of 2026 revenue; Asia-Pacific is the fastest-growing geography at ~31.6% CAGR. Factory concentration, engineering capabilities and customer procurement determine the local purchasing routes, while countries with limited manufacturing infrastructure depend more heavily on imported specialist systems.
  • Principal restraint: laser reliability, packaging precision, optical test yield, electrical power, thermal tolerance and high-speed interface qualification can impede adoption even when underlying demand increases. In 2026 procurement reviews increasingly prioritize verifiable supplier claims, thermal and environmental stability, warranty coverage and repeatable production outcomes. A lower quoted system price may not compensate for process downtime or reduced useful life.

Si Photonics Transceivers Market Overview

Si photonics transceivers market was valued at USD 2,968 million in 2026 and is projected to reach USD 36,438 million by 2036, representing a CAGR of 28.5% over 2027–2036. Asia-Pacific commands an estimated ~42% of 2026 revenue, reflecting Taiwanese foundry scale, Japanese materials supply, Chinese module assembly and regional datacenter expansion.

Base year: 2026 · Estimated year: 2027 · Forecast period: 2027–2036 · Historical data: 2021–2025 · Study period: 2021–2036 · Revenue in USD million

Si Photonics Transceivers describes the commercial equipment, optical assembly and application-specific engineering sold to hyperscale cloud operators, optical-module OEMs, network-switch vendors, telecommunications carriers and data-centre system integrators. The economic unit is recognized revenue for in-scope hardware and associated software, not the gross sales of downstream data centers or finished end-user platforms. Suppliers compete on technical qualification and lifecycle cost rather than a simple count of end products.

The 2026 market boundary requires careful separation from adjacent products. Silicon-photonics transceiver modules across 40G, 100G and 200G/400G types for the page-defined application categories; distinguish data-network optical modules from optical-sensing modules and medical instruments. Excludes complete switches, bare foundry-wafer services and photonic components sold separately from completed modules. Components embedded in a complete customer platform enter the boundary only at the relevant module or equipment selling value, avoiding a false comparison with customer-wide spending that includes unrelated electronics and service content.

Technical differentiation centres on silicon photonics PICs, silicon waveguides, electro-optic modulators, germanium photodetectors, 200G/lane PAM4 electronics and optical coupling. Integrated silicon waveguides route light across photonic chips, Mach-Zehnder or microring modulators encode high-rate PAM4 symbols, and germanium photodiodes convert receive-side light to electrical signals. External laser options and integrated gain must be qualified separately: laser noise, insertion loss, fiber coupling and receiver sensitivity affect the completed optical module.

Capital spending and product demand generate purchase orders differently in this industry. Most in-scope units are sold through qualified module suppliers to cloud-computing, network equipment and hyperscale buyers rather than as raw photonic wafers. The acceptance test covers transceiver bit error rate, host electrical interface, operating temperature, optical reach and warranty terms. OEM orders involve at least one silicon-photonics PIC, lasers, drivers, packaging, test and service, but system-wide cloud and switch spending cannot be counted as optical-module sales.

The competitive cycle is changing because of AI accelerator cluster scaling, higher-speed Ethernet ports, and migration from 100G/400G toward 800G and 1.6T optical links, yet volume does not rise uniformly across technology classes or countries. Cisco identified 1.6T OSFP and 800G LPO optical modules using its silicon photonics technology in its fiscal 2026 second-quarter prepared remarks.

Segment Analysis: By Type

The type split covers 40G Si Photonics Transceivers, 100G Si Photonics Transceivers, 200G/400G Si Photonics Transceivers. 200G/400G Si Photonics Transceivers remains the largest class at an estimated ~54% in 2026, while 200G/400G Si Photonics Transceivers grows fastest at ~33.2% CAGR and represents ~54% of revenue. Integrated silicon waveguides route light across photonic chips, Mach-Zehnder or microring modulators encode high-rate PAM4 symbols, and germanium photodiodes convert receive-side light to electrical signals. External laser options and integrated gain must be qualified separately: laser noise, insertion loss, fiber coupling and receiver sensitivity affect the completed optical module. Pluggable form factors compete against emerging near-package and co-packaged solutions.

Type Function Market position
40G Si Photonics Transceivers This is a mature legacy network link using serial electrical and optical interface designs. Orders tend to originate from the existing switch installed base, spares and incremental expansion rather than from greenfield AI fabrics; buyers often choose conventional optics when silicon integration adds no economic advantage. 40G Si Photonics Transceivers addresses a specific part of silicon photonics PICs, silicon waveguides, electro-optic modulators, germanium photodetectors, 200G/lane PAM4 electronics and optical coupling. Type segment: an estimated ~13% of 2026 revenue, ~11.0% CAGR. Intel documented more than eight million silicon photonics PICs deployed in pluggable transceivers, with more than 32 million integrated lasers, in its 2024 technology disclosure. 40G Si Photonics Transceivers purchasing decisions are shaped by product-generation transitions and whether supply contracts can support stable service, measurement or assembly tolerances.
100G Si Photonics Transceivers This type serves installed 100-Gb Ethernet network interfaces, typically through established pluggable module sockets. PIC integration can support optical reach and manufacturability, but price pressure and network refresh decisions constrain growth relative to 800G and 1.6T architectures. 100G Si Photonics Transceivers addresses a specific part of silicon photonics PICs, silicon waveguides, electro-optic modulators, germanium photodetectors, 200G/lane PAM4 electronics and optical coupling. Type segment: an estimated ~33% of 2026 revenue, ~22.0% CAGR. Cisco identified 1.6T OSFP and 800G LPO optical modules using its silicon photonics technology in its fiscal 2026 second-quarter prepared remarks. 100G Si Photonics Transceivers purchasing decisions are shaped by product-generation transitions and whether supply contracts can support stable service, measurement or assembly tolerances.
200G/400G Si Photonics Transceivers The 200G/400G class supports higher-port-density aggregation and migration from earlier 100G optics. PAM4 lane multiplication, laser stability and standardized optical form factors drive qualification; an 800G-class future can increase demand for photonic designs without being counted as a 400G unit. 200G/400G Si Photonics Transceivers addresses a specific part of silicon photonics PICs, silicon waveguides, electro-optic modulators, germanium photodetectors, 200G/lane PAM4 electronics and optical coupling. Largest type: an estimated ~54% of 2026 revenue, ~33.2% CAGR. Coherent demonstrated 1.6T optical transceiver options based on silicon photonics PICs at OFC in March 2026, while retaining distinct InP and VCSEL solutions. 200G/400G Si Photonics Transceivers purchasing decisions are shaped by product-generation transitions and whether supply contracts can support stable service, measurement or assembly tolerances.

Segment Analysis: By Application

By application, the segmentation comprises Datacenter Transceivers, Long Haul Transceivers, Optical Interconnects, Automotive LiDAR, Immunoassay Tests, Fiber-optic Gyroscope, Others. Datacenter Transceivers represents the leading demand category at an estimated ~66% share, while Optical Interconnects advances at ~32.0% CAGR. Most in-scope units are sold through qualified module suppliers to cloud-computing, network equipment and hyperscale buyers rather than as raw photonic wafers. The acceptance test covers transceiver bit error rate, host electrical interface, operating temperature, optical reach and warranty terms. OEM orders involve at least one silicon-photonics PIC, lasers, drivers, packaging, test and service, but system-wide cloud and switch spending cannot be counted as optical-module sales.

Application Demand characteristics
Datacenter Transceivers 2026 application share estimated at ~66%, with ~28.9% CAGR. The Datacenter Transceivers category creates demand when hyperscale cloud operators, optical-module OEMs, network-switch vendors, telecommunications carriers and data-centre system integrators require a validated implementation for this use case. Most in-scope units are sold through qualified module suppliers to cloud-computing, network equipment and hyperscale buyers rather than as raw photonic wafers.
Long Haul Transceivers Long-haul links face dispersion, coherent detection, optical amplification and transponder constraints distinct from short-reach datacenter Ethernet. Silicon-photonics participation depends on qualified optoelectronic engines, and complete coherent transport systems fall outside a stand-alone module-market boundary. 2026 application share estimated at ~8%, with ~25.0% CAGR. The Long Haul Transceivers category creates demand when hyperscale cloud operators, optical-module OEMs, network-switch vendors, telecommunications carriers and data-centre system integrators require a validated implementation for this use case.
Optical Interconnects 2026 application share estimated at ~17%, with ~32.0% CAGR. The Optical Interconnects category creates demand when hyperscale cloud operators, optical-module OEMs, network-switch vendors, telecommunications carriers and data-centre system integrators require a validated implementation for this use case. Most in-scope units are sold through qualified module suppliers to cloud-computing, network equipment and hyperscale buyers rather than as raw photonic wafers.
Automotive LiDAR Automotive ranging can use silicon photonic devices for beam shaping and optical signal conversion, but a lidar sensor is not interchangeable with an Ethernet pluggable transceiver. This category is retained under the stated application taxonomy while its market interpretation must be limited to verifiable optical module content and supplier contracts. 2026 application share estimated at ~4%, with ~19.0% CAGR. The Automotive LiDAR category creates demand when hyperscale cloud operators, optical-module OEMs, network-switch vendors, telecommunications carriers and data-centre system integrators require a validated implementation for this use case.
Immunoassay Tests Diagnostic immunoassay systems can use photonic sensors for optical readout, yet those sensors do not necessarily perform telecommunications-style optical transmission. Any optical signal unit counted in this category must be assessed by the specific device definition and commercial hardware boundary rather than assumed to inherit Ethernet transceiver pricing. 2026 application share estimated at ~2%, with ~13.0% CAGR. The Immunoassay Tests category creates demand when hyperscale cloud operators, optical-module OEMs, network-switch vendors, telecommunications carriers and data-centre system integrators require a validated implementation for this use case.
Fiber-optic Gyroscope A fiber-optic gyroscope measures rotation through interference and may incorporate integrated photonic components. That function differs from packet-network transmission, so projected demand is highly specialized and cannot be equated with datacenter transceiver unit shipments or optical-port growth. 2026 application share estimated at ~1%, with ~11.0% CAGR. The Fiber-optic Gyroscope category creates demand when hyperscale cloud operators, optical-module OEMs, network-switch vendors, telecommunications carriers and data-centre system integrators require a validated implementation for this use case.
Others 2026 application share estimated at ~2%, with ~17.0% CAGR. The Others category creates demand when hyperscale cloud operators, optical-module OEMs, network-switch vendors, telecommunications carriers and data-centre system integrators require a validated implementation for this use case. Most in-scope units are sold through qualified module suppliers to cloud-computing, network equipment and hyperscale buyers rather than as raw photonic wafers.

Distribution channels influence how orders are won in si photonics transceivers. Direct OEM qualification is typically necessary when the module or system forms part of a mission-critical product, while system integrators and specialist distributors serve laboratory, replacement and regional small-order requirements. laser reliability, packaging precision, optical test yield, electrical power, thermal tolerance and high-speed interface qualification makes pre-sales validation and post-installation engineering material elements of supplier selection.
Regional Analysis

Asia-Pacific holds the largest estimated 2026 share at ~42%, followed by North America at ~26% and Europe at ~22%. Asia-Pacific has the highest forecast growth at about ~31.6% CAGR. China, Taiwan, South Korea and Japan combine semiconductor wafer production, optical module assembly and large telecom and cloud markets. The commercial role of each country differs: silicon photonic die output, finished transceiver assembly and cloud use are not interchangeable measures. Additional hyperscale infrastructure in Southeast Asia supports import purchases, while precise demand depends on ordered optical ports, performance class and production acceptance.

How do manufacturing, commercialization and procurement differ among the five si photonics transceivers regions?

The five regional markets operate under distinct procurement patterns. China, Taiwan, South Korea and Japan combine semiconductor wafer production, optical module assembly and large telecom and cloud markets. The commercial role of each country differs: silicon photonic die output, finished transceiver assembly and cloud use are not interchangeable measures. Additional hyperscale infrastructure in Southeast Asia supports import purchases, while precise demand depends on ordered optical ports, performance class and production acceptance.

Region Position Growth outlook Demand profile What decides supplier selection
Asia-Pacific Largest (~42% share) Fastest (~31.6% CAGR) Manufacturing and precision supply Local service and manufacturing qualification
North America Regional market (~26% share) Projected (~27.0% CAGR) OEM engineering and research Supplier acceptance and data assurance
Europe Regional market (~22% share) Projected (~25.0% CAGR) Specialist industrial and research Compliance and traceable technical performance
South America Regional market (~5% share) Projected (~24.0% CAGR) Imported technology and research Import financing and responsive support
Middle East & Africa Regional market (~5% share) Projected (~23.0% CAGR) Institutional and specialist pilots Project financing and skills development

Asia-Pacific LARGEST · ~42% SHARE · ~31.6% CAGR · FASTEST-GROWING

Why does Asia-Pacific show a distinctive si photonics transceivers demand pattern?

Asia-Pacific represents an estimated ~42% of global si photonics transceivers revenue in 2026 and is projected to expand at ~31.6% CAGR through 2036. China, Taiwan, South Korea and Japan combine semiconductor wafer production, optical module assembly and large telecom and cloud markets. The commercial role of each country differs: silicon photonic die output, finished transceiver assembly and cloud use are not interchangeable measures.

Market positionLargest regional market (~42%)
Growth outlookForecast expansion (~31.6% CAGR)
Demand profileTaiwanese foundry scale, Japanese materials supply, Chinese module assembly and regional datacenter expansion
Market access gatemanufacturer qualification, service response times and technical localization
Country Position in region What drives demand
China Key market Optical transceiver assembly and datacenter networking in China are directly relevant to 100G and 200G/400G module purchases. Wider automotive and consumer electronics growth should not be treated as equivalent transceiver demand. In the China market, laser reliability, packaging precision, optical test yield, electrical power, thermal tolerance and high-speed interface qualification can make supplier qualification especially consequential for specialised installations.
Japan Specialist demand Japan combines precision optoelectronic technology and telecom infrastructure. Commercial silicon-photonics transceiver qualifications revolve around loss budget, error rate, temperature and data rates, not generic photonic sensor sales. In the Japan market, laser reliability, packaging precision, optical test yield, electrical power, thermal tolerance and high-speed interface qualification can make supplier qualification especially consequential for specialised installations.
South Korea Specialist demand AI server and high-bandwidth electronics demand in South Korea increases the potential use of 400G and higher-rate photonic transceivers; region revenue remains conditional on optical module supplier orders. In the South Korea market, laser reliability, packaging precision, optical test yield, electrical power, thermal tolerance and high-speed interface qualification can make supplier qualification especially consequential for specialised installations.

Market instances

  • China: Datacenter switch migration shapes procurement. Cisco identified 1.6T OSFP and 800G LPO optical modules using its silicon photonics technology in its fiscal 2026 second-quarter prepared remarks. In China, the relevant commercial channel is Taiwanese foundry scale, Japanese materials supply, Chinese module assembly and regional datacenter expansion, not an assumption that every international technology announcement reflects local shipments. The opportunity is to validate silicon photonics PICs, silicon waveguides, electro-optic modulators, germanium photodetectors, 200G/lane PAM4 electronics and optical coupling against real customer specifications while containing laser reliability, packaging precision, optical test yield, electrical power, thermal tolerance and high-speed interface qualification.
  • Japan: Optical signal integrity shapes procurement. Coherent demonstrated 1.6T optical transceiver options based on silicon photonics PICs at OFC in March 2026, while retaining distinct InP and VCSEL solutions. In Japan, the relevant commercial channel is Taiwanese foundry scale, Japanese materials supply, Chinese module assembly and regional datacenter expansion, not an assumption that every international technology announcement reflects local shipments.
  • South Korea: Photonic module integration shapes procurement. STMicroelectronics announced high-volume production of its 300-mm PIC100 platform in March 2026 for 800G and 1.6T optical-interconnect applications. In South Korea, the relevant commercial channel is Taiwanese foundry scale, Japanese materials supply, Chinese module assembly and regional datacenter expansion, not an assumption that every international technology announcement reflects local shipments. The opportunity is to validate silicon photonics PICs, silicon waveguides, electro-optic modulators, germanium photodetectors, 200G/lane PAM4 electronics and optical coupling against real customer specifications while containing laser reliability, packaging precision, optical test yield, electrical power, thermal tolerance and high-speed interface qualification.
In the full report: detailed 2026–2036 country activity, 2026 qualified supplier routes, equipment and module purchase patterns, and type and application breakdowns for China, Japan, South Korea.

North America REGIONAL · ~26% SHARE · ~27.0% CAGR

Why does North America show a distinctive si photonics transceivers demand pattern?

North America represents an estimated ~26% of global si photonics transceivers revenue in 2026 and is projected to expand at ~27.0% CAGR through 2036. United States cloud and AI-computing platforms specify many high-speed silicon-photonics requirements and purchase optical modules through switch and rack vendors. Intel and Cisco provide concrete US-origin architecture examples, while Canada has specialized optical-engine design and the Mexican manufacturing route serves electronics assembly.

Market positionEstimated regional market (~26%)
Growth outlookForecast expansion (~27.0% CAGR)
Demand profilecloud-AI cluster network design, early 800G/1.6T procurement and optics-system specification
Market access gatequalification data, intellectual-property access and on-site technical service
Country Position in region What drives demand
United States Key market Intel has documented silicon photonics PIC production and Cisco disclosed 2026 1.6T silicon photonics devices. These are concrete product milestones for high-rate pluggable and emerging optical I/O. In the United States market, laser reliability, packaging precision, optical test yield, electrical power, thermal tolerance and high-speed interface qualification can make supplier qualification especially consequential for specialised installations.
Canada Specialist demand Ranovus, based in Canada, announced a manufacturing partnership with Jabil in March 2025 for integrated optical engines; this optical-chip capability addresses higher-bandwidth computing, though not every medical or sensing application. In the Canada market, laser reliability, packaging precision, optical test yield, electrical power, thermal tolerance and high-speed interface qualification can make supplier qualification especially consequential for specialised installations.
Mexico Specialist demand Electronics assembly and contract-manufacturing links to the United States can support optical-network component integration. The regional module market is defined by qualified product receipts, not all network equipment exports. In the Mexico market, laser reliability, packaging precision, optical test yield, electrical power, thermal tolerance and high-speed interface qualification can make supplier qualification especially consequential for specialised installations.

Market instances

  • United States: Datacenter switch migration shapes procurement. Coherent demonstrated 1.6T optical transceiver options based on silicon photonics PICs at OFC in March 2026, while retaining distinct InP and VCSEL solutions. In United States, the relevant commercial channel is cloud-AI cluster network design, early 800G/1.6T procurement and optics-system specification, not an assumption that every international technology announcement reflects local shipments. The opportunity is to validate silicon photonics PICs, silicon waveguides, electro-optic modulators, germanium photodetectors, 200G/lane PAM4 electronics and optical coupling against real customer specifications while containing laser reliability, packaging precision, optical test yield, electrical power, thermal tolerance and high-speed interface qualification.
  • Canada: Optical signal integrity shapes procurement. STMicroelectronics announced high-volume production of its 300-mm PIC100 platform in March 2026 for 800G and 1.6T optical-interconnect applications. In Canada, the relevant commercial channel is cloud-AI cluster network design, early 800G/1.6T procurement and optics-system specification, not an assumption that every international technology announcement reflects local shipments. The opportunity is to validate silicon photonics PICs, silicon waveguides, electro-optic modulators, germanium photodetectors, 200G/lane PAM4 electronics and optical coupling against real customer specifications while containing laser reliability, packaging precision, optical test yield, electrical power, thermal tolerance and high-speed interface qualification.
  • Mexico: Photonic module integration shapes procurement. Marvell documented its 1.6T silicon-photonics light engine with eight 200G optical lanes in March 2026, addressing AI scale-up optical connections. In Mexico, the relevant commercial channel is cloud-AI cluster network design, early 800G/1.6T procurement and optics-system specification, not an assumption that every international technology announcement reflects local shipments. The opportunity is to validate silicon photonics PICs, silicon waveguides, electro-optic modulators, germanium photodetectors, 200G/lane PAM4 electronics and optical coupling against real customer specifications while containing laser reliability, packaging precision, optical test yield, electrical power, thermal tolerance and high-speed interface qualification.
In the full report: detailed 2026–2036 country activity, 2026 qualified supplier routes, equipment and module purchase patterns, and type and application breakdowns for United States, Canada, Mexico.

Europe REGIONAL · ~22% SHARE · ~25.0% CAGR

Why does Europe show a distinctive si photonics transceivers demand pattern?

Europe represents an estimated ~22% of global si photonics transceivers revenue in 2026 and is projected to expand at ~25.0% CAGR through 2036. European design programmes emphasize photonic integration, compliant network procurement and power efficiency. Belgium and France provide photonics pilot-line research, while Germany and the Netherlands host advanced design and cloud datacenter demand.

Market positionEstimated regional market (~22%)
Growth outlookForecast expansion (~25.0% CAGR)
Demand profilesilicon-photonics pilot production, low-energy networking, advanced photonic research and EU industrial qualification
Market access gatetraceable process data, cross-border service and qualification lead times
Country Position in region What drives demand
Germany Key market European high-speed networking customers can deploy imported 200G/400G silicon-photonics optics through OEMs. The EU Chips Act supports photonic process research but does not itself prove local finished-module market share. In the Germany market, laser reliability, packaging precision, optical test yield, electrical power, thermal tolerance and high-speed interface qualification can make supplier qualification especially consequential for specialised installations.
France Specialist demand The European Commission launched five pilot lines including photonic integrated circuits in January 2025, supporting French research supply chains and possible optical device commercialization. In the France market, laser reliability, packaging precision, optical test yield, electrical power, thermal tolerance and high-speed interface qualification can make supplier qualification especially consequential for specialised installations. Coherent announced 400-mW continuous-wave laser samples for co-packaged optics and silicon photonics in September 2025, addressing laser power, linewidth and noise requirements.
United Kingdom Specialist demand British research and cloud users procure transceivers compatible with international Ethernet interfaces; healthcare photonic device contracts are technically distinct from network modules. In the United Kingdom market, laser reliability, packaging precision, optical test yield, electrical power, thermal tolerance and high-speed interface qualification can make supplier qualification especially consequential for specialised installations. The 2026 Ethernet Alliance roadmap highlighted current 100G-to-800G links and emerging 1.6Tb/s standards for AI and cloud communications.

Market instances

  • Germany: Datacenter switch migration shapes procurement. Tower Semiconductor described photonics enablement for 1.6T data-centre optical modules used with NVIDIA networking infrastructure in February 2026. In Germany, the relevant commercial channel is silicon-photonics pilot production, low-energy networking, advanced photonic research and EU industrial qualification, not an assumption that every international technology announcement reflects local shipments. The opportunity is to validate silicon photonics PICs, silicon waveguides, electro-optic modulators, germanium photodetectors, 200G/lane PAM4 electronics and optical coupling against real customer specifications while containing laser reliability, packaging precision, optical test yield, electrical power, thermal tolerance and high-speed interface qualification.
  • France: Optical signal integrity shapes procurement. Coherent announced 400-mW continuous-wave laser samples for co-packaged optics and silicon photonics in September 2025, addressing laser power, linewidth and noise requirements. In France, the relevant commercial channel is silicon-photonics pilot production, low-energy networking, advanced photonic research and EU industrial qualification, not an assumption that every international technology announcement reflects local shipments. The opportunity is to validate silicon photonics PICs, silicon waveguides, electro-optic modulators, germanium photodetectors, 200G/lane PAM4 electronics and optical coupling against real customer specifications while containing laser reliability, packaging precision, optical test yield, electrical power, thermal tolerance and high-speed interface qualification.
  • United Kingdom: Photonic module integration shapes procurement. The 2026 Ethernet Alliance roadmap highlighted current 100G-to-800G links and emerging 1.6Tb/s standards for AI and cloud communications. In United Kingdom, the relevant commercial channel is silicon-photonics pilot production, low-energy networking, advanced photonic research and EU industrial qualification, not an assumption that every international technology announcement reflects local shipments. The opportunity is to validate silicon photonics PICs, silicon waveguides, electro-optic modulators, germanium photodetectors, 200G/lane PAM4 electronics and optical coupling against real customer specifications while containing laser reliability, packaging precision, optical test yield, electrical power, thermal tolerance and high-speed interface qualification.
In the full report: detailed 2026–2036 country activity, 2026 qualified supplier routes, equipment and module purchase patterns, and type and application breakdowns for Germany, France, United Kingdom.

South America REGIONAL · ~5% SHARE · ~24.0% CAGR

Why does South America show a distinctive si photonics transceivers demand pattern?

South America represents an estimated ~5% of global si photonics transceivers revenue in 2026 and is projected to expand at ~24.0% CAGR through 2036. South American revenue primarily follows imported switch and optical module purchases rather than production of silicon-photonics PICs. Brazilian cloud and telecom networks are the principal gateways to higher-speed port upgrades, with Chile serving specialized regional data-centre and carrier connections.

Market positionEstimated regional market (~5%)
Growth outlookForecast expansion (~24.0% CAGR)
Demand profileimport-led metro-network upgrades, enterprise switch procurement and selective cloud-network extensions
Market access gateimport financing, technical training and distributor-led support
Country Position in region What drives demand
Brazil Key market Brazilian network upgrades create opportunity for reliable 100G and 400G photonics, through internationally qualified optical equipment vendors and carrier integrators. In the Brazil market, laser reliability, packaging precision, optical test yield, electrical power, thermal tolerance and high-speed interface qualification can make supplier qualification especially consequential for specialised installations. Coherent demonstrated 1.6T optical transceiver options based on silicon photonics PICs at OFC in March 2026, while retaining distinct InP and VCSEL solutions.
Argentina Specialist demand Argentinian telecom and cloud buyers typically source qualified optical modules through distributors; high-speed optical upgrade timing depends on project approval and imports. In the Argentina market, laser reliability, packaging precision, optical test yield, electrical power, thermal tolerance and high-speed interface qualification can make supplier qualification especially consequential for specialised installations. STMicroelectronics announced high-volume production of its 300-mm PIC100 platform in March 2026 for 800G and 1.6T optical-interconnect applications.
Chile Specialist demand Long-distance fiber routes and datacenter interconnection support Chilean purchase of optical networking components. Silicon-photonics transceiver sales should not be inferred from fiber-kilometer construction costs. In the Chile market, laser reliability, packaging precision, optical test yield, electrical power, thermal tolerance and high-speed interface qualification can make supplier qualification especially consequential for specialised installations. Marvell documented its 1.6T silicon-photonics light engine with eight 200G optical lanes in March 2026, addressing AI scale-up optical connections.

Market instances

  • Brazil: Datacenter switch migration shapes procurement. Coherent demonstrated 1.6T optical transceiver options based on silicon photonics PICs at OFC in March 2026, while retaining distinct InP and VCSEL solutions. In Brazil, the relevant commercial channel is import-led metro-network upgrades, enterprise switch procurement and selective cloud-network extensions, not an assumption that every international technology announcement reflects local shipments. The opportunity is to validate silicon photonics PICs, silicon waveguides, electro-optic modulators, germanium photodetectors, 200G/lane PAM4 electronics and optical coupling against real customer specifications while containing laser reliability, packaging precision, optical test yield, electrical power, thermal tolerance and high-speed interface qualification.
  • Argentina: Optical signal integrity shapes procurement. STMicroelectronics announced high-volume production of its 300-mm PIC100 platform in March 2026 for 800G and 1.6T optical-interconnect applications. In Argentina, the relevant commercial channel is import-led metro-network upgrades, enterprise switch procurement and selective cloud-network extensions, not an assumption that every international technology announcement reflects local shipments. The opportunity is to validate silicon photonics PICs, silicon waveguides, electro-optic modulators, germanium photodetectors, 200G/lane PAM4 electronics and optical coupling against real customer specifications while containing laser reliability, packaging precision, optical test yield, electrical power, thermal tolerance and high-speed interface qualification.
  • Chile: Photonic module integration shapes procurement. Marvell documented its 1.6T silicon-photonics light engine with eight 200G optical lanes in March 2026, addressing AI scale-up optical connections. In Chile, the relevant commercial channel is import-led metro-network upgrades, enterprise switch procurement and selective cloud-network extensions, not an assumption that every international technology announcement reflects local shipments. The opportunity is to validate silicon photonics PICs, silicon waveguides, electro-optic modulators, germanium photodetectors, 200G/lane PAM4 electronics and optical coupling against real customer specifications while containing laser reliability, packaging precision, optical test yield, electrical power, thermal tolerance and high-speed interface qualification.
In the full report: detailed 2026–2036 country activity, 2026 qualified supplier routes, equipment and module purchase patterns, and type and application breakdowns for Brazil, Argentina, Chile.

Middle East & Africa REGIONAL · ~5% SHARE · ~23.0% CAGR

Why does Middle East & Africa show a distinctive si photonics transceivers demand pattern?

Middle East & Africa represents an estimated ~5% of global si photonics transceivers revenue in 2026 and is projected to expand at ~23.0% CAGR through 2036. Gulf-region sovereign computing investment and African carrier modernization create different optical networking opportunities. Buyers typically order complete platforms and installed optical-port capability from global suppliers, so transceiver procurement must be isolated from whole datacenter construction spending.

Market positionEstimated regional market (~5%)
Growth outlookForecast expansion (~23.0% CAGR)
Demand profilenew sovereign-AI data centres, fiber backbone connectivity and project-specific imported optics
Market access gateproject financing, specialist training and reliable calibration support
Country Position in region What drives demand
Israel Key market Tower announced a 1.6T photonics platform for optical modules in February 2026. Photonics die design and foundry output are upstream of complete optical transceiver units. In the Israel market, laser reliability, packaging precision, optical test yield, electrical power, thermal tolerance and high-speed interface qualification can make supplier qualification especially consequential for specialised installations. The IEA reported 415 TWh of data-centre electricity consumption in 2024 and a 945 TWh 2030 base-case outlook, signalling rising operational importance of network energy efficiency.
Saudi Arabia Specialist demand Saudi hyperscale investments support optical-interconnect demand through global network OEMs; medical sensing procurement is a separate application with different interface and qualification standards. In the Saudi Arabia market, laser reliability, packaging precision, optical test yield, electrical power, thermal tolerance and high-speed interface qualification can make supplier qualification especially consequential for specialised installations. Ranovus and Jabil announced a March 2025 arrangement intended to scale manufacturing of ODIN optical engines for AI and cloud equipment.
United Arab Emirates Specialist demand UAE cloud infrastructure procurement increases use of global Ethernet optical transceivers where high-rate rack and spine connections are installed. In the United Arab Emirates market, laser reliability, packaging precision, optical test yield, electrical power, thermal tolerance and high-speed interface qualification can make supplier qualification especially consequential for specialised installations. Intel documented more than eight million silicon photonics PICs deployed in pluggable transceivers, with more than 32 million integrated lasers, in its 2024 technology disclosure.

Market instances

  • Israel: Datacenter switch migration shapes procurement. The IEA reported 415 TWh of data-centre electricity consumption in 2024 and a 945 TWh 2030 base-case outlook, signalling rising operational importance of network energy efficiency. In Israel, the relevant commercial channel is new sovereign-AI data centres, fiber backbone connectivity and project-specific imported optics, not an assumption that every international technology announcement reflects local shipments.
  • Saudi Arabia: Optical signal integrity shapes procurement. Ranovus and Jabil announced a March 2025 arrangement intended to scale manufacturing of ODIN optical engines for AI and cloud equipment. In Saudi Arabia, the relevant commercial channel is new sovereign-AI data centres, fiber backbone connectivity and project-specific imported optics, not an assumption that every international technology announcement reflects local shipments. The opportunity is to validate silicon photonics PICs, silicon waveguides, electro-optic modulators, germanium photodetectors, 200G/lane PAM4 electronics and optical coupling against real customer specifications while containing laser reliability, packaging precision, optical test yield, electrical power, thermal tolerance and high-speed interface qualification.
  • United Arab Emirates: Photonic module integration shapes procurement. Intel documented more than eight million silicon photonics PICs deployed in pluggable transceivers, with more than 32 million integrated lasers, in its 2024 technology disclosure. In United Arab Emirates, the relevant commercial channel is new sovereign-AI data centres, fiber backbone connectivity and project-specific imported optics, not an assumption that every international technology announcement reflects local shipments.
In the full report: detailed 2026–2036 country activity, 2026 qualified supplier routes, equipment and module purchase patterns, and type and application breakdowns for Israel, Saudi Arabia, United Arab Emirates.

Competitive Landscape

Competition in si photonics transceivers hinges on technical qualification and the ability to turn silicon photonics PICs, silicon waveguides, electro-optic modulators, germanium photodetectors, 200G/lane PAM4 electronics and optical coupling into consistent customer results. The primary vendors relevant to direct equipment or optical-module supply include Cisco Systems, Intel, Finisar (II-VI Incorporated). Intel documented more than eight million silicon photonics PICs deployed in pluggable transceivers, with more than 32 million integrated lasers, in its 2024 technology disclosure. That evidence illustrates why named supplier activity must be separated from component-only and end-platform businesses.

Cisco Systems and the other direct participants compete through customer-defined qualification cycles rather than interchangeable generic catalog specifications. Integrated silicon waveguides route light across photonic chips, Mach-Zehnder or microring modulators encode high-rate PAM4 symbols, and germanium photodiodes convert receive-side light to electrical signals. External laser options and integrated gain must be qualified separately: laser noise, insertion loss, fiber coupling and receiver sensitivity affect the completed optical module.

Manufacturing concentration does not imply every in-scope player has comparable product revenue. Cisco identified 1.6T OSFP and 800G LPO optical modules using its silicon photonics technology in its fiscal 2026 second-quarter prepared remarks. The technical interface between the core system, software and customer workflow determines which supplier earns the primary product sale and which earns a smaller component or support contract.

Distribution breadth matters for installed equipment because spare parts, service technicians and calibration tools are purchased over several years. laser reliability, packaging precision, optical test yield, electrical power, thermal tolerance and high-speed interface qualification can generate an unusually high field-service requirement. Smaller specialists may therefore win controlled pilot projects but lose volume tenders when they lack guaranteed response times in multiple countries.

Another competitive axis is the pace at which intellectual-property protection and product standardization support scale. Most in-scope units are sold through qualified module suppliers to cloud-computing, network equipment and hyperscale buyers rather than as raw photonic wafers. The acceptance test covers transceiver bit error rate, host electrical interface, operating temperature, optical reach and warranty terms.

Tier structure

Tier Companies Basis of competition
Tier 1 direct suppliers Cisco Systems, Intel, Finisar (II-VI Incorporated) These suppliers demonstrate direct participation in silicon photonics PICs, silicon waveguides, electro-optic modulators, germanium photodetectors, 200G/lane PAM4 electronics and optical coupling, with recognized production-relevant products or qualified customer ecosystems. Most in-scope units are sold through qualified module suppliers to cloud-computing, network equipment and hyperscale buyers rather than as raw photonic wafers. The acceptance test covers transceiver bit error rate, host electrical interface, operating temperature, optical reach and warranty terms.
Tier 2 direct specialists InPhi, FUJITSU These specialist suppliers participate in defined product lines or regional niches where they can offer targeted technical differentiation. Their orders depend on a clear match between a customer use case and Silicon-photonics transceiver modules across 40G, 100G and 200G/400G types for the page-defined application categories; distinguish data-network optical modules from optical-sensing modules and medical instruments.
Component, channel and platform participants Juniper, Rockley Photonics This group includes original equipment customers, component manufacturers, distributors or adjacent-system developers and is not automatically equivalent to direct sellers of a complete si photonics transceivers product. A named firm can influence specifications without recording revenue in the exact same market boundary. Supplier diligence must separate the sale of whole platforms from the sale of the embedded optical assembly or test system.

Key companies profiled

  • Cisco Systems
  • Intel
  • InPhi
  • Finisar (II-VI Incorporated)
  • Juniper
  • Rockley Photonics
  • FUJITSU

Production Capacity Analysis

Available si photonics transceivers production capacity is a combination of precision component supply, engineering integration, test and qualification capability, and service readiness. It should not be inferred directly from adjacent semiconductor wafer-start capacity or headset retail revenue. Silicon-photonics transceiver modules across 40G, 100G and 200G/400G types for the page-defined application categories; distinguish data-network optical modules from optical-sensing modules and medical instruments. Excludes complete switches, bare foundry-wafer services and photonic components sold separately from completed modules. Commercial bottlenecks therefore occur at different stages for system suppliers and optical-module assemblers.

Production ecosystems are concentrated around specialized engineering and optical supply chains. China, Taiwan, South Korea and Japan combine semiconductor wafer production, optical module assembly and large telecom and cloud markets. The commercial role of each country differs: silicon photonic die output, finished transceiver assembly and cloud use are not interchangeable measures. Additional hyperscale infrastructure in Southeast Asia supports import purchases, while precise demand depends on ordered optical ports, performance class and production acceptance.

Suppliers can diversify capacity through contract partners, regional engineering centres and the separation of final assembly from specialized upstream optical components. Coherent demonstrated 1.6T optical transceiver options based on silicon photonics PICs at OFC in March 2026, while retaining distinct InP and VCSEL solutions. For high-value customers, a second facility adds value only if it can reproduce process tolerances, final-test records and the same released configuration.

Upstream constraints arise from laser reliability, packaging precision, optical test yield, electrical power, thermal tolerance and high-speed interface qualification and the specialized equipment needed to prove reliability. Integrated silicon waveguides route light across photonic chips, Mach-Zehnder or microring modulators encode high-rate PAM4 symbols, and germanium photodiodes convert receive-side light to electrical signals. External laser options and integrated gain must be qualified separately: laser noise, insertion loss, fiber coupling and receiver sensitivity affect the completed optical module.

Market Dynamics

Growth in si photonics transceivers depends on the extent to which hyperscale cloud operators, optical-module OEMs, network-switch vendors, telecommunications carriers and data-centre system integrators can economically adopt silicon photonics PICs, silicon waveguides, electro-optic modulators, germanium photodetectors, 200G/lane PAM4 electronics and optical coupling. AI accelerator cluster scaling, higher-speed Ethernet ports, and migration from 100G/400G toward 800G and 1.6T optical links is supportive, but laser reliability, packaging precision, optical test yield, electrical power, thermal tolerance and high-speed interface qualification can slow purchase orders. The impact estimates below are directional sensitivities to demand conditions and should be interpreted as separate commercial effects, not additive forecast components.

MARKET DRIVERS

Drivers Impact Analysis*

Driver (~) % impact on CAGR forecast Geographic relevance Impact timeline
Technology qualification +2.3% Global 2026–2030
Customer productivity +1.8% Asia-Pacific 2026–2036
Industrial ecosystem +1.3% North America and Europe 2027–2033
Supply-chain modernization +0.9% Global 2028–2036

Technology qualification

AI accelerator cluster scaling, higher-speed Ethernet ports, and migration from 100G/400G toward 800G and 1.6T optical links raises the value of proven silicon photonics PICs, silicon waveguides, electro-optic modulators, germanium photodetectors, 200G/lane PAM4 electronics and optical coupling. Suppliers that demonstrate a measurable reduction in laser reliability, packaging precision, optical test yield, electrical power, thermal tolerance and high-speed interface qualification can reach more customer acceptance milestones and shorten the period between proof of concept and order.

Customer productivity

Most in-scope units are sold through qualified module suppliers to cloud-computing, network equipment and hyperscale buyers rather than as raw photonic wafers. The acceptance test covers transceiver bit error rate, host electrical interface, operating temperature, optical reach and warranty terms. OEM orders involve at least one silicon-photonics PIC, lasers, drivers, packaging, test and service, but system-wide cloud and switch spending cannot be counted as optical-module sales.

Industrial ecosystem

China, Taiwan, South Korea and Japan combine semiconductor wafer production, optical module assembly and large telecom and cloud markets. The commercial role of each country differs: silicon photonic die output, finished transceiver assembly and cloud use are not interchangeable measures. Additional hyperscale infrastructure in Southeast Asia supports import purchases, while precise demand depends on ordered optical ports, performance class and production acceptance.

Supply-chain modernization

Intel documented more than eight million silicon photonics PICs deployed in pluggable transceivers, with more than 32 million integrated lasers, in its 2024 technology disclosure. Suppliers that demonstrate a measurable reduction in laser reliability, packaging precision, optical test yield, electrical power, thermal tolerance and high-speed interface qualification can reach more customer acceptance milestones and shorten the period between proof of concept and order.

MARKET RESTRAINTS

Restraints Impact Analysis*

Restraint (~) % impact on CAGR forecast Geographic relevance Impact timeline
Capital cost and integration −1.1% Global 2026–2029
Qualification cycle −0.8% North America and Europe 2026–2031
Volatile demand timing −0.7% Global 2026–2036
Service and skills gaps −0.6% South America and Middle East 2027–2036

Capital cost and integration

laser reliability, packaging precision, optical test yield, electrical power, thermal tolerance and high-speed interface qualification blocks some orders. A purchase can be postponed if engineers cannot reproduce laboratory performance under production conditions, if imports are delayed, or if product support is not guaranteed. laser reliability, packaging precision, optical test yield, electrical power, thermal tolerance and high-speed interface qualification is particularly consequential during a design or fab transition when repeat qualification can consume both time and staff resources.

Qualification cycle

Integrated silicon waveguides route light across photonic chips, Mach-Zehnder or microring modulators encode high-rate PAM4 symbols, and germanium photodiodes convert receive-side light to electrical signals. External laser options and integrated gain must be qualified separately: laser noise, insertion loss, fiber coupling and receiver sensitivity affect the completed optical module. Pluggable form factors compete against emerging near-package and co-packaged solutions.

Volatile demand timing

Most in-scope units are sold through qualified module suppliers to cloud-computing, network equipment and hyperscale buyers rather than as raw photonic wafers. The acceptance test covers transceiver bit error rate, host electrical interface, operating temperature, optical reach and warranty terms. OEM orders involve at least one silicon-photonics PIC, lasers, drivers, packaging, test and service, but system-wide cloud and switch spending cannot be counted as optical-module sales.

Service and skills gaps

South American revenue primarily follows imported switch and optical module purchases rather than production of silicon-photonics PICs. Brazilian cloud and telecom networks are the principal gateways to higher-speed port upgrades, with Chile serving specialized regional data-centre and carrier connections. Commercial orders tend to occur through system integrators and international manufacturers; financing, spare units and local acceptance testing alter realized demand much more than local semiconductor fab capacity.

MARKET OPPORTUNITIES

Automated workflows

Cisco identified 1.6T OSFP and 800G LPO optical modules using its silicon photonics technology in its fiscal 2026 second-quarter prepared remarks. New investment opportunities emerge when a specialized supplier can connect its technical competence to a documented production or application problem. That opportunity remains conditional on repeatable customer tests, engineering qualification and actual orders.

New regional pilots

European design programmes emphasize photonic integration, compliant network procurement and power efficiency. Belgium and France provide photonics pilot-line research, while Germany and the Netherlands host advanced design and cloud datacenter demand. Production and consumption are not identical: European-engineered optical chips may be assembled in Asia. Supplier selection rests on serviceable interoperable modules, vendor qualification, traceable optical test data and buyer protection against single-vendor dependencies.

Specialist component innovation

Integrated silicon waveguides route light across photonic chips, Mach-Zehnder or microring modulators encode high-rate PAM4 symbols, and germanium photodiodes convert receive-side light to electrical signals. External laser options and integrated gain must be qualified separately: laser noise, insertion loss, fiber coupling and receiver sensitivity affect the completed optical module. Pluggable form factors compete against emerging near-package and co-packaged solutions.

Repeatable long-life support

Most in-scope units are sold through qualified module suppliers to cloud-computing, network equipment and hyperscale buyers rather than as raw photonic wafers. The acceptance test covers transceiver bit error rate, host electrical interface, operating temperature, optical reach and warranty terms. OEM orders involve at least one silicon-photonics PIC, lasers, drivers, packaging, test and service, but system-wide cloud and switch spending cannot be counted as optical-module sales.

Supply Chain Analysis

The si photonics transceivers supply chain spans specialist upstream inputs, integration or manufacturing, qualification and downstream delivery. laser reliability, packaging precision, optical test yield, electrical power, thermal tolerance and high-speed interface qualification means suppliers cannot rely on commodity channels alone. Contract terms, process documentation and delivery acceptance matter alongside nominal product specifications when a buyer seeks stable 2026 availability and future upgrades. For si photonics transceivers, the commercial implication is that the customer must balance measurable performance, service support and repeatability before committing the next production or deployment programme. A cheaper device cannot substitute for qualified output when failure would disrupt later stages of a multi-step product build.

UpstreamPrecision optical parts, measurement components, specialty substrates, sensors and controlled manufacturing inputs used in silicon photonics PICs, silicon waveguides, electro-optic modulators, germanium photodetectors, 200G/lane PAM4 electronics and optical coupling.
ManufacturingSpecialist production, optomechanical assembly, fixture calibration and final qualification relevant to Silicon-photonics transceiver modules across 40G, 100G and 200G/400G types for the page-defined application categories; distinguish data-network optical modules from optical-sensing modules and medical instruments. Excludes complete switches, bare foundry-wafer services and photonic components sold separately from completed modules.
ChannelDirect design-win tenders, application engineers, service contracts and specialist distributors serving hyperscale cloud operators, optical-module OEMs, network-switch vendors, telecommunications carriers and data-centre system integrators.
DownstreamOperational deployments tied to AI accelerator cluster scaling, higher-speed Ethernet ports, and migration from 100G/400G toward 800G and 1.6T optical links, purchased against customer standards and ongoing support commitments.

Upstream. Precision optical parts, measurement components, specialty substrates, sensors and controlled manufacturing inputs used in silicon photonics PICs, silicon waveguides, electro-optic modulators, germanium photodetectors, 200G/lane PAM4 electronics and optical coupling. Most in-scope units are sold through qualified module suppliers to cloud-computing, network equipment and hyperscale buyers rather than as raw photonic wafers. The acceptance test covers transceiver bit error rate, host electrical interface, operating temperature, optical reach and warranty terms.

Manufacturing. Specialist production, optomechanical assembly, fixture calibration and final qualification relevant to Silicon-photonics transceiver modules across 40G, 100G and 200G/400G types for the page-defined application categories; distinguish data-network optical modules from optical-sensing modules and medical instruments. Excludes complete switches, bare foundry-wafer services and photonic components sold separately from completed modules. Most in-scope units are sold through qualified module suppliers to cloud-computing, network equipment and hyperscale buyers rather than as raw photonic wafers.

Channel. Direct design-win tenders, application engineers, service contracts and specialist distributors serving hyperscale cloud operators, optical-module OEMs, network-switch vendors, telecommunications carriers and data-centre system integrators. Most in-scope units are sold through qualified module suppliers to cloud-computing, network equipment and hyperscale buyers rather than as raw photonic wafers. The acceptance test covers transceiver bit error rate, host electrical interface, operating temperature, optical reach and warranty terms.

Downstream. Operational deployments tied to AI accelerator cluster scaling, higher-speed Ethernet ports, and migration from 100G/400G toward 800G and 1.6T optical links, purchased against customer standards and ongoing support commitments. Most in-scope units are sold through qualified module suppliers to cloud-computing, network equipment and hyperscale buyers rather than as raw photonic wafers. The acceptance test covers transceiver bit error rate, host electrical interface, operating temperature, optical reach and warranty terms.

Recent Developments

  • 12 October 2026 Announced
    Cisco announced a plan with NVIDIA to develop a new open 400G-per-lane pluggable-optics design and described its G302 1.6T optical connectivity portfolio. The significance for si photonics transceivers is a concrete change in supplier technology, industry capacity planning or customer-access conditions rather than merely a marketing announcement. Integrated silicon waveguides route light across photonic chips, Mach-Zehnder or microring modulators encode high-rate PAM4 symbols, and germanium photodiodes convert receive-side light to electrical signals. Source
  • 4 May 2026 Announced
    GlobalFoundries introduced its SCALE co-packaged optical-engine solution supporting the optical compute interconnect multi-source architecture for AI scale-up. The significance for si photonics transceivers is a concrete change in supplier technology, industry capacity planning or customer-access conditions rather than merely a marketing announcement. Integrated silicon waveguides route light across photonic chips, Mach-Zehnder or microring modulators encode high-rate PAM4 symbols, and germanium photodiodes convert receive-side light to electrical signals. Source
  • 17 March 2026 Announced
    Coherent demonstrated silicon-photonics transceivers in 1.6T and 3.2T technology programmes, alongside discrete optical technologies for high-speed links. The significance for si photonics transceivers is a concrete change in supplier technology, industry capacity planning or customer-access conditions rather than merely a marketing announcement. Integrated silicon waveguides route light across photonic chips, Mach-Zehnder or microring modulators encode high-rate PAM4 symbols, and germanium photodiodes convert receive-side light to electrical signals. Source
  • 17 March 2026 Published
    Marvell outlined its 1.6T silicon-photonics light-engine product with eight 200G optical lanes and its efficiency-oriented architecture. The significance for si photonics transceivers is a concrete change in supplier technology, industry capacity planning or customer-access conditions rather than merely a marketing announcement. Integrated silicon waveguides route light across photonic chips, Mach-Zehnder or microring modulators encode high-rate PAM4 symbols, and germanium photodiodes convert receive-side light to electrical signals. Source
  • 9 March 2026 Announced
    STMicroelectronics announced 300-mm PIC100 high-volume production and a plan to increase capacity during 2027 to serve AI optical interconnect. The significance for si photonics transceivers is a concrete change in supplier technology, industry capacity planning or customer-access conditions rather than merely a marketing announcement. Integrated silicon waveguides route light across photonic chips, Mach-Zehnder or microring modulators encode high-rate PAM4 symbols, and germanium photodiodes convert receive-side light to electrical signals. Source
  • 5 February 2026 Announced
    Tower Semiconductor detailed a high-speed silicon-photonics platform used for 1.6T optical-module ecosystem development for NVIDIA networking. The significance for si photonics transceivers is a concrete change in supplier technology, industry capacity planning or customer-access conditions rather than merely a marketing announcement. Integrated silicon waveguides route light across photonic chips, Mach-Zehnder or microring modulators encode high-rate PAM4 symbols, and germanium photodiodes convert receive-side light to electrical signals. Source
  • 27 January 2026 Announced
    imec and Veeco outlined 300-mm-compatible barium-titanate deposition enabling a future lower-energy modulation route for silicon photonics. The significance for si photonics transceivers is a concrete change in supplier technology, industry capacity planning or customer-access conditions rather than merely a marketing announcement. Integrated silicon waveguides route light across photonic chips, Mach-Zehnder or microring modulators encode high-rate PAM4 symbols, and germanium photodiodes convert receive-side light to electrical signals. Source
  • 17 November 2025 Announced
    GlobalFoundries completed its acquisition of Singapore-based Advanced Micro Foundry, expanding its manufacturing and process portfolio for photonic integrated circuits. The significance for si photonics transceivers is a concrete change in supplier technology, industry capacity planning or customer-access conditions rather than merely a marketing announcement. Integrated silicon waveguides route light across photonic chips, Mach-Zehnder or microring modulators encode high-rate PAM4 symbols, and germanium photodiodes convert receive-side light to electrical signals. Source

REPORT SCOPE & SEGMENTATION

Attribute Details
Study period 2021–2036
Base year 2026
Estimated year 2027
Forecast period 2027–2036
Historical period 2021–2025
2026 market size USD 2,968 million
2027 estimated size USD 3,814 million
2036 projected market size USD 36,438 million
CAGR (2027–2036) 28.5%
Market unit USD million, recognized market revenue
Market boundary Silicon-photonics transceiver modules across 40G, 100G and 200G/400G types for the page-defined application categories; distinguish data-network optical modules from optical-sensing modules and medical instruments. Excludes complete switches, bare foundry-wafer services and photonic components sold separately from completed modules.
By Type 40G Si Photonics Transceivers · 100G Si Photonics Transceivers · 200G/400G Si Photonics Transceivers
By Application Datacenter Transceivers · Long Haul Transceivers · Optical Interconnects · Automotive LiDAR · Immunoassay Tests · Fiber-optic Gyroscope · Others
By Region 2026 region categories and country coverage. Estimated regional shares are 2026 values; growth rates extend through 2036.
Asia-PacificChina, Japan, South Korea, India
North AmericaUnited States, Canada, Mexico
EuropeGermany, France, United Kingdom, Netherlands
South AmericaBrazil, Argentina, Chile
Middle East & AfricaIsrael, Saudi Arabia, United Arab Emirates, Turkey
Key Companies Profiled Cisco Systems · Intel · InPhi · Finisar (II-VI Incorporated) · Juniper · Rockley Photonics · FUJITSU
Customization Scope Customer-specific segmentation, country market analysis, detailed supplier products and application evaluation over 2026–2036, with technical scoping to silicon photonics PICs, silicon waveguides, electro-optic modulators, germanium photodetectors, 200G/lane PAM4 electronics and optical coupling.

Frequently Asked Questions

What is the global si photonics transceivers size and projected growth?

The worldwide market has a base-year value of USD 2,968 million for 2026 and is projected to reach USD 36,438 million in 2036, equivalent to a 28.5% compound annual growth rate across 2027–2036. AI accelerator cluster scaling, higher-speed Ethernet ports, and migration from 100G/400G toward 800G and 1.6T optical links creates requirements for silicon photonics PICs, silicon waveguides, electro-optic modulators, germanium photodetectors, 200G/lane PAM4 electronics and optical coupling, but purchase timing depends on real customer qualification and sustained reliability rather than a guaranteed parallel rise with another technology sector.

Which type leads the si photonics transceivers market?

200G/400G Si Photonics Transceivers is the largest class with an estimated ~54% 2026 revenue share. Its commercial position reflects qualification requirements, product life and its role in silicon photonics PICs, silicon waveguides, electro-optic modulators, germanium photodetectors, 200G/lane PAM4 electronics and optical coupling. Integrated silicon waveguides route light across photonic chips, Mach-Zehnder or microring modulators encode high-rate PAM4 symbols, and germanium photodiodes convert receive-side light to electrical signals.

Which type of si photonics transceivers is fastest-growing?

200G/400G Si Photonics Transceivers is the fastest-growing type at an estimated ~33.2% CAGR from 2026 through 2036 and holds about ~54% base-year share. That trajectory follows product evolution and increasing performance requirements, but it depends on higher-value technology becoming financially viable at production scale. laser reliability, packaging precision, optical test yield, electrical power, thermal tolerance and high-speed interface qualification remains a practical brake on adoption.

Which application contributes the largest si photonics transceivers demand?

Datacenter Transceivers accounts for an estimated ~66% of 2026 demand, the largest application category. Most in-scope units are sold through qualified module suppliers to cloud-computing, network equipment and hyperscale buyers rather than as raw photonic wafers. The acceptance test covers transceiver bit error rate, host electrical interface, operating temperature, optical reach and warranty terms.

Which si photonics transceivers application is growing the fastest?

Optical Interconnects grows at an estimated ~32.0% CAGR and represents around ~17% of 2026 revenue. Its growth reflects the evolving technical standard expected by customers rather than identical demand across the full application list. silicon photonics PICs, silicon waveguides, electro-optic modulators, germanium photodetectors, 200G/lane PAM4 electronics and optical coupling determines whether buyers can migrate without major changes to software, servicing or production fixtures.

Which region holds the largest si photonics transceivers share?

Asia-Pacific accounts for an estimated ~42% of 2026 worldwide revenue. China, Taiwan, South Korea and Japan combine semiconductor wafer production, optical module assembly and large telecom and cloud markets. The commercial role of each country differs: silicon photonic die output, finished transceiver assembly and cloud use are not interchangeable measures. Additional hyperscale infrastructure in Southeast Asia supports import purchases, while precise demand depends on ordered optical ports, performance class and production acceptance.

Which si photonics transceivers region is expected to grow fastest?

Asia-Pacific has the highest estimated CAGR of ~31.6% through 2036 from a 2026 share of ~42%. China, Taiwan, South Korea and Japan combine semiconductor wafer production, optical module assembly and large telecom and cloud markets. The commercial role of each country differs: silicon photonic die output, finished transceiver assembly and cloud use are not interchangeable measures.

Who are the principal si photonics transceivers suppliers?

Core direct participants include Cisco Systems, Intel, Finisar (II-VI Incorporated). Other named organizations contribute specialist product lines, engineering, platform development or distribution; their presence in a broad technology ecosystem does not establish interchangeable market revenue. Silicon-photonics transceiver modules across 40G, 100G and 200G/400G types for the page-defined application categories; distinguish data-network optical modules from optical-sensing modules and medical instruments.

What obstacles constrain si photonics transceivers purchases?

laser reliability, packaging precision, optical test yield, electrical power, thermal tolerance and high-speed interface qualification can force customers to lengthen technical trials or defer spending. Integrated silicon waveguides route light across photonic chips, Mach-Zehnder or microring modulators encode high-rate PAM4 symbols, and germanium photodiodes convert receive-side light to electrical signals. External laser options and integrated gain must be qualified separately: laser noise, insertion loss, fiber coupling and receiver sensitivity affect the completed optical module.

What does the 2027–2036 si photonics transceivers scope include?

The analysis uses a 2026 base, 2027 estimated year and 2036 end of forecast, considering type segments 40G Si Photonics Transceivers, 100G Si Photonics Transceivers, 200G/400G Si Photonics Transceivers and application categories Datacenter Transceivers, Long Haul Transceivers, Optical Interconnects, Automotive LiDAR, Immunoassay Tests, Fiber-optic Gyroscope, Others. Geographic coverage spans Asia-Pacific, North America, Europe, South America and the Middle East and Africa.

Research Sources & Evidence Base

View research sources used for this overview
  1. Intel. Silicon photonics and OCI chiplets, Intel technology page describing on-chip integrated lasers and high-volume photonic transceiver deployments
  2. Intel. Demonstrates integrated optical I/O chiplet, 26 June 2024; 4 Tbps bidirectional chiplet and historical PIC shipment evidence
  3. Cisco. Fiscal 2026 Q2 prepared remarks, February 2026; 1.6T OSFP and 800G LPO using Cisco silicon photonics
  4. Cisco. Cisco advances optical scalability at OCP, 12 October 2026; next-generation 400G-per-lane design collaboration
  5. Coherent. Next-generation pluggable transceivers at OFC, 17 March 2026; 1.6T silicon-photonics PIC and higher-rate demonstrators
  6. Coherent. 1.6T SiPh transceiver with next-generation DSP, 31 March 2025; 1.6T DR8 with Marvell Ara 3nm DSP
  7. Coherent. Driver and TIA integrated circuits, 22 September 2025; silicon-photonics Mach-Zehnder drivers for 800G and 1.6T
  8. Coherent. High-power CW lasers, 25 September 2025; 400 mW 1311-nm laser sampling and reliability metrics
  9. Marvell. 1.6T Silicon Photonics Light Engine, 17 March 2026; eight 200G PAM4 optical lanes per package
  10. STMicroelectronics. PIC100 reaches high-volume production, 9 March 2026; 300-mm PIC100 for 800G and 1.6T and capacity investment
  11. GlobalFoundries. SCALE optical-engine announcement, 4 May 2026; co-packaged optical engine and OCI MSA
  12. GlobalFoundries. Acquisition of Advanced Micro Foundry, 17 November 2025; Singapore photonics process and production footprint
  13. Tower Semiconductor. 1.6T data-centre optical modules, 5 February 2026; Tower photonics platform supports NVIDIA-network optical modules
  14. Tower Semiconductor. 300mm silicon photonics foundry process, 26 November 2024; new 300-mm standard offering alongside PH18
  15. Ranovus. ODIN optical engine collaboration with Jabil, 31 March 2025; high-volume manufacturing of co-packaged optical engines
  16. Ethernet Alliance. Ethernet roadmap 2026, 2026 primary standards-industry roadmap to 800G and emerging 1.6Tb/s Ethernet
  17. International Energy Agency. Energy demand from AI, 2025 analysis: data-centre electricity demand 415 TWh in 2024 and 945 TWh projected in 2030
  18. SEMI. 300mm Fab Outlook Q3 2026, 2026 semiconductor fab equipment investment and geographical capacity footprint
  19. European Commission. Chips for Europe pilot lines, 16 January 2025; EUR 3.7 billion in funded semiconductor pilot lines including PICs
  20. imec. 300mm BTO silicon photonics integration, 27 January 2026; high-speed lower-power electro-optical modulation research
  21. Semiconductor Industry Association. 2025 semiconductor industry sales, 6 February 2026; annual sector semiconductor sales context distinct from optical-module revenue
Si Photonics Transceivers Market

Get Sample Report PDF for Exclusive Insights

Report Sample Includes

  • Table of Contents
  • List of Tables & Figures
  • Charts, Research Methodology, and more...

PDF Icon Download Sample Report PDF

Download Sample Report

Table of Content

Table of Contents
1 Research Methodology and Statistical Scope
1.1 Market Definition and Statistical Scope of Si Photonics Transceivers
1.2 Key Market Segments
1.2.1 Si Photonics Transceivers Segment by Type
1.2.2 Si Photonics Transceivers Segment by Application
1.3 Methodology & Sources of Information
1.3.1 Research Methodology
1.3.2 Research Process
1.3.3 Market Breakdown and Data Triangulation
1.3.4 Base Year
1.3.5 Report Assumptions & Caveats
2 Si Photonics Transceivers Market Overview
2.1 Global Market Overview
2.1.1 Global Si Photonics Transceivers Market Size (M USD) Estimates and Forecasts (2026-2034)
2.1.2 Global Si Photonics Transceivers Sales Estimates and Forecasts (2026-2034)
2.2 Market Segment Executive Summary
2.3 Global Market Size by Region
3 Si Photonics Transceivers Market Competitive Landscape
3.1 Global Si Photonics Transceivers Sales by Manufacturers (2019-2025)
3.2 Global Si Photonics Transceivers Revenue Market Share by Manufacturers (2019-2025)
3.3 Si Photonics Transceivers Market Share by Company Type (Tier 1, Tier 2, and Tier 3)
3.4 Global Si Photonics Transceivers Average Price by Manufacturers (2019-2025)
3.5 Manufacturers Si Photonics Transceivers Sales Sites, Area Served, Product Type
3.6 Si Photonics Transceivers Market Competitive Situation and Trends
3.6.1 Si Photonics Transceivers Market Concentration Rate
3.6.2 Global 5 and 10 Largest Si Photonics Transceivers Players Market Share by Revenue
3.6.3 Mergers & Acquisitions, Expansion
4 Si Photonics Transceivers Industry Chain Analysis
4.1 Si Photonics Transceivers Industry Chain Analysis
4.2 Market Overview of Key Raw Materials
4.3 Midstream Market Analysis
4.4 Downstream Customer Analysis
5 The Development and Dynamics of Si Photonics Transceivers Market
5.1 Key Development Trends
5.2 Driving Factors
5.3 Market Challenges
5.4 Market Restraints
5.5 Industry News
5.5.1 New Product Developments
5.5.2 Mergers & Acquisitions
5.5.3 Expansions
5.5.4 Collaboration/Supply Contracts
5.6 Industry Policies
6 Si Photonics Transceivers Market Segmentation by Type
6.1 Evaluation Matrix of Segment Market Development Potential (Type)
6.2 Global Si Photonics Transceivers Sales Market Share by Type (2019-2025)
6.3 Global Si Photonics Transceivers Market Size Market Share by Type (2019-2025)
6.4 Global Si Photonics Transceivers Price by Type (2019-2025)
7 Si Photonics Transceivers Market Segmentation by Application
7.1 Evaluation Matrix of Segment Market Development Potential (Application)
7.2 Global Si Photonics Transceivers Market Sales by Application (2019-2025)
7.3 Global Si Photonics Transceivers Market Size (M USD) by Application (2019-2025)
7.4 Global Si Photonics Transceivers Sales Growth Rate by Application (2019-2025)
8 Si Photonics Transceivers Market Segmentation by Region
8.1 Global Si Photonics Transceivers Sales by Region
8.1.1 Global Si Photonics Transceivers Sales by Region
8.1.2 Global Si Photonics Transceivers Sales Market Share by Region
8.2 North America
8.2.1 North America Si Photonics Transceivers Sales by Country
8.2.2 U.S.
8.2.3 Canada
8.2.4 Mexico
8.3 Europe
8.3.1 Europe Si Photonics Transceivers Sales by Country
8.3.2 Germany
8.3.3 France
8.3.4 U.K.
8.3.5 Italy
8.3.6 Russia
8.4 Asia Pacific
8.4.1 Asia Pacific Si Photonics Transceivers Sales by Region
8.4.2 China
8.4.3 Japan
8.4.4 South Korea
8.4.5 India
8.4.6 Southeast Asia
8.5 South America
8.5.1 South America Si Photonics Transceivers Sales by Country
8.5.2 Brazil
8.5.3 Argentina
8.5.4 Columbia
8.6 Middle East and Africa
8.6.1 Middle East and Africa Si Photonics Transceivers Sales by Region
8.6.2 Saudi Arabia
8.6.3 UAE
8.6.4 Egypt
8.6.5 Nigeria
8.6.6 South Africa
9 Key Companies Profile
9.1 Cisco Systems
9.1.1 Cisco Systems Si Photonics Transceivers Basic Information
9.1.2 Cisco Systems Si Photonics Transceivers Product Overview
9.1.3 Cisco Systems Si Photonics Transceivers Product Market Performance
9.1.4 Cisco Systems Business Overview
9.1.5 Cisco Systems Si Photonics Transceivers SWOT Analysis
9.1.6 Cisco Systems Recent Developments
9.2 Intel
9.2.1 Intel Si Photonics Transceivers Basic Information
9.2.2 Intel Si Photonics Transceivers Product Overview
9.2.3 Intel Si Photonics Transceivers Product Market Performance
9.2.4 Intel Business Overview
9.2.5 Intel Si Photonics Transceivers SWOT Analysis
9.2.6 Intel Recent Developments
9.3 InPhi
9.3.1 InPhi Si Photonics Transceivers Basic Information
9.3.2 InPhi Si Photonics Transceivers Product Overview
9.3.3 InPhi Si Photonics Transceivers Product Market Performance
9.3.4 InPhi Si Photonics Transceivers SWOT Analysis
9.3.5 InPhi Business Overview
9.3.6 InPhi Recent Developments
9.4 Finisar (II-VI Incorporated)
9.4.1 Finisar (II-VI Incorporated) Si Photonics Transceivers Basic Information
9.4.2 Finisar (II-VI Incorporated) Si Photonics Transceivers Product Overview
9.4.3 Finisar (II-VI Incorporated) Si Photonics Transceivers Product Market Performance
9.4.4 Finisar (II-VI Incorporated) Business Overview
9.4.5 Finisar (II-VI Incorporated) Recent Developments
9.5 Juniper
9.5.1 Juniper Si Photonics Transceivers Basic Information
9.5.2 Juniper Si Photonics Transceivers Product Overview
9.5.3 Juniper Si Photonics Transceivers Product Market Performance
9.5.4 Juniper Business Overview
9.5.5 Juniper Recent Developments
9.6 Rockley Photonics
9.6.1 Rockley Photonics Si Photonics Transceivers Basic Information
9.6.2 Rockley Photonics Si Photonics Transceivers Product Overview
9.6.3 Rockley Photonics Si Photonics Transceivers Product Market Performance
9.6.4 Rockley Photonics Business Overview
9.6.5 Rockley Photonics Recent Developments
9.7 FUJITSU
9.7.1 FUJITSU Si Photonics Transceivers Basic Information
9.7.2 FUJITSU Si Photonics Transceivers Product Overview
9.7.3 FUJITSU Si Photonics Transceivers Product Market Performance
9.7.4 FUJITSU Business Overview
9.7.5 FUJITSU Recent Developments
10 Si Photonics Transceivers Market Forecast by Region
10.1 Global Si Photonics Transceivers Market Size Forecast
10.2 Global Si Photonics Transceivers Market Forecast by Region
10.2.1 North America Market Size Forecast by Country
10.2.2 Europe Si Photonics Transceivers Market Size Forecast by Country
10.2.3 Asia Pacific Si Photonics Transceivers Market Size Forecast by Region
10.2.4 South America Si Photonics Transceivers Market Size Forecast by Country
10.2.5 Middle East and Africa Forecasted Consumption of Si Photonics Transceivers by Country
11 Forecast Market by Type and by Application (2025-2030)
11.1 Global Si Photonics Transceivers Market Forecast by Type (2025-2030)
11.1.1 Global Forecasted Sales of Si Photonics Transceivers by Type (2025-2030)
11.1.2 Global Si Photonics Transceivers Market Size Forecast by Type (2025-2030)
11.1.3 Global Forecasted Price of Si Photonics Transceivers by Type (2025-2030)
11.2 Global Si Photonics Transceivers Market Forecast by Application (2025-2030)
11.2.1 Global Si Photonics Transceivers Sales (K Units) Forecast by Application
11.2.2 Global Si Photonics Transceivers Market Size (M USD) Forecast by Application (2025-2030)
12 Conclusion and Key FindingsList of Tables
Table 1. Introduction of the Type
Table 2. Introduction of the Application
Table 3. Market Size (M USD) Segment Executive Summary
Table 4. Si Photonics Transceivers Market Size Comparison by Region (M USD)
Table 5. Global Si Photonics Transceivers Sales (K Units) by Manufacturers (2019-2025)
Table 6. Global Si Photonics Transceivers Sales Market Share by Manufacturers (2019-2025)
Table 7. Global Si Photonics Transceivers Revenue (M USD) by Manufacturers (2019-2025)
Table 8. Global Si Photonics Transceivers Revenue Share by Manufacturers (2019-2025)
Table 9. Company Type (Tier 1, Tier 2, and Tier 3) & (based on the Revenue in Si Photonics Transceivers as of 2022)
Table 10. Global Market Si Photonics Transceivers Average Price (USD/Unit) of Key Manufacturers (2019-2025)
Table 11. Manufacturers Si Photonics Transceivers Sales Sites and Area Served
Table 12. Manufacturers Si Photonics Transceivers Product Type
Table 13. Global Si Photonics Transceivers Manufacturers Market Concentration Ratio (CR5 and HHI)
Table 14. Mergers & Acquisitions, Expansion Plans
Table 15. Industry Chain Map of Si Photonics Transceivers
Table 16. Market Overview of Key Raw Materials
Table 17. Midstream Market Analysis
Table 18. Downstream Customer Analysis
Table 19. Key Development Trends
Table 20. Driving Factors
Table 21. Si Photonics Transceivers Market Challenges
Table 22. Global Si Photonics Transceivers Sales by Type (K Units)
Table 23. Global Si Photonics Transceivers Market Size by Type (M USD)
Table 24. Global Si Photonics Transceivers Sales (K Units) by Type (2019-2025)
Table 25. Global Si Photonics Transceivers Sales Market Share by Type (2019-2025)
Table 26. Global Si Photonics Transceivers Market Size (M USD) by Type (2019-2025)
Table 27. Global Si Photonics Transceivers Market Size Share by Type (2019-2025)
Table 28. Global Si Photonics Transceivers Price (USD/Unit) by Type (2019-2025)
Table 29. Global Si Photonics Transceivers Sales (K Units) by Application
Table 30. Global Si Photonics Transceivers Market Size by Application
Table 31. Global Si Photonics Transceivers Sales by Application (2019-2025) & (K Units)
Table 32. Global Si Photonics Transceivers Sales Market Share by Application (2019-2025)
Table 33. Global Si Photonics Transceivers Sales by Application (2019-2025) & (M USD)
Table 34. Global Si Photonics Transceivers Market Share by Application (2019-2025)
Table 35. Global Si Photonics Transceivers Sales Growth Rate by Application (2019-2025)
Table 36. Global Si Photonics Transceivers Sales by Region (2019-2025) & (K Units)
Table 37. Global Si Photonics Transceivers Sales Market Share by Region (2019-2025)
Table 38. North America Si Photonics Transceivers Sales by Country (2019-2025) & (K Units)
Table 39. Europe Si Photonics Transceivers Sales by Country (2019-2025) & (K Units)
Table 40. Asia Pacific Si Photonics Transceivers Sales by Region (2019-2025) & (K Units)
Table 41. South America Si Photonics Transceivers Sales by Country (2019-2025) & (K Units)
Table 42. Middle East and Africa Si Photonics Transceivers Sales by Region (2019-2025) & (K Units)
Table 43. Cisco Systems Si Photonics Transceivers Basic Information
Table 44. Cisco Systems Si Photonics Transceivers Product Overview
Table 45. Cisco Systems Si Photonics Transceivers Sales (K Units), Revenue (M USD), Price (USD/Unit) and Gross Margin (2019-2025)
Table 46. Cisco Systems Business Overview
Table 47. Cisco Systems Si Photonics Transceivers SWOT Analysis
Table 48. Cisco Systems Recent Developments
Table 49. Intel Si Photonics Transceivers Basic Information
Table 50. Intel Si Photonics Transceivers Product Overview
Table 51. Intel Si Photonics Transceivers Sales (K Units), Revenue (M USD), Price (USD/Unit) and Gross Margin (2019-2025)
Table 52. Intel Business Overview
Table 53. Intel Si Photonics Transceivers SWOT Analysis
Table 54. Intel Recent Developments
Table 55. InPhi Si Photonics Transceivers Basic Information
Table 56. InPhi Si Photonics Transceivers Product Overview
Table 57. InPhi Si Photonics Transceivers Sales (K Units), Revenue (M USD), Price (USD/Unit) and Gross Margin (2019-2025)
Table 58. InPhi Si Photonics Transceivers SWOT Analysis
Table 59. InPhi Business Overview
Table 60. InPhi Recent Developments
Table 61. Finisar (II-VI Incorporated) Si Photonics Transceivers Basic Information
Table 62. Finisar (II-VI Incorporated) Si Photonics Transceivers Product Overview
Table 63. Finisar (II-VI Incorporated) Si Photonics Transceivers Sales (K Units), Revenue (M USD), Price (USD/Unit) and Gross Margin (2019-2025)
Table 64. Finisar (II-VI Incorporated) Business Overview
Table 65. Finisar (II-VI Incorporated) Recent Developments
Table 66. Juniper Si Photonics Transceivers Basic Information
Table 67. Juniper Si Photonics Transceivers Product Overview
Table 68. Juniper Si Photonics Transceivers Sales (K Units), Revenue (M USD), Price (USD/Unit) and Gross Margin (2019-2025)
Table 69. Juniper Business Overview
Table 70. Juniper Recent Developments
Table 71. Rockley Photonics Si Photonics Transceivers Basic Information
Table 72. Rockley Photonics Si Photonics Transceivers Product Overview
Table 73. Rockley Photonics Si Photonics Transceivers Sales (K Units), Revenue (M USD), Price (USD/Unit) and Gross Margin (2019-2025)
Table 74. Rockley Photonics Business Overview
Table 75. Rockley Photonics Recent Developments
Table 76. FUJITSU Si Photonics Transceivers Basic Information
Table 77. FUJITSU Si Photonics Transceivers Product Overview
Table 78. FUJITSU Si Photonics Transceivers Sales (K Units), Revenue (M USD), Price (USD/Unit) and Gross Margin (2019-2025)
Table 79. FUJITSU Business Overview
Table 80. FUJITSU Recent Developments
Table 81. Global Si Photonics Transceivers Sales Forecast by Region (2025-2030) & (K Units)
Table 82. Global Si Photonics Transceivers Market Size Forecast by Region (2025-2030) & (M USD)
Table 83. North America Si Photonics Transceivers Sales Forecast by Country (2025-2030) & (K Units)
Table 84. North America Si Photonics Transceivers Market Size Forecast by Country (2025-2030) & (M USD)
Table 85. Europe Si Photonics Transceivers Sales Forecast by Country (2025-2030) & (K Units)
Table 86. Europe Si Photonics Transceivers Market Size Forecast by Country (2025-2030) & (M USD)
Table 87. Asia Pacific Si Photonics Transceivers Sales Forecast by Region (2025-2030) & (K Units)
Table 88. Asia Pacific Si Photonics Transceivers Market Size Forecast by Region (2025-2030) & (M USD)
Table 89. South America Si Photonics Transceivers Sales Forecast by Country (2025-2030) & (K Units)
Table 90. South America Si Photonics Transceivers Market Size Forecast by Country (2025-2030) & (M USD)
Table 91. Middle East and Africa Si Photonics Transceivers Consumption Forecast by Country (2025-2030) & (Units)
Table 92. Middle East and Africa Si Photonics Transceivers Market Size Forecast by Country (2025-2030) & (M USD)
Table 93. Global Si Photonics Transceivers Sales Forecast by Type (2025-2030) & (K Units)
Table 94. Global Si Photonics Transceivers Market Size Forecast by Type (2025-2030) & (M USD)
Table 95. Global Si Photonics Transceivers Price Forecast by Type (2025-2030) & (USD/Unit)
Table 96. Global Si Photonics Transceivers Sales (K Units) Forecast by Application (2025-2030)
Table 97. Global Si Photonics Transceivers Market Size Forecast by Application (2025-2030) & (M USD)
List of Figures
Figure 1. Product Picture of Si Photonics Transceivers
Figure 2. Data Triangulation
Figure 3. Key Caveats
Figure 4. Global Si Photonics Transceivers Market Size (M USD), 2026-2034
Figure 5. Global Si Photonics Transceivers Market Size (M USD) (2026-2034)
Figure 6. Global Si Photonics Transceivers Sales (K Units) & (2026-2034)
Figure 7. Evaluation Matrix of Segment Market Development Potential (Type)
Figure 8. Evaluation Matrix of Segment Market Development Potential (Application)
Figure 9. Evaluation Matrix of Regional Market Development Potential
Figure 10. Si Photonics Transceivers Market Size by Country (M USD)
Figure 11. Si Photonics Transceivers Sales Share by Manufacturers in 2023
Figure 12. Global Si Photonics Transceivers Revenue Share by Manufacturers in 2023
Figure 13. Si Photonics Transceivers Market Share by Company Type (Tier 1, Tier 2 and Tier 3): 2023
Figure 14. Global Market Si Photonics Transceivers Average Price (USD/Unit) of Key Manufacturers in 2023
Figure 15. The Global 5 and 10 Largest Players: Market Share by Si Photonics Transceivers Revenue in 2023
Figure 16. Evaluation Matrix of Segment Market Development Potential (Type)
Figure 17. Global Si Photonics Transceivers Market Share by Type
Figure 18. Sales Market Share of Si Photonics Transceivers by Type (2019-2025)
Figure 19. Sales Market Share of Si Photonics Transceivers by Type in 2023
Figure 20. Market Size Share of Si Photonics Transceivers by Type (2019-2025)
Figure 21. Market Size Market Share of Si Photonics Transceivers by Type in 2023
Figure 22. Evaluation Matrix of Segment Market Development Potential (Application)
Figure 23. Global Si Photonics Transceivers Market Share by Application
Figure 24. Global Si Photonics Transceivers Sales Market Share by Application (2019-2025)
Figure 25. Global Si Photonics Transceivers Sales Market Share by Application in 2023
Figure 26. Global Si Photonics Transceivers Market Share by Application (2019-2025)
Figure 27. Global Si Photonics Transceivers Market Share by Application in 2023
Figure 28. Global Si Photonics Transceivers Sales Growth Rate by Application (2019-2025)
Figure 29. Global Si Photonics Transceivers Sales Market Share by Region (2019-2025)
Figure 30. North America Si Photonics Transceivers Sales and Growth Rate (2019-2025) & (K Units)
Figure 31. North America Si Photonics Transceivers Sales Market Share by Country in 2023
Figure 32. U.S. Si Photonics Transceivers Sales and Growth Rate (2019-2025) & (K Units)
Figure 33. Canada Si Photonics Transceivers Sales (K Units) and Growth Rate (2019-2025)
Figure 34. Mexico Si Photonics Transceivers Sales (Units) and Growth Rate (2019-2025)
Figure 35. Europe Si Photonics Transceivers Sales and Growth Rate (2019-2025) & (K Units)
Figure 36. Europe Si Photonics Transceivers Sales Market Share by Country in 2023
Figure 37. Germany Si Photonics Transceivers Sales and Growth Rate (2019-2025) & (K Units)
Figure 38. France Si Photonics Transceivers Sales and Growth Rate (2019-2025) & (K Units)
Figure 39. U.K. Si Photonics Transceivers Sales and Growth Rate (2019-2025) & (K Units)
Figure 40. Italy Si Photonics Transceivers Sales and Growth Rate (2019-2025) & (K Units)
Figure 41. Russia Si Photonics Transceivers Sales and Growth Rate (2019-2025) & (K Units)
Figure 42. Asia Pacific Si Photonics Transceivers Sales and Growth Rate (K Units)
Figure 43. Asia Pacific Si Photonics Transceivers Sales Market Share by Region in 2023
Figure 44. China Si Photonics Transceivers Sales and Growth Rate (2019-2025) & (K Units)
Figure 45. Japan Si Photonics Transceivers Sales and Growth Rate (2019-2025) & (K Units)
Figure 46. South Korea Si Photonics Transceivers Sales and Growth Rate (2019-2025) & (K Units)
Figure 47. India Si Photonics Transceivers Sales and Growth Rate (2019-2025) & (K Units)
Figure 48. Southeast Asia Si Photonics Transceivers Sales and Growth Rate (2019-2025) & (K Units)
Figure 49. South America Si Photonics Transceivers Sales and Growth Rate (K Units)
Figure 50. South America Si Photonics Transceivers Sales Market Share by Country in 2023
Figure 51. Brazil Si Photonics Transceivers Sales and Growth Rate (2019-2025) & (K Units)
Figure 52. Argentina Si Photonics Transceivers Sales and Growth Rate (2019-2025) & (K Units)
Figure 53. Columbia Si Photonics Transceivers Sales and Growth Rate (2019-2025) & (K Units)
Figure 54. Middle East and Africa Si Photonics Transceivers Sales and Growth Rate (K Units)
Figure 55. Middle East and Africa Si Photonics Transceivers Sales Market Share by Region in 2023
Figure 56. Saudi Arabia Si Photonics Transceivers Sales and Growth Rate (2019-2025) & (K Units)
Figure 57. UAE Si Photonics Transceivers Sales and Growth Rate (2019-2025) & (K Units)
Figure 58. Egypt Si Photonics Transceivers Sales and Growth Rate (2019-2025) & (K Units)
Figure 59. Nigeria Si Photonics Transceivers Sales and Growth Rate (2019-2025) & (K Units)
Figure 60. South Africa Si Photonics Transceivers Sales and Growth Rate (2019-2025) & (K Units)
Figure 61. Global Si Photonics Transceivers Sales Forecast by Volume (2026-2034) & (K Units)
Figure 62. Global Si Photonics Transceivers Market Size Forecast by Value (2026-2034) & (M USD)
Figure 63. Global Si Photonics Transceivers Sales Market Share Forecast by Type (2025-2030)
Figure 64. Global Si Photonics Transceivers Market Share Forecast by Type (2025-2030)
Figure 65. Global Si Photonics Transceivers Sales Forecast by Application (2025-2030)
Figure 66. Global Si Photonics Transceivers Market Share Forecast by Application (2025-2030)