SEMICONDUCTOR INSIGHT
MARKET RESEARCH REPORT

Optical Module Package Market

2026 to 2034
MARKET INTELLIGENCE
ACROSS KEY REGIONS
2026 EDITION
OPTOELECTRONICS Semiconductor Market Research

Optical Module Package Market

Trends, Business Strategies 2026-2034

◷
UPDATED 16 September 2026
▤
REPORT LENGTH Detailed Report
▣
REPORT CODE 393aaf9f4ee2
▯
FORMATS PDF

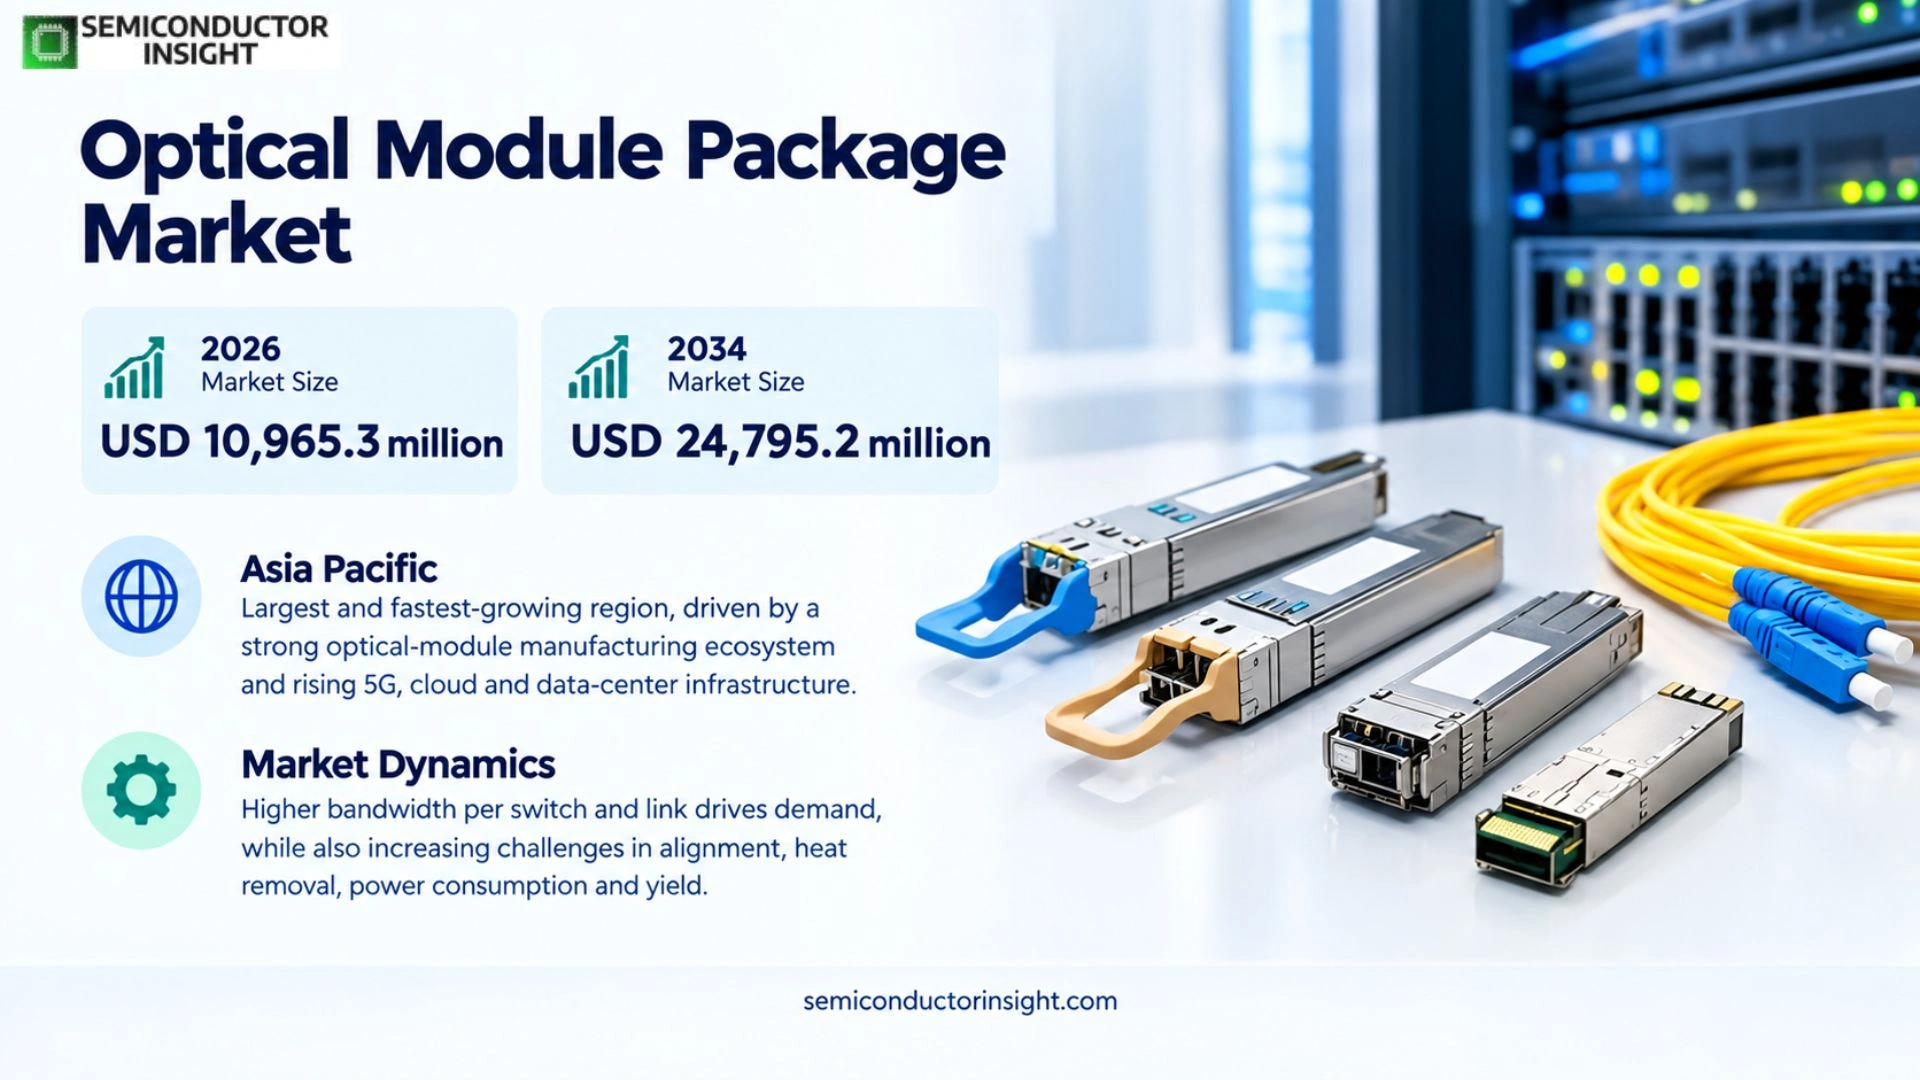
Optical Module Package Market is estimated at USD 10,965.3 million in 2026, and is projected to reach USD 24,795.2 million by 2034, a 10.7% CAGR during 2026–2034, while Asia Pacific is the largest regional market.

Get the sample PDF with study scope, segmentation and methodology details.

Key Statistics

2025 Market Size
USD 9,902.1 million
2026 Estimated Size
USD 10,965.3 million
2034 Projected Size
USD 24,795.2 million
CAGR (2026–2034)
10.7%
Largest Market in 2025
Asia Pacific

Key Takeaways

  • QSFP+/QSFP28 remains the largest packaging family because 100G-class connectivity is deeply qualified across cloud, telecom and enterprise networks, while the installed ecosystem keeps these form factors commercially relevant even as new AI fabrics move toward 800G and 1.6T.
  • QSFP-DD is the fastest-growing type as its high-density electrical interface and backward-compatible pluggable architecture let operators raise faceplate bandwidth without abandoning mature switch and transceiver operating models.
  • Telecommunications is the largest application, supported by access, fronthaul, metro and long-haul fiber upgrades; data communication is growing faster as AI clusters and hyperscale networks compress technology cycles from 400G to 800G and 1.6T.
  • Asia Pacific is the largest and fastest-growing region, combining China-centered optical-module manufacturing with 5G, cloud and data-center demand across China, Japan, South Korea, India and Southeast Asia.
  • Thermal density, precision optical alignment and qualification yield are the principal scaling constraints; at higher lane rates, the package becomes an electro-optical and thermal system rather than a passive enclosure.
  • Value is migrating toward higher-speed, more integrated packages, including silicon-photonics assemblies, coherent pluggables and emerging co-packaged or externally packaged optics that reduce electrical reach and energy per bit.

Optical Module Package Market Overview

Optical Module Package Market was valued at USD 9,902.1 million in 2025, is estimated at USD 10,965.3 million in 2026, and is projected to reach USD 24,795.2 million by 2034. The anchor-implied growth path corresponds to a 10.7% CAGR during 2026–2034, while Asia Pacific is the largest regional market.

Base year: 2025 · Estimated year: 2026 · Forecast period: 2026–2034 · Values in USD million unless otherwise stated

An optical module package is the mechanical, electrical, optical and thermal integration platform that turns discrete photonic and electronic components into a serviceable transceiver. It typically combines a transmitter optical subassembly or integrated photonic transmitter, receiver functions, driver and transimpedance electronics, control circuitry, connectors, shielding and heat-management features inside a standardized pluggable or equipment-specific form factor. The package therefore determines not only physical compatibility but also insertion loss, signal integrity, cooling behavior, manufacturability and field reliability.

Commercial demand is being reshaped by the gap between electrical I/O scaling and the bandwidth required inside modern networks. AI training fabrics, cloud interconnects and upgraded mobile transport networks are moving from 100G and 400G toward 800G and 1.6T links, forcing suppliers to shorten electrical traces, improve optical coupling and dissipate more heat in essentially the same switch faceplate area. This is why package architecture increasingly influences transceiver economics: an optical design that works in the laboratory is not commercially useful unless it can be aligned, sealed, tested and cooled at high manufacturing yield.

The market scope covers standardized package families from SFP/eSFP and XFP/SFP+ through QSFP+/QSFP28, CXP/CXP2, CFP/CFP2 and QSFP-DD, serving telecommunications and data-communication networks. It also spans transmission-rate bands below 10G, 10G-40G, 100G and above 100G, with end use across IT & telecom, healthcare, government & defense, and banking & financial services. The controlling source segmentation is preserved exactly; adjacent products such as stand-alone optical engines and switch ASICs are discussed only when they materially change package requirements.

The evidence outside the report scope points to a durable bandwidth mechanism rather than a temporary component cycle. The IEA estimates data centers used about 415 TWh of electricity in 2024 and projects demand to rise sharply toward 2030 as AI becomes a major load driver, while Ethernet Alliance and OIF work shows the ecosystem moving from mature 800G interoperability toward 1.6T and higher-speed coherent interfaces. These transitions increase the economic value of density, power efficiency, thermal design and repeatable optical coupling in every generation of package.

Segment Analysis: By Type

By type, the optical module package market is segmented into SFP/eSFP, XFP/SFP+, QSFP+/QSFP28, CXP/CXP2, CFP/CFP2 and QSFP-DD. QSFP+/QSFP28 represents the largest established revenue pool because of its broad 40G/100G installed base, while QSFP-DD is expanding fastest as cloud and AI networks require 400G, 800G and emerging 1.6T-class pluggable density.

Type Technical role Market position
SFP/eSFP Compact small-form-factor pluggable packages support mature low- and mid-rate access, enterprise, industrial and telecom links where port density, interchangeability and cost matter more than frontier bandwidth. Their mechanical ecosystem is highly standardized, making the package straightforward to source and qualify across a wide supplier base. A mature, replacement-weighted segment. SFP remains important in access networks, industrial Ethernet, legacy enterprise switching and lower-rate mobile transport, but revenue growth is constrained because bandwidth upgrades often move customers into SFP+, QSFP or higher-density families rather than simply raising the price of the same package.
XFP/SFP+ These packages support 10G-class and related links with a compact pluggable footprint. SFP+ became especially important because it reduced module size and power relative to earlier 10G XFP implementations, enabling denser switch and server configurations while preserving hot-pluggability and field replacement. A large installed-base category with stable replacement demand. It continues to serve enterprise, metro, storage and mobile transport networks, but new hyperscale deployments are increasingly standardized on 100G and above. Price pressure is therefore strong, and supplier advantage rests on cost, reliability and channel availability rather than architectural novelty.
QSFP+/QSFP28 Quad small-form-factor pluggable packaging aggregates multiple electrical and optical lanes into one high-density module. QSFP+ is associated with 40G-class deployments, while QSFP28 became a core 100G form factor and remains a building block for breakout architectures and high-port-count networking equipment. Largest established type. The combination of a huge qualified installed base, broad switch compatibility and high shipment volumes keeps QSFP+/QSFP28 commercially important. It is no longer the frontier of performance, but it anchors mainstream cloud, telecom and enterprise demand and provides the cost benchmark against which newer high-speed packages are evaluated.
CXP/CXP2 CXP-class packages were designed for dense parallel optical interfaces and high aggregate bandwidth using multiple lanes. They are technically useful in specialized high-performance computing, test and proprietary interconnect environments where parallelism matters, but they have less universal front-panel adoption than the QSFP family. A specialized niche rather than a volume center. Demand persists in selected parallel-optics and legacy high-density systems, yet ecosystem momentum has shifted toward QSFP-based form factors with broader switch support. Suppliers compete on continuity of supply, custom optical design and support for long-lived equipment rather than rapid market expansion.
CFP/CFP2 CFP and CFP2 provide larger thermal and mechanical envelopes than compact QSFP packages, historically making them suitable for higher-power coherent and telecom optics where digital signal processing, tunable lasers and optical components required more board area and heat dissipation. A strategically relevant telecom segment whose role is becoming more selective. Coherent metro and transport applications still value the thermal envelope, but advances in DSP efficiency and photonic integration are moving coherent functionality into QSFP-DD and related compact pluggables. Replacement demand and high-performance line-side uses support the segment.
QSFP-DD QSFP Double Density increases the electrical lane count while retaining a familiar high-density pluggable architecture. It supports 400G and 800G products today and is part of the pathway toward still higher rates, placing unusually strict requirements on connector integrity, module cooling, EMI control and optical-engine packaging. Fastest-growing type. Cloud and AI fabrics reward the ability to raise switch faceplate throughput without abandoning the pluggable operating model. Coherent and short-reach QSFP-DD products are now commercially available, and the package benefits from a broad ecosystem of cages, heat sinks, connectors, DSPs and optical engines.

Transmission-rate migration changes package economics

The controlling report also segments the market into below 10G, 10G-40G, 100G and above 100G. The commercial center of gravity is moving decisively toward the last category, but the transition does not eliminate older packages immediately. Network operators qualify optics by platform and link budget, so a new generation must coexist with installed 10G and 100G fleets for years. The result is a two-speed market: mature packages compete on cost and availability, while above-100G packages compete on power per bit, thermal headroom, optical coupling yield and the speed at which they can pass customer qualification.

Segment Analysis: By Application

By application, the market is segmented into Telecommunications and Data Communication. Telecommunications remains the largest application because optical packages are embedded throughout access, mobile transport, metro and long-haul networks, while data communication is the faster-moving demand pool as AI and cloud architectures accelerate 400G-to-800G-to-1.6T upgrade cycles.

Application Demand characteristics
Telecommunications Largest application. Carrier demand spans access aggregation, 5G fronthaul and backhaul, metro transport, coherent links and fixed broadband. Purchasing is qualification-heavy: operators value interoperability, temperature range, service life and assured multi-year supply because modules remain in networks far longer than typical data-center refresh cycles. GSMA’s continuing 5G expansion and public broadband programs in the U.S. and Europe keep the underlying fiber transport base expanding, supporting both mature SFP-class and higher-speed coherent package demand.
Data Communication Fastest-growing application. Hyperscale cloud and AI clusters refresh switching fabrics on much shorter cycles and concentrate thousands of high-bandwidth links inside data halls. Buyers therefore prioritize bandwidth density, energy per bit, thermal performance and rapid qualification at 400G, 800G and 1.6T. IEA data-center power projections and industry interoperability work show why packaging has become critical: the module must deliver more optical throughput without allowing transceiver power and cooling requirements to consume the economics of the compute fabric.

End-use and transmission-rate implications

IT & Telecom is the core end-use industry in the controlling scope, but healthcare, government & defense, and banking & financial services add specification-sensitive demand where availability, security, environmental qualification or deterministic network performance can outweigh lowest cost. Across all end users, migration above 100G increases package value because the bill of materials becomes more integrated and the cost of poor assembly yield rises. This favors suppliers with automated optical alignment, strong test capability and access to silicon-photonics, InP, VCSEL and DSP ecosystems.
Optical Module Package Market Prizing

Regional Analysis

Asia Pacific is the largest and fastest-growing region, combining the deepest optical-module manufacturing ecosystem with rapidly expanding 5G, cloud and data-center infrastructure. North America is the technology-adoption center for AI fabrics, Europe is policy-led by fiber and gigabit targets, while South America and Middle East & Africa are more import-dependent and project-led.

Why do optical module package requirements differ materially by region?

Regional demand is shaped by different bottlenecks. Asia Pacific combines manufacturing scale and domestic network expansion, so cost-down and production yield are decisive. North America is driven by hyperscale architecture and qualification speed at 800G/1.6T. Europe couples fiber modernization with energy-efficiency and interoperability requirements. South America prioritizes landed cost and operator upgrade economics, while Gulf markets can adopt high-end data-center optics quickly even though most modules are imported. Treating these regions as the same demand curve would obscure how suppliers actually win business.

Region Position Growth outlook Demand profile What decides supplier selection
Asia Pacific Largest Fastest Manufacturing + new-build led High-volume yield, cost, local qualification and access to 800G/1.6T components
North America Second / high-value High AI data-center + cloud led Fast hyperscaler qualification, power efficiency, 800G/1.6T roadmap and supply assurance
Europe Established Moderate-high Fiber modernization + regulated infrastructure Interoperability, energy efficiency, lifecycle support and operator qualification
South America Developing Moderate Telecom upgrade + broadband led Landed cost, distributor/operator support, import lead time and compatibility with installed platforms
Middle East & Africa Smaller base High from low base Gulf data centers + mobile/fiber projects Project delivery, high-temperature reliability, channel coverage and global-vendor interoperability
Asia Pacific LARGEST & FASTEST-GROWING

Why does Asia Pacific lead the optical module package market?

Asia Pacific leads because it combines two demand engines that reinforce each other: China-centered optical transceiver manufacturing and a large regional buildout of 5G, cloud and data-center networks. This proximity between component ecosystems and end demand shortens qualification loops, supports aggressive cost-down and makes the region the natural scale-up location for new QSFP-DD and higher-speed optical packages.

Market positionLargest region
Growth outlookFastest in market
Demand profileManufacturing + network buildout
Market access gateYield, cost and platform qualification
Country Position in region What drives demand
China Regional scale anchor China is the region’s largest production and consumption center for optical transceivers, with vendors such as Huawei, Accelink, Hisense, Eoptolink and InnoLight positioned close to telecom and data-center customers. The country’s dense electronics supply chain supports rapid component sourcing and automated assembly, while AI infrastructure and 5G transport upgrades push package requirements toward 800G and 1.6T-class density.
Japan High-value component ecosystem Japan’s role is strongest in precision components, materials, connectors and optoelectronic manufacturing rather than only end-system volume. Suppliers such as Kyocera and Sumitomo Electric contribute packaging, ceramic, fiber and optical-component capabilities that matter when higher-speed modules require tighter dimensional control, better thermal behavior and long reliability qualification.
India & Southeast Asia Fast infrastructure expansion India and Southeast Asia are increasingly important because mobile-data growth, new data-center campuses and broader fiber deployment create greenfield demand rather than only replacement demand. GSMA’s Asia-Pacific outlook points toward roughly 1.5 billion 5G connections by 2030, enlarging the transport-network base that ultimately consumes pluggable optics and package assemblies.
Selected market instances
March 2026 – OFC / regional supplier ecosystem: Eoptolink demonstrated a 1.6T DR4 optical transceiver using 400G-per-lambda technology and stated that 100G-per-lambda 800G products were already in high-volume deployment while 200G-per-lambda 1.6T was ramping. The development matters for package suppliers because it raises alignment, thermal and connector requirements while accelerating investment in next-generation assembly lines.
March 2026 – AI data-center optics: Eoptolink also unveiled a 12.8 Tbps liquid-cooled pluggable-optics concept for AI data centers. Even before such architectures become mainstream, the demonstration shows how heat removal is becoming part of package design rather than an external chassis issue, creating demand for new lids, heat paths, connectors and opto-mechanical integration methods.
2026 outlook – Asia-Pacific mobile networks: GSMA’s Mobile Economy Asia Pacific 2026 projects approximately 1.5 billion 5G connections in the region by 2030. That does not translate one-for-one into optical modules, but it expands fronthaul, midhaul, backhaul and core bandwidth requirements, sustaining demand for both cost-optimized telecom packages and high-speed pluggables used deeper in carrier networks.
The regional analysis emphasizes China, Japan, India and Southeast Asia because these markets have the clearest evidence of manufacturing concentration, component capability or network expansion. It intentionally avoids filling every country slot with unsupported market-share estimates.
North America AI-INFRASTRUCTURE LEADER

Why is North America the highest-value adoption market for advanced optical packages?

North America is the architecture-setting market for advanced data-center optics because U.S. hyperscalers, AI infrastructure builders and networking vendors qualify new Ethernet generations early and at scale. The region therefore pulls disproportionate demand for 800G, 1.6T and coherent QSFP-DD packages even when much of the physical module assembly occurs in Asia, making qualification speed and energy efficiency more important than local manufacturing share.

Market positionHigh-value / second-largest
Growth outlookHigh
Demand profileHyperscale AI + cloud
Market access gateHyperscaler qualification
Country Position in region What drives demand
United States Primary demand center The United States combines the world’s largest concentration of hyperscale cloud operators with major switch, DSP and photonics suppliers. IEA estimates North America, led by the U.S., represents a large share of current data-center electricity use and expects U.S. data-center demand to rise sharply through 2030, a direct indicator of the compute and interconnect buildout driving optical package upgrades.
Canada Cloud and metro expansion Canada is smaller but benefits from cloud-region deployment, AI-compute investment and cross-border network integration. Demand is concentrated in data-center interconnect, metro transport and enterprise networks, so suppliers typically enter through the same global OEM and distributor qualifications used in the United States rather than through a separate indigenous module ecosystem.
Selected market instances
17 March 2026 – OFC 2026: Coherent demonstrated next-generation pluggable transceiver technologies spanning 1.6T, 3.2T and emerging 12.8T interconnect concepts. The significance is not simply headline bandwidth: every step raises thermal density and shortens allowable electrical reach, forcing package designers to improve heat spreading, optical-engine placement and automated assembly repeatability.
9 February 2026 – U.S. broadband infrastructure: NTIA announced that 50 of 56 BEAD final proposals had been approved. BEAD is primarily an access-network program rather than a data-center program, yet new fiber construction expands aggregation and backhaul capacity, sustaining demand for standardized pluggable optical modules across carrier and regional networks.
28 March 2025 – Coherent commercial launch: Coherent announced general availability of 800G ZR/ZR+ coherent optics in the QSFP-DD form factor. Moving coherent transport into a compact pluggable package materially changes packaging economics by placing high-power DSP, optics and thermal management into a dense front-panel envelope that previously favored larger telecom modules.
North American analysis is concentrated on the United States because hyperscaler procurement, AI infrastructure and public broadband funding provide the strongest direct evidence. Canada is included where its demand follows the same North American cloud and carrier qualification ecosystem.
Europe FIBER & INTEROPERABILITY LED

What makes Europe structurally different from the North American optical package market?

Europe is more policy- and operator-led than hyperscaler-led. Fiber modernization, very-high-capacity-network targets and mature mobile infrastructure create steady demand for interoperable, energy-efficient optics across access, metro and data-center networks. Supplier selection therefore emphasizes lifecycle support, standards compliance and operator qualification, while the region remains dependent on a globally distributed optical-component and module-manufacturing base.

Market positionEstablished market
Growth outlookModerate-high
Demand profileFiber modernization
Market access gateInteroperability + lifecycle support
Country Position in region What drives demand
Germany Industrial + carrier demand Germany combines large enterprise and industrial-network demand with ongoing fiber and 5G modernization. The EU Digital Decade connectivity framework raises the baseline for very-high-capacity infrastructure, but customers are conservative about qualification and service life, favoring suppliers able to support modules across long equipment cycles rather than only offering the newest data rate.
France Fiber-rich operator market France’s extensive fiber deployment and large telecom base support replacement and capacity-upgrade demand from access through metro layers. As traffic rises, operators can move to higher-rate uplinks without rebuilding every endpoint, so package demand tends to migrate in steps from mature SFP/SFP+ toward QSFP and coherent pluggables where aggregation bandwidth justifies the premium.
Nordics / Benelux Data-center concentration Nordic and Benelux markets matter disproportionately for data-center interconnect because of power availability, international fiber routes and cloud-region concentration. These deployments favor high-speed QSFP-DD and coherent optics, but energy efficiency is commercially important because transceiver power contributes directly to rack-level thermal design and operating cost.
Selected market instances
17 June 2026 – European Commission: The Digital Decade 2026 connectivity report recorded EU27 FTTP coverage of 74.1%, VHCN coverage of 85.6% and basic 5G coverage of 96.8% for 2025. High coverage does not end optical demand; it shifts spending toward capacity, aggregation and quality upgrades that use higher-rate optical packages deeper in the network.
2026 implementation – Gigabit Infrastructure Act: The EU Gigabit Infrastructure Act is intended to simplify and reduce the cost of very-high-capacity network deployment. Lower civil-work friction improves the economics of extending fiber, which broadens the installed base of access and aggregation equipment and supports recurring demand for standardized pluggable optical packages over the life of those networks.
2025-2026 – 800G interoperability: Ethernet Alliance interoperability work reported 800G as mature while the ecosystem advanced toward 1.6T and 200 Gbps-per-lane signaling. European equipment makers and operators benefit from this standards maturity because multi-vendor compatibility reduces qualification risk and allows high-speed packages to move from laboratory demonstrations into broader procurement.
Europe is presented through the countries and subregions with the clearest combination of fiber, telecom and data-center demand. The analysis avoids unsupported country market shares and instead ties adoption to documented connectivity coverage and technology standards.
South America IMPORT-LED GROWTH

Where is the strongest optical module package demand in South America?

South American demand is concentrated in Brazil and a smaller set of metropolitan telecom markets where fiber, mobile-network modernization and cloud connectivity are expanding. The region imports most high-performance optical modules, so landed cost, currency exposure, distributor inventory and compatibility with installed operator platforms matter more than local package innovation. This creates steady demand but slower adoption of premium generations than in hyperscale markets.

Market positionDeveloping
Growth outlookModerate
Demand profileCarrier upgrades + cloud
Market access gateLanded cost + local support
Country Position in region What drives demand
Brazil Largest regional demand center Brazil is the most important market because of its population scale, data-center concentration and major mobile and fixed-network operators. Purchases span mature SFP/SFP+ access optics and higher-rate QSFP packages for aggregation and cloud interconnect. Because most advanced modules are imported, suppliers with local inventory, technical support and predictable lead times can outperform technically similar competitors.
Chile Data-center and backbone niche Chile is smaller in telecom volume but relevant for regional cloud and data-center investment, international connectivity and long-haul backbone requirements. The addressable package mix therefore skews somewhat higher in performance than its population alone would imply, while procurement still depends heavily on global OEM qualification and imported optical modules.
Selected market instances
2025-2030 outlook – Latin American 5G: GSMA’s global mobile outlook projects 5G to represent a materially larger share of Latin American connections by 2030. The implication for optical packages is gradual rather than immediate: mobile radio upgrades pull more bandwidth into aggregation and core networks, where operators increase optical line rates as traffic grows.
2025-2026 – Regional cloud buildout: Global cloud platforms continue expanding Latin American regions and interconnection capacity, particularly around Brazil and Chile. Each new data-center cluster increases demand for high-speed data-center interconnect and metro fiber, but procurement typically follows global module platforms, giving qualified international suppliers a structural advantage over small local assemblers.
Ongoing – Import economics: Currency volatility and long international supply chains remain a practical purchasing constraint. Operators and integrators often extend the life of qualified 10G/100G platforms until a bandwidth threshold justifies migration, which makes inventory availability and backward compatibility unusually important when suppliers introduce higher-speed optical package generations.
Brazil is the principal country focus because it has the strongest evidence of telecom, cloud and data-center scale. Chile is included for its connectivity and data-center role; other markets are not assigned unsupported quantitative shares.
Middle East & Africa PROJECT-LED HIGH GROWTH

Why can the Middle East & Africa grow quickly despite a smaller installed base?

The region combines two very different markets. Gulf countries can deploy greenfield hyperscale data centers, 5G and national digital infrastructure using current-generation optics from the start, while much of Sub-Saharan Africa remains focused on basic coverage, backbone and international capacity. That creates high percentage growth from a smaller base, with demand split between premium data-center packages in the Gulf and cost-sensitive telecom optics elsewhere.

Market positionSmaller base
Growth outlookHigh from low base
Demand profileGulf AI/DC + telecom backbone
Market access gateProject delivery + environmental reliability
Country Position in region What drives demand
Saudi Arabia & UAE Premium greenfield demand Saudi Arabia and the UAE are the strongest high-end demand centers because new cloud regions, AI infrastructure and 5G networks can specify 400G/800G optics without carrying the same legacy burden as older markets. High ambient temperatures and dense racks place extra value on package thermal design, while procurement is often bundled through global network and cloud vendors.
South Africa Regional enterprise hub South Africa has the deepest enterprise, carrier and data-center ecosystem in Sub-Saharan Africa. Demand spans metro, backbone, colocation and enterprise connectivity, with higher-speed packages concentrated in Johannesburg and Cape Town data-center clusters. Import dependency makes distributor support and replacement availability important alongside optical performance.
East / West African cable landing markets Backbone expansion nodes Markets connected to new subsea and terrestrial fiber systems generate optical demand first at landing stations, backbone routes and major metropolitan exchanges. Package requirements prioritize reach, interoperability and ruggedness rather than frontier faceplate density, so telecom-oriented SFP, QSFP and coherent formats can grow even where hyperscale data-center demand remains limited.
Selected market instances
2030 outlook – Gulf 5G adoption: GSMA’s 2025 global outlook projected exceptionally high 5G adoption in Gulf Cooperation Council markets by 2030. That trajectory expands fronthaul, backhaul and core-network capacity requirements, creating a favorable environment for higher-rate optical packages even though the modules themselves are predominantly sourced from global suppliers.
2025-2026 – Gulf data-center announcements: Major cloud and AI infrastructure programs in Saudi Arabia and the UAE are creating greenfield network fabrics where 400G and 800G are increasingly baseline design considerations. Greenfield procurement is important because it lets operators skip legacy intermediate generations and specify high-density optical packages from the outset.
Ongoing – African backbone expansion: New subsea systems and terrestrial fiber routes continue to add international and regional capacity across Africa. The immediate package opportunity sits in landing stations, carrier backbones and data-center interconnect rather than consumer endpoints, favoring interoperable telecom optics and suppliers that can support geographically distributed networks.
The region is deliberately split between Gulf high-end infrastructure and African backbone markets because their purchasing logic is not interchangeable. Country detail is limited to locations where infrastructure evidence supports a distinct commercial role.

Competitive Landscape

Competition is defined less by ownership of a metal enclosure than by the ability to integrate optics, electronics and thermal design at high yield across successive speed generations. Coherent, InnoLight, Huawei, Accelink, Eoptolink and other optical specialists compete with networking and semiconductor groups such as Cisco, Intel and Broadcom, while Kyocera and Sumitomo Electric contribute component and packaging depth.

The highest-value competitive capability is rapid industrialization of new optical engines. At 800G and 1.6T, suppliers must align lasers or fibers to photonic devices with micron-scale repeatability, validate DSP and electrical interfaces, control electromagnetic emissions and keep module temperature within specification. A vendor that reaches acceptable yield several quarters earlier can capture platform qualifications that repeat across very large switch deployments, giving manufacturing engineering as much strategic weight as photonic design.

Vertical integration provides different advantages by supplier. Optical specialists that control laser, photonic, assembly and module design can co-optimize performance and yield. Networking vendors can influence system architecture and secure captive or preferred qualifications. Semiconductor companies bring DSP, SerDes and silicon-photonics integration. Component groups with ceramics, connectors, fiber and precision packaging benefit as package tolerances tighten. No single model dominates every application; the winning structure depends on whether the buyer optimizes for scale, reach, power or lifecycle support.

The market also has a pronounced generational pricing curve. Mature 10G and 100G modules experience persistent price compression because standards are stable and the qualified supplier base is broad. New 800G and 1.6T packages carry higher value but also higher test cost and yield risk. Suppliers therefore need a portfolio that harvests mature-volume manufacturing while funding continuous qualification of the next generation, otherwise a technology transition can erase revenue faster than the new line ramps.

Customer concentration is a further strategic variable. Hyperscale data-center buyers can absorb enormous volumes but demand aggressive cost reductions, dual sourcing and customized telemetry or thermal behavior. Telecom buyers purchase more slowly but require longer support windows and detailed reliability qualification. Suppliers that diversify across both channels can reduce exposure to a single upgrade cycle, though they must maintain more package variants and qualification programs.

Competitive tier Companies / roles Positioning logic
Integrated optical leaders Coherent; InnoLight Technology; Huawei; Accelink; Eoptolink; Hisense; Source Photonics Compete through high-speed transceiver portfolios, optical-engine know-how, scale manufacturing and direct qualification with cloud or telecom customers. Their advantage is the ability to move a package from optical design into repeatable volume assembly while keeping power, thermal behavior and yield within a commercially acceptable envelope.
Networking / silicon ecosystem Cisco; Intel; Broadcom Influence package requirements through switch architecture, SerDes, DSP and silicon-photonics capabilities. Their strategic leverage is system-level: they can shorten electrical reach, define interface requirements and integrate optical functions more tightly with networking silicon, which can shift value away from a conventional discrete module architecture.
Precision component / packaging specialists Kyocera; Sumitomo Electric Industries; HGG and specialized component suppliers Provide ceramics, connectors, fiber, precision structures and other enabling technologies that become more valuable as optical alignment and thermal tolerances tighten. These suppliers are less visible to end users but can hold defensible positions because a packaging material or subassembly often requires lengthy reliability and manufacturing qualification.

Companies profiled in the source scope

The controlling report scope profiles Coherent, InnoLight Technology, Cisco, Huawei, Accelink, Hisense, Eoptolink, HGG, Intel, Source Photonics, Kyocera, Broadcom and Sumitomo Electric Industries. This full list is preserved even though the companies occupy different layers of the value chain, from complete optical transceivers and networking systems to silicon, photonic components, precision materials and packaging technologies.

Production Capacity Analysis

Production capacity is concentrated in Asian optical-module assembly ecosystems, but the real constraint is not floor space; it is qualified precision assembly and test capacity at acceptable yield. As line rates move to 800G and 1.6T, optical coupling, DSP test, thermal validation and burn-in become more demanding, so a nominally large factory can still be capacity-constrained at the newest generation.

China is the dominant scale center for optical transceiver assembly because it combines a dense component supply base with experienced automated and semi-automated production lines. Japan contributes high-value materials and precision components, while Southeast Asia is attractive for diversification and assembly expansion. North America retains important photonics, silicon and design capabilities, but high-volume final module manufacturing is globally distributed. This geography means export controls, logistics and supplier qualification can affect effective capacity even when physical assembly tools are available.

Advanced package capacity is constrained by process capability. Passive placement is insufficient at high speeds; manufacturers need active optical alignment, accurate fiber attach, controlled reflow or bonding, low-loss connectors, high-speed electrical test and thermal characterization. Yield loss is expensive because the module contains valuable lasers, photonic integrated circuits and DSPs. Capacity expansion therefore requires both capital equipment and a stable process window, which explains why established suppliers can defend share during a speed transition.

The next production challenge is thermal. Higher port density raises module power within fixed chassis airflow, and coherent optics add further DSP load. Suppliers are responding with improved heat spreaders, optimized module cages, lower-power DSPs, silicon photonics and, at the frontier, liquid-cooled or externally packaged architectures. These changes can alter the package bill of materials and assembly sequence, creating openings for new suppliers while forcing incumbent lines to be requalified.

Market Dynamics

Growth is driven by a structural rise in bandwidth per switch and per transport link, not merely by more fiber endpoints. AI clusters, cloud interconnects, 5G transport and gigabit access all move traffic toward higher aggregation rates. The same mechanism creates the market’s restraints: every increase in bandwidth makes optical alignment, heat removal, power consumption and manufacturing yield more difficult.

Market Drivers

Driver Impact Commercial mechanism
AI and hyperscale fabric upgrades High AI clusters are accelerating the move from 400G toward 800G and 1.6T. Higher radix and faster GPU interconnects increase the number and value of optical packages while placing greater weight on energy per bit and package thermal design.
5G and fiber-network expansion High Mobile transport and fixed-broadband buildouts add optical endpoints and raise aggregation capacity. Public broadband programs and high 5G adoption create recurring demand across SFP, QSFP and coherent package families rather than only frontier data-center modules.
Ethernet and coherent standards maturity Medium-High Interoperability at 800G and progress toward 1.6T reduce customer qualification risk. Once electrical and optical interfaces stabilize, multiple suppliers can industrialize compatible packages, enabling broader deployment and lower system-level switching cost.
Silicon photonics and integration Medium-High Photonic integration can reduce component count and shorten optical/electrical paths, improving manufacturability at scale. It also changes package architecture, increasing demand for precision fiber attach, thermal interfaces and co-design between photonics and electronics.

AI compute makes bandwidth density a purchasing constraint

The IEA’s data-center energy outlook shows why AI infrastructure is not a marginal workload. As compute density rises, network fabrics must move more data between accelerators without allowing interconnect power to grow proportionally. That requirement pushes operators toward 800G and 1.6T optics, which increases the package’s role in signal integrity, optical coupling and cooling. Package suppliers benefit when they can demonstrate lower watts per transmitted bit, stable thermal performance and repeatable yield at hyperscale volumes.

5G and broadband programs expand the optical transport base

5G radio access does not consume high-end data-center packages directly at every site, but it creates more fronthaul, midhaul, backhaul and core traffic. GSMA’s adoption trajectory and U.S. and EU broadband policies therefore enlarge the installed fiber network on which pluggable optics are used. The commercial effect is broad: mature SFP/SFP+ remains relevant at access edges, while QSFP and coherent packages gain as traffic aggregates toward regional and core facilities.

Standards maturity converts prototypes into multi-vendor markets

Ethernet Alliance work at 800G and 200 Gbps per lane, together with OIF implementation agreements for 800ZR and 800LR, provides the interoperability framework needed for broad procurement. Buyers are more willing to dual-source when form factors, electrical interfaces and optical behavior are standardized. This expands the addressable market for qualified package vendors, but it also raises competitive pressure because differentiation must move from basic compatibility to power, reach, yield, reliability and cost.

Photonic integration raises the strategic value of packaging

Silicon photonics, InP integration and compact coherent engines move more functionality into a smaller footprint, but they do not remove packaging; they make it more demanding. Fiber coupling tolerances, chip-to-chip electrical reach and thermal interfaces become system-level performance variables. Suppliers able to co-design the photonic engine, substrate, connector and heat path can reduce assembly steps and improve yield, giving packaging engineering a direct role in module cost and performance.

Market Restraints

Restraint Impact Commercial mechanism
Thermal density at 800G/1.6T High Power rises faster than available faceplate area, forcing more expensive heat-spreading, airflow and sometimes liquid-cooling solutions. Thermal failures can cap usable bandwidth even when optical and electrical functions meet laboratory specifications.
Precision alignment and yield High Advanced modules require tight optical coupling and high-speed test. Small yield losses consume expensive lasers, PICs and DSPs, slowing ramps and keeping new-generation package costs elevated.
Rapid product-generation turnover Medium-High A package platform can move from premium to mature pricing within a few years. Suppliers must recover tooling and qualification investment quickly while avoiding obsolete inventory.
Supply-chain and trade exposure Medium Lasers, DSPs, photonic wafers, connectors and assembly capacity are geographically concentrated. Trade restrictions or component shortages can delay qualification and force costly redesign or dual sourcing.

Heat removal is becoming a package-level ceiling

An 800G or 1.6T transceiver can meet optical specifications and still be commercially unusable if switch airflow cannot remove its heat. Dense front panels leave limited surface area, while coherent DSPs and high-speed electrical interfaces add power. Suppliers must therefore invest in heat spreaders, cage design, lower-power electronics and detailed thermal simulation. These solutions add cost and can reduce interchangeability, slowing qualification when customers require the same chassis to support multiple module vendors.

Manufacturing yield can lag bandwidth capability

The hardest part of a new optical generation is often not demonstrating one working module but producing thousands with stable coupling loss, eye performance and reliability. Active alignment, fiber attach, photonic die variation and high-speed test all contribute to yield loss. Because the components inside advanced modules are expensive, poor yield quickly erodes gross margin. This favors experienced manufacturers and can delay the point at which a new package becomes economical for mainstream buyers.

Technology cycles create inventory and tooling risk

Optical networking advances in discrete speed steps. A supplier may invest in fixtures, test equipment and qualified component inventories for one form factor just as a major customer begins migrating to a higher rate or different architecture. Mature products then face aggressive price erosion while the new generation still carries launch cost. Managing this overlap requires disciplined platform reuse and close visibility into customer roadmaps, which can be difficult for smaller vendors.

Geographic concentration increases sourcing risk

High-speed DSPs, lasers, photonic integrated circuits and module assembly are produced across a limited number of technology clusters. Export restrictions, logistics disruption or single-source qualification can therefore reduce effective supply even when aggregate industry capacity looks ample. Buyers increasingly request second sources, but qualifying an alternate optical engine or package is not instantaneous because thermal, firmware and link behavior must be revalidated on the target system.

Market Opportunities

QSFP-DD migration from 400G into 800G and coherent applications

The clearest near-term opportunity is to reuse a familiar high-density pluggable ecosystem while increasing throughput. Suppliers that can deliver QSFP-DD packages with strong thermal performance, low insertion loss and multi-vendor interoperability can address both data-center Ethernet and compact coherent transport. The opportunity extends beyond complete modules to cages, connectors, heat spreaders, optical engines and automated assembly equipment, broadening the value pool around the form factor.

1.6T and 200G-per-lane industrialization

Interoperability activity is moving toward 1.6TbE and 200 Gbps-per-lane signaling. This transition creates a qualification window in which package design is not yet commoditized. Vendors can differentiate through shorter electrical paths, better channel loss, precise optical coupling and advanced cooling. Early design wins matter because hyperscale platforms can generate large repeat orders, and the manufacturing process developed for 1.6T may become the foundation for later 3.2T architectures.

Coherent pluggables in metro and data-center interconnect

OIF 800ZR/800LR work and commercial QSFP-DD coherent products are bringing line-side functions into compact pluggables. This expands the addressable package market by shifting some capacity away from larger dedicated transport cards. Vendors that solve DSP heat, optical isolation and connector integrity inside the pluggable envelope can participate in metro, DCI and carrier aggregation use cases where performance and interoperability command a premium.

New thermal architectures for AI optics

As optical power density rises, conventional air-cooled cages may become insufficient in the densest AI systems. Liquid-cooled pluggables, externally packaged optics and co-packaged optics are therefore opportunities rather than only threats. Each architecture needs new mechanical interfaces, fiber management, sealing and serviceability solutions. Packaging suppliers that adapt their capabilities can retain value even if the industry moves some optics closer to the switch ASIC.

Supply Chain Analysis

Stage 1
Photonic & electronic components
Lasers, photodetectors, PICs, DSPs, drivers, TIAs, substrates and connectors set the optical, electrical and thermal performance ceiling.
Stage 2
Precision package / subassembly
Optical engines, TOSA/ROSA functions, ceramics, fiber attach and heat-spreading components convert discrete devices into manufacturable building blocks.
Stage 3
Module assembly & test
Final integration, firmware, calibration, burn-in and high-speed test determine qualified yield and production economics.
Stage 4
OEM / cloud / telecom deployment
Platform qualification with switch, transport and network customers controls design-in, repeat volume and lifecycle support.

Photonic & electronic components. Lasers, photodetectors, silicon-photonics or InP devices, DSPs, drivers, TIAs, substrates and connectors set the performance ceiling before final assembly begins. These components are capital- and IP-intensive, and several are concentrated among a small number of suppliers. Package vendors therefore qualify multiple component combinations where possible, but substitution is constrained because optical power, thermal behavior, firmware and electrical characteristics interact at the module level.

Precision package and subassembly. TOSA/ROSA assemblies, optical engines, ferrules, ceramics, heat spreaders and fiber attachments convert discrete components into manufacturable building blocks. This stage captures value through dimensional control and process know-how rather than raw material content. At higher rates, micron-level alignment and low-loss interfaces become more important, so suppliers with automated active-alignment capability and stable materials can earn durable design positions.

Module assembly and test. Final manufacturing integrates the optical engine, PCB, DSP, control firmware, connector and thermal structure, then verifies link performance across temperature and operating conditions. Test time can become a throughput bottleneck because 800G/1.6T modules require expensive high-speed equipment. Yield data feeds back into package design, making manufacturers with large production datasets better able to identify tolerances that reduce cost without sacrificing reliability.

OEM, cloud and telecom deployment. The final value gate is platform qualification. Hyperscalers optimize power, density and total cost at enormous volume; telecom operators emphasize interoperability, reach and long service life; enterprise buyers rely more heavily on OEM compatibility and channels. Once a package is qualified on a switch or transport platform, replacement and expansion purchases can persist for years, so design-in position is more strategically valuable than any single module shipment.

Recent Developments in the Optical Module Package Market

Developments tracked to September 2026. Entries are dated to the source publication or official milestone.

  • 17 March 2026 New technology
    Coherent demonstrated a portfolio of next-generation pluggable transceiver technologies at OFC 2026 spanning 1.6T, 3.2T and emerging 12.8T concepts. The roadmap shows that package engineering must support rapidly increasing lane rates and thermal density, expanding demand for improved optical coupling, heat spreading and compact mechanical interfaces.
    Source
  • 12 March 2026 Demonstration
    Eoptolink demonstrated a 1.6T DR4 transceiver based on 400G-per-lambda technology. The company described 800G as already in high-volume deployment and 1.6T as ramping, evidence that advanced package lines are moving from prototype builds toward industrialization rather than remaining purely experimental.
    Source
  • 12 March 2026 Thermal architecture
    Eoptolink unveiled a 12.8 Tbps liquid-cooled pluggable-optics concept for AI data centers. The development is commercially relevant because it moves cooling into the optical package design itself, potentially creating a new component ecosystem around liquid interfaces, sealing, serviceability and high-density fiber management.
    Source
  • 27 October 2025 Interoperability
    Ethernet Alliance reported 800G interoperability as established and highlighted progress toward 1.6T. Standards maturity lowers the risk of qualifying multi-vendor modules, helping package technologies move from proprietary early deployments into larger addressable markets with common electrical and optical interfaces.
    Source
  • 22 April 2025 Standard
    OIF released its 800LR coherent implementation agreement for interoperable, low-power, high-capacity 10 km optical solutions. Compact coherent specifications broaden the role of pluggable packages in data-center interconnect and metro applications, where thermal control and optical integration are decisive design constraints.
    Source

Report Scope & Segmentation

Attribute Coverage
Market Optical Module Package Market
Base Year 2025
Estimated Year 2026
Forecast Period 2026-2034
By Type SFP/eSFP; XFP/SFP+; QSFP+/QSFP28; CXP/CXP2; CFP/CFP2; QSFP-DD
By Application Telecommunications; Data Communication
By Transmission Rate Below 10G; 10G-40G; 100G; Above 100G
By End Use Industry IT & Telecom; Healthcare; Government & Defense; Banking & Financial Services
Regions North America; Europe; Asia Pacific; South America; Middle East & Africa
Companies Profiled Coherent; InnoLight Technology; Cisco; Huawei; Accelink; Hisense; Eoptolink; HGG; Intel; Source Photonics; Kyocera; Broadcom; Sumitomo Electric Industries
Customization Scope Free report customization can alter country, regional or segment scope within the defined analyst-work allocation while preserving the controlling market definition and clearly separating any added custom scope from the standard segmentation.

Frequently Asked Questions

What is the size of the optical module package market?

The global optical module package market is rebased to USD 9,902.1 million in 2025, estimated at USD 10,965.3 million in 2026, and projected to reach USD 24,795.2 million by 2034. These values imply a CAGR of 10.7% during 2026-2034. The series is calculated from the source-page anchors of USD 8,942 million in 2024 and USD 20,220 million in 2032 rather than the conflicting printed CAGR.

Which type leads the optical module package market?

QSFP+/QSFP28 is the largest established packaging family because it serves a very large qualified 40G/100G installed base across cloud, telecom and enterprise networks. QSFP-DD is the faster-growing type because operators can use its denser electrical interface for 400G, 800G and emerging higher-rate pluggables while retaining a familiar hot-swappable front-panel operating model and a broad ecosystem of cages, connectors and thermal hardware.

Which application is largest for optical module packages?

Telecommunications remains the largest application because optical packages are deployed across fixed access, mobile fronthaul and backhaul, metro aggregation and long-haul transport networks. Data Communication is growing faster as AI and hyperscale cloud fabrics compress network upgrade cycles and move quickly toward 800G and 1.6T. The two applications differ commercially: telecom emphasizes lifecycle and interoperability, while data centers emphasize density, power efficiency and qualification speed.

Which region leads the optical module package market?

Asia Pacific is the largest and fastest-growing region because it combines the deepest optical-module manufacturing ecosystem with major end-market demand from 5G, cloud and data-center infrastructure. China anchors both production and consumption, Japan contributes precision components and materials, and India plus Southeast Asia add greenfield network and data-center growth. This co-location of supply and demand supports faster cost-down and scale-up for new package generations.

What is driving growth in optical module packaging?

The strongest growth mechanism is rising bandwidth per network link. AI clusters, hyperscale cloud interconnects, 5G transport and expanding fiber access push aggregation speeds from 100G and 400G toward 800G and 1.6T. Every step increases the value of package engineering because shorter electrical paths, precise optical coupling and better heat removal are required to make the higher data rate manufacturable and reliable at volume rather than merely demonstrable in a laboratory.

What are the main restraints on the optical module package market?

Thermal density, precision optical alignment, manufacturing yield and rapid technology turnover are the main constraints. Advanced modules contain expensive photonic devices and DSPs, so a small deterioration in assembly yield can materially raise cost. At the same time, denser front panels leave limited cooling area. Suppliers must therefore invest in high-speed test, active alignment, thermal simulation and new heat-spreading solutions while recovering those investments before the next speed generation arrives.

How is silicon photonics changing optical module packages?

Silicon photonics can consolidate optical functions and shorten electrical paths, but it increases rather than eliminates the importance of packaging. Fibers or lasers still need precise coupling to the photonic die, electronics must be placed close enough to preserve signal integrity, and heat must be removed without disturbing optical alignment. The commercial opportunity therefore shifts toward co-designed optical engines, advanced fiber attach, thermal interfaces and repeatable automated assembly instead of simple mechanical enclosures.

Why is QSFP-DD important to the market?

QSFP-DD gives equipment vendors a high-density, hot-pluggable path to higher switch faceplate bandwidth and supports both short-reach data-center optics and compact coherent applications. Its value comes from ecosystem compatibility as much as raw bandwidth: cages, connectors, management interfaces and deployment practices are familiar to operators. However, fitting higher-power DSPs and optics into the envelope creates demanding thermal and electromagnetic requirements, increasing the technical value of the package.

Who are the key companies in the optical module package market?

The controlling report profiles Coherent, InnoLight Technology, Cisco, Huawei, Accelink, Hisense, Eoptolink, HGG, Intel, Source Photonics, Kyocera, Broadcom and Sumitomo Electric Industries. They do not all occupy the same layer: some sell complete optical modules, some define network or silicon architectures, and others contribute components or precision packaging. Competition therefore centers on qualified integration, manufacturing yield, technology roadmap and access to major cloud or telecom platforms.

What technology transition will matter most through 2034?

The most important transition is the industrialization of 1.6T and later multi-terabit optical connectivity while keeping energy per bit and module temperature economically manageable. Ethernet and OIF interoperability work, together with supplier demonstrations, shows that the industry is already moving beyond 800G. Whether the winning architecture remains conventional pluggables, uses liquid-cooled pluggables, or shifts selected links toward externally packaged or co-packaged optics, precision packaging will remain a critical value layer.

Research Sources & Evidence Base

View research sources used for this overview
  1. International Energy Agency (IEA). Energy and AI, Data-centre electricity demand, AI infrastructure expansion and the regional concentration of digital-load growth..
  2. International Energy Agency (IEA). Energy demand from AI, Regional data-centre electricity-demand outlook used to distinguish North America, China, Europe and Southeast Asia..
  3. GSMA. The Mobile Economy 2026, Global mobile-network and 5G adoption context supporting telecom transport and optical interconnect demand..
  4. GSMA. The Mobile Economy Asia Pacific 2026, Asia-Pacific 5G adoption outlook, including the projected 1.5 billion 5G connections by 2030..
  5. European Commission. Digital Decade 2026: Connectivity Coverage in Europe 2025, EU fixed and mobile connectivity coverage, including FTTP, VHCN and 5G coverage metrics..
  6. European Commission. Gigabit Infrastructure Act, Policy framework intended to lower the cost and accelerate deployment of very-high-capacity networks in the EU..
  7. U.S. NTIA. 50 BEAD Final Proposals Approved, Public broadband-investment milestone used as evidence for U.S. fiber-network construction and access-network equipment demand..
  8. Ethernet Alliance. ECOC 2025: Interoperability at 800G Is a Given, Advancing Toward 1.6T, Industry interoperability evidence for the transition from 800G toward 1.6T Ethernet optics..
  9. Ethernet Alliance. Ethernet Alliance Marks Milestone with 200Gbps Plugfest, Interoperability work around 200 Gbps-per-lane signaling and 1.6TbE technology..
  10. OIF. Implementation Agreements, Published coherent-optics implementation agreements, including 800ZR and 800LR specifications..
  11. Coherent. Next-Generation Pluggable Transceiver Demonstrations at OFC 2026, Supplier evidence for 1.6T, 3.2T and emerging 12.8T optical interconnect technology..
  12. Coherent. General Availability of 800G ZR/ZR+ in QSFP-DD, Commercial availability evidence for 800G coherent pluggable optics in a high-density standardized form factor..
  13. Eoptolink. 1.6T DR4 Optical Transceiver Demonstration at OFC 2026, Supplier evidence on 400G-per-lane 1.6T DR4 optics and the transition from 800G volume production to 1.6T..
  14. Eoptolink. 12.8 Tbps Liquid-Cooled Pluggable Optics for AI Data Centers, Evidence on next-generation high-bandwidth pluggable optics, liquid cooling and AI-cluster interconnect requirements..
Optical Module Package Market, Trends, Business Strategies 2026-2034

Get Sample Report PDF for Exclusive Insights

Report Sample Includes

  • Table of Contents
  • List of Tables & Figures
  • Charts, Research Methodology, and more...
Download Sample Report PDF

Download Sample Report

Table of Content

1 Introduction to Research & Analysis Reports
1.1 Optical Module Package Market Definition
1.2 Market Segments
1.2.1 Segment by Type
1.2.2 Segment by Application
1.3 Global Optical Module Package Market Overview
1.4 Features & Benefits of This Report
1.5 Methodology & Sources of Information
1.5.1 Research Methodology
1.5.2 Research Process
1.5.3 Base Year
1.5.4 Report Assumptions & Caveats
2 Global Optical Module Package Overall Market Size
2.1 Global Optical Module Package Market Size: 2024 VS 2032
2.2 Global Optical Module Package Market Size, Prospects & Forecasts: 2020-2032
2.3 Key Market Trends, Opportunity, Drivers and Restraints
2.3.1 Market Opportunities & Trends
2.3.2 Market Drivers
2.3.3 Market Restraints
3 Company Landscape
3.1 Top Optical Module Package Players in Global Market
3.2 Top Global Optical Module Package Companies Ranked by Revenue
3.3 Global Optical Module Package Revenue by Companies
3.4 Top 3 and Top 5 Optical Module Package Companies in Global Market, by Revenue in 2024
3.5 Global Companies Optical Module Package Product Type
3.6 Tier 1, Tier 2, and Tier 3 Optical Module Package Players in Global Market
3.6.1 List of Global Tier 1 Optical Module Package Companies
3.6.2 List of Global Tier 2 and Tier 3 Optical Module Package Companies
4 Sights by Product
4.1 Overview
4.1.1 Segmentation by Type – Global Optical Module Package Market Size Markets, 2024 & 2032
4.1.2 SFP/eSFP
4.1.3 XFP /SFP+
4.1.4 QSFP+/QSFP28
4.1.5 CXP/CXP2
4.1.6 CFP/CFP2
4.1.7 QSFP-DD
4.2 Segmentation by Type – Global Optical Module Package Revenue & Forecasts
4.2.1 Segmentation by Type – Global Optical Module Package Revenue, 2020-2025
4.2.2 Segmentation by Type – Global Optical Module Package Revenue, 2026-2032
4.2.3 Segmentation by Type – Global Optical Module Package Revenue Market Share, 2020-2032
5 Sights by Application
5.1 Overview
5.1.1 Segmentation by Application – Global Optical Module Package Market Size, 2024 & 2032
5.1.2 Telecommunications
5.1.3 Data Communication
5.2 Segmentation by Application – Global Optical Module Package Revenue & Forecasts
5.2.1 Segmentation by Application – Global Optical Module Package Revenue, 2020-2025
5.2.2 Segmentation by Application – Global Optical Module Package Revenue, 2026-2032
5.2.3 Segmentation by Application – Global Optical Module Package Revenue Market Share, 2020-2032
6 Sights by Region
6.1 By Region – Global Optical Module Package Market Size, 2024 & 2032
6.2 By Region – Global Optical Module Package Revenue & Forecasts
6.2.1 By Region – Global Optical Module Package Revenue, 2020-2025
6.2.2 By Region – Global Optical Module Package Revenue, 2026-2032
6.2.3 By Region – Global Optical Module Package Revenue Market Share, 2020-2032
6.3 North America
6.3.1 By Country – North America Optical Module Package Revenue, 2020-2032
6.3.2 United States Optical Module Package Market Size, 2020-2032
6.3.3 Canada Optical Module Package Market Size, 2020-2032
6.3.4 Mexico Optical Module Package Market Size, 2020-2032
6.4 Europe
6.4.1 By Country – Europe Optical Module Package Revenue, 2020-2032
6.4.2 Germany Optical Module Package Market Size, 2020-2032
6.4.3 France Optical Module Package Market Size, 2020-2032
6.4.4 U.K. Optical Module Package Market Size, 2020-2032
6.4.5 Italy Optical Module Package Market Size, 2020-2032
6.4.6 Russia Optical Module Package Market Size, 2020-2032
6.4.7 Nordic Countries Optical Module Package Market Size, 2020-2032
6.4.8 Benelux Optical Module Package Market Size, 2020-2032
6.5 Asia
6.5.1 By Region – Asia Optical Module Package Revenue, 2020-2032
6.5.2 China Optical Module Package Market Size, 2020-2032
6.5.3 Japan Optical Module Package Market Size, 2020-2032
6.5.4 South Korea Optical Module Package Market Size, 2020-2032
6.5.5 Southeast Asia Optical Module Package Market Size, 2020-2032
6.5.6 India Optical Module Package Market Size, 2020-2032
6.6 South America
6.6.1 By Country – South America Optical Module Package Revenue, 2020-2032
6.6.2 Brazil Optical Module Package Market Size, 2020-2032
6.6.3 Argentina Optical Module Package Market Size, 2020-2032
6.7 Middle East & Africa
6.7.1 By Country – Middle East & Africa Optical Module Package Revenue, 2020-2032
6.7.2 Turkey Optical Module Package Market Size, 2020-2032
6.7.3 Israel Optical Module Package Market Size, 2020-2032
6.7.4 Saudi Arabia Optical Module Package Market Size, 2020-2032
6.7.5 UAE Optical Module Package Market Size, 2020-2032
7 Companies Profiles
7.1 Coherent
7.1.1 Coherent Corporate Summary
7.1.2 Coherent Business Overview
7.1.3 Coherent Optical Module Package Major Product Offerings
7.1.4 Coherent Optical Module Package Revenue in Global Market (2020-2025)
7.1.5 Coherent Key News & Latest Developments
7.2 InnoLight
7.2.1 InnoLight Corporate Summary
7.2.2 InnoLight Business Overview
7.2.3 InnoLight Optical Module Package Major Product Offerings
7.2.4 InnoLight Optical Module Package Revenue in Global Market (2020-2025)
7.2.5 InnoLight Key News & Latest Developments
7.3 Cisco
7.3.1 Cisco Corporate Summary
7.3.2 Cisco Business Overview
7.3.3 Cisco Optical Module Package Major Product Offerings
7.3.4 Cisco Optical Module Package Revenue in Global Market (2020-2025)
7.3.5 Cisco Key News & Latest Developments
7.4 Huawei
7.4.1 Huawei Corporate Summary
7.4.2 Huawei Business Overview
7.4.3 Huawei Optical Module Package Major Product Offerings
7.4.4 Huawei Optical Module Package Revenue in Global Market (2020-2025)
7.4.5 Huawei Key News & Latest Developments
7.5 Accelink
7.5.1 Accelink Corporate Summary
7.5.2 Accelink Business Overview
7.5.3 Accelink Optical Module Package Major Product Offerings
7.5.4 Accelink Optical Module Package Revenue in Global Market (2020-2025)
7.5.5 Accelink Key News & Latest Developments
7.6 Hisense
7.6.1 Hisense Corporate Summary
7.6.2 Hisense Business Overview
7.6.3 Hisense Optical Module Package Major Product Offerings
7.6.4 Hisense Optical Module Package Revenue in Global Market (2020-2025)
7.6.5 Hisense Key News & Latest Developments
7.7 Eoptolink
7.7.1 Eoptolink Corporate Summary
7.7.2 Eoptolink Business Overview
7.7.3 Eoptolink Optical Module Package Major Product Offerings
7.7.4 Eoptolink Optical Module Package Revenue in Global Market (2020-2025)
7.7.5 Eoptolink Key News & Latest Developments
7.8 HGG
7.8.1 HGG Corporate Summary
7.8.2 HGG Business Overview
7.8.3 HGG Optical Module Package Major Product Offerings
7.8.4 HGG Optical Module Package Revenue in Global Market (2020-2025)
7.8.5 HGG Key News & Latest Developments
7.9 Intel
7.9.1 Intel Corporate Summary
7.9.2 Intel Business Overview
7.9.3 Intel Optical Module Package Major Product Offerings
7.9.4 Intel Optical Module Package Revenue in Global Market (2020-2025)
7.9.5 Intel Key News & Latest Developments
7.10 Source Photonics
7.10.1 Source Photonics Corporate Summary
7.10.2 Source Photonics Business Overview
7.10.3 Source Photonics Optical Module Package Major Product Offerings
7.10.4 Source Photonics Optical Module Package Revenue in Global Market (2020-2025)
7.10.5 Source Photonics Key News & Latest Developments
7.11 Kyocera
7.11.1 Kyocera Corporate Summary
7.11.2 Kyocera Business Overview
7.11.3 Kyocera Optical Module Package Major Product Offerings
7.11.4 Kyocera Optical Module Package Revenue in Global Market (2020-2025)
7.11.5 Kyocera Key News & Latest Developments
7.12 Broadcom
7.12.1 Broadcom Corporate Summary
7.12.2 Broadcom Business Overview
7.12.3 Broadcom Optical Module Package Major Product Offerings
7.12.4 Broadcom Optical Module Package Revenue in Global Market (2020-2025)
7.12.5 Broadcom Key News & Latest Developments
7.13 Sumitomo Electric Industries
7.13.1 Sumitomo Electric Industries Corporate Summary
7.13.2 Sumitomo Electric Industries Business Overview
7.13.3 Sumitomo Electric Industries Optical Module Package Major Product Offerings
7.13.4 Sumitomo Electric Industries Optical Module Package Revenue in Global Market (2020-2025)
7.13.5 Sumitomo Electric Industries Key News & Latest Developments
7.14 Gigalight
7.14.1 Gigalight Corporate Summary
7.14.2 Gigalight Business Overview
7.14.3 Gigalight Optical Module Package Major Product Offerings
7.14.4 Gigalight Optical Module Package Revenue in Global Market (2020-2025)
7.14.5 Gigalight Key News & Latest Developments
7.15 ATOP Technology
7.15.1 ATOP Technology Corporate Summary
7.15.2 ATOP Technology Business Overview
7.15.3 ATOP Technology Optical Module Package Major Product Offerings
7.15.4 ATOP Technology Optical Module Package Revenue in Global Market (2020-2025)
7.15.5 ATOP Technology Key News & Latest Developments
7.16 FIBERSTAMP
7.16.1 FIBERSTAMP Corporate Summary
7.16.2 FIBERSTAMP Business Overview
7.16.3 FIBERSTAMP Optical Module Package Major Product Offerings
7.16.4 FIBERSTAMP Optical Module Package Revenue in Global Market (2020-2025)
7.16.5 FIBERSTAMP Key News & Latest Developments
7.17 FOIT
7.17.1 FOIT Corporate Summary
7.17.2 FOIT Business Overview
7.17.3 FOIT Optical Module Package Major Product Offerings
7.17.4 FOIT Optical Module Package Revenue in Global Market (2020-2025)
7.17.5 FOIT Key News & Latest Developments
7.18 Lumentum
7.18.1 Lumentum Corporate Summary
7.18.2 Lumentum Business Overview
7.18.3 Lumentum Optical Module Package Major Product Offerings
7.18.4 Lumentum Optical Module Package Revenue in Global Market (2020-2025)
7.18.5 Lumentum Key News & Latest Developments
7.19 AOI
7.19.1 AOI Corporate Summary
7.19.2 AOI Business Overview
7.19.3 AOI Optical Module Package Major Product Offerings
7.19.4 AOI Optical Module Package Revenue in Global Market (2020-2025)
7.19.5 AOI Key News & Latest Developments
7.20 Fujitsu
7.20.1 Fujitsu Corporate Summary
7.20.2 Fujitsu Business Overview
7.20.3 Fujitsu Optical Module Package Major Product Offerings
7.20.4 Fujitsu Optical Module Package Revenue in Global Market (2020-2025)
7.20.5 Fujitsu Key News & Latest Developments
7.21 CIGTECH
7.21.1 CIGTECH Corporate Summary
7.21.2 CIGTECH Business Overview
7.21.3 CIGTECH Optical Module Package Major Product Offerings
7.21.4 CIGTECH Optical Module Package Revenue in Global Market (2020-2025)
7.21.5 CIGTECH Key News & Latest Developments
7.22 Broadex Technologies
7.22.1 Broadex Technologies Corporate Summary
7.22.2 Broadex Technologies Business Overview
7.22.3 Broadex Technologies Optical Module Package Major Product Offerings
7.22.4 Broadex Technologies Optical Module Package Revenue in Global Market (2020-2025)
7.22.5 Broadex Technologies Key News & Latest Developments
7.23 Guangdong Unionman
7.23.1 Guangdong Unionman Corporate Summary
7.23.2 Guangdong Unionman Business Overview
7.23.3 Guangdong Unionman Optical Module Package Major Product Offerings
7.23.4 Guangdong Unionman Optical Module Package Revenue in Global Market (2020-2025)
7.23.5 Guangdong Unionman Key News & Latest Developments
8 Conclusion
9 Appendix
9.1 Note
9.2 Examples of Clients
9.3 DisclaimerList of Tables
Table 1. Optical Module Package Market Opportunities & Trends in Global Market
Table 2. Optical Module Package Market Drivers in Global Market
Table 3. Optical Module Package Market Restraints in Global Market
Table 4. Key Players of Optical Module Package in Global Market
Table 5. Top Optical Module Package Players in Global Market, Ranking by Revenue (2024)
Table 6. Global Optical Module Package Revenue by Companies, (US$, Mn), 2020-2025
Table 7. Global Optical Module Package Revenue Share by Companies, 2020-2025
Table 8. Global Companies Optical Module Package Product Type
Table 9. List of Global Tier 1 Optical Module Package Companies, Revenue (US$, Mn) in 2024 and Market Share
Table 10. List of Global Tier 2 and Tier 3 Optical Module Package Companies, Revenue (US$, Mn) in 2024 and Market Share
Table 11. Segmentation by Type – Global Optical Module Package Revenue, (US$, Mn), 2024 & 2032
Table 12. Segmentation by Type – Global Optical Module Package Revenue (US$, Mn), 2020-2025
Table 13. Segmentation by Type – Global Optical Module Package Revenue (US$, Mn), 2026-2032
Table 14. Segmentation by Application– Global Optical Module Package Revenue, (US$, Mn), 2024 & 2032
Table 15. Segmentation by Application – Global Optical Module Package Revenue, (US$, Mn), 2020-2025
Table 16. Segmentation by Application – Global Optical Module Package Revenue, (US$, Mn), 2026-2032
Table 17. By Region– Global Optical Module Package Revenue, (US$, Mn), 2024 & 2032
Table 18. By Region – Global Optical Module Package Revenue, (US$, Mn), 2020-2025
Table 19. By Region – Global Optical Module Package Revenue, (US$, Mn), 2026-2032
Table 20. By Country – North America Optical Module Package Revenue, (US$, Mn), 2020-2025
Table 21. By Country – North America Optical Module Package Revenue, (US$, Mn), 2026-2032
Table 22. By Country – Europe Optical Module Package Revenue, (US$, Mn), 2020-2025
Table 23. By Country – Europe Optical Module Package Revenue, (US$, Mn), 2026-2032
Table 24. By Region – Asia Optical Module Package Revenue, (US$, Mn), 2020-2025
Table 25. By Region – Asia Optical Module Package Revenue, (US$, Mn), 2026-2032
Table 26. By Country – South America Optical Module Package Revenue, (US$, Mn), 2020-2025
Table 27. By Country – South America Optical Module Package Revenue, (US$, Mn), 2026-2032
Table 28. By Country – Middle East & Africa Optical Module Package Revenue, (US$, Mn), 2020-2025
Table 29. By Country – Middle East & Africa Optical Module Package Revenue, (US$, Mn), 2026-2032
Table 30. Coherent Corporate Summary
Table 31. Coherent Optical Module Package Product Offerings
Table 32. Coherent Optical Module Package Revenue (US$, Mn) & (2020-2025)
Table 33. Coherent Key News & Latest Developments
Table 34. InnoLight Corporate Summary
Table 35. InnoLight Optical Module Package Product Offerings
Table 36. InnoLight Optical Module Package Revenue (US$, Mn) & (2020-2025)
Table 37. InnoLight Key News & Latest Developments
Table 38. Cisco Corporate Summary
Table 39. Cisco Optical Module Package Product Offerings
Table 40. Cisco Optical Module Package Revenue (US$, Mn) & (2020-2025)
Table 41. Cisco Key News & Latest Developments
Table 42. Huawei Corporate Summary
Table 43. Huawei Optical Module Package Product Offerings
Table 44. Huawei Optical Module Package Revenue (US$, Mn) & (2020-2025)
Table 45. Huawei Key News & Latest Developments
Table 46. Accelink Corporate Summary
Table 47. Accelink Optical Module Package Product Offerings
Table 48. Accelink Optical Module Package Revenue (US$, Mn) & (2020-2025)
Table 49. Accelink Key News & Latest Developments
Table 50. Hisense Corporate Summary
Table 51. Hisense Optical Module Package Product Offerings
Table 52. Hisense Optical Module Package Revenue (US$, Mn) & (2020-2025)
Table 53. Hisense Key News & Latest Developments
Table 54. Eoptolink Corporate Summary
Table 55. Eoptolink Optical Module Package Product Offerings
Table 56. Eoptolink Optical Module Package Revenue (US$, Mn) & (2020-2025)
Table 57. Eoptolink Key News & Latest Developments
Table 58. HGG Corporate Summary
Table 59. HGG Optical Module Package Product Offerings
Table 60. HGG Optical Module Package Revenue (US$, Mn) & (2020-2025)
Table 61. HGG Key News & Latest Developments
Table 62. Intel Corporate Summary
Table 63. Intel Optical Module Package Product Offerings
Table 64. Intel Optical Module Package Revenue (US$, Mn) & (2020-2025)
Table 65. Intel Key News & Latest Developments
Table 66. Source Photonics Corporate Summary
Table 67. Source Photonics Optical Module Package Product Offerings
Table 68. Source Photonics Optical Module Package Revenue (US$, Mn) & (2020-2025)
Table 69. Source Photonics Key News & Latest Developments
Table 70. Kyocera Corporate Summary
Table 71. Kyocera Optical Module Package Product Offerings
Table 72. Kyocera Optical Module Package Revenue (US$, Mn) & (2020-2025)
Table 73. Kyocera Key News & Latest Developments
Table 74. Broadcom Corporate Summary
Table 75. Broadcom Optical Module Package Product Offerings
Table 76. Broadcom Optical Module Package Revenue (US$, Mn) & (2020-2025)
Table 77. Broadcom Key News & Latest Developments
Table 78. Sumitomo Electric Industries Corporate Summary
Table 79. Sumitomo Electric Industries Optical Module Package Product Offerings
Table 80. Sumitomo Electric Industries Optical Module Package Revenue (US$, Mn) & (2020-2025)
Table 81. Sumitomo Electric Industries Key News & Latest Developments
Table 82. Gigalight Corporate Summary
Table 83. Gigalight Optical Module Package Product Offerings
Table 84. Gigalight Optical Module Package Revenue (US$, Mn) & (2020-2025)
Table 85. Gigalight Key News & Latest Developments
Table 86. ATOP Technology Corporate Summary
Table 87. ATOP Technology Optical Module Package Product Offerings
Table 88. ATOP Technology Optical Module Package Revenue (US$, Mn) & (2020-2025)
Table 89. ATOP Technology Key News & Latest Developments
Table 90. FIBERSTAMP Corporate Summary
Table 91. FIBERSTAMP Optical Module Package Product Offerings
Table 92. FIBERSTAMP Optical Module Package Revenue (US$, Mn) & (2020-2025)
Table 93. FIBERSTAMP Key News & Latest Developments
Table 94. FOIT Corporate Summary
Table 95. FOIT Optical Module Package Product Offerings
Table 96. FOIT Optical Module Package Revenue (US$, Mn) & (2020-2025)
Table 97. FOIT Key News & Latest Developments
Table 98. Lumentum Corporate Summary
Table 99. Lumentum Optical Module Package Product Offerings
Table 100. Lumentum Optical Module Package Revenue (US$, Mn) & (2020-2025)
Table 101. Lumentum Key News & Latest Developments
Table 102. AOI Corporate Summary
Table 103. AOI Optical Module Package Product Offerings
Table 104. AOI Optical Module Package Revenue (US$, Mn) & (2020-2025)
Table 105. AOI Key News & Latest Developments
Table 106. Fujitsu Corporate Summary
Table 107. Fujitsu Optical Module Package Product Offerings
Table 108. Fujitsu Optical Module Package Revenue (US$, Mn) & (2020-2025)
Table 109. Fujitsu Key News & Latest Developments
Table 110. CIGTECH Corporate Summary
Table 111. CIGTECH Optical Module Package Product Offerings
Table 112. CIGTECH Optical Module Package Revenue (US$, Mn) & (2020-2025)
Table 113. CIGTECH Key News & Latest Developments
Table 114. Broadex Technologies Corporate Summary
Table 115. Broadex Technologies Optical Module Package Product Offerings
Table 116. Broadex Technologies Optical Module Package Revenue (US$, Mn) & (2020-2025)
Table 117. Broadex Technologies Key News & Latest Developments
Table 118. Guangdong Unionman Corporate Summary
Table 119. Guangdong Unionman Optical Module Package Product Offerings
Table 120. Guangdong Unionman Optical Module Package Revenue (US$, Mn) & (2020-2025)
Table 121. Guangdong Unionman Key News & Latest Developments

List of Figures
Figure 1. Optical Module Package Product Picture
Figure 2. Optical Module Package Segment by Type in 2024
Figure 3. Optical Module Package Segment by Application in 2024
Figure 4. Global Optical Module Package Market Overview: 2024
Figure 5. Key Caveats
Figure 6. Global Optical Module Package Market Size: 2024 VS 2032 (US$, Mn)
Figure 7. Global Optical Module Package Revenue: 2020-2032 (US$, Mn)
Figure 8. The Top 3 and 5 Players Market Share by Optical Module Package Revenue in 2024
Figure 9. Segmentation by Type – Global Optical Module Package Revenue, (US$, Mn), 2024 & 2032
Figure 10. Segmentation by Type – Global Optical Module Package Revenue Market Share, 2020-2032
Figure 11. Segmentation by Application – Global Optical Module Package Revenue, (US$, Mn), 2024 & 2032
Figure 12. Segmentation by Application – Global Optical Module Package Revenue Market Share, 2020-2032
Figure 13. By Region – Global Optical Module Package Revenue Market Share, 2020-2032
Figure 14. By Country – North America Optical Module Package Revenue Market Share, 2020-2032
Figure 15. United States Optical Module Package Revenue, (US$, Mn), 2020-2032
Figure 16. Canada Optical Module Package Revenue, (US$, Mn), 2020-2032
Figure 17. Mexico Optical Module Package Revenue, (US$, Mn), 2020-2032
Figure 18. By Country – Europe Optical Module Package Revenue Market Share, 2020-2032
Figure 19. Germany Optical Module Package Revenue, (US$, Mn), 2020-2032
Figure 20. France Optical Module Package Revenue, (US$, Mn), 2020-2032
Figure 21. U.K. Optical Module Package Revenue, (US$, Mn), 2020-2032
Figure 22. Italy Optical Module Package Revenue, (US$, Mn), 2020-2032
Figure 23. Russia Optical Module Package Revenue, (US$, Mn), 2020-2032
Figure 24. Nordic Countries Optical Module Package Revenue, (US$, Mn), 2020-2032
Figure 25. Benelux Optical Module Package Revenue, (US$, Mn), 2020-2032
Figure 26. By Region – Asia Optical Module Package Revenue Market Share, 2020-2032
Figure 27. China Optical Module Package Revenue, (US$, Mn), 2020-2032
Figure 28. Japan Optical Module Package Revenue, (US$, Mn), 2020-2032
Figure 29. South Korea Optical Module Package Revenue, (US$, Mn), 2020-2032
Figure 30. Southeast Asia Optical Module Package Revenue, (US$, Mn), 2020-2032
Figure 31. India Optical Module Package Revenue, (US$, Mn), 2020-2032
Figure 32. By Country – South America Optical Module Package Revenue Market Share, 2020-2032
Figure 33. Brazil Optical Module Package Revenue, (US$, Mn), 2020-2032
Figure 34. Argentina Optical Module Package Revenue, (US$, Mn), 2020-2032
Figure 35. By Country – Middle East & Africa Optical Module Package Revenue Market Share, 2020-2032
Figure 36. Turkey Optical Module Package Revenue, (US$, Mn), 2020-2032
Figure 37. Israel Optical Module Package Revenue, (US$, Mn), 2020-2032
Figure 38. Saudi Arabia Optical Module Package Revenue, (US$, Mn), 2020-2032
Figure 39. UAE Optical Module Package Revenue, (US$, Mn), 2020-2032
Figure 40. Coherent Optical Module Package Revenue Year Over Year Growth (US$, Mn) & (2020-2025)
Figure 41. InnoLight Optical Module Package Revenue Year Over Year Growth (US$, Mn) & (2020-2025)
Figure 42. Cisco Optical Module Package Revenue Year Over Year Growth (US$, Mn) & (2020-2025)
Figure 43. Huawei Optical Module Package Revenue Year Over Year Growth (US$, Mn) & (2020-2025)
Figure 44. Accelink Optical Module Package Revenue Year Over Year Growth (US$, Mn) & (2020-2025)
Figure 45. Hisense Optical Module Package Revenue Year Over Year Growth (US$, Mn) & (2020-2025)
Figure 46. Eoptolink Optical Module Package Revenue Year Over Year Growth (US$, Mn) & (2020-2025)
Figure 47. HGG Optical Module Package Revenue Year Over Year Growth (US$, Mn) & (2020-2025)
Figure 48. Intel Optical Module Package Revenue Year Over Year Growth (US$, Mn) & (2020-2025)
Figure 49. Source Photonics Optical Module Package Revenue Year Over Year Growth (US$, Mn) & (2020-2025)
Figure 50. Kyocera Optical Module Package Revenue Year Over Year Growth (US$, Mn) & (2020-2025)
Figure 51. Broadcom Optical Module Package Revenue Year Over Year Growth (US$, Mn) & (2020-2025)
Figure 52. Sumitomo Electric Industries Optical Module Package Revenue Year Over Year Growth (US$, Mn) & (2020-2025)
Figure 53. Gigalight Optical Module Package Revenue Year Over Year Growth (US$, Mn) & (2020-2025)
Figure 54. ATOP Technology Optical Module Package Revenue Year Over Year Growth (US$, Mn) & (2020-2025)
Figure 55. FIBERSTAMP Optical Module Package Revenue Year Over Year Growth (US$, Mn) & (2020-2025)
Figure 56. FOIT Optical Module Package Revenue Year Over Year Growth (US$, Mn) & (2020-2025)
Figure 57. Lumentum Optical Module Package Revenue Year Over Year Growth (US$, Mn) & (2020-2025)
Figure 58. AOI Optical Module Package Revenue Year Over Year Growth (US$, Mn) & (2020-2025)
Figure 59. Fujitsu Optical Module Package Revenue Year Over Year Growth (US$, Mn) & (2020-2025)
Figure 60. CIGTECH Optical Module Package Revenue Year Over Year Growth (US$, Mn) & (2020-2025)
Figure 61. Broadex Technologies Optical Module Package Revenue Year Over Year Growth (US$, Mn) & (2020-2025)
Figure 62. Guangdong Unionman Optical Module Package Revenue Year Over Year Growth (US$, Mn) & (2020-2025)

